what are they for? the mysterious crocodylid integumentary ... · the mysterious crocodylid...
TRANSCRIPT
394
Anatomical Correlates Associated with the Bracing System of ExtantCrocodilians: addressing the Locomotor Inadequacies of the Indian Gharial
Steven W. Salisbury1 and Eberhard Frey2
1School of Life Sciences, The University of Queensland, Brisbane, QLD 4072, Australia([email protected]); 2Staatliches Museum für Naturkunde Karlsruhe, Erbprinzenstrasse 13,
D-76133 Karlsruhe, Germany ([email protected])
All extant crocodilians brace their bodies against mechanical loading and during movement in a similar manner. Thistype of bracing mechanism is referred to as the ‘eusuchian-type bracing system’. Differences in the configuration ofthe paravertebral shield and the length of the lateral epaxial muscles in the cranial half of the tail between Gavialisgangeticus and other extant crocodilians correlate with the former’s apparent inability to high-walk at large sizes (>approx. 50 kg). These characteristics probably also preclude any capacity for galloping. A further correlation existsbetween: the configuration of the dorsal cervical muscles; the equivalence in height of the neural arches on thevertebrae in the trunk; tail base and caudal-most portion of the neck; the continuity between the nuchal and dorsalosteoderms in Gavialis gangeticus; and the inability of large, adult individuals of this species to flex the head ventrallyagainst the neck to the degree observed in other taxa.
These differences mean that the operational repertoire associated with the bracing system of G. gangeticus is lessdiverse than that of other extant crocodilians. For this reason, it is proposed that two distinct forms should be recognisedwithin the eusuchian-type bracing system: the Gavialis-form and the Crocodylus/Alligator-form.
The Mysterious Crocodylid Integumentary Sense Organs:What Are They For?
Kate Jackson
In all crocodylids and gavialids, a single dark dot is present on each of the ventral scales. Alligatorids lack thisstructure. Morphological study has shown this structure to be a sensory organ, similar in morphology to themechanosensory “touch papillae” that are present on the facial scales of all crocodilians. Here I describe experimentscompleted and experiments in progress to test the possible function of these integumentary sense organs (ISOs). Inparticular I explore the possibility that they may be osmoreceptors, used for distinguishing hyperosmotic seawaterfrom fresh water, similar to many other anatomical and physiological specialisations that make crocodylids betterable to tolerate estuarine conditions than alligatorids.
395
Status of the American Alligator (Alligator mississippiensis) in Southern Florida,USA and its Role in Measuring Restoration Success in the Everglades
Kenneth G. Rice1, Frank J. Mazzotti2 and Laura A. Brandt3
1United States Geological Survey, Center for Water and Restoration Studies, University of FloridaField Station, 3205 College Ave., Fort Lauderdale, Florida 33314, USA (ken g [email protected]);
2University of Florida Fort Lauderdale Research and Education Center, 3205 College Ave.,Fort Lauderdale, Florida 33314, USA ([email protected]);
3U.S. Fish and Wildlife Service, Arthur R. Marshall Loxahatchee National Wildlife Refuge, 10216 LeeRoad, Boynton Beach, Florida 33437, USA ([email protected])
Abstract
The American alligator (Alligator mississippiensis) was abundant throughout the pre-drainage Everglades of SouthernFlorida, USA. Development and water management practices have reduced the spatial extent and changed thehydropatterns of these habitats. As a result of these activities, alligator populations have decreased. Currently, restorationof hydrologic pattern and ecological function is beginning in the Everglades. Due to the alligator’s ecologicalimportance and sensitivity to hydrology, salinity, habitat and system productivity, the species was chosen as anindicator of restoration success. A number of biological attributes (relative density, relative body condition, nestingeffort, and nesting success) can be measured, standard methods for monitoring have been developed, and historicalinformation exists for alligator populations in the Everglades. These attributes can be used as success criteria atdifferent spatial and temporal scales and to construct ecological models used for predicting restoration effects.
Introduction
The American alligator once occupied all wetland habitats in south Florida, from sinkholes and ponds in pinelands tomangrove estuaries during periods of freshwater discharge (Craighead 1968; Simmons and Ogden 1998). Developmentand water management practices have reduced the spatial extent and changed the hydropatterns of these habitats(Fig. 1; Mazzotti and Brandt 1994). Less freshwater moves through the tributaries into the mangrove zone resultingin higher salinities and the filling in of creeks (Craighead 1971). In the marl prairies, the historic 6-9 month hydroperiodhas been replaced by a hydroperiod of 3 months or less. In addition, water levels may drop 2 feet below the groundsurface during the dry season. Because of these habitat changes, alligators are now less numerous in these habitats(Mazzotti and Brandt 1994).
Abundance, distribution, nesting success, and condition of the species are all expected to change in response toplanned restoration of the Everglades. Alligator relative abundance is expected to increase as hydrologic conditionsimprove in overdrained marshes and freshwater tributaries. As canals are removed, densities of alligators in adjacentmarshes and occupancy of alligator holes is expected to increase. As hydroperiods and depths approach more naturalpatterns, alligator nesting success, growth, and condition are all expected to increase in areas where they are currentlylower than historic values.
In south Florida alone there are over 1000 miles of canals and nearly 700 miles of levees. These structures, initiatedin the late 1800s, were initially designed to drain the Everglades and make it “usable.” Later they became importantfor flood control and now they serve a third purpose of delivering water to urban and agricultural areas. During the1970s and 1980s concern was raised that this extensive network of canals was having a negative impact on theenvironment and that the Everglades was, in fact, dying (Mazzotti 1999). In 1992, Congress authorized a study toreevaluate the network of canals and develop a plan to restore the hydrology of the Everglades. The result was a 7.8billion dollar plan, the Comprehensive Everglades Restoration Plan (CERP; US Army Corps of Engineers 1999),that includes over 68 projects ranging from removing canals to creating alternative water storage areas both aboveand below ground. The goals of the plan include increasing the spatial extent of natural areas, enhancing the quality

396
of existing natural areas, and improving the abundance and diversity of native plants and animals (US Army Corps ofEngineers 1999).
In addition to their economic and ecological importance, the American alligator was selected as an indicator ofrestoration success because it is sensitive to hydrology, salinity, habitat and system productivity, all factors that areexpected to change with the completion of CERP. In addition, there are a number of biological attributes that can beused as success criteria at different spatial and temporal scales, and there are standard methods for monitoring ofalligators and their nests. Also, existing data for population densities, alligator condition and nesting ecology in someareas can provide baseline data for assessing changes and developing modeling tools (Jacobsen and Kushlan 1989;Kushlan and Jacobsen 1990; Dalrymple 1996a, 1996b; Barr 1997).
Several restoration performance measures (or targets) for the South Florida alligator population have been identified,including relative abundance, occupancy rates of alligator holes, nest success, and body condition. In the followingdiscussion, we will outline the baseline conditions of the above restoration performance measures and suggest therole of monitoring alligator success during Everglades restoration.
Abundance and Distribution
Although we will never know accurately past numbers of alligators in the Everglades, the pattern of populationchanges is clear. Alligators were very abundant at the turn of the century. Hunting and wetland drainage causedalligator populations to decline through the 1930s. Coincident with statewide controls on alligator harvests, populations
Figure 1. Map of the historical habitats of the Everglades of South Florida, USA.

397
began to increase in to the 1950s, only to crash dramatically in the 1960s. Some poaching was occurring at this timebut water management was the primary reason for this second decline.
Changes in land use and land cover resulting from water management also have affected alligator populations. Somelocations that were alligator habitat have been converted to agricultural and residential development (Simmons andOgden 1998). Other locations have not been developed, but are so over-drained that alligators only occur in permanentwater bodies such as canals or ponds, or during periods of extremely high water. As Everglades restoration targetsrestoring the hydrology of these habitats, the reoccurrence of alligators in those areas will be an excellent indicator ofsuccess.
Salinity is a limiting factor for the distribution and abundance of reptiles in estuaries (Dunson and Mazzotti 1989).Freshwater flow into estuaries directly affects the location of alligators, as most alligators are found in areas oflowest salinity (Mazzotti 1983). The relationship of seasonal freshwater flow to the distribution and abundance ofalligators in Everglades estuaries was noted by Craighead (1968), Brown (1993) and Simmons and Ogden (1998).Restoring a productive freshwater (oligohaline) zone with alligators of all size classes to Everglades estuaries wouldbe a sign of successful restoration.
Alligator Holes
The Everglades alligator is an ecosystem engineer that physically influences the floral and faunal characteristics ofthe Everglades landscape through the construction and maintenance of small ponds (alligator holes) and associatedunderground caves (Craighead 1968). Alligator holes are excavated from the muck and peat that make up the Evergladessoil, often down to the limestone bed. These depressions provide an aquatic refuge for alligators and other aquaticorganisms, nest sites for other reptiles, and colonization sites for plants during frequent drying events in the Everglades(Craighead 1968; Kushlan 1972; Kushlan 1974; Loftus and Eklund 1994). Prior to drainage, alligators and alligatorholes were abundant in the Everglades. Alligator hole occupancy was believed to be close to 100%, sometimes withseveral alligators occupying one hole (often a female with young).
Many holes were filled in with the development of areas to the east of Everglades National Park (Simmons andOgden 1998). Those that were not destroyed experienced altered hydroperiods as a result of drainage. As early as the1920s and 1930s, alligator hunters noted the drying out of alligator holes within some habitats. Occupancy of alligatorholes in these fringe habitats is believed to have continued to decrease with continued hydrologic alterations that leadto the drying of alligator holes, especially in drought years (Craighead 1968).
The distribution and occupancy of alligator holes has been identified as a performance measure for restoration. Asimportant as aquatic refugia are imagined to be, their ecology has remained an almost completely unstudied phenomena.This gap in information is becoming critical for making ecosystem restoration decisions.
Nesting
Current water management practices have resulted in a high and unpredictable rate of alligator nest flooding.Historically, maximum summer (nesting season) water levels were correlated with water levels in early summerwhen alligators were nesting. Alligators used the early summer water levels to determine nest placement and eggcavity height. In many areas, this natural predictability has been lost (Kushlan and Jacobsen 1990) and has resultedin mortality of eggs due to flooding.
While the historical record of alligator nest monitoring is not as extensive as that for population density or alligatorhole occupancy rates, we do have information that flooding rates have increased due to water management practices(Kushlan and Jacobsen 1990) and that nest densities are extremely low in overdrained wetlands (Fleming 1991).Modified hydrologic conditions during restoration might be expected to decrease losses due to flooding, stabilizenesting effort in the long hydroperiod wetlands, and increase nesting effort and success of alligators in theaforementioned edge habitats. However, expansion of current monitoring is essential for assessment of restorationsuccess.
Body Condition
The Everglades is a naturally oligotrophic system. Alligators in Everglades National Park weigh less than alligatorsof the same length from other parts of their range (Jacobsen and Kushlan 1989; Dalrymple 1996a; Barr 1997), do not
398
get as large, and take longer to reach sexual maturity (Kushlan and Jacobsen 1990; Dalrymple 1996a). Changes inhydropatterns further contribute to the harshness of the south Florida environment. Jacobsen and Kushlan’s (1989)model for growth in the Everglades of southern Florida predicted that alligators would reach a mere 1.26 metres in 10years and requiring at least 18 years to reach sexual maturity. Dalrymple (1996b) analyzed the length to weightrelationship of alligators in Shark Slough, Everglades National Park using a condition factor analysis and found thatthe Shark Slough alligators showed a slight reduction in mass as length increased. In addition, alligators tended to bein better condition during the dry months when food was concentrated and more available. Barr (1997) used a similaranalysis on alligators in another portion of Shark Slough in ENP and showed that in very wet dry seasons alligatorsdo not show this increase in condition, further supporting the influence that hydrology has on alligator condition.Our more recent analysis of alligator condition throughout the Everglades suggests that Everglades alligators exhibitlower body condition than populations in South Carolina and north Florida (Zweig 2002). It is currently suspectedthat the reason for this poor condition is a combination of low food availability due to hydrologic factors and highmetabolic costs due to warm temperatures (Jacobsen and Kushlan 1989; Mazzotti and Brandt 1994; Dalrymple1996a; Barr 1997; Percival et al. 2000).
Measures of body condition can provide a measure of restoration success through an examination of alligatorsthroughout their range in the Everglades. Condition has been linked to reproductive success and long-term survivalof alligators. Further, condition can be viewed as a measure of the quality and accessibility of prey species andprovide a linkage to lower trophic levels and their success during restoration. Monitoring of condition in both newlyrestored habitats and in existing population centers is critical to an understanding of the effects of restoration.
Modeling
Everglades hydrologic patterns that result from the distribution, volume, and timing of water flow are major drivingforces controlling the trophic dynamics of these systems. Hydrologic restoration alternatives are now being developedand proposed in response to the many decades of adverse water management practices that have impacted theEverglades with altered and intense drought and flooding events. Predicting and comparing the future effects ofalternative hydrologic restoration scenarios on the biotic components of these systems is necessary. These forecastscan be accomplished only by ecological modeling. Several modeling efforts are underway including ATLSS (Across-Trophic Level System Simulation, 1999), Wildlife Suitability Indices and hydrology (SFWMD), and several otherspredicting hydrologic measures, water quality, and vegetation responses to restoration. Through the development ofalligator population simulation models (see www.atlss.org) based on empirical data, we can evaluate restorationalternatives and assess restoration performance measures. By applying these models, we can provide information formaking decisions on those alternatives that result in biotic characteristics that approximate historical conditions.
Conclusions
Future work on alligators in the Greater Everglades Ecosystem should focus on addressing the uncertainties identifiedwhile developing the components for the ecological models. Included in those are questions related to breedingfemale size, juvenile dispersal, and spatial and temporal variation in alligator distribution and abundance throughoutthe Everglades. Until recently, the only monitoring of alligators in Everglades National Park has been surveys fornests. Nesting surveys and limited nightlight surveys also have been conducted by the Florida Fish and WildlifeConservation Commission in and near canals in the central Everglades as part of their public hunt and ranchingprograms. Though nest surveys provide important information and should be continued, it is not expected that changesin nesting in response to restoration will be measurable for 10 years, the time necessary for dispersing juveniles tobecome nesting animals. Evaluating the relative distribution, abundance, and demography of alligators using nightlight counts and condition analysis allows for a more rapid assessment of the impacts of CERP projects on targetsystems. We have recently begun developing an alligator survey network to collect the baseline population anddemographic information necessary to evaluate restoration success on a 3 to 5 year time frame.
In this discussion, we have summarized what we know about alligators in the Greater Everglades Ecosystem. Baselinedata are needed now to provide post restoration feedback to the policy making process. Using a combination ofhistoric data and implementation of new monitoring programs, we will be better able to follow how alligators respondto restoration efforts. Night light surveys are a well-established, cost effective method for gathering the requiredinformation on abundance, distribution, and size class distribution (Bayliss 1987; Woodward and Moore 1990).Alligator hole distribution, densities, and occupancy rates have been monitored using a combination of mapping andsurvey (Mazzotti et al. 1999). Aerial nesting surveys have been used widely to monitor nest densities and distribution(Rice et al. 1999). Body condition indices have been used to monitor alligator population in several studies, and

399
methods for more accurate comparisons between and among populations are being developed (Barr 1997; Dalrymple1996a, 1996b; Rice et al. 2001). Ecological models used in evaluating restoration alternatives are constantly beingrefined and developed (ATLSS 1999). The methods required to monitor and predict alligator population responses torestoration of the Everglades exist, and in many cases are in place. Careful development of a monitoring and modelingprogram for an indicator of restoration success, such as the alligator, will insure that uncertainties and surprises aboutthe system are incorporated during the adaptive process of Everglades restoration.
Literature
ATLSS in United States Army Corps of Engineers (1999). Central and Southern Florida Project ComprehensiveReview Study (CD Version).
Barr, B. (1997). Food Habits of the American alligator, Alligator mississippiensis, in the southern Everglades.Unpublished PhD Thesis, University of Miami, Florida.
Bayliss, P. (1987). Survey methods and monitoring within crocodile management programmes. Pp. 157-175 in WildlifeManagement: Crocodiles and Alligators, ed. by G.J.W. Webb, S.C. Manolis, and P.J. Whitehead. Surrey Beattyand Sons: Chipping Norton.
Brown, L.G. (1993). Totch: A Life in the Everglades. University Press of Florida: Gainesville.
Craighead, F.C., Sr. (1968). The role of the alligator in shaping plant communities and maintaining wildlife in theSouthern Everglades. Florida Naturalist. 41: 2-7, 69-74, 94.
Craighead, F.C. Sr. (1971). The Trees of South Florida: The Natural Environments and Their Succession. Universityof Miami Press: Miami.
Dalrymple, G.H. (1996a). Growth of American Alligators in the Shark Valley Region of Everglades National Park.Copeia 1996(1): 212-216.
Dalrymple, G.H. (1996b). The effect of prolonged high water levels in 1995 on the American alligator in the SharkValley area of Everglades National Park. Pp. 125-136 in Proc. Conf. Ecological Assessment of the 1994-1995High Water Conditions in the Southern Everglades. USNPS, SFNRC: Homestead, Florida.
Dunson, W.A. and Mazzotti, F.J. (1989). Salinity as a limiting factor in the distribution of reptiles in Florida Bay: atheory for the estuarine origin of marine snakes and turtles. Bulletin of Marine Science 44: 229-244.
Fleming, D.M. (1991). Wildlife Ecology Studies. Annual Report. USNPS, SFNRC: Homestead, Florida. 51 pp.
Jacobsen, T. and Kushlan, J.A. (1989). Growth dynamics in the American alligator (Alligator mississippiensis). J.Zool., Lond. 219(2): 309-328.
Kushlan, J.A. (1972). An ecological study of an alligator pond in the Big Cypress Swamp of southern Florida. MSThesis, University of Miami, Miami, Florida.
Kushlan, J.A. (1974). Observations of the role of the American alligator in the southern Florida wetlands. Copeia1974: 993-996.
Kushlan, J.A. and Jacobsen, T. (1990). Environmental variability and the reproductive success of Everglades alligators.J. Herpetol. 24(2): 176-184.
Loftus, W.F. and Eklund., A.M. (1994). Long-term dynamics of an Everglades small fish assemblage. Pp. 461-483 inEverglades: the Ecosystem and its Restoration, ed. by S.M. Davis and J.C. Ogden. St. Lucie Press: DelrayBeach, Florida.
Mazzotti, F.J. (1983). The ecology of Crocodylus acutus in Florida. PhD Thesis, Pennsylvania State University, StateCollege, Pennsylvania. 162 pp.
400
Mazzotti, F.J. (1999). Everglades - South Florida Assessments, Science Review. Pp. 187-191 in BioregionalAssessments: Science at the Crossroads of Management and Policy, ed. by K.N. Johnson, F. Swanson, M. Herringand S. Greene. Island Press: Washington, D.C.
Mazzotti, F.J. and Brandt, L.A. (1994). Ecology of the American alligator in a seasonally fluctuating environment.Pp. 485-505 in Everglades: The Ecosystem and its Restoration, ed. by S. Davis and J. Ogden. St. Lucie Press:Delray Beach, Florida.
Mazzotti, F.J., Brandt, L.A., Campbell, M.R. and Palmer, M. (1999). An ecological characterization of Evergladesalligator holes. Final Annual Report. University of Florida, Belle Glade, Florida. 82 pp.
Percival, H.F., K.G. Rice, and Howarter, S.H. (2000). American alligator distribution, thermoregulation, and bioticpotential relative to hydroperiod in the Everglades. Fla. Coop. Fish and Wildl. Res. Unit, USGS Tech. Rep. 155pp.
Rice, K.G., Percival, H.F., Woodward, A.R. and Jennings, M.L. (1999). Effects of egg and hatchling harvest onAmerican alligators in Florida. J. Wildl. Manage. 63(4): 1193-1200.
Simmons, G. and Ogden, L. (1998). Gladesmen. University Press of Florida: Gainesville, FL.
US Army Corps of Engineers (1999). Final Integrated Feasibility Report and Programmatic Environmental ImpactStatement. Central and Southern Florida Project Comprehensive Review Study. U.S. Army Corps of Engineers.Jacksonville District.
Woodward, A.R. and Moore, C.T. (1990). Statewide alligator surveys. Florida Game and Fresh Water Fish CommissionFinal Report, Tallahassee, Florida, USA.
Zweig, C.L. 2002. Body condition index analysis for the American alligator (Alligator mississippiensis). MS Thesis.University of Florida, Gainesville, Florida. 49 pp.
401
Captive Breeding and Reproductive Biology of the Indian GharialGavialis gangeticus (Gmelin)
Harry V. Andrews and Nikhil Whitaker
Madras Crocodile Bank Trust/Centre for HerpetologyPost Bag- 4, Mamallapuram- 603 104, Tamil Nadu, S. India
Abstract
Gavialis gangeticus females attain sexual maturity when they are close to 3 m and males when they are 3.5 m andabove. The nesting season is during summer occurring between March and May and the maximum number of nestswere laid between the 16th to 20th April. Mean clutch size was 24.53 ± 12.32 (range 2-44) and percentage of fertileeggs within a clutch averaged 75.31 ± 32.6% (range 0-100). Egg length averaged 85.89 mm (range of means 69.85-111.7 mm), width averaged 55.32 mm (range 45.8-63.6) and weight averaged 155.81 g (range 86.9-230). Totalclutch weight averaged 3013.50 ± 1480.70 g (range 311.6-5640.0). Total clutch weight highly correlated with clutchsize than with mean egg weight. Significant variation in clutch size and percentage of viable eggs within a nest wasevident between nesting seasons in the 13 years of breeding. Age and clutch size were found to be highly correlatedand total clutch weight is strongly correlated with mean clutch size. As in all other crocodilian species G. gangeticushas temperature- dependent sex determination (TSD) and the TSD pattern is female-male-female. Fertile eggs incubatedat set constant temperatures from 29-31.5°C produced only females and at 32°C 89% were males. At 33 and 33.5°C,20% and 15% males were produced, respectively. Incubation period averaged 70 days for eggs incubated at 31°C,which was is 1.20 times higher than eggs from 29°C and 1.17 times longer than 33°C (Lang and Andrews 1994).
Introduction
Gavialis gangeticus is endemic to the Indian sub-continent, occurring in India and Nepal, with Pakistan, Bhutan andBangladesh having a few scattered individuals. Adults tend to inhabit slow flowing portions of large rivers at theirbends and confluences, while smaller animals prefer sheltered backwaters (Singh 1978; Whitaker and Basu 1982).The GOI/FAO/UNDP Indian Gharial Project saved this species from the brink of extinction, when in the early 1970sthey numbered less than a 100. Through major conservation efforts since 1974, the Indian gharial was brought backto safe numbers by the 1000s in several locations through out its range in India. Currently there are threats ofextinction to some of the populations due to pressures on habitats and inadequate recruitment within populations(Whitaker and Andrews 2003; Ross 2003).
Several authors have previously discussed some aspects on the breeding biology of this species (Biswas et al. 1977;Kimura 1978; Singh 1978; Bustard 1979; Bustard 1980 a; Bustard and Maharana 1981, 1982; Chowdury et al. 1983;Whitaker and Basu 1982; Rao 1988; Andrews 1989b; Rao and Singh 1993; Acharjyo et al. 1996; Hussain 1999).Bustard (1980 b), Basu and Bustard (1981) and Maharana and Bustard (1981) have discussed maternal care in thisspecies. Choudhury and Bustard (1983), Bustard and Maharana (1983) and Whitaker and Basu (1982) reported onthe ecology and growth of this species. Bustard and Singh (1977) presented formulae for estimating total length ofbasking gharial from scute length, while Singh and Bustard (1977) reported on locomotory behavior and spoorformation of the species. Whitaker and Andrews (1988) also r eported on the locomotion for this species.
In the present study we examine trends in Gavialis reproductive biology in captivity from 1989 to 2002, save for1997 in which no data was recorded. In addition to nest dynamics, ages at onset of sexual maturity, the age factorsinfluence on clutch size and fertility, and mating and egg laying season, ambient temperature’s effects relative to thesame, temperature- dependent sex determination and relationships between morphometrics of eggs and hatchlings.

402
Materials and Methods
The Madras Crocodile Bank Trust/Centre for Herpetology (MCBT) is a non-profit charitable Trust, and has beeninvolved in reptile breeding, conservation and research since its inception in 1976. MCBT is situated at 12º50’N,80º10’E, 45 km south of Chennai city, along the Bay of Bengal. The facility receives an annual average rainfall of 1.2m, occurring primarily during two seasons southwest monsoon (June-July) and the northeast monsoon (October-December). The annual mean temperature is 28°C and ranges from 20°C during December and January to 38°C inMay and June.
The Gavialis gangeticus breeding enclosure is located at the lower end of the facility and at almost 1.5 m above sealevel. Substratum of the enclosure is predominantly large grained sand, in addition to leaf litter. The enclosurecontains a natural aquifer, within which depth varies from 1.5 to 2.5 m seasonally. The enclosure is irregular, roughlyovoid-rectangular in shape, measuring 42 m in length and 25 m in width. The aquifer, measuring 30 m long and 8 mwide, is at the base of gradually sloping banks. The bank on the northern side of the enclosure is almost 4 m abovewater level and only the upper reaches of this bank is used as a colonial-nesting bank. The banks on all sides of theenclosure are landscaped with trees and screwpine. In addition to the gharial, the enclosure pond contains, fish andfreshwater turtle species comprising Melanochelys trijuga trijuga, Aspideretes gangeticus, Lissemys punctata andKachuga kachuga.
The study animals 10 females and three males were acquired between 1974 and 1982 and two juvenile females in1986. Of these a male at 1.3 m TBL and a female at 0.82 m TBL, originated from the wild, probably the lower easternreaches of the River Ganga in Uttar Pradesh. Eight females and two males hatched from wild eggs These eggsacquired from the Kukrail Breeding Centre had been collected from the Chambal River in Uttar Pradesh. Thesefemales on arrival were in the age group of 2-6 years, the two females in the two years age group measured 1.2 and1.3 m (TBL). The two females in the four and five year age group measured 1.45 and 2.47 m (TBL). The six largefemales in the six years age group measured 2.2-2.6 m and averaged 2.4 m (TBL). Two other captive-bred F1females were acquired in 1986 from Nandankanan Biological Park in Orissa and these measured a little over 1 m(TBL). These were housed in separate enclosures till 1991 and then were included with the rest of the breedinggroups. Upon arrival, animals were sexed, measured and designated individual code numbers by clipping a combinationof scutes on the single and double caudal whorls. Until March 1995 the entire breeding group were held in the studyenclosure. During March 1995, one of the males lost half of his upper jaw in male-male combat and was transferredto another enclosure. A second male died in June 1997 following capture, perhaps due to post-capture fatigue asdiscussed by Seymour et al. (1987). In January 1999 and December 1998 two females were transferred out of thestudy enclosure.
For the duration of the nesting season, G. gangeticus females were observed from 1900-0630 h. Eggs were collectedfrom nests within 0-3 days by marking the upper surface of the egg to maintain orientation throughout handling andincubation. Nest parameters recorded were distance from nest to edge of pond, height above pond, nest cavity widthand depth. Temperatures at different depths of each layer of eggs were also recorded. Measurements of animals wererecorded by marking off, with a long stick, the snout and tail tips in the sand while females and males basked. Theanimals were then chased away into the pond and two ends were measured with a tape measure.
In a lab each egg was assigned individual clutch and egg numbers and then candled against a light to determinefertility by the presence or absence of the sub-embryonic fluid as discussed by Webb and Manolis (1987). Eggs weremeasured to the nearest ± 0.1 mm length and width with KWD type dial vernier calipers, and weighed to the nearest± 0.1 g with an ACCULAB 226 digital weighing scale. Fertile eggs were either incubated in artificial nests buried inareas exposed or protected from sunlight (n= 26 nests), or incubated at various set constant temperatures (n= 20nests) as previously described by Lang et al. (1989) and Lang and Andrews (1994). Of the 49 nests laid between1989 and 2002 (1997 excluded), 44 of these (89.8%) have known laying dates and of 38 (77.6%) have known femaleIDs. Some nests that were not located at the time of nesting were ultimately discovered as females defended nestsites. In circumstances where oviposition date was unknown and a nest was discovered, band width of fertile eggswas recorded.
Egg incubation: Eggs were buried between 35-40 cm beneath the sand surface in an outdoor incubation facility,either as a whole clutch, or after halving the clutch in which case one half was exposed to sun and one half to shade.Temperature of each individual egg group was monitored with thermistor probes (YSI 400 series), digital thermometer,and the accuracy of absolute temperature measurements was 0.1ºC. Temperatures were recorded either two times aday, at 0800 and 1600 h, or three times a day at 0600, 1200 and 1700 h.

403
To demonstrate that incubation temperature determines sex, eggs were incubated in an insulated lab with an air-conditioner as discussed by Lang and Andrews (1994). The incubators were custom designed foam box incubatorsset at constant temperatures maintained within ± 0.1°C of the set. Eggs were assigned to different incubators atdifferent constant temperatures, mainly 29, 30, 31, 31. 5, 32, 33 and 33.5°C.
Hatchlings: Hatchlings that resulted from both artificial nests and constant temperature incubation trials were codedand measured within 24 hours of hatching. Measurements recorded were standard total body length (TBL), snout tovent (SVL) and weight (wt).
Results
Sexual maturity
At MCBT first nesting occurred when a 10-year-old female laid eggs during April 1989, this female was measuredon the following day, while she was basking and was 3.2 m TBL. Two other females nested during the same seasonand measured 2.8 and 3 m TBL (Andrews 1989 b). During the same season the three males were also measured andthey ranged from 3, 3.5 and 3.8 m TBL. During the 1989 breeding season courtship and mating was observed and,only the two largest males were observed courting and mating.
Trial nests and temporal distribution of nests within the egg laying season
In all years, the first indication that nesting was imminent was the tracks of females around the nesting area ( 20 m x10 m rough rectangle on the north bank) and by trial nests. Some females prior to nesting make trial nest holesprobably trying to find optimum nesting sites. Trial nests were made on the same night of actual oviposition and
0
1
2
3
4
5
6
7
8
1-5 Mar
11-15 Mar
21-25 Mar
1-5 Apr
11-15 Apr
21-25 Apr
1-5 May
11-15 May
21-25 May
Range of dates (within egg-laying season)
Nu
mb
er o
f n
ests
Figure 1. Spatial distribution of 44 G. gangeticus nests during 1989-2002.
403
To demonstrate that incubation temperature determines sex, eggs were incubated in an insulated lab with an air-conditioner as discussed by Lang and Andrews (1994). The incubators were custom designed foam box incubatorsset at constant temperatures maintained within ± 0.1°C of the set. Eggs were assigned to different incubators atdifferent constant temperatures, mainly 29, 30, 31, 31. 5, 32, 33 and 33.5°C.
Hatchlings: Hatchlings that resulted from both artificial nests and constant temperature incubation trials were codedand measured within 24 hours of hatching. Measurements recorded were standard total body length (TBL), snout tovent (SVL) and weight (wt).
Results
Sexual maturity
At MCBT first nesting occurred when a 10-year-old female laid eggs during April 1989, this female was measuredon the following day, while she was basking and was 3.2 m TBL. Two other females nested during the same seasonand measured 2.8 and 3 m TBL (Andrews 1989 b). During the same season the three males were also measured andthey ranged from 3, 3.5 and 3.8 m TBL. During the 1989 breeding season courtship and mating was observed and,only the two largest males were observed courting and mating.
Trial nests and temporal distribution of nests within the egg laying season
In all years, the first indication that nesting was imminent was the tracks of females around the nesting area ( 20 m x10 m rough rectangle on the north bank) and by trial nests. Some females prior to nesting make trial nest holesprobably trying to find optimum nesting sites. Trial nests were made on the same night of actual oviposition and
0
1
2
3
4
5
6
7
8
1-5 Mar
11-15 Mar
21-25 Mar
1-5 Apr
11-15 Apr
21-25 Apr
1-5 May
11-15 May
21-25 May
Range of dates (within egg-laying season)N
um
ber
of
nes
ts
Figure 1. Spatial distribution of 44 G. gangeticus nests during 1989-2002.
404
maximum number of days before oviposition was seven days. Depths of trial nests varied between 10 and 36 cm.Nesting dates for the 44 nests (89.8% of the total) for which egg laying dates were known ranged from 10th Marchto 7th May. The maximum numbers of nests (n= 7) were laid between the 16th to 20th April (Fig: 1).
Clutch size, fertility and egg characteristics
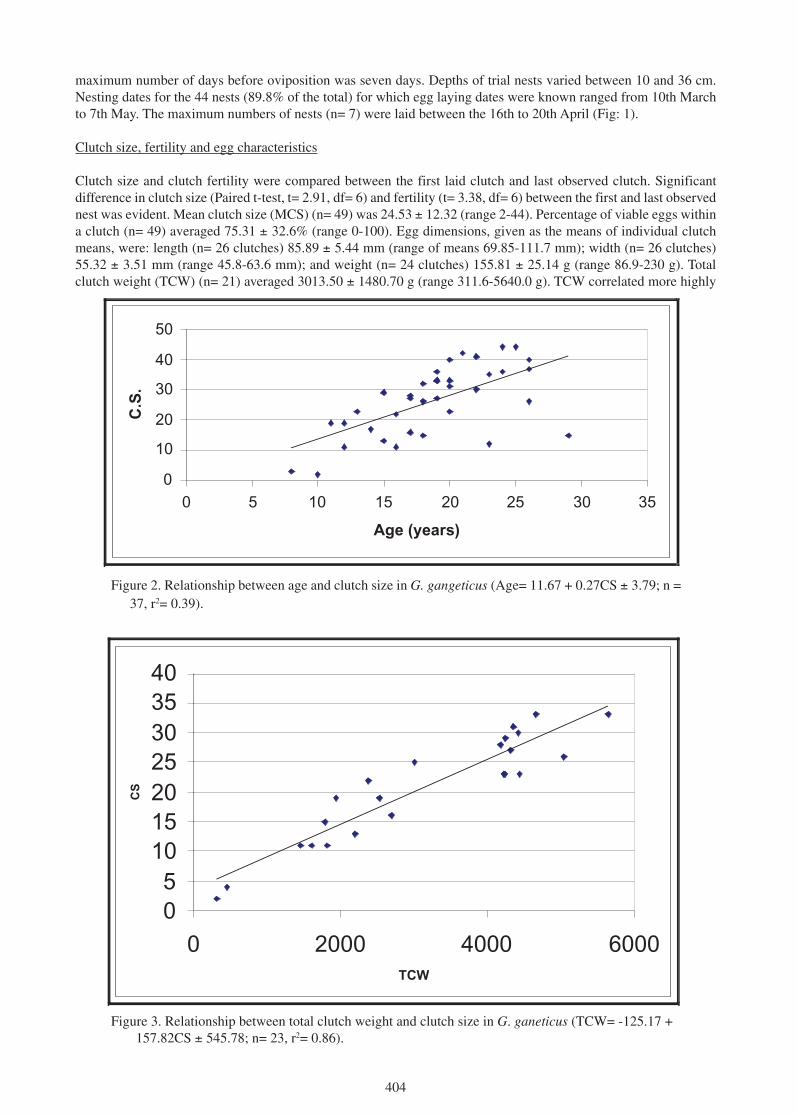
Clutch size and clutch fertility were compared between the first laid clutch and last observed clutch. Significantdifference in clutch size (Paired t-test, t= 2.91, df= 6) and fertility (t= 3.38, df= 6) between the first and last observednest was evident. Mean clutch size (MCS) (n= 49) was 24.53 ± 12.32 (range 2-44). Percentage of viable eggs withina clutch (n= 49) averaged 75.31 ± 32.6% (range 0-100). Egg dimensions, given as the means of individual clutchmeans, were: length (n= 26 clutches) 85.89 ± 5.44 mm (range of means 69.85-111.7 mm); width (n= 26 clutches)55.32 ± 3.51 mm (range 45.8-63.6 mm); and weight (n= 24 clutches) 155.81 ± 25.14 g (range 86.9-230 g). Totalclutch weight (TCW) (n= 21) averaged 3013.50 ± 1480.70 g (range 311.6-5640.0 g). TCW correlated more highly
0
10
20
30
40
50
0 5 10 15 20 25 30 35
Age (years)
C.S
.
Figure 2. Relationship between age and clutch size in G. gangeticus (Age= 11.67 + 0.27CS ± 3.79; n =37, r2= 0.39).
05
10152025303540
0 2000 4000 6000TCW
CS
Figure 3. Relationship between total clutch weight and clutch size in G. ganeticus (TCW= -125.17 +157.82CS ± 545.78; n= 23, r2= 0.86).
404
maximum number of days before oviposition was seven days. Depths of trial nests varied between 10 and 36 cm.Nesting dates for the 44 nests (89.8% of the total) for which egg laying dates were known ranged from 10th Marchto 7th May. The maximum numbers of nests (n= 7) were laid between the 16th to 20th April (Fig: 1).
Clutch size, fertility and egg characteristics
Clutch size and clutch fertility were compared between the first laid clutch and last observed clutch. Significantdifference in clutch size (Paired t-test, t= 2.91, df= 6) and fertility (t= 3.38, df= 6) between the first and last observednest was evident. Mean clutch size (MCS) (n= 49) was 24.53 ± 12.32 (range 2-44). Percentage of viable eggs withina clutch (n= 49) averaged 75.31 ± 32.6% (range 0-100). Egg dimensions, given as the means of individual clutchmeans, were: length (n= 26 clutches) 85.89 ± 5.44 mm (range of means 69.85-111.7 mm); width (n= 26 clutches)55.32 ± 3.51 mm (range 45.8-63.6 mm); and weight (n= 24 clutches) 155.81 ± 25.14 g (range 86.9-230 g). Totalclutch weight (TCW) (n= 21) averaged 3013.50 ± 1480.70 g (range 311.6-5640.0 g). TCW correlated more highly
0
10
20
30
40
50
0 5 10 15 20 25 30 35
Age (years)
C.S
.
Figure 2. Relationship between age and clutch size in G. gangeticus (Age= 11.67 + 0.27CS ± 3.79; n =37, r2= 0.39).
05
10152025303540
0 2000 4000 6000TCW
CS
Figure 3. Relationship between total clutch weight and clutch size in G. ganeticus (TCW= -125.17 +157.82CS ± 545.78; n= 23, r2= 0.86).
405
with clutch size (Product Moment Correlation, n= 23 nests, r= 0.93) than with mean egg weight (r= 0.37, n= 23nests). Age and clutch size were found to be highly correlated (Fig. 2). TCW is strongly correlated with MCS, andmay be predicted from the formula as shown on Figure 3.
Reproductive effort
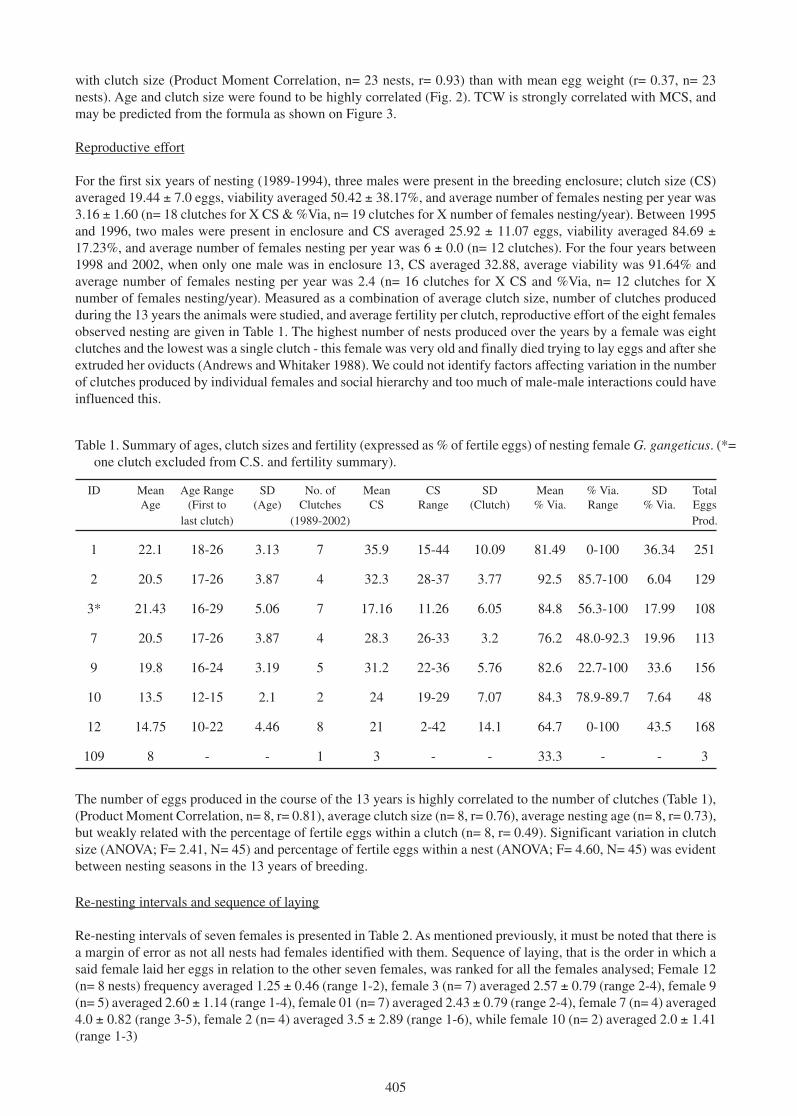
For the first six years of nesting (1989-1994), three males were present in the breeding enclosure; clutch size (CS)averaged 19.44 ± 7.0 eggs, viability averaged 50.42 ± 38.17%, and average number of females nesting per year was3.16 ± 1.60 (n= 18 clutches for X CS & %Via, n= 19 clutches for X number of females nesting/year). Between 1995and 1996, two males were present in enclosure and CS averaged 25.92 ± 11.07 eggs, viability averaged 84.69 ±17.23%, and average number of females nesting per year was 6 ± 0.0 (n= 12 clutches). For the four years between1998 and 2002, when only one male was in enclosure 13, CS averaged 32.88, average viability was 91.64% andaverage number of females nesting per year was 2.4 (n= 16 clutches for X CS and %Via, n= 12 clutches for Xnumber of females nesting/year). Measured as a combination of average clutch size, number of clutches producedduring the 13 years the animals were studied, and average fertility per clutch, reproductive effort of the eight femalesobserved nesting are given in Table 1. The highest number of nests produced over the years by a female was eightclutches and the lowest was a single clutch - this female was very old and finally died trying to lay eggs and after sheextruded her oviducts (Andrews and Whitaker 1988). We could not identify factors affecting variation in the numberof clutches produced by individual females and social hierarchy and too much of male-male interactions could haveinfluenced this.
Table 1. Summary of ages, clutch sizes and fertility (expressed as % of fertile eggs) of nesting female G. gangeticus. (*=one clutch excluded from C.S. and fertility summary).
ID Mean Age Range SD No. of Mean CS SD Mean % Via. SD TotalAge (First to (Age) Clutches CS Range (Clutch) % Via. Range % Via. Eggs
last clutch) (1989-2002) Prod.
1 22.1 18-26 3.13 7 35.9 15-44 10.09 81.49 0-100 36.34 251
2 20.5 17-26 3.87 4 32.3 28-37 3.77 92.5 85.7-100 6.04 129
3* 21.43 16-29 5.06 7 17.16 11.26 6.05 84.8 56.3-100 17.99 108
7 20.5 17-26 3.87 4 28.3 26-33 3.2 76.2 48.0-92.3 19.96 113
9 19.8 16-24 3.19 5 31.2 22-36 5.76 82.6 22.7-100 33.6 156
10 13.5 12-15 2.1 2 24 19-29 7.07 84.3 78.9-89.7 7.64 48
12 14.75 10-22 4.46 8 21 2-42 14.1 64.7 0-100 43.5 168
109 8 - - 1 3 - - 33.3 - - 3
The number of eggs produced in the course of the 13 years is highly correlated to the number of clutches (Table 1),(Product Moment Correlation, n= 8, r= 0.81), average clutch size (n= 8, r= 0.76), average nesting age (n= 8, r= 0.73),but weakly related with the percentage of fertile eggs within a clutch (n= 8, r= 0.49). Significant variation in clutchsize (ANOVA; F= 2.41, N= 45) and percentage of fertile eggs within a nest (ANOVA; F= 4.60, N= 45) was evidentbetween nesting seasons in the 13 years of breeding.
Re-nesting intervals and sequence of laying
Re-nesting intervals of seven females is presented in Table 2. As mentioned previously, it must be noted that there isa margin of error as not all nests had females identified with them. Sequence of laying, that is the order in which asaid female laid her eggs in relation to the other seven females, was ranked for all the females analysed; Female 12(n= 8 nests) frequency averaged 1.25 ± 0.46 (range 1-2), female 3 (n= 7) averaged 2.57 ± 0.79 (range 2-4), female 9(n= 5) averaged 2.60 ± 1.14 (range 1-4), female 01 (n= 7) averaged 2.43 ± 0.79 (range 2-4), female 7 (n= 4) averaged4.0 ± 0.82 (range 3-5), female 2 (n= 4) averaged 3.5 ± 2.89 (range 1-6), while female 10 (n= 2) averaged 2.0 ± 1.41(range 1-3)
405
with clutch size (Product Moment Correlation, n= 23 nests, r= 0.93) than with mean egg weight (r= 0.37, n= 23nests). Age and clutch size were found to be highly correlated (Fig. 2). TCW is strongly correlated with MCS, andmay be predicted from the formula as shown on Figure 3.
Reproductive effort
For the first six years of nesting (1989-1994), three males were present in the breeding enclosure; clutch size (CS)averaged 19.44 ± 7.0 eggs, viability averaged 50.42 ± 38.17%, and average number of females nesting per year was3.16 ± 1.60 (n= 18 clutches for X CS & %Via, n= 19 clutches for X number of females nesting/year). Between 1995and 1996, two males were present in enclosure and CS averaged 25.92 ± 11.07 eggs, viability averaged 84.69 ±17.23%, and average number of females nesting per year was 6 ± 0.0 (n= 12 clutches). For the four years between1998 and 2002, when only one male was in enclosure 13, CS averaged 32.88, average viability was 91.64% andaverage number of females nesting per year was 2.4 (n= 16 clutches for X CS and %Via, n= 12 clutches for Xnumber of females nesting/year). Measured as a combination of average clutch size, number of clutches producedduring the 13 years the animals were studied, and average fertility per clutch, reproductive effort of the eight femalesobserved nesting are given in Table 1. The highest number of nests produced over the years by a female was eightclutches and the lowest was a single clutch - this female was very old and finally died trying to lay eggs and after sheextruded her oviducts (Andrews and Whitaker 1988). We could not identify factors affecting variation in the numberof clutches produced by individual females and social hierarchy and too much of male-male interactions could haveinfluenced this.
Table 1. Summary of ages, clutch sizes and fertility (expressed as % of fertile eggs) of nesting female G. gangeticus. (*=one clutch excluded from C.S. and fertility summary).
ID Mean Age Range SD No. of Mean CS SD Mean % Via. SD TotalAge (First to (Age) Clutches CS Range (Clutch) % Via. Range % Via. Eggs
last clutch) (1989-2002) Prod.
1 22.1 18-26 3.13 7 35.9 15-44 10.09 81.49 0-100 36.34 251
2 20.5 17-26 3.87 4 32.3 28-37 3.77 92.5 85.7-100 6.04 129
3* 21.43 16-29 5.06 7 17.16 11.26 6.05 84.8 56.3-100 17.99 108
7 20.5 17-26 3.87 4 28.3 26-33 3.2 76.2 48.0-92.3 19.96 113
9 19.8 16-24 3.19 5 31.2 22-36 5.76 82.6 22.7-100 33.6 156
10 13.5 12-15 2.1 2 24 19-29 7.07 84.3 78.9-89.7 7.64 48
12 14.75 10-22 4.46 8 21 2-42 14.1 64.7 0-100 43.5 168
109 8 - - 1 3 - - 33.3 - - 3
The number of eggs produced in the course of the 13 years is highly correlated to the number of clutches (Table 1),(Product Moment Correlation, n= 8, r= 0.81), average clutch size (n= 8, r= 0.76), average nesting age (n= 8, r= 0.73),but weakly related with the percentage of fertile eggs within a clutch (n= 8, r= 0.49). Significant variation in clutchsize (ANOVA; F= 2.41, N= 45) and percentage of fertile eggs within a nest (ANOVA; F= 4.60, N= 45) was evidentbetween nesting seasons in the 13 years of breeding.
Re-nesting intervals and sequence of laying
Re-nesting intervals of seven females is presented in Table 2. As mentioned previously, it must be noted that there isa margin of error as not all nests had females identified with them. Sequence of laying, that is the order in which asaid female laid her eggs in relation to the other seven females, was ranked for all the females analysed; Female 12(n= 8 nests) frequency averaged 1.25 ± 0.46 (range 1-2), female 3 (n= 7) averaged 2.57 ± 0.79 (range 2-4), female 9(n= 5) averaged 2.60 ± 1.14 (range 1-4), female 01 (n= 7) averaged 2.43 ± 0.79 (range 2-4), female 7 (n= 4) averaged4.0 ± 0.82 (range 3-5), female 2 (n= 4) averaged 3.5 ± 2.89 (range 1-6), while female 10 (n= 2) averaged 2.0 ± 1.41(range 1-3)

406
Artificial nest temperatures
Incubation temperatures remained relatively constant throughout the incubation period, drops and peaks occurredwhen rainfall occurred and nests dried out again respectively (Fig. 4). Rainfall effectively lowered nest temperaturewithin eight hours. The incubation period ranged between March-July, the latter trimester coinciding with the south-west monsoon. Pooled temperatures averaged 31.41 ± 0.79°C, range 30.43-32.79°C (n= 6) for treatments at sunnylocations, and averaged 30.70 ± 1.22, range 29.43-32.32°C (n= 5) for treatments at shaded locations.
Hatchlings from artificial nests
Hatchlings from nests located in sunny and shady locations collectively pooled and measured within a day of hatching,had the following dimensions; mean TBL 35.52 ± 1.30, ranging between 33.8-37.45 cm (n= 185), mean SVL 17.27± 0.73, range 16.13-18.50 cm (n= 185) and mean weight of 104.02 ± 14.19, range 75.5-124.05 g (n= 151). Nosignificant difference was found in the TBL (ANOVA, F ratio= 0.0056; N= 19), SVL (ANOVA, F ratio= 0.0; N= 19),and wt. (ANOVA, F ratio= 0.55; N= 15) was observed between clutches exposed to sunlight, and shaded clutches.Hatchling morphometrics were found to be highly correlated to each other, regression equations are presented inTable 3.
Temperature- dependent sex determination
Lang and Andrews (1994) have previously discussed temperature-dependent sex determination for this species. Asin all other crocodilian species G. gangeticus has TSD and the pattern is female-male-female. Fertile eggs incubatedat set constant temperatures from 29-31.5°C produced only females and at 32°C 89% males were produced. At 33and 33.5°C resulted in 20% and 15% males respectively. Incubation period averaged 70 days for eggs incubated at31°C, which was 1.20 times higher than eggs from 29°C and 1.17 times longer than 33°C.
Table 2. Re-nesting intervals (years) of 7 female G. gangeticus.
ID N1 N2 N3 N4 N5 N6 N7 N8
12 G1-89 1 G1-90 1 G1-91 1 G2-92 1 G1-93 1 G1-94 6 G1-00 1 G2-013 G2-89 1 G2-90 1 G2-91 2 G3-93 3 G2-96 4 G3-00 2 G4-02 - -9 G2-93 2 G3-95 1 G4-96 3 G1-99 2 G3-01 - - - - - -1 G2-94 1 G2-95 1 G3-96 3 G2-99 1 G2-00 1 G4-01 1 G2-02 - -7 G4-93 2 G4-95 1 G5-96 6 G3-02 - - - - - - - -2 G6-93 2 G1-95 1 G6-96 6 G1-02 - - - - - - - -
10 G3-89 3 G1-92 - - - - - - - - - - - -Mean - 1.71 - 1 - 3.5 - 2 - 2 - 3 - 1 -SD + - 0.76 - 0 - 2.07 - 0.82 - 1.73 - 2.65 - 0 -Range - 1-3 - 1 - 1-6 - 1-3 - 1-4 - 1-6 - 1 -
282930313233343536
13.4.
91
17.4.
91
20.4.
91
24.4.
91
27.4.
91
6.5.91
9.5.91
12.5.
91
15.5.
91
18.5.
91
22.5.
91
25.5.
91
28.5.
91
31.5.
91
7.6.91
10.6.
91
Date (G2-91, Sun)
Tem
per
atu
re
800
1600
Figure 4. Temperature profile of natural nest (G2-91; exposed to sun); 45 of 59 incubation days recorded.Incubation period = 59 days; X at 0800 h = 32.84 ± 1.18°C (range 31.7-34.7°C) ; X at 1600 h =32.74± 1.12°C (range 30.4-34.6°C); Pooled X = 32.79 ± 1.15°C (range 30.4-34.7°C).

407
Discussion
Sexual maturity
Size and age at the onset of sexual maturity for several species has been previously discussed to an extent. McCann(1940) and Joanen and McCann (1975) have established that sexual maturity is size, not age, dependent. Bustard andSingh (1981) have reported for C. palustris. McCann (1940), Whirworth (1971), Joanen and McCann (1975) andNichols and Chabreck (1980) have reported the onset of sexual maturity for A. mississippiensis. Andrews (1986,1989a, 1989b, 2000) has reported for C. palustris, C. simensis, C. niloticus, Camain crocodilus crocodilus, C. morelettiand G. gangeticus. Hornaday (1885) first reported a female G. gangeticus that he had shot measuring 2.7 m and had15 developing eggs. Another 2.97 m long female shot in the Sutlej River had 56 eggs (Parshad 1914). Whitaker andBasu (1982) have reported that the minimum breeding size of females as 2.6 m TBL, and Biswas et al. (1977)reported that males attain sexual maturity when they are over 3 m. Acharjyo et al. (1990) confirmed that femalesattained sexual maturity when they are close to 3 m TBL and when they are 8.5-9 years old in captivity. Bustard andMaharana (1982) reported 3-3.17 m TBL for G. gangeticus females and Maharana (2001) reported that females incaptivity (n= 7) attained sexual maturity when they reached 3 m and from 10-17 years of age.
At MCBT first nesting occurred when a female 3.2 m TBL and 10 years laid eggs. Two other females nested duringthe same season and these two females measured 2.8 m (17 years) and 3 m (11.8 years) (Andrews 1989b). During thesame season the three males were also measured and they ranged from 3, 3.5 and 3.8 m TBL, and were aged 9.6, 12.6and 18.6 years of age. During the 1989 breeding season courtship and mating were observed and only the largestmales was observed courting and mating.
Of the three males in the breeding group, the largest male’s ghara development has been reported (Whitaker andWhitaker 1989); the snout looked like a female’s snout until 1982, when the first protuberance became obvious.Ghara growth proceeded steadily with a definite back folding tendency which eventually covered the nostrils in1988. This male’s ghara was first evident at 11 years of age, and covered the nostrils by 18.6 years (in 1989).Coincidentally, nesting occurred for the first time in the same year. Biswas et al. (1977) noted that a male atNandankanan Biological Park, Orissa, could be distinguished from females at the age of 12.5 years on the basis ofthe development of the ghara.
Temporal distribution of nests within the egg laying season
Nesting coincided with the period of minimal rainfall, and increasing ambient temperatures, a trend parallel to thatobserved in C. palustris at the same study site (Lang et al. 1989). Span of the nesting season (accumulative range)
Table 3. Natural nests (“sunny” and “shady” hatchlings pooled); Correlationcoefficients and linear regression equations for predicting hatchling parametersfrom each other. 151 hatchlings from nine clutches analysed for all wt. relatedequations, while n= 185 hatchlings from 11 clutches analysed for non-wt.related equations; for equations 1-6, values calculated from average of theaverage; for Hwt/Ewt equation 7, n= 100 hatchlings, direct correlation betweenparameters; hatchlings resulted from eggs laid by five different females inaddition to two nests of unknown origin. (SEE= standard error of the estimate).
Equation Formula SEE r2
1 TBL = 5.99 + 1.71SVL 0.13 0.922 SVL = -1.56 + 0.53TBL 0.06 0.923 HWt = -2.35.18 + 9.62TBL 54.26 0.714 TBL = 27.56 + 0.07HWt 0.60 0.715 HWt = -223.21 + 19.17SVL 59.91 0.696 SVL = 13.33 + 0.036HWt 0.11 0.697 HWt = 17.937 + 0.525Ewt 6.17 0.66
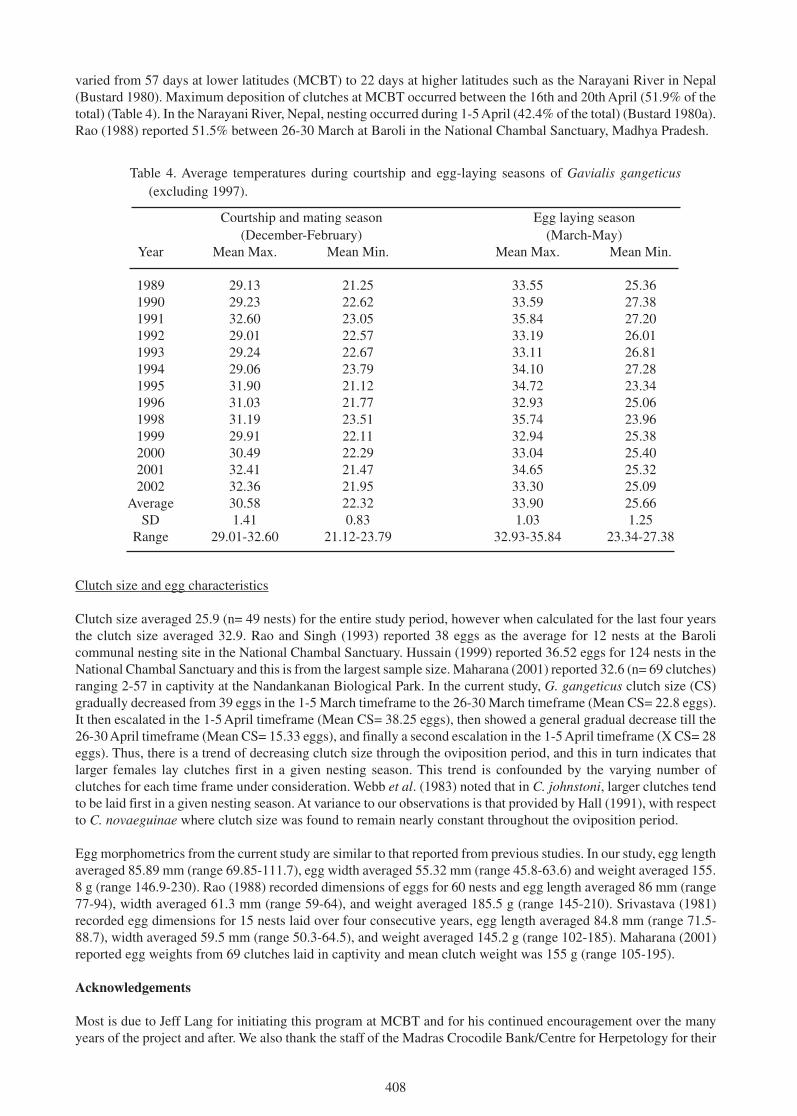
408
varied from 57 days at lower latitudes (MCBT) to 22 days at higher latitudes such as the Narayani River in Nepal(Bustard 1980). Maximum deposition of clutches at MCBT occurred between the 16th and 20th April (51.9% of thetotal) (Table 4). In the Narayani River, Nepal, nesting occurred during 1-5 April (42.4% of the total) (Bustard 1980a).Rao (1988) reported 51.5% between 26-30 March at Baroli in the National Chambal Sanctuary, Madhya Pradesh.
Table 4. Average temperatures during courtship and egg-laying seasons of Gavialis gangeticus(excluding 1997).
Clutch size and egg characteristics
Clutch size averaged 25.9 (n= 49 nests) for the entire study period, however when calculated for the last four yearsthe clutch size averaged 32.9. Rao and Singh (1993) reported 38 eggs as the average for 12 nests at the Barolicommunal nesting site in the National Chambal Sanctuary. Hussain (1999) reported 36.52 eggs for 124 nests in theNational Chambal Sanctuary and this is from the largest sample size. Maharana (2001) reported 32.6 (n= 69 clutches)ranging 2-57 in captivity at the Nandankanan Biological Park. In the current study, G. gangeticus clutch size (CS)gradually decreased from 39 eggs in the 1-5 March timeframe to the 26-30 March timeframe (Mean CS= 22.8 eggs).It then escalated in the 1-5 April timeframe (Mean CS= 38.25 eggs), then showed a general gradual decrease till the26-30 April timeframe (Mean CS= 15.33 eggs), and finally a second escalation in the 1-5 April timeframe (X CS= 28eggs). Thus, there is a trend of decreasing clutch size through the oviposition period, and this in turn indicates thatlarger females lay clutches first in a given nesting season. This trend is confounded by the varying number ofclutches for each time frame under consideration. Webb et al. (1983) noted that in C. johnstoni, larger clutches tendto be laid first in a given nesting season. At variance to our observations is that provided by Hall (1991), with respectto C. novaeguinae where clutch size was found to remain nearly constant throughout the oviposition period.
Egg morphometrics from the current study are similar to that reported from previous studies. In our study, egg lengthaveraged 85.89 mm (range 69.85-111.7), egg width averaged 55.32 mm (range 45.8-63.6) and weight averaged 155.8 g (range 146.9-230). Rao (1988) recorded dimensions of eggs for 60 nests and egg length averaged 86 mm (range77-94), width averaged 61.3 mm (range 59-64), and weight averaged 185.5 g (range 145-210). Srivastava (1981)recorded egg dimensions for 15 nests laid over four consecutive years, egg length averaged 84.8 mm (range 71.5-88.7), width averaged 59.5 mm (range 50.3-64.5), and weight averaged 145.2 g (range 102-185). Maharana (2001)reported egg weights from 69 clutches laid in captivity and mean clutch weight was 155 g (range 105-195).
Acknowledgements
Most is due to Jeff Lang for initiating this program at MCBT and for his continued encouragement over the manyyears of the project and after. We also thank the staff of the Madras Crocodile Bank/Centre for Herpetology for their
Courtship and mating season Egg laying season(December-February) (March-May)
Year Mean Max. Mean Min. Mean Max. Mean Min.
1989 29.13 21.25 33.55 25.361990 29.23 22.62 33.59 27.381991 32.60 23.05 35.84 27.201992 29.01 22.57 33.19 26.011993 29.24 22.67 33.11 26.811994 29.06 23.79 34.10 27.281995 31.90 21.12 34.72 23.341996 31.03 21.77 32.93 25.061998 31.19 23.51 35.74 23.961999 29.91 22.11 32.94 25.382000 30.49 22.29 33.04 25.402001 32.41 21.47 34.65 25.322002 32.36 21.95 33.30 25.09
Average 30.58 22.32 33.90 25.66SD 1.41 0.83 1.03 1.25
Range 29.01-32.60 21.12-23.79 32.93-35.84 23.34-27.38
409
assistance at every stage. Grahame Webb and Rom Whitaker provided valuable comments and reviewed an earlierdraft of this manuscript. We are grateful to the Trustees of the Madras Crocodile Bank Trust/Centre for Herpetologyfor their continued support and encouragement. Last but not least, we are indebted to Seema Mundoli for her patiencein reviewing this manuscript three times and for all her editorial help.
Literature
Acharjyo, L.N., Singh, L.A.K. and Patnaik, S.K. (1990). Age at sexual maturity of gharial, Gavialis gangeticus(Reptilia: Crocodilia). J. Bombay Nat. Hist. Soc. 87(3): 458- 459.
Acharjyo, L.N., Kar, S.K. and Patnaik, S.K. (1996). Studies on captive breeding of the gharial, Gavialis gangeticus(Gmelin) in Orissa. J. Bombay Nat. Hist. Soc. 93 (2): 210-213.
Andrews, H.V. (1986). Variation in egg and clutch size of mugger in different age groups. Hamadryad 11(3): 13- 14.
Andrews, H.V. (1989a). An unusual record of Crocodylus moreletii nesting. Hamadryad 14 (1): 11-13.
Andrews, H.V. (1989b). Gavialis gangeticus nest at the Madras Crocodile Bank. Hamadryad 14 (1): 13-14.
Andrews, H.V. (2000). Breeding, growth and reproductive effort of the Morelet’s crocodile (Crocodylus moreletii).Pp. 182-190 in Crocodiles. Proceedings of the 15th Working Meeting of the Crocodile Specialist Group. Varadero,Cuba. IUCN-The World Conservation Union: Gland, Switzerland.
Andrews, H V. and Whitaker, R. (1988). A note on gharial oviduct extrusion while nesting at the Madras CrocodileBank. Hamadryad 13 (2): 2.
Basu, D. and Bustard, H.R. (1981). Maternal behavior in the gharial [Gavialis gangeticus (Gmelin)]. J. Bombay Nat.Hist. Soc. 78: 390- 392.
Biswas, S., Acharjyo, L.N. and Mohaputra, S. (1977). A note on the protuberance or knob on the snout of malegharial Gavialis gangeticus (Gmelin). J. Bombay Nat. Hist. Soc. 74 (3): 536- 537.
Bustard, H.R. (1979). A note on the nesting behavior in the Indian gharial Gavialis gangeticus (Gmelin) (Reptilia:Crocodilia). J. Bombay Nat. Hist. Soc. 16: 519- 520.
Bustard, H.R. (1980a). Clutch size, incubation, and hatching success of gharial Gavialis gangeticus (Gmelin) eggsfrom Narayani River, Nepa, 1976-1978. J. Bombay Nat. Hist. Soc. 77: 100- 105.
Bustard, H.R. (1980b). Maternal care in the gharial, Gavialis gangeticus (Gmelin). British J. Herpetol. 6: 63-64.
Bustard, H.R. and Maharana, S. (1981). Fatal male-male conflict in the gharial Gavialis gangeticus (Gmelin) (Reptilia:Crocodilia). J. Bombay Nat. Hist. Soc. 78 (1): 1- 3.
Bustard, H.R. and Maharana, S. (1982). Size at first breeding in the gharial (Gavialis gangeticus (Gmelin)) (Reptilia:Crocodilia) in captivity. J. Bombay Nat. Hist. Soc. 79 (1): 206- 207.
Bustard, H.R. and Maharana, S. (1983). Growth rates in sub-adult gharial Gavialis gangeticus (Gmelin) (Reptilia:Crocodilia). J. Bombay Nat. Hist. Soc. 80 (1): 224-226.
Bustard, H.R. and Singh, L.A.K. (1977). Studies on the Indian gharial Gavialis gangeticus (Gmelin)(Reptilia:Crocodilia): Estimation of body length from scute length. Indian Forester 103 (2): 140-149.
Bustard, H.R. and Singh, L.A.K. (1981). Age at onset of sexual maturity in male Indian mugger (Crocodylus palustris,Lesson) in captivity. J. Bombay Nat. His. Soc. 78 (3): 607- 669.
Choudhury, B.C. and Bustard, H.R. (1983). Stunted growth in captive reared gharial. J. Bombay Nat. Hist. Soc. 80(2): 423- 425.

410
Chowdury, S., Bustard, H.R. and Tandan, B.K. (1983). Incubation and hatching of eggs of Gavialis gangeticus inhatcheries. British J. Herpetol. 6: 337- 342.
Hall, P.M. (1991). Estimation of nesting female crocodilian size from clutch characteristics: Correlates of reproductivemode, and harvest implications. J. Herpetol. 25 (2): 133- 141.
Hornaday, W.T. (1885). Two Years in the Jungle. Charles Seribner’s Sons: NewYork.
Hussain, S.A. (1999). Reproductive success, hatchling survival, and rate of increase of gharial, Gavialis gangeticusin the National Chambal Sanctuary, India. Biological Conservation 87: 261- 268.
Joanen, T. and L. McCann, L. (1975). Notes on the reproductive biology and captive propagation of the Americanalligator. Proc. 29th Annual Meeting Southeast Assoc. Game & Fish Comm. 29: 407- 415.
Kimura, W. (1978). Artificial incubation of gharial eggs. Bulletin of Atagawa Institute of Tropical and AlligatorGarden: 16.
Lang, J.W. and Andrews, H.V. (1994). Temperature-dependent sex determination in crocodilians. J. ExperimentalZool. 270: 28- 44.
Lang, J.W., Andrews, H. and Whitaker, R. (1989). Sex determination and sex ratios in Crocodylus palustris. AmericanZoologist 29: 935- 952.
Maharana, S. 2001. Nandankanan gharial captive breeding program. Crocodile Specialist Group Newsletter 20 (4):79- 80.
Maharana, S. and Bustard, H.R. (1981). Behavior of the male gharial during the nesting and post-hatching period. J.Bombay Nat. Hist. Soc. 79 (3): 677- 681.
McCann, C. (1940). A reptile and amphibian miscellany. J. Bombay Nat. Hist. Soc. 41(4): 742- 747.
Nichols, J.D. and Chabreck, R.H. (1980). On the variability of alligator sex ratio. Amer. Nat. 116: 125- 137.
Parashad, B. (1914). The gharial (Gavialis gangeticus). J. Bombay Nat. Hist. Soc. 23: 369.
Rao, R.J. (1988). Nesting ecology of the gharial in National Chambal Sanctuary. Study Report, August 1988, WildlifeInstitute of India, Dehra Dun, India.
Rao, R.J. and Singh, L.A.K. (1993). Communal nesting by gharial Gavialis gangeticus (Gmelin) (Reptilia: Crocodilia)in National Chambal Sanctuary. J. Bombay Nat. Hist. Soc. 90 (1): 17- 22.
Ross, P. (Ed). (2003). India- Gharial reach a crisis in Chambal River. Crocodile Specialist Group Newsletter 22(4):12- 13.
Seymour, R.S., Webb, G.J.W., Bennett, A.F. and Bradford, D.F. (1987). Effects of capture on the physiology ofCrocodylus porosus. Pp. 253-7 in Wildlife Management Crocodiles and Alligators, ed. by G.J.W. Webb, S.C.Manolis and P.J. Whitehead. Surry Beatty and Sons: Sydney.
Singh, L.A.K. (1978). Ecological studies on the Indian gharial Gavialis gangeticus (Gmelin) (Reptila: Crocodilia).Ph.D. Thesis, Utkal University, Orissa, India.
Singh, L.A.K. and Bustard, H.R. (1977). Locomotory behavior during basking and spoor formation in the gharial(Gavialis gangeticus). British J. Herpetol. 5: 673- 676.
Srivastava, A.K. (1981). Biology of the Indian gharial Gavialis gangeticus with special reference to its behavior.Ph.D. Thesis, University of Lucknow, Up.

411
Webb, G.J.W. and Manolis, S.C. (1987). Methods for retrieving crocodilian embryos. Pp. 423-6 in WildlifeManagement Crocodiles and Alligators, ed. by G.J.W. Webb, S.C. Manolis and P.J. Whitehead. Surry Beatty andSons: Sydney.
Webb, G.J.W., Buckworth, R. and Manolis, S.C. (1983). Crocodylus johnstoni in the McKinlay River, N.T. VI.Nesting biology. Aust. Wildl. Res. 10: 607- 637.
Whitaker, R. and Andrews, H.V. (1988). Notes on crocodilian locomotion. J. Bombay Nat. Hist. Soc. 85 (3): 621-622.
Whitaker, R. and Andrews, H.V. (2003). Crocodile conservation, Western Asia Region: An update. J. Bombay Nat.Hist. Soc. 100 (2 & 3): 432- 445.
Whitaker, R. and Basu, D. (1982). The gharial (Gavialis gangeticus): a review. J. Bombay Nat. Hist. Soc. 79 (3):531- 548.
Whitaker, R. and Whitaker, Z. (1989). The ghara of the gharial. Hamadryad 14 (2): 2- 3.
Whirworth, J. (1971). Notes on the growth and mating of American alligator (Alligator mississippienisis). Int. ZooYear Book 11: 144.
412
Conservation Genetics of Chinese Alligator, Alligator sinensis
Wu Xiaobing1 and Gu Changming2
1College of Life Sciences, Anhui Normal University, Wuhu 241000, China;2Anhui Forestry Department, Hefei 231001, China
Chinese alligator is one of the most endangered species among 23 species of crocodiles. Only single population, ofno more than 200 individuals, remains in the wild at Xuanzhou, Anhui Province in China. To save this species,captive propagation programs were established, which consist of 2 captive subpopulations at Xuanzhou and Changxingbreeding farms. The first crocodile farm, The Anhui Research Center of Chinese Alligator Reproduction (ARCCAR),is the largest captive subpopulation of this alligator, was set up at Xuanzhou, Anhui Province in 1979. 212 alligatorscame from wild as foundation stock for ARCCAR, and subsequently raised in a natural pond, where the survivors(about 60-70 individuals) remain today. From then on, about 9000 individuals including first (F
1) and second filial
generation (F2) were bred in ARCCAR.
A major concern among conservation biologists is loss of genetic diversity in small or captive populations throughgenetic drift and inbreeding. Because of their restricted population size, inbreeding is virtually unavoidable in captivepopulations (Pray et al. 1994). The molecular approach has been proved an increasingly valuable tool in theidentification of animal genetic variation. Genetic markers, such as Random Amplified Polymorphic DNA (RAPD),mitochondrial control region sequences and microsatellites, have been applied to assess genetic structure of Chinesealligator captive population. The results show that very low genetic variation was revealed in captive population ofChinese alligator. Especially, only one haplotype of control region sequence was found in Chinese alligator population.Recently, we continued to analyze the mitochondrial control region sequences variation using the enlarged samplesof Chinese alligator. Total 2 variable loci were found in the control region sequences in skull samples from historypopulation. But also, no sequence variation was detected in captive population. In another study, a pair of degenerateprimers was used to amplify polymorphic segments of MHC class II genes from the genomic DNA of Alligatorsinensis. Ten different nucleotide sequences, which were divided into two groups (A, B), were obtained from cloningand sequencing. There were 38 variable sites among ten nucleotide sequences, and 23 variable sites among aminoacid sequences. So, we think that, the loss of genetic variation may not occur in the whole genome of Chinesealligator, the high polymorphism of some functional genes, such as MHC in A. sinensis, was of great benefit togenetic conservation in the captive population of Chinese alligator.

413
Crocodilian Genome Projects: Status and Resources
Travis C. Glenn1,2
1Savannah River Ecology Laboratory, PO Drawer E, Aiken, SC 29802, USA ([email protected]);2Department of Biological Sciences, University of South Carolina, Columbia, SC 29208, USA
Many new tools to analyze the genetics of crocodilians are being developed. Standard genetic tools to identifyindividuals, family groups, populations, and species are now reasonably advanced. In addition to these more traditionaltools, additional approaches are advancing rapidly. The number of genes described from crocodilians will go from afew dozen in 2003 to thousands within the next year. The vast majority of the new data will be from Americanalligators (Alligator mississippiensis). American alligators will also be included in a Reptilian Genome Project proposalto the U.S. National Human Genome Research Institute. Leveraging the data from American alligators and othernew comparative genomic data sets will present new opportunities for both applied and basic research of crocodilians.Specific information about the DNA tools now available, PowerPoint slides used for this presentation, abstracts ofresearch presented at the 2nd International Crocodilian DNA Workshop, as well as a variety of additional resourcesare available from the Crocodilian DNA Information Repository (http://www.uga.edu/srel/CrocDNA/CrocDNAindex.htm).
Crocodilian Gene Hunting with Expressed Sequence Tags (ESTs)
Nancy A. Schable1, Travis C. Glenn1,2 and Roger H. Sawyer2
1University of Georgia, Savannah River Ecology Laboratory, Georgia, USA;2University of South Carolina, USA ([email protected])
Increasing our knowledge about genome organization and expressed genes for the American alligator (Alligatormississippiensis) will provide important information about the basic biology of crocodilians, enhance captivepropagation success, and increase the commercial value for this species. Developing an Expressed Sequence Tag(EST) library is the most direct and efficient way to examine the type and number of active genes that are expressedin a particular tissue. We are currently developing EST libraries for brain, liver, kidney, skin, ovary, testes, embryonictissues, as well as “whole animal” for the American alligator. We will present information about how these librariesare constructed, how they can be used, and how other researchers can access the libraries, clones, and informationgenerated. Several newly discovered American alligator genes will be revealed along with a brief discussion of thesignificant research that may result from their identification.
414
Captive Animals with Known Pedigrees Are Needed forGenetic Maps of Crocodilians
Cris Hagen1 and Travis C. Glenn1,2
1Savannah River Ecology Laboratory, PO Drawer E, Aiken, SC 29802, USA ([email protected]);2Department of Biological Sciences, University of South Carolina, Columbia SC 29208, USA
Genetic maps are an important resource for biologists with interests ranging from evolution to production agriculture.Unfortunately, no genetic maps exist for crocodilians. We are interested in developing genetic linkage maps forAmerican alligators (Alligator mississippiensis), as well as other crocodilians. To accomplish this, our immediategoal is to obtain the necessary blood samples from captive crocodilians with known pedigrees. In general, samplesfrom families with 3 generations (ie grandparents, parents, and offspring) are desirable. Family groups with largenumbers of offspring as well as those from interspecific crosses (eg golden crocodiles) are particularly valuable. Wewelcome information from anyone with knowledge of or access to such samples.
Stochastic Simulation Model of the Population Dynamics ofthe Caiman yacare in the Brazilian Pantanal
Marcos Coutinho, Milani Chaloupka and Zilca Campos
[email protected]; [email protected]; [email protected]
A heuristic simulation model was developed to foster a better understanding of the complex nature of caiman populationdynamics in the southern Pantanal wetlands. The model was based on systems of finite difference equations linkedwith demographic rates characterized by nonlinear, feedback and stochastic properties. The model is age- and sex-structured with significant environmental stochasticity included through the relationship between female breedinglikelihood and mean maximum water level in the wetlands. Water level fluctuates significantly from year to year andis a major environmental function which also displays long periods of low water levels, resulting in complex nonlinearpopulation dynamics. Demographic stochasticity was included in the model by sampling vital rates such as age-specific survival probabilities from normal probability distribution functions reflecting the estimated measurementerror. The model was used to analyse the behaviour of the population and to support risk evaluation of each offollowing management strategies: a) Egg harvesting: presently, this is the only legal possibility of exploiting naturalpopulations of caimans in the Pantanal, even though the infrastructure and logistic support required to rear thehatchlings is unavailable in the large majority of the farms within the wetlands; b) Harvesting individuals five to nineyears of age (50 to 90 cm SVL); c) Harvesting individuals >10 years of age (>90 cm SVL): scenarios b and c arelikely to be economically feasible given that only a low infrastructure and small capital investments are required. Itis important to assess the biological feasibility of these approaches. However, changes in the Brazilian federalenvironmental legislation would be necessary before they could be implemented, given that commercial use ofwildlife by hunting is presently prohibited; d) Headstarting and harvest age classes five to nine and/or >10 years:headstarting the population with hatchlings and harvesting young-adults and/or adults are management activitieswhich require relatively low investments and are technically possible to be implemented, despite the lack ofinfrastructure and logistic support that prevails in most farms in the Pantanal.
415
Evidence for Long-Distance Migration by Wild American Alligators
Ruth M. Elsey1, Valentine A. Lance2 and Phillip L. Trosclair II1
1Louisiana Department of Wildlife and Fisheries,Rockefeller Wildlife Refuge, Grand Chenier, Louisiana 70643, USA;
2Graduate School of Public Health, San Diego State University, San Diego, California 92128, USA
As part of an ongoing study on growth and sexual maturation of the American alligator on Rockefeller Refuge, 3004specimens ranging in total length from 28 to 361 cm were captured from June 2001 through January 2004. Eachanimal was tagged, measured, the sex recorded and released at the site of capture. A large number of these markedanimals were recaptured outside the refuge at the annual alligator hunts during the month of September. Of therecaptures identified, 69 were males, 22 females and six of undetermined sex. From each recaptured alligator, totalbody length and number of days since initial capture were recorded, and minimum distance from initial capture siteestimated. From these preliminary data we calculated growth rate and plotted minimum distance moved. The numberof days between first capture and ultimate capture ranged from 29 to 1151 days. To calculate growth rate we usedonly the days between April 1 and September 30. Males grew significantly faster than females (3.55 + 0.15 vs. 1.94+ 0.23 cm/growing month). Distance from initial capture site to final capture site ranged from 0.33 to 90.17 km.Three alligators moved more than 30 km, seven alligators moved between 20 and 30 km and 19 moved between 10and 20 km. There was no significant bias in the compass direction moved. These results greatly extend previousestimates of long-distance movement by alligators and demonstrate that both sub-adult and sexually mature animalsmove considerable distances. Suggested reasons for such dispersal will be discussed.
Characterization of the Innate Immune System of the American Alligator(Alligator mississippiensis)
Mark Merchant1, Ruth M. Elsey2 and Phillip Trosclair III2
1McNeese State University, Department of Chemistry, PO Box 90455, Lake Charles, Louisiana 70609,USA ([email protected]);
2Louisiana Department of Wildlife and Fisheries, Rockefeller Wildlife Refuge,5476 Grand Chenier Hwy, Grand Chenier, Louisiana 70643, USA ([email protected])
Recent studies in our laboratory have shown that serum of the American alligator exhibits potent and broad-actingantibacterial properties. In addition, alligator serum exhibits strong amoebacidal properties. The antimicrobial characterof the serum has been attributed to the innate immune system of the alligator. The innate immune system is the firstline of defense against infection. The serum complement protein system comprises an important component ofinnate immunity. We have identified one alligator complement protein component and characterized much of thebiochemistry of the complement system, including kinetic analyses, thermal dependence, and the role of Mg2+ andCa2+. Other studies have focused on the role of leukocytes in innate immunity. We have described the antifungaleffects of crude granulocyte extracts. In addition, we have measured complement-mediated opsonization andphagocytosis of bacteria and the generation of oxidative bursts by alligator granulocytes using advanced flowcytometeric techniques. This presentation will focus on an overview of our recent and current studies on the innateimmune system of the American alligator.
416
Isolation and Identification of Microorganisms in the Eggs ofCaiman crocodilus fuscus from Three Farms on the Atlantic Coast of Colombia
Iván D. Palacios R.1 and Monica Sick G.2
1 Wildlife Management Adviser, Colombia ([email protected]);2 Estudent M.V.Z. Universidad San Martín, Barranquilla, Colombia
Abstract
During the incubation process of the crocodylia, embrionary mortality occurs due to different effects, one of thembeing contamination by microorganisms. Our sample material came from three farms that carry out industrialzoobreeding programs in a closed cycle with the C. c. fuscus species, located on the Colombian atlantic coast (fromthe Colombian Caribbean, San Francisco and Colombian Crocodilia) and have automated incubation systems andcalibrated at 32°C and 99% of relative humidity. In order to evaluate this situation 29 eggs (shell, inside) wereanalysed, three water samples, four samples composed by vegetal material, three samples composed by vermiculita.Microorganisms were is dated and identified, from these. The most frequent bacterial on shells were Pseudomonasspp., Klebsiella pneumoniae. Fungi were only found on shells and less than bacteria, Trichophyton rubru and Aspergillusfumigatus being the most frequent. The latter microorganisms were also found on vermiculita samples and vegetalmaterial from nests, the latter presumably being the contaminating origin. It is fundamental to carry out disinfectiontechniques for eggs and incubation equipment
Introduction
In the closed cycle production systems of Caiman crocodilus fuscus the incubation process places a fundamental rolefor the productive success of the system, therefore, embrionary mortality occurred during this process, may affect theproduction. For such effect and in order to find causes that may by corrected through the implementation of andadequate handling, the Colombian Caribbean, San Francisco and Colombian Crocodilia farms collaborated with thelogistic and economic support to carry out this investigation.
In these farms, the maximum length observed for males is 225 cm (88.58’’) and the females reach up to 185 cm(72.83’’). The females of largest size normally lay a big number of eggs and of great size, which makes the newbornbe equally big.
For the area of study (Caribbean zone of Colombian), the mating occurs after the first symptoms of courtship startingat the end of January which last until the end of June. The nests are constructed by the female piling vegetationmaterial, an event that starts in the first week of April and ends by the middle of August. Hatching occurs after anaverage of 72 days of incubation at a temperature of 32°C and 99% relative humidity, starting by the middle of Juneand ending during the first week of November. In these three farms the physical characteristics of the eggs of C. cfuscus have been found to be: weight that can vary from 29 to 69 g, length from 5 to 6.4 cm and width of 3.1 to 4.1cm.
The shell of these eggs is hard and calcified stuck to a fibrous membrane. The calcified portion of the shell is roughand contain groups of fine pores that may not be seen by the human eye. The pores are vital for gaseous interchangeand are also structure that permit maintaining hydration balance of the egg according to the level of humidity thatsurrounds it.
Microorganisms can also go through these pores the same way and affect the immune system of the eggs and causethe mortality of the embryo because of this. The incubation systems used in these three farms are electronic, reasonwhy they have the necessary equipment to offer the conditions that permit maintaining a constant temperature duringthe whole incubation process.
Objectives
The main objectives was to identify the types of bacteria and fungi present in C. c. fuscus eggs and the materialsinvolved in their incubation.
417
Materials and Methods
Basic laboratory equipment was used for the sample taking as for their analysis, each one of them well sterilized. Theegg samples were taken from three farms, inside the group of incubated nest, having as a selections criterion, visualcharacteristics such as fungi presence, unfertile eggs and fertile eggs.
Procedure
Initially, through ultrasound, females were detected that presented sonogram characteristics such as presence ofstructures compatible with eggs, eggs in abdominal cavity and females with no eggs. From these samples were takenof ovaries, oviducts, follicles and eggs found in oviduct as in abdominal cavity, to be analysed in laboratory whichdetermined the absence of microorganisms in the different samples.
There are proceeded to take the egg samples, identifying the nest, taking these with gloves and depositing them insterile bags, the same with the vermiculite, vegetative material, from the nest and water samples, to be transportedthis way to the laboratory.
Where it proceeded to analyse the external and internal material of the egg following the corresponding protocol todo the planting using Agar blood as a cultivation means and EMB for anaerobiosis (non-oxygen) at 37°C for 24hours and the means for fungi at laboratory room temperature from 8 to 10 days.
Samples
29 eggs were used, analysing the shell and the inner content, 4 samples of compound vegetative material, three ofwater and three of compound vermiculite, this means a total of 39 samples were analysed.
Global Analysis of Samples
Samples were taken from 19 lakes of reproducers of a total 30,that exist on the three farms, which corresponds to a63.3%.
For the global analysis of samples the number of isolations was established of each type of bacteria and kinds offungi, in each one of the three farms and its percent relation.
Results
Bacteria
Fifteen (15) different types of bacteria were detected on the shell and 13 in the inner part. Among the isolatedbacteria on the shell and the inner part of the eggs, the most common ones were: Pseudomonas,Klebsiella pneumonidaeand Enterobacter aglomerans.
Fungi
Five different kinds of fungi were identified on the shell, and interestingly they weren’t found in the inner part of theeggs. The fungi that was isolated in a greater number of times was Trichophyton rubrum and Aspergillus fumigatus,each one 16 times.
Discussion
When making a comparison between the samples taken and the bacteria and fungi detected in each one of them, wecan notice that a high relationship exists between the most isolated microorganisms in eggs, with the ones found invegetation material. The bacteria and fungi that were isolated in this procedure, coincide greatly with the onesreported by Mayer (1998).
Births and Deaths Per Farm
The rate of embryonic mortality and the percentage of hatchings were calculated using only the viable eggs taken

418
from the nests used for this evaluation - broken eggs were not taken into account. In the case of farm one, we usedeggs from 11 nests, in which embryonic mortality was 73.5%, and the hatching rate was 26.5%; the newborn mortalityrate was 11%.
In the case of farm 3, the embryonic mortality in the nest was 47% (hatching rate of 53%), and the newborn mortalityrate was 1.7%. In farm two, embryonic mortality was 55% (hatch rate of 45%), with a newborn mortality rate of34%. The average embryonic mortality rate for all incubated eggs in the three farms was 16.3% (hatching success of83.7%).
This comparison could reflect that the bacteria and fungi in the eggs and the environment that surrounds them,influence notably so that the eggs don’t culminate in a successful birth.
We have to take into a account that the initial samples of eggs were taken under specific circumstances like: infertility,microscopic presence of fungi and normal eggs. This is why these percentages are valid for the total sampling donefor this study, which isn’t a totally real situation for each one on the farms at a global level, nevertheless it thosereflect the high embryonic and newborn mortality caused by these microorganisms, which is a warning to takemeasures to better this situation.
Conclusions
The isolated bacteria and fungi are microorganisms natural to the environment in which the samples were andbecause of the conditions the C. c. fuscus eggs were incubated in, such as a 99% relative humidity and 32°C temperature,made the environment good for the growth of these microorganisms. Specially for the fungi, which managed to growto such a point the manifested microscopically so well as it they were in an environment of enriched plantationspecial for them, like the ones in the laboratory are.
The eggs and the newborn have their own defence mechanisms, which are able to fight a certain number ofmicroorganisms nevertheless when the number of these microorganisms is such bigger, they overcome the defencesof the eggs and newborn managing to cause embrionary mortality, the newborn deaths and postbirth sicknesses.
The presence of bacteria in the inner content of the eggs, reflected that some of then had the chance to penetrate theshell causing damages nevertheless the possibility that some were the result of contamination isn’t discarted eventhoughthe measure taken to prevent the contamination in the planting in the laboratory.
About the fungi, these weren’t isolated from the inner content of the eggs, which makes us presume they didn’tmange to penetrate the shell, these doesn’t mean they don’t cause harm, due to the data of obtained, we observed thatin the nests where microscopic growth took place, was where a 100% of embryonic mortality of the nesting waspresent. These fungi are presumed to act two ways: one is that when forming an extense longer over the surface of theegg, the manage to stop the normal gas exchange between the egg and the external environment, causing the embryonicmortality this way; or that the fungi can generate toxins and these penetrate the shell, can be the ones causing theembryonic mortality, surely these are only suppositions and to confirm them, they must be studied specifically andwith the means for it.
Suggestions
To be able to diminish the microbial load on the fertile eggs for incubation and in general in all equipment andincubation infrastructure, its advisable to practice disinfection techniques on these.
Acknowledgements
We specially thanks the croc farms: From the DEL CARIBE COLOMBIANO, SAN FRANCISCO, CROCODILIACOLOMBIANA, located in the Atlantico department Colombia for the unconditional cooperation for the developmentof this investigation. Thanks to croc farm REPTICOSTA for their support, and Miguel Rodriguez for his comments.
Literature
Carter, G.R. and Chengappa, M.M. (1994). Bacteriología y Micología Veterinaria. 2a Ed. Santafé de Bogotá.
419
Fraser, C.M. (1991). Manual de Merck. 4a ed. Océano Grupo.
Hutton, J.M. and Webb, G.J.W. (1994). Introducción a la cría de cocodrilianos.
Joklik, W. and Amos, W. (1995). Microbiologia Zinsser. 2a ed. Panamericana.
Koneman, A. and Sommers, D. (1993). Diagnóstico Microbiológico Texto y Atlas Color. Panamericana. pp. 447-450.
Ladds, P.W. (1998). Management and diseases of farmed crocodiles.
Larriera, A. and Verdade, L.M. (1998). La conservación y el manejo de los caimanes y cocodrilos de América Latina.Vol. 1.
Mason, B.M. (1997). The bibliography of crocodilian biology.
Mayer, R. (1998). Crocodile Farming. Rural Industries Research and Development Corporation.
Pachón, E. (1982). Algunos aspectos relativos a la conservación y manejo de los Crocodylia en Colombia. Inderena.pp. 1.
Palacios, R.I.D. (1999). Ministerio Del Medio Ambiente. Zoocría en Colombia. Evolución y perspectivas.
Youngrapakorn, P. and Ousavaplanechai, L. (2000). A Color Atlas Of Diseases of the Crocodile. Style CreativeHouse Co. Ltda.: Thailand.
Ross, R. (1984). The bacterial diseases of reptiles.
Sierra D.C.L. (1994). Caracterización del desarrollo embrionario del Caiman crocodilus fuscus, incubado bajo tresregímenes de temperatura. Tesis. Santa fé de Bogotá: Universidad Nacional de Colombia, Departamento deBiología.
Vergel, G. (1997). Un manual para la elaboración de diseños y proyectos de investigación. 3a ed. Mejoras Ltda.:Barranquilla.

420
Using Bioelectrical Impedance Analysis (BIA) to Determine the Body Conditionof Farmed Estuarine Crocodiles
Stephen Peucker1, Rob Jack1, Bob Mayer1, Beth Symonds2, Leigh Ward2, David Booth2,
Peter Fisher3 and David Wilson3
1Agency for Food and Fibre Sciences, Department of Primary Industries and Fisheries,PO Box 1085, Townsville, QLD 4810, Australia ([email protected]);
2University of Queensland, Brisbane, QLD 4072, Australia ([email protected]);3Melaleuca Crocodile Farm, PO Box 1298, Mareeba, QLD 4880, Australia ([email protected])
Bioelectrical Impedance Analysis (BIA) technology has been used to assess the body composition of humans innutritional-related studies for over 30 years. BIA is safe, rapid, accurate, non-invasive, portable and inexpensive. Itworks on the principal that the body is essentially composed of two compartments: a lean compartment that containsall the water and conducting electrolytes, and a fat compartment that contains little water and is non-conducting. Inthis study, a low-frequency, fixed current was passed through the body and a value for impedance (Z) is calculated.This value, combined with the crocodile’s length and weight, allowed the calculation of the animal’s total body water(TBW). However, BIA does not measure actual fat levels in the body and instead uses TBW, which is a good estimateof lean body mass. The BIA spectrometer was calibrated for use with crocodiles using twenty crocodiles that rangedin age and size. An independent measurement of TBW using tritiated water, combined with impedance measurements,the animal’s length and weight and carcass analysis, was used to develop a prediction formula that was then programmedinto the BIA spectrometer. BIA could be an effective tool in developing manufactured feed for crocodiles by assessingthe condition of animals trialling different feeds, since this technology is capable of measuring changes in bodycondition of individuals or groups of animals over time.
Development of Electrical Stunning Equipment for Farmed Crocodiles
Stephen K.J. Peucker1, Rob H. Jack1, Bernie M. Davis1 and Ian Graham2
1Agency for Food and Fibre Sciences, Department of Primary Industries and Fisheries,PO Box 1085, Townsville, QLD 4810, Australia ([email protected]);
2Electrician, PO Box 858, Atherton, QLD 4883, Australia
The development of electrical stunning equipment to capture farmed estuarine crocodiles has occurred over the lastfive years. The equipment was developed to address two primary considerations, the safety and well-being of farmworkers and the welfare of the crocodile. Initially the equipment comprised of two units, one unit that operated offmains power, the other a portable unit in the form of a belt pack. The stunning wand was made from PVC pipingwhich had a rubber belt running through the middle of the wand, which allowed the crocodiles to be dragged out ofthe water once they had been stunned. The equipment has been refined over time with the original operating unitsbeing replaced with a backpack unit housed in a clear Perspex box. This unit is fully waterproof and will float ifdropped into water. Crocodiles easily damaged the original wands during capture. In an attempt to remedy this,wands have been manufactured from stainless steel pipe. A junction box at the top of the wand delivers power viatwo 3/16 shrink-wrapped stainless steel rods connected to electrodes at the head of the stunning wand. A push buttonswitch supplies power to the equipment.
421
CrocProfit
Bill Johnston 1, Steve K.J. Peucker2, Rob H. Jack2 and Bernie M. Davis2
1Rural Industry Business Services, Department of Primary Industries and Fisheries,GPO Box 46, Brisbane, QLD 4001, Australia ([email protected]);
2Agency for Food and Fibre Sciences, Department of Primary Industries and Fisheries, PO Box 1085,Townsville, QLD 4810, Australia ([email protected])
CrocProfit is a complete information package for crocodile farmers and potential investors. The CD also containsreference material and a comprehensive list of contacts for related State Governments and industry associations forany questions or assistance that you may require.
In conjunction with the reference material, the farm model provided allows you to evaluate the economics of crocodilefarming, using your own input parameters, before any investment or construction occurs.
The model covers all aspects of farming in a comprehensive fashion. The model is based upon the cost-benefitanalysis technique. Cost-benefit analysis is a conceptual framework for the economic evaluation of projects, in thiscase, crocodile farming projects. This approach differs from financial appraisal in that it considers all gains andlosses. The basic premise of cost-benefit analysis is to assist you to make a decision in regard to the allocation ofresources. In particular, CrocProfit helps you to make decisions about whether or not to invest in crocodile farming.
Existing farmers can also use CrocProfit. Once the data is entered into the model a farmer can use the computerversion of his farm to determine the impact of different management decisions. For example, the farmer may wish toknow how introducing new diets will effect annual production and profitability.
The model is easy to operate. It is simply a matter of entering data into the input cells of the model you have selected.It is better to be as accurate as possible with data entry in order to get the best possible results.
Risk analysis is also included to ensure that all possible economic outcomes are considered. The model provides astatic figure on the summary page (annual return). When probabilities (uncertainty) are added to production andprice the range of economic outcomes are delivered (cumulative probability distribution). Investors or potentialfarmers must accept that they can receive a wide range of returns (including negative ones).
Once all the data is entered into the model you can view the summary statistics for the farm. All the statistics used areexplained in the model itself. Basically, the farm is run over a 20-year period. The output includes the expectedannual returns, when the farm is paid off and the interest rate at which you can borrow funds to invest in the project.The summary statistics will also provide a break down of costs on a per animal basis.
The models are set up in Microsoft Excel as a spreadsheet. All the sheets contained in the model are labelled for easyreference and there are buttons in the menu for easy movement between sections.
The basic premise for the operation of the model is that there are two types of cells; the “data entry cell” and the “datasecured cell”. The yellow cells represent data entry cells that allow you to enter data. The red cells are locked becausethey contain calculated answers.
Data entry cell
Data secured cell
CrocProfit is available from DPIF at a cost of $AU220 (GST inclusive) by phoning the DPI Call Centre on 13 25 23(local call within Queensland) or 1800 816 541 (within Australia) or +61 7 3239 3163 (overseas), email“[email protected]” or go to the DPI website www.dpi.qld.gov.au.

422
A Parentage Determination Kit for Saltwater Crocodiles
Sally R. Isberg1, Y. Chen1, Stuart G. Barker2 and Chris Moran1
1 ReproGen, Faculty of Veterinary Science, University of Sydney, NSW 2006, Australia([email protected]);
2Janamba Croc Farm, PO Box 496, Humpty Doo, NT 0836, Australia
Fifteen microsatellite loci were evaluated in farmed saltwater crocodiles for use in parentage testing. One marker(C391) could not be amplified. For the remaining fourteen, the number of alleles per locus ranged from 2 to 16, andthe observed heterozygosities ranged from 0.219 to 0.875. The cumulative exclusion probability for all fourteen lociwas 0.9988. The eleven loci that showed the greatest level of polymorphism were used for parentage testing with anexclusion probability of 0.9980. Using these eleven markers on 107 juveniles from 16 known-breeding pairs, a 5.6%pedigree error rate was detected. This level of pedigree error, if consistent, could have an impact on the accuracy ofgenetic parameter and breeding value estimation. The usefulness of these markers was also evaluated for assigningparentage in situations where maternity and/or paternity may not be known. In these situations, a 2% error in parentageassignment was predicted. It is therefore recommended that more microsatellite markers be used in these situations.The use of these microsatellite markers will broaden the scope of a breeding program allowing progeny to be testedfrom adults maintained in large breeding lagoons for selection as future breeding animals.
Developing Crocodilian Education in Public Schools
Harold E. Nugent
Paynes Prairie Preserve , State Park and Lower Suwannee and Cedar Keys, National Wildlife Refuges,6406 NW 36th Terrace, Gainesville, Florida 32653, USA
The overriding purpose of this poster presentation is to help presenters increase public school students’ understandingand appreciation of crocodilians by making effective classroom presentations. This poster consists of two panelspresenting an overview of the following concepts: The first panel presents the process by which three entities: thelocal, the scientific, and the school communities can collaborate in constructing and presenting meaningfulenvironmental education. The Local Community with its special needs determines the content and approach. TheCrocodile Specialist Group provides the scientific knowledge. The State Department of Education contributes theappropriate standards, objectives, and curriculum format. Venn diagrams illustrate how the Interpretive Approachand the Cognitive Approach can be integrated using the student’s four Learning Styles. The second panel presentsexamples of twelve intellectual strategies as they are applied to the study of crocodilians. These strategies are basicto effective writing, critical thinking, and problem solving. Each strategy on the poster is accompanied with a crocodilianphoto illustrating its use. A number of handouts and resource bibliographies will be available as well as modelenvironmental curriculum guides from successful programs found in Refuges and Parks around the U.S. and Cuba.

423
Improved Quality of Australian Crocodile Skins (C. porosus)
Stephen C. Hawkins and Chi P. HuynhCSIRO Textile and Fibre Technology
Crocodile skins can be fairly accurately graded at all stages of processing, hence faults such as brown spot andscarring that impact upon the final leather value result in a large reduction in the raw skin value. Faults arise frompoor husbandry, butchering and preservation. The opportunity for improvement in skin quality ceases at the point ofslaughter so husbandry should aim to have quality peaking at that point. Animals with skins that are less than firstgrade should be assessed for their potential and retained, if suitable, until first grade is achieved. Competent butcheringand effective preservation will then ensure maximum return.
Faults due to poor preservation are very common within the industry, resulting in scale slip, grain damage and loss ofstrength. Salt alone is not sufficient to protect skins for an extended period of time from bacteria, including red heat,and fungi. As an aid to determining the significance of faults seen on the live animal, marks and damage that areobservable on the raw skin have been photographed and tracked through to finished leather. It has been found thatsome apparently minor brown spot infections can cause major pitting of the leather grain, whilst severe scale erosionmay not affect the finished leather. Partially regrown scales often appear as crescents (double scaling’) on the leather,and faint scars may also show up very clearly.
This project, to improve the quality of Australian Saltwater Crocodile (Crocodylus porosus) skins is jointly supportedby CSIRO and RIRDC (Rural Industries Research and Development Corporation), in collaboration with KooranaCrocodile Farm, Rockhampton, Queensland.

424
Persistent Organic Pollutants in Eggs of the Saltwater Crocodile fromTropical Australia: a Preliminary Survey
Bob Packett1, Phillip Ford2, John Lever3, Adam Britton4, Charlie Manolis4,Rob Bredl5 and Steve Watson6
1 Cooperative Research Centre for Coastal Zone, Estuary and Waterway Management, PO Box1762, Rockhampton, QLD 4700, Australia ([email protected]); 1,2 CSIRO Land andWater, PO Box 1666, Canberra, ACT 2601, Australia ([email protected]); 3Koorana Crocodile
Farm, 65 Savages Road, Coowonga, QLD 4700, Australia; 4Wildlife Management International, POBox 530, Sanderson, NT 0812, Australia; 5Wildlife Park, Shute Harbour Road, Airlie Beach, QLD 4802
Australia; 6Proserpine River Eco Tours, PO Box 568, Airlie Beach, QLD 4802, Australia
Abstract
Nonviable eggs (n= 23) of the Saltwater Crocodile (Crocodylus porosus) were collected from three sites across thetropics of Northern Australia and analysed for persistent organic pollutants (POPs) over the 2002 to 2004 summerbreeding seasons. The p,p-DDT metabolite p,p-DDE was found to be the most prevalent contaminant for all sites.Residues of p,p-DDE in eggs collected from Queensland nests ranged from a mean of 45 ppb for Proserpine River(n= 2) to 156 ppb for the Fitzroy River (n= 6), while residues in Northern Territory eggs had a mean of 31 ppb (n= 6).All eggs analysed (from all sites) had detectable residues of p,p-DDE. A number of eggs was also contaminated byother persistent pollutants at trace levels. The survey was conducted to gain an understanding of the bioaccumulationof POPs in several Australian coastal ecosystems and compliments similar recent studies for the Central Americanregion where comparable concentrations were detected in crocodilian eggs. The results will provide information forwild crocodile management issues concerned with toxicology and infer that the species is a valuable long-termindicator of ecosystem health and contaminant exposure. Suggestions for future Australian work are given.
Introduction
Persistent organic pollutants (POPs) are those chemicals that are resistant to degradation in the environment underambient conditions and bioaccumulate in food chains via their solubility in the lipids of organisms. In addition, manyare capable of long-range transport due to their vapor pressure and partitioning characteristics. Concerns over theglobal distribution of POPs has led to recent studies aimed at bioaccumulation of PCBs and organochlorines (OCs)in particular (Kalantzi et al. 2001; Smith 1999). The discovery and widespread application of the long-lived OCpesticides such as DDT, Dieldrin, Aldrin, and persistent non-organochlorine compounds such as Endosulfan hasbeen of great benefit to agriculture and public health. However, the particular properties of these materials such astheir persistence, and their fat solubility which contribute, in part, to their utility has lead to them being almostuniversally distributed throughout the ecosphere.
Recent work on bioaccumulation in top level predators suggest that some of these materials have pseudo endocrineactivities in alligators (Guillette et al. 1995, 2000; Lind et al. 2004). Much of this work relies, in part, on specimenstaken from Lake Apopka in Florida, USA. This Lake was highly contaminated in 1980 by a chemical spill of dicofol,DDT and sulphuric acid (Matter et al. 1998) and the question arises whether comparable levels of OC contaminationand bioaccumulation occur in other environments, and if species other than the American alligator (Alligatormississippiensis) are subject to the same effects. Alligators, with crocodiles, caimans, and gharials, make up thecrocodilians. They all share the same characteristics of being long-lived top-level predators in tropical and semi-tropical aquatic systems and are frequently highly territorial.
Many species of crocodilians seem to be undergoing a population decline worldwide, though this may merely reflecthabitat destruction or increased hunting pressures rather than a widespread impact of endocrine disrupting chemicals.Morelet’s crocodile (C. moreletti) occurring in Belize, Guatemala, and Mexico is considered to be an endangeredspecies by the IUCN - World Conservation Union and is listed on Appendix I of CITES. Using crocodile eggscollected from two lagoons in northern Belize, Wu et al. (2000a) showed that Morelet’s Crocodiles in these two

425
environments had been exposed to organochlorine compounds and that such an “ exposure may represent a healththreat to populations of crocodiles in central America”. In a closely related examination of eggs from Morelet’sCrocodile (C. moreletii) and the American Crocodile (C. acutus) from southern Belize and the coastal zones ofBelize respectively, Wu et al. (2000b) demonstrated the presence of p,p-DDE, a degradation product of DDT as wellas DDT and p,p-DDD another metabolite of DDT.
In contrast, in Australia, where the non-traditional hunting pressure on the Saltwater Crocodile (C. porosus) has beenremoved, the population has rebounded, and they can at times constitute a nuisance species that has to be relocatedfrom areas where the potential for fatal human-crocodile contact (for the humans) exists. Worldwide there have beenat least 6 investigations into the occurrence of organochlorines in the flesh of various crocodilians (Best 1973a,1973b; Vermeer et al. 1974; Wheeler et al. 1977; Matthiesen et al. 1982; Delany et al. 1988; Phelps et al. 1989) andmore limited investigations of the organochlorine content in crocodile eggs (Wessels et al. 1980; Phelps et al. 1986;Heinz et al. 1991; Skaare et al. 1991; Wu et al. 2000a, 200b).
The only measurements on OCs in both Freshwater and Saltwater Crocodile eggs from Australia (Best 1973) predatethe prohibition on the widespread use of DDT which was phased out for general use around the early 1980s. Wereport on persistent organic pollutants in wild and farmed crocodile eggs collected in Queensland and the NorthernTerritory of Australia in order to contribute to the knowledge base for these chemicals in crocodilians in the southernhemisphere. In addition, we point to the advantages of using nonviable C. porosus. eggs as a convenient, low impactand reliable method of assessing bioaccumulation of POPs in the environment.
Materials and Methods
Egg Collection
Nonviable C. porosus eggs were collected during 2002, 2003 and 2004 from 3 sites across tropical Australia. Not allsites were sampled in all years, farmed eggs from Crocodylus Park in the Northern Territory and Koorana CrocodileFarm in Queensland were only sampled during 2002. Collection sites are shown in Figure 1.
Figure 1. Collection locations of nonviable C. porosus eggs during 2002-2004 survey.

426
Location 1 included collections from Melacca Swamp (mostly fresh - near coast) and from the Adelaide Riversystem (tidal). The Adelaide system has an approximate area of 4400 km2 and the major land use is cattle grazingwith limited areas of agriculture. The Proserpine River location (tidal) has a drainage area of around 550 km2 withgrazing in the upper catchment and sugar cane cultivation in the lower reaches.
The Fitzroy River location consists of a series of large water holes in the fresh water system around 100 km upstreamof tidal influences, it has a catchment area of around 142,600 km2 and has grazing as the main land use with substantialdry land and irrigated agriculture.
The Fitzroy River in Queensland is considered the southern breeding limit for C. porosus. All the above sites arelisted in the Department of Environment and Heritage directory of Important Wetlands in Australia. Eggs werelabeled, frozen, packaged and transported (chilled) to the Queensland Health Scientific Services laboratories inBrisbane, Queensland, for analysis a range of persistent and non-persistent pollutants.
Extraction and Analysis of Egg Residues
Analysis of shell-free wet egg contents were performed at the National Association of Testing Authorities Australia(NATA) certified laboratories of Queensland Health Scientific Services in Brisbane via quality assured procedures.The laboratory regularly conducts analyses for contaminant residues in food products including hen eggs as part ofan ongoing Australian standards program. Basically, the contents of an egg were blended and approximately 5 gtaken for analysis and accurately weighed, results are calculated on a wet basis. The sub-sample was mixed withanhydrous sodium sulphate until a free flowing powder was obtained. Extraction was via acetone solvent. Finally,Gel Permeation Chromotography (GPC) and Florisil cleanup steps followed by Gas Chromatography/MassSpectrometry (GC/MS) were used for determination of contaminant types and amounts. The analysis covered a widespectrum of common environmental contaminants with 184 chemical species including OCs, OP’s, and otherinsecticides, herbicides, fungicides (i.e. common pesticides) included. In addition, some eggs (2003 collections)were screened for the following PCB congeners (confined to those commonly associated with Arachlor residues)IUPAC 1, 5, 18, 28, 31, 52, 44, 66, 101, 87, 110, 118, 151, 149, 153, 141, 138, 183, 180, 170, 194 and 206. A similarand more in-depth description of the methodology for the isolation of organochlorine and organophosphorus residuesfrom hen eggs ( Schenck and Donoghue 2000) can be readily applied to crocodile eggs. Eggs were not analysed forheavy metals or dioxins.
Results
A total of 23 eggs from both captive and wild Saltwater Crocodiles ( C. porosus ) were examined . Organochlorineresidues were found in all eggs (Table 1). The concentrations of DDE ranged from 2 to 350 ppb and the highestconcentrations were in the eggs from the freshwater reach of the Fitzroy River upstream of Rockhampton, Queensland.DDE concentrations in eggs taken from captive animals were at the lower end of the range and were comparable tothe lower concentrations seen in the Northern Territory wild samples from the Adelaide River and Melacca Swampin 2003. The concentrations of DDD another metabolite of DDT, and of DDT itself were always lower than the DDEconcentrations in the same egg. Analysis of nest material (Proserpine Site 2003) showed nil concentrations (by ourmethods) of DDT metabolites thus providing confidence that the eggs had not been contaminated by nest material(Canas and Anderson 2002) and that the measured concentrations in the eggs reflected the maternal body burden ofDDE and were not an artefact. A comparison of mean concentrations of DDE found in eggs from the three locationsis shown in Figure 2.
Concentrations of Heptachlor epoxide and Dieldrin were always less than 10 ppb (Table 1). Numerous PCB congenerswere detected in the various samples though they seemed to be heterogeneous with respect to their content of thevarious congeners. That is, there was no constant ratio between the different congeners suggesting that there must be,at least several different sources each with its own characteristic mixture of congeners. Tri-n-butyl phosphate wasdetected in the Northern Territory samples together with DEET. This is the active ingredient of various insect repellentproducts and suggests that the whole area has been contaminated by this widely used material.
Discussion
Our results show a wide range of DDE concentrations in the eggs of the Saltwater Crocodile collected in a range ofhabitats in Queensland and the Northern Territory, Australia. The average concentration (56 ppb; standard deviation97 ppb) does not differ significantly from the average value (68 ppb; 86 ppb) for the most extensive other set of data

427
Location - site - Date
DDT DDD DDEHeptachlor
Epoxide
tri n-butylphosphate Dieldrin DEET 118 138 141 149 153 180
Northern Territory (2002)Captive ND ND Trace ND ND ND ND NA NA NA NA NA NA
Wild ND ND 7 ND ND ND ND NA NA NA NA NA NA
Northern Territory (2003)Adelaide River nest 1 ND ND 12 ND ND 5 Trace NA NA NA NA NA NA
Adelaide River nest 2 ND ND 17 ND ND ND ND NA NA NA NA NA NA
Adelaide River nest 3 ND ND 12 7 ND ND ND NA NA NA NA NA NA
Adelaide River nest 4 ND ND 9 ND ND ND ND NA NA NA NA NA NA
Adelaide River nest 5 Trace ND Trace ND ND Trace ND NA NA NA NA NA NAAdelaide River nest 6 ND ND Trace ND ND ND 8 NA NA NA NA NA NA
Adelaide River nest 7 ND ND Trace ND Trace ND ND NA NA NA NA NA NA
Melacca swamp nest 1 ND ND Trace ND ND ND Trace NA NA NA NA NA NA
Melacca swamp nest 2 ND ND 86 ND ND ND ND NA NA NA NA NA NA
Melacca swamp nest 3 ND ND 17 ND ND ND ND NA NA NA NA NA NAMelacca swamp nest 4 ND ND 41 ND ND ND ND NA NA NA NA NA NA
Queensland
Proserpine River (2003)Nest 1a ND ND 45 Trace ND ND ND ND Trace ND ND Trace Trace
Nest 1b ND ND 42 ND ND ND ND ND ND ND ND Trace NDNest material ND ND ND ND ND ND ND ND ND ND ND ND ND
Fitzroy River
Koorana Farm (2002) ND ND 7 8 ND ND ND ND ND ND ND ND NDFitzroy nest 1 (2003)a ND ND 74 ND ND ND ND ND ND Trace Trace Trace Trace
Fitzroy nest 1 (2003)b ND ND 81 ND ND ND ND ND ND ND ND ND ND
Fitzroy nest 2 (2003)a Trace Trace 310 ND ND ND ND Trace ND ND ND Trace TraceFitzroy nest 2 (2003)b Trace Trace 350 ND ND ND ND Trace ND ND ND Trace ND
Fitzroy nest 1 (2004) RP RP 60 ND ND ND ND RP RP RP RP RP RPFitzroy nest 2 (2004) RP RP 60 ND ND ND ND RP RP RP RP RP RP
PCB congenersContaminant residues in C. porosus eggs expressed as ppb
Table 1. Persistent pollutant residues detected in C. porosus eggs. NA= not analysed for contaminant;ND= not detected; Trace = below level of reporting (5 ppb) but detected; RP= results pending.
covering both the American Alligator and Morelet’s Crocodile in Belize (Wu et al. 2000b). The range of concentrationswas virtually identical in the two cases. DDT concentrations were always much less than DDE concentrations in thesame eggs when DDT could be detected. This suggests that the primary route for DDE contamination of SaltwaterCrocodile eggs in Australia is via maternal consumption of DDE contaminated prey rather than by ingestion of preywhich is primarily contaminated by DDT, and this is subsequently metabolised within the mother to DDE. The DDEin the environment arises from bacterial and other metabolism of DDT released some time in the past and the resultsimply that there are few if any actual fresh DDT releases. The highest concentrations of DDE were found in eggs
Mean DDE concentration in Saltwater Crocodile eggs(only for results above 10 ppb i.e. 14 of 23 total)
0
20
40
60
80
100
120
140
160
180
Adelaide River(n=6)
Proserpine River(n=2)
Fitzroy River(n=6)
Mea
n D
DE
(p
pb
)(b
ased
on
sh
ell f
ree
wet
wei
gh
t)
Figure 2. Mean DDE concentration in eggs by collection location.
428
from the Fitzroy River system downstream of several irrigated agricultural areas, the DDE was most likely transportedattached to soil particles from these areas.
There appears to be a high correlation of DDE concentration in eggs sampled from the same nest. Further work toverify this may lead to some confidence in sampling a single egg from an individual nest leading to more efficientsurvey strategies in the future.
A survey of the global distribution of POPs (Smith 1999) found that Australian butter (n= 9 samples) had a DDEconcentration of around 12 ppb. In a similar study into DDT in human breast milk Kalantzi et al. (2001) found thatwhole breast milk from Australia (n= 14) had around 42 ppb DDE. Both studies suggest that long range atmospherictransportation of DDT and DDE could be involved in the concentration found in milk fat. Long range transport anddeposition from other countries where DDT is still in use may be a source for DDE in river sediments via fluvialconcentration in large catchments similar to the Fitzroy basin.
Therefore there may be two separate sources for DDE contamination in C. porosus eggs, a supply from historical usein the catchment via agriculture and grazing, and another via aerial deposition originating from other countries. Wesuggest that further work is required concerning contaminants in nonviable crocodile eggs in tropical Australia. Amore general sampling approach aimed at assessing levels over the entire range for C. porosus and C. johnstoni(freshwater crocodile) in Australia will provide valuable information on the bioaccumulation of persistent organicpollutants in the environment. It would also be useful to develop an international strategy for sampling variouscrocodilian eggs on a global scale using common protocols. This would enable comparisons to be made betweengeographically isolated populations in regard to persistent pollutant exposure and bioaccumulation. The informationgained in such an exercise may be important for crocodilian conservation in the future and for ecotoxicology ingeneral.
Acknowledgements
We gratefully acknowledge the assistance of Queensland National Parks and Wildlife officers in Rockhampton andShute Harbour in securing the various permits required for the collection of eggs. We would also like to thank thestaff of Queensland Health Scientific Services Laboratories in Brisbane for their assistance and professional service.
Literature
Best, S.M. (1973). Some organochlorine pesticide residues in wildlife of the Northern Territory, Australia, 1970-71.Australian Journal of Biological Sciences 26: 1161-1170.
Canas, J.E. and Anderson, T.E. (2002). Organochlorine contaminants in eggs: influence of contaminated nest material.Chemosphere 47: 585-589.
Delany, M.F., Bell, J.U. and Sundlof, S.F. (1988). Concentrations of contaminants in muscle of the American alligatorin Florida. Journal of Wildlife Diseases 24: 62-66.
Guillette, L.J. Jnr., Pickford, D.B., Cain, D.A., Rooney, A.A. and Percival, H.F. (1996). Reduction in penis size andplasma testosterone concentrations in juvenile alligators living in a contaminated environment. General andComparative Endocrinology 101: 32-42.
Guillette, L.J. Jnr., Crain, D.A., Kools, M.P., Milnes, M.R., Orlando, E.F., Rooney, A.A. and Woodward, A.R. (2000).Alligators and endocrine disrupting contaminants: A current perspective. American Zoologist 40: 438-452.
Heinz, G.H., Percval, H.F. and Woodward, A.R. (1991). Contaminants in American alligator eggs from Lakes Apopka,Griffin, and Okeechobee, Florida. Environmental Monitoring and Assessment 16: 277-285.
Kalantzi, O.I., Alcock, R.E., Johnston, P.A., Santillo, D., Stringer, R.L., Thomas, G.O. and Jones K.C. (2001). Theglobal distribution of PCBs and organochlorine pesticides in butter. Journal of Environmental Science andTechnology 35(6): 1013-1018.
429
Lind, P.M., Milnes, M.R., Lundberg, R.D., Bermudez, Orberg, J. and Guillette, L.J. Jr. (2004). Abnormal bonecomposition in female juvenile American Alligators from a pesticide-polluted lake (Lake Apopka, Florida).Environmental Health Perspectives 112(3): 359-362.
Matter, J.M., Crain, D.A., Sills-McMurray, C., Pickford, D.B., Rainwater, T.R., Reynolds, K.D., Rooney, A.A.,Dickerson, R.L. and Guillette, L.J. Jnr. (1998). Effects of endocrine disrupting contaminants in reptiles: alligators.In Principles and Processes for Evaluating Endocrine Disruption in Wildlife, ed. by R.J. Kendall, R.L. Dickerson,Giesy, J.P. and W.K. Suk. SETAC Press: Pensacola, Florida.
Matthiessen, P., Fox, P.J., Douthewaite, R.J. and Wood, A.B. (1982). Accumulation of endosulfan residues in fishand their predators after aerial spraying for the control of tsetse fly in Botswana. Pesticide Science 13: 39-48.
Phelps, R.J., Focardi, S., Fossi, C., Leonzio, C. and Renzoni, A. (1986). Chlorinated hydrocarbons and heavy metalsin crocodile eggs from Zimbabwe. Transactions of the Zimbabwe Scientific Association 63: 8-15.
Phelps, R.J., Toet, M. and Hutton, J.M. (1989). DDT residues in the fat of crocodiles from Lake Kariba, Zimbabwe.Transactions of the Zimbabwe Scientific Association 64: 9-14.
Schenck, F.J. and Donoghue, D.J. (2000). Determination of organochlorine and organophosphorus residues in eggsusing a solid phase extraction cleanup. Journal of Agricultural and Food Chemistry 48: 6412-6415.
Skaare, J.U., Ingebrigtsen, K., Aulie, A. and Kanui, T.I. (1991). Organochlorines in crocodile eggs from Kenya.Bulletin of Environmental Contamination and Toxicology 47: 126-130.
Smith, D. (1999). Worldwide trends in DDT levels in human breast milk. International Journal of Epidemiology 28:179-188.
Vermeer, K., Risebrough, R.W., Spaans, A.L. and Reynolds, L.M. (1974). Pesticide effects on fishes and birds in ricefields of Surinam, South America. Environmental Pollution 7: 217-236.
Wessels, C.L., Tannock, J., Blake, D. and Phelps, R.J. (1980). Chlorinated hydrocarbon insecticide residues inCrocodilus niloticus Laurentius eggs from Lake Kariba. Transactions of the Zimbabwe Scientific Association 60:11-17.
Wheeler, W.B., Jouvenaz, D.P., Wojick, D.P., Banks, W.A., van Middelem, C.H., Lofgren, C.S., Nesbit, S., Williams,L. and Brown, R. (1977). Mirex residues in nontarget organisms after application of 10-5 bait for fire ant control,northeast Florida 1972-74. Pesticides Monitoring Journal 11: 146-156.
Wu, T.H., Rainwater, T.R., Platt, S.G., McMurry, S.T. and Anderson, T.A. (2000a). Organochlorine contaminants inMorelet’s crocodile (Crocodylus moreletii) eggs from Belize. Chemosphere 40: 671-678.
Wu, T.H., Rainwater, T.R., Platt, S.G., McMurry, S.T. and Anderson T.A. (2000b). DDE in eggs of two crocodilespecies from Belize. Journal of Agricultural and Food Chemistry 48: 6416-6420.
430
Population Status and Future Management of Crocodylus niloticus(Nile Crocodile) at Lake Sibaya, South Africa
Xander Combrink1, J. Perran Ross2 and Jan L. Korrûbel3
1Ezemvelo KZN Wildlife, Private bag X1, St Lucia, 3936, and Centre for Environment andDevelopment, University of KwaZulu-Natal, South Africa; 2Florida Museum of Natural History,
University of Florida, Box 117800, Gainesville, FL 32611, USA; 3Centre for Environment andDevelopment, University of KwaZulu-Natal, Pvt. Bag X01, Scottsville 3209, Pietermaritzburg,
South Africa
Introduction
The Greater St Lucia Wetland Park (GSLWP) is one of the most important areas in South Africa for the conservationof Crocodylus niloticus. The largest freshwater system within the GSLWP, Lake Sibaya, hosts the second largestcrocodile population in the Park. Research from the late 1950s suggested that crocodiles were abundant at LakeSibaya; yet only 67 were counted during the first aerial survey in 1985. Subsequent aerial surveys indicated anincrease in the population during the following five years, with some 107 crocodiles counted in 1990. Concerns overthe current population status, breeding component and future of crocodiles at Lake Sibaya, led to aerial and spotlightcounts, nesting surveys and the identification of potential breeding areas from February 2003 to January 2004.
Study Area
Lake Sibaya, South Africa’s largest freshwater lake is located between Kosi Bay and the St Lucia estuary, on theseaward margin of the low-lying Moçambique Coastal Plain (refer to Figure 1). It also forms part of the Greater StLucia Wetland Park, South Africa’s first World Heritage Site. The area is a transitional zone between a tropical andsub-tropical climate, forming the southernmost limit for a number of tropical species, resulting in an area rich inbiological diversity.
Methodology
• Literature review of crocodilian survey and monitoring techniques• Aerial surveys (microlight)• Spotlight surveys (boat and foot)• Nesting surveys for the 2002/3 and 2003/4 breeding seasons• Identification of potential nesting areas
Results
Figure 2 indicates the aerial (1985-2003) and spotlight (2003) counts for the total number of crocodiles counted atLake Sibaya and surrounding wetlands. The combination of clear water with sparsely vegetated and exposed shorelines,favours aerial surveys for large parts of the lake, although most of the channels with dense reed beds are subjected tohigh levels of visibility bias if only surveyed from the air. This is reflected in the spotlight counts, which resulted ina 72% increase in the density of crocodiles (excluding hatchlings), as well as a better representation of smaller sizeclasses. Please note that during the following years no surveys were conducted: 1989, 1991, 1992, 1994-2002.
Figure 3 indicates the decrease in the population at Lake Sibaya is accompanied by an apparent decrease in breedingsuccess. During the 1970 nest survey, 30 crocodile nests were found. This decreased to three nests found during the2002/3 survey and not a single nest was found during the 2003/4 survey. Please note that during the following yearsno surveys were conducted: 1972-1975, 1977-1985 and 1992-2002.
Figure 4 illustrates the spatial distribution of 36 crocodiles counted during the aerial survey, 65 counted during thespotlight surveys, three nests found during the 2002/3 survey (no nest were found during the 2003/4 survey) andpotential nesting areas in the Lake Sibaya system. Due to the low number of crocodiles and their uneven distributionin the Lake Sibaya system, all surveys were “total surveys”, covering the total 137.3 km shoreline.
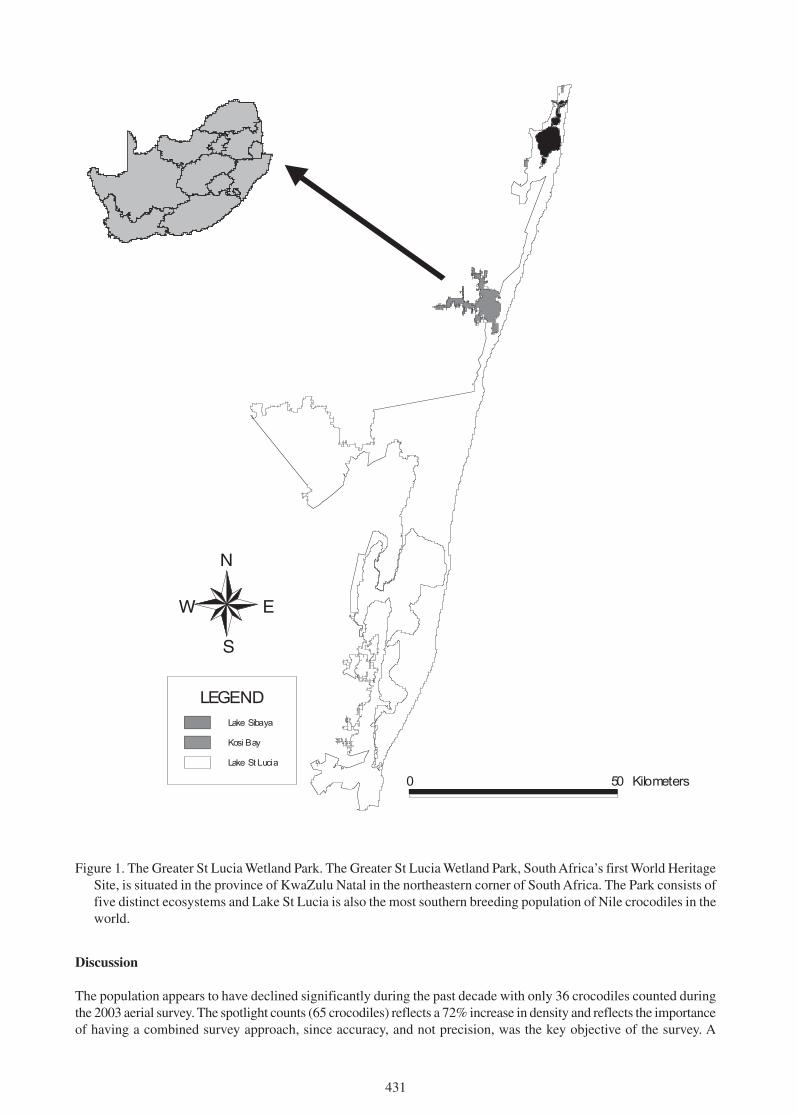
431
N
EW
S
Lake Sibaya
Kosi Bay
Lake St Lucia
LEGEND
0 50 Kilometers
Figure 1. The Greater St Lucia Wetland Park. The Greater St Lucia Wetland Park, South Africa’s first World HeritageSite, is situated in the province of KwaZulu Natal in the northeastern corner of South Africa. The Park consists offive distinct ecosystems and Lake St Lucia is also the most southern breeding population of Nile crocodiles in theworld.
Discussion
The population appears to have declined significantly during the past decade with only 36 crocodiles counted duringthe 2003 aerial survey. The spotlight counts (65 crocodiles) reflects a 72% increase in density and reflects the importanceof having a combined survey approach, since accuracy, and not precision, was the key objective of the survey. A

432
correction factor of 1.72 was calculated for future aerial surveys, based on the spotlight counts. Using Magnusson etal. (1977) double-count technique for two independent counts (in this case aerial and spotlight), the population isestimated to be 112 crocodiles with a variance of 22.49 and standard error of 4.47.
It seems like the decrease in breeding at Lake Sibaya could be a result of high levels of disturbance by subsistencefisherman and pressure from herds of drinking cattle at historical as well as potential nesting areas. Sixty-five potentialnesting areas have been identified (refer to Figure 4) and evaluated in terms of their importance both from a species(Nile Crocodile) and community perspective. These areas will form part of an overall strategy to actively conservesome key breeding areas at Lake Sibaya.
Conclusions
Despite legal protection and World Heritage Site status, the population is clearly under threat as a result of poachingand increase disturbance of nesting areas. The survival of crocodiles at Lake Sibaya might only be possible throughthe establishment of a joint management partnership between the conservation agency and the local communitywhere the protection of crocodiles and nesting areas will benefit the community. The alternative is the likely extinctionof this top predator from the largest freshwater ecosystem in South Africa’s first World Heritage Site.
6775
62
92
107
52
36
65
0
20
40
60
80
100
120
Jul'85
Jul'86
Jul'87
Jul'88
'89 Jul'90
'91 '92 Sep'93
'94 '95 '96 '97 '98 '99 '00 '01 '02 Aprl'03
Aprl'03
Year
No
of
cro
co
dile
s
Spotlight count
Figure 2. Aerial (1985-2003) and spotlight counts (2003) at Lake Sibaya.
30
12
56
23
6 6
43
00
5
10
15
20
25
30
'70 71 '72 '73 '74 '75 '76 '77 '78 '79 '80 '81 '82 '83 '84 '85 '86 '87 '88 '89 '90 '91 '92 '93 '94 '95 '96 '97 '98 '99 '00 '01 '02 '03 '04
No
of
cro
cod
ile n
est
s
Year
Figure 3. Nesting surveys (1974-2004) at Lake Sibaya.
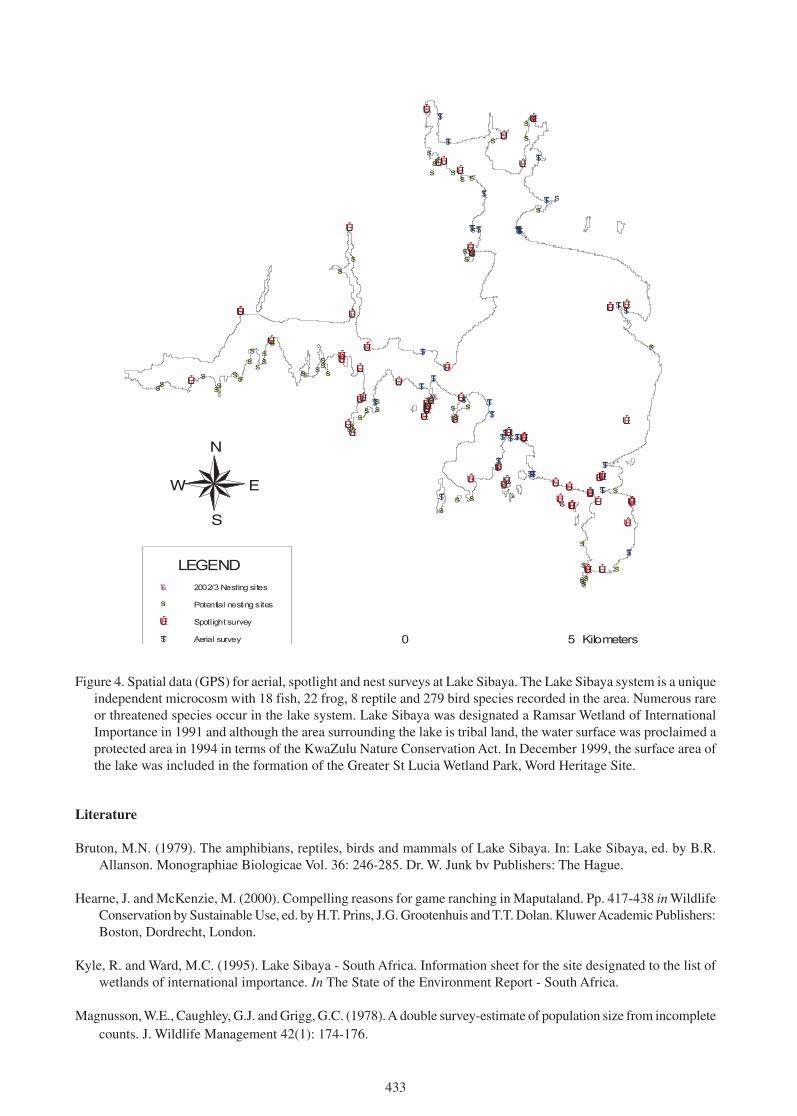
433
$T
$T
$T$T
$T$T
$T
$T
$T
$T$T
$T
$T
$T
$T
$T
$T
$T$T$T$T
$T$T
$T
$T
$T
$T$T
$T$T $T$T
$T$T
ÊÚÊÚ ÊÚÊÚÊÚ
ÊÚ ÊÚ ÊÚÊÚÊÚ
ÊÚÊÚ ÊÚ
ÊÚ
ÊÚÊÚ
ÊÚÊÚÊÚ
ÊÚ
ÊÚÊÚ ÊÚ
ÊÚÊÚ
ÊÚ
ÊÚ
ÊÚÊÚÊÚÊÚÊÚÊÚ
ÊÚ
ÊÚ
ÊÚ
ÊÚ
ÊÚÊÚ
ÊÚÊÚ
ÊÚ
ÊÚÊÚ
ÊÚÊÚ
ÊÚÊÚ
ÊÚÊÚÊÚ
ÊÚ
ÊÚ
ÊÚ
ÊÚ
ÊÚ
ÊÚ
ÊÚ
ÊÚÊÚÊÚ
ÊÚÊÚ
#S
#S
#S
#S
#S
#S#S
#S#S
#S#S
#S
#S
#S
#S
#S
#S
#S
#S
#S
#S
#S
#S
#S
#S
#S#S
#S
#S#S#S
#S
#S
#S
#S
#S
#S
#S
#S
#S
#S
#S #S
#S
#S
#S
#S
#S
#S
#S
#S
#S
#S
#S
#S
#S#S
#S
#S
#S
#S#S
#S
&\&\
&\
N
EW
S
2002/3 Nesting sites&\
Potential nesting sites#S
Spotlight surveyÊÚ
Aerial survey $T
LEGEND
0 5 Kilometers
Figure 4. Spatial data (GPS) for aerial, spotlight and nest surveys at Lake Sibaya. The Lake Sibaya system is a uniqueindependent microcosm with 18 fish, 22 frog, 8 reptile and 279 bird species recorded in the area. Numerous rareor threatened species occur in the lake system. Lake Sibaya was designated a Ramsar Wetland of InternationalImportance in 1991 and although the area surrounding the lake is tribal land, the water surface was proclaimed aprotected area in 1994 in terms of the KwaZulu Nature Conservation Act. In December 1999, the surface area ofthe lake was included in the formation of the Greater St Lucia Wetland Park, Word Heritage Site.
Literature
Bruton, M.N. (1979). The amphibians, reptiles, birds and mammals of Lake Sibaya. In: Lake Sibaya, ed. by B.R.Allanson. Monographiae Biologicae Vol. 36: 246-285. Dr. W. Junk bv Publishers: The Hague.
Hearne, J. and McKenzie, M. (2000). Compelling reasons for game ranching in Maputaland. Pp. 417-438 in WildlifeConservation by Sustainable Use, ed. by H.T. Prins, J.G. Grootenhuis and T.T. Dolan. Kluwer Academic Publishers:Boston, Dordrecht, London.
Kyle, R. and Ward, M.C. (1995). Lake Sibaya - South Africa. Information sheet for the site designated to the list ofwetlands of international importance. In The State of the Environment Report - South Africa.
Magnusson, W.E., Caughley, G.J. and Grigg, G.C. (1978). A double survey-estimate of population size from incompletecounts. J. Wildlife Management 42(1): 174-176.

434
Effects of Two Different Incubation Media on Hatching Success,Body Mass and Length in Caiman latirostris
Carlos I. Piña1, 2, Melina Simoncini1 and Alejandro Larriera1
1Proyecto Yacaré. Bv. Pellegrini 3100. CP: 3000, Santa Fe, Argentina ([email protected]);2C.I.C y T.T.P. - CONICET/Fac. Cs. y Tec., UAdER. Dr. Matteri y España. CP: 3105,
Diamante, Entre Ríos, Argentina ([email protected])
Since 1990, Proyecto Yacaré (MAGIC/MUPCN) has been developing new technologies and improving/adapting oldones to reduce production costs for the ranching programs in South America. Previous works evaluated growth ratesof Caiman latirostris, the effect of time collection on hatching success, depredation and temperature effects onincubation, but there is no information about incubation media for the species. In this experiment we tested theeffects of two incubation media, vermiculite and grass (‘nesting material’), on hatching success and hatchling size.We collected nine nests (350 eggs) from natural C. latirostris populations in Santa Fe, Argentina, soon after oviposition.In Proyecto Yacaré facilities, each nest was divided in two groups and each one received one of two incubationtreatments (vermiculite or nesting material). We found no difference in hatching success among the treatments (0.89for vermiculite and 0.87 for nesting material). We observed, but did not measure, that incubation with vermiculitetended to be longer, and that hatchlings from this treatment had more unabsorbed abdominal yolk, in all nests used inthe experiment. Hatchlings from nesting material treatment were bigger than vermiculite treatment in length, but wefound no differences between treatments in body mass. As we found similar hatching success in both treatments (butpossibly overestimated in vermiculite), a larger size of hatchlings (which could enhance survivorship as was reportedin lizards and turtles) and lower cost, nesting material is the recommended incubation media. Future investigationsshould address how incubation media might modify hatchling performance.
Desde 1990, e Proyecto Yacaré (MAGIC/MUPCN) está desarrollando nuevas técnicas y mejorando o adaptandootras para reducir los costos de los programas de ranching en Sur América. Trabajos previos evaluaron tasas decrecimiento, el efecto del momento de cosecha en el éxito de eclosión, la predación y el efecto de la temperatura enla incubación, pero no hay información sobre los medios de incubación para Caiman latirostris. En este experimentoanalizamos el efecto de dos medios de incubación, vermiculita y pasto en el éxito de eclosión y el tamaño de losneonatos. Cosechamos nueve nidos (350 huevos) de poblaciones naturales de C. latirostris en Santa Fe, Argentinaluego de la postura. En las instalaciones del proyecto yacare, cada nido fue dividido en dos grupos y a cada uno se leasigno un tratamiento de incubación (vermiculita o pasto). No encontramos diferencias en el éxito de eclosión entrelos tratamientos (0,89 en vermiculita y 0,87 en pasto). Observamos, pero no medimos, que la incubación con vermiculitafue más larga, y que los pichones de este tratamiento tenían más yema sin absorber en todos los nidos. Los pichonesdel tratamiento de pasto fueron más largos pero del mismo peso. Debido a que encontramos un éxito de eclosiónsimilar entre ambos tratamientos (pero posiblemente sobre estimado para la vermiculita), un tamaño mayor de lospichones (que puede mejorar la supervivencia tal cual se reportó para lagartos y tortugas) y el menor costo, el pastoes el medio de incubación recomendado. Próximas investigaciones deberían estudiar como puede modificar el mediode incubación el crecimiento y la supervivencia de los neonatos.
435
Food Conversion Rates of Caiman latirostris Rearedat Two Different Temperatures
V. Parachú1, Carlos I. Piña1,2 and Alejandro Larriera1
1Proyecto Yacaré (MAGIC/MUPCN), Bv. Pellegrini 3100, (3000) Santa Fe, Argentina([email protected]); 2CIC y TTP-CONICET, Proyecto Yacaré, Fac. de Cs. y Tec., UAdER. Dr.
Matteri y España, 3105, Diamante, Entre Ríos, Argentina ([email protected])
Temperature and diet have influence over growth of caimans and crocodilians. Animals maintained at highertemperatures obtained a greater growth and increase of the real food consumption. The objective of this work is toevaluate the efficiency of food conversion in Caiman latirostris at two different temperatures: 29°C and 33°C. In theexperiment we used 68 animals from four different nests, of two month of age, bred in captivity. All the treatmentswere kept under similar conditions of captivity, but temperature. We found differences in body mass and total lengthbetween groups, being bigger those maintained at higher temperature. The greater growth of animals raised at 33°Cwas probably due to the relationship between increasing temperature and its consequently reduction of time toprocess the food, promoting repeated food ingestions. Also, we found a more efficient nutritional conversion rate inanimals kept at 33°C. Lang (1987) reported that the increase of temperature did not increase the amount of energyextracted from food. Nevertheless, that is a possible explication of our results.
Size of Caiman latirostris Eggs and Hatchling Body Size Coming from ThreeDifferent Environments in Santa Fe, Argentina
J.P. Montini1, Alejandro Larriera1, Carlos I. Piña1, 2 and Pablo Siroski1
1Proyecto Yacaré. Bv. Pellegrini 3100. CP: 3000, Santa Fe, Argentina ([email protected]); 2C.I.C yT.T.P.–CONICET/Fac. Cs. y Tec., UAdER. Dr. Matteri y España. CP: 3105, Diamante, Entre Ríos,
Argentina ([email protected])
It is known that Caiman latirostris (n.v. broad snouted caiman) has a great capacity to make use of differentenvironments for nesting; but females could select microhabitats, potentially affecting hatchlings sex ratios. Thefactors that would lead females to make that selection are unknown. Regarding this aspect, it was proposed as theobjective of this work to evaluate the reproductive parameters related to egg size and hatchling size in three differentenvironments (forest, floating vegetation and savannah) in Santa Fe Province (working area includes San Cristóbaland San Javier Districts). Eggs were harvested during the 2001-02 season and incubated until hatching in the ProyectoYacaré incubator. Based on our results, we discarded that all reproductive variables be different among theenvironments. Only egg width and hatchling SVL (both related to female body size) were different amongenvironments. Hatchling body mass in the three environments was always better associated to egg volume than tolength. Finally, we could infer that floating vegetation is the environment that has the best performance.
Según trabajos previos, Caiman latirostris (n.v. yacaré overo) posee una gran capacidad para utilizar diversos ambientespara nidificar. Recientemente se ha planteado la hipótesis que las hembras de Caiman latirostris podrían seleccionarlos micro-hábitats, afectando potencialmente la proporción de sexos de los pichones; pero los factores que conduciríana las hembras a dicha selección son desconocidos. En este aspecto; nuestro trabajo tuvo como objetivo específicoevaluar parámetros reproductivos relacionados al tamaño de los huevos y tamaño de los pichones de yacaré overo entres ambientes (sabana, embalsado y bosque) de la provincia de Santa Fe. Los nidos recolectados para tal fin provienende áreas de muestreo relevadas por el equipo del Proyecto Yacaré en los departamentos de San Javier y San Cristóbal,durante la temporada 2001-02. A partir de los resultados obtenidos, se descarta que todas las variables reproductivasde esta especie sean diferentes entre los ambientes, ya que de todas las ellas, solamente el ancho de los huevos y lalongitud desde el hocico hasta la cloaca en los pichones (ambas variables asociadas al tamaño de la hembra), registrarondiferencias entre los mismos, demostrando un efecto del ambiente sobre dichas variables. Por otra parte, en los tresambientes el peso de los pichones estuvo siempre mejor asociado al volumen de los huevos que la longitud. Finalmente,de acuerdo a los resultados, el embalsado resultó ser el ambiente de mejor performance.
436
Gender Discrimination in Hatchling Broad-Snouted Caiman(Caiman latirostris): an Alternative Technique
Carlos Piña1, 2, Alejandro Larriera1, Pablo Siroski1 and Luciano M. Verdade3
1Proyecto Yacaré, Bv. Pellegrini 3100, (3000) Santa Fe, Argentina ([email protected]);2FCyT/UAdER; CIC y TTP – CONICET. Proyecto Yacaré, Dr. Matteri y España, (3105) Diamante,
Entre Ríos, Argentina([email protected]);3Laboratório de Ecologia Animal /LEA/ESALQ, Universidade de São Paulo Caixa, Postal 09,
Piracicaba, SP 13418-900, Brazil ([email protected])
Broad-snouted caiman (Caiman latirostris) hatchlings present a consistent sexual dimorphism in their cranial formnot only size. Hatchling males present smaller cranium than females. Using multivariate statistical analyses it ispossible to discriminate sex in broad-snouted caiman hatchlings by their cranial form with a relatively high efficiency.Sex discrimination of crocodilian hatchlings might possibly be improved by experimental manipulation of bothgenetic and phenotypic variables such as incubation environment and genealogy.
Los neonatos de yacaré overo (Caiman latirostris) presentan dimorfismo sexual en la forma del cráneo y en sutamaño. Con el uso de técnicas multivariadas es posible discriminar el sexo de los pichones de yacaré overo, basadoen su forma craneal con una aceptable eficiencia. Los pichones macho tienen un cráneo menor que las hembras. Ladiscriminación sexual de los pichones de cocodrilos podría mejorarse por la manipulación experimental de variablesgenéticas y fenotípicas tales como el ambiente de incubación y la genealogía.
The Effect of Three Different Experimental Salinity Levelson Caiman latirostris Growth
Luciana Santucho1, Alba Imhof1,2 and Alejandro Larriera1
1Proyecto Yacaré, Pje. Pvdo. 4455, Santa Fe 3000, Argentina ([email protected]);2Facultad de Humanidades y Ciencias, UNL, Santa Fe, Argentina
In this experiment we evaluated the effect of three different salinity levels (0, 7 and 20 ppt marine salt) on the growthof 36 Caiman latirostris hatchlings from three different nests, over a period of 52 days. All treatments were keptunder similar conditions of captivity, except for salinity.
We found differences in food consumption, growth, fitness and survivorship between treatments. At 20 ppt salinity,no food was taken by the animals, there was no growth and mortality rate was 33%. At 7 ppt survivorship was 100%,and bodyweight was similar to the animals kept at 0 ppt, but the fitness and the morphology of the animals wasaffected because they have showed evidence of subcutaneous oedema.

437
Growth of Caiman latirostris Reared at Three Different Stocking Densities
Gisela Poletta1, 2, Pablo Siroski1 and Alejandro Larriera1
1Proyecto Yacaré, Aristóbulo del Valle 8700, (3000) Santa Fe, Argentina ([email protected]);2Facultad de Humanidades y Ciencias (UNL)-Ciudad Universitaria, Paraje “El Pozo”,
(3000) Santa Fe, Argentina
In this study we have evaluated the effects produced by stocking density over growth of juveniles Caiman latirostris.Thirty-six captive-reared juvenile caimans were used in the experiment. They were randomly assigned to threedifferent treatments consisting on stocking densities of 0.12, 0.06 and 0.04 m2/individual that were maintained inenvironmentally controlled chambers for 3 months. The juveniles were weighed and measured at the beginning andat the end of the experiment to determine the increase in growth for each group. The results showed that caimansmaintained at the lower and intermediate stocking densities gained more weight and showed a greater increase intotal length than those of the higher stocking density group. The results obtained indicated that crowding of juvenilecaimans inhibits optimum growth. These data agree with results found in similar studies for other crocodilians.

438
Population Genetic Analysis of Caiman latirostris in Santa Fe Province, Argentina, by RAPD
Patricia Amavet1, 2, E. Rosso1, P. Siroski2 and Rosa Markariani1
1Universidad Nacional del Litoral, Ciudad Universitaria, Paraje “El Pozo” (3000) Santa Fe, Argentina([email protected]);
2Proyecto Yacaré, Arist. del Valle 8700, (3000) Santa Fe, Argentina ([email protected])
Abstract
Caiman latirostris is a species scarcely studied to genetic level in our country, which is essential to complementstrategies for management and conservation. In the present paper the preliminary results of a population analysisperformed in Santa Fe province are described. Random Amplified Polymorphic DNA markers (RAPD) are used inorder to determine variability and genetic structure of 3 distant wild populations. Genomic DNA isolation of 31individuals were performed by a method that does not require the use of proteinase K, cheaper and effective in itsresults.
At the moment, 20 primers were tested, out of which 8 have been selected for analysis. All samples of DNA havebeen amplified with these primers, and amplification products from one population were analyzed on agarose gels.Registered results show that all primers examined produced different RAPD fragment patterns and could find nodifferences between banding patterns of individuals of the same population.
Introduction
Wild populations of Santa Fe Province of Caiman latirostris (broad-snouted caiman) are subjects of management ofthe Proyecto Yacare (MAGIC-MUPCN) program, whose object is the sustainable use of this species, together withits habitat conservation. Since 1997, the Caiman latirostris population of Santa Fe is listed in Appendix II of CITESdue to an obvious numeric recovery, for which the regulated trade is allowed (Larriera 1998), and is turned into animportant species at both national and international levels.
Particularly in crocodilians (Forstner and Forstner 2002), molecular methods apported valuable data about reproductivemechanisms, gene flow, population effective size, geographic distribution, and genetic variability measures, essentialto complement management strategies. More important molecular studies in crocodilians implicate proteins analysis(Gartside et al. 1976; Lawson et al. 1989), DNA mitochondrial (Densmore and White 1991; Janke and Arnason1997; Glenn et al. 2002; Ray and Densmore 2002 ), and microsatellites in wild populations (Davis et al. 2000, 2001,2002; Glenn et al. 1998, 2002), existing limited antecedents of the application of the technique chosen for the presentwork (Glenn et al. 1998; Wu et al. 2002, in genus Alligator).
Population genetic studies in broad snouted caiman using microsatellites (Verdade et al. 2002; Zucoloto et al. 2002)have started in Brazil, but in our country we do not have data about variability neither about structure in wildpopulations of Caiman latirostris due to the little previous work at the genetic level. One of them is a comparativeanalysis of the karyotypic structure between Caiman latirostris and C. yacare. Results indicate similarities betweenthem, with a diploid number of 42 chromosomes, with equal karyotypic structure and two microchromosomes. Bothlack sexual chromosomes and show very similar C and NOR banding patterns (Amavet et al. 2000, 2002, 2003). Dueto the remarkable similarities found, added to the absence of data in relation to their population structure, the presentstudy intends to gather some data about the genetic structure of wild populations of Caiman latirostris in our country.
In addition, an alternative technique for DNA isolation is described, that implies lower costs and a higher biosecurityin relation to traditional methods, equally achieving a considerable concentration of DNA for further analysis byRAPD.
Materials and Methods
Sixty samples were processed. They were taken from 31 individuals of Caiman latirostris (19 females and 12 males)

439
coming from of 3 distant populations of Santa Fe province: San Justo State (S 30° 43’ 587’’, W 60° 17’ 458’’), SanCristóbal State (S 29° 42’ 844’’, W 60° 50’ 404’’) and San Javier State (S 30° 03’ 341’’, W 59° 58’ 746’’).
Entire blood samples are used, obtained by puncture of intern jugular vein at the level of the cervical vertebrae(Tourn et al. 1993) with EDTA as anticoagulant. The technique used for DNA isolation (modified by Murray andThompson 1980) consisting in the following steps: Suspend 500 mL entire blood in 3 mL TE (10 mM Tris-HCl, pH7.5, 10mM Na
2EDTA 2 H
2O). Wash 3 times. Eliminate the last wash’s supernatant. Add extraction solution (CTAB-
NaCl-Mercaptoethanol-EDTA-Tris HCl). Homogenize and then carry to thermostatized bath to 60ºC for 3 or 4hours. Wash 3 times in chloroform. Precipitate the last supernatant with isopropyl alcohol. Eliminate the alcohol bymeans to vaporization. Hydrate in 1 mL sterile double distilled water.
A set of 20 decamer primers from Promega - (Nº Cat B050-10 and B051-10) were tested in this study. Then 8 primerswere selected taking into account which of them showed a band mean number (between 5 and 10 bands). Thesamples of all individuals of three populations were amplified with these primers (Table 1).
Table 1. Sequence and Promega codes of the random primers selected tostudy variation in Caiman latirostris.
Selected Sequence (5’to 3’)Primers Codes
A01 CCC AAG GTC CA02 GGT GCG GGA AA03 AAG ACC CCT CA05 CAC CAG GTG AA06 GAG TCT CAG GB04 TGC CAT CAG TB05 GCG CTC ACG CB07 AGA TCG AGC C
Amplification reactions are carried out in a final volume of 25 mL with 10 mM Tris-HCl, pH 8.3, 50 mM KCl, 2.5mM MgCl2, 0.01 per cent Gelatin, 200 pM de dATP, dTTP, dGTP and dCTP, 5 pmoles of 10-base primer, 1.25 unitTaq DNA polimerase (Promega, Biotec.) and 50 ng genomic DNA. A negative control containing all reagents exceptgenomic DNA was included in each reaction.
DNA amplification was performed in a thermal cycler (PTC-100 Peltier Thermal Cycler) with a cycle program the45 cycles of 2 min to 94°C, 1 min to 36°C and 2 min to 72°C, with a final extension to 72ºC to 10 min. Aproximately15 mL of amplification products were separated on 2% agarose gels in TBE buffer (0.89 M Tris, 0.89 M boric acidand 0.11 M EDTA, pH 8.3). Gels were stained with ethidium bromide and photographed under UV light.
RAPD markers are dominants and their presence or absence in them is analyzed (Lynch and Milligan 1994). Geneticdistances will be calculated following different measures (Nei and Li 1985; Lynch 1991; Bardakci and Skibinsi1994).
Preliminary Results
After processing of 60 samples, genomic DNA was extracted with a mean concentration of 1.84 mg/mL and a meanpurity of 1.667 (l260.0/l280.0). DNAs extract were obtained in a native, not degraded, of high molecular weightform, as the presence of band unique in a electrophoresis in agarose gels shows (Fig. 1).
In relation to band analysis, at the moment, registered results are preliminary and refer only to one population. All theprimers examined produced different RAPD fragment patterns. The number of fragments generated per primervaried between five and 12. Generated bands are between 500 and 1200 bp indicate with 100 bp ladder. Electrophoresison agarose gels of amplificated products with 8 primers shows no differences between the banding patterns of theindividuals of the same population (Fig. 2).
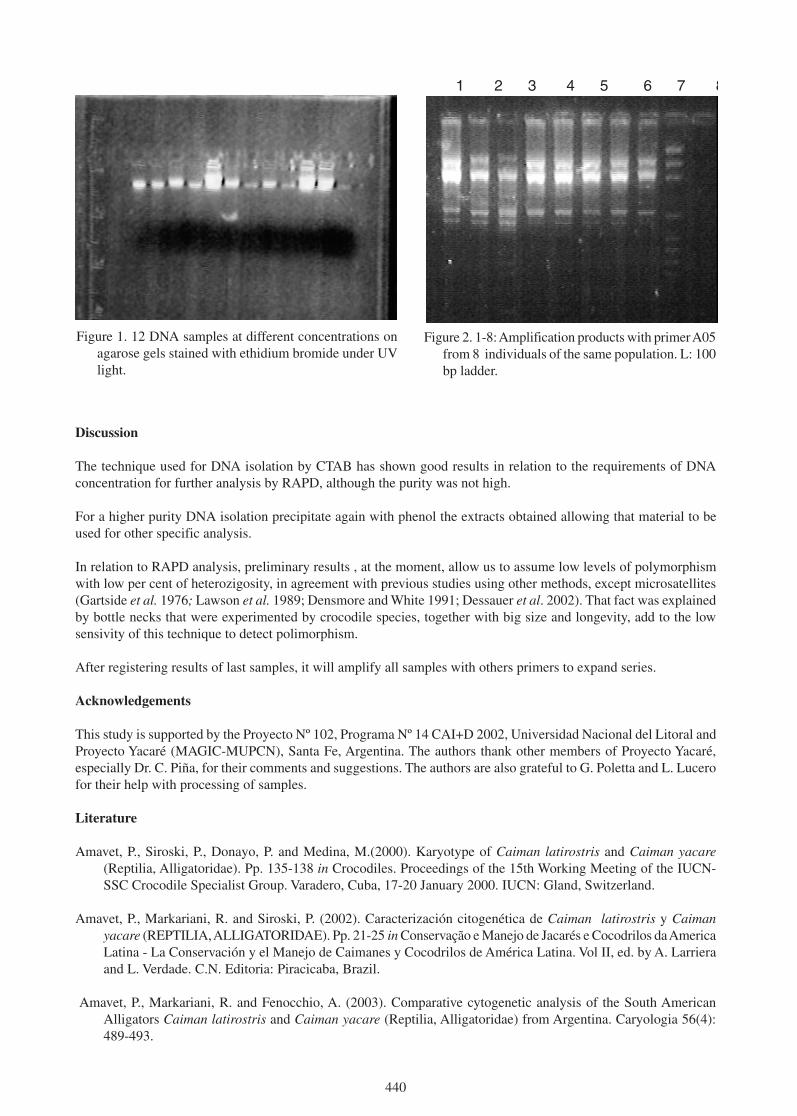
440
Figure 1. 12 DNA samples at different concentrations onagarose gels stained with ethidium bromide under UVlight.
1 2 3 4 5 6 7 8
Figure 2. 1-8: Amplification products with primer A05from 8 individuals of the same population. L: 100bp ladder.
Discussion
The technique used for DNA isolation by CTAB has shown good results in relation to the requirements of DNAconcentration for further analysis by RAPD, although the purity was not high.
For a higher purity DNA isolation precipitate again with phenol the extracts obtained allowing that material to beused for other specific analysis.
In relation to RAPD analysis, preliminary results , at the moment, allow us to assume low levels of polymorphismwith low per cent of heterozigosity, in agreement with previous studies using other methods, except microsatellites(Gartside et al. 1976; Lawson et al. 1989; Densmore and White 1991; Dessauer et al. 2002). That fact was explainedby bottle necks that were experimented by crocodile species, together with big size and longevity, add to the lowsensivity of this technique to detect polimorphism.
After registering results of last samples, it will amplify all samples with others primers to expand series.
Acknowledgements
This study is supported by the Proyecto Nº 102, Programa Nº 14 CAI+D 2002, Universidad Nacional del Litoral andProyecto Yacaré (MAGIC-MUPCN), Santa Fe, Argentina. The authors thank other members of Proyecto Yacaré,especially Dr. C. Piña, for their comments and suggestions. The authors are also grateful to G. Poletta and L. Lucerofor their help with processing of samples.
Literature
Amavet, P., Siroski, P., Donayo, P. and Medina, M.(2000). Karyotype of Caiman latirostris and Caiman yacare(Reptilia, Alligatoridae). Pp. 135-138 in Crocodiles. Proceedings of the 15th Working Meeting of the IUCN-SSC Crocodile Specialist Group. Varadero, Cuba, 17-20 January 2000. IUCN: Gland, Switzerland.
Amavet, P., Markariani, R. and Siroski, P. (2002). Caracterización citogenética de Caiman latirostris y Caimanyacare (REPTILIA, ALLIGATORIDAE). Pp. 21-25 in Conservação e Manejo de Jacarés e Cocodrilos da AmericaLatina - La Conservación y el Manejo de Caimanes y Cocodrilos de América Latina. Vol II, ed. by A. Larrieraand L. Verdade. C.N. Editoria: Piracicaba, Brazil.
Amavet, P., Markariani, R. and Fenocchio, A. (2003). Comparative cytogenetic analysis of the South AmericanAlligators Caiman latirostris and Caiman yacare (Reptilia, Alligatoridae) from Argentina. Caryologia 56(4):489-493.
441
Bardakci, F. and Skibinsi, O.F. (1994). Application of the RAPD technique in tilapia fish: species and subspeciesidentification. Heredity 73: 117-123.
Davis, L.M., Glenn, T.C., Elsey, R.M., Brisbin Jr.,I.L., Rhodes, W.E., Dessauer, H.C. and Sawyer, R.H. (2000).Geneticstructure of six populations of American alligators: a microsatellite analysis. Pp. 38-50 in Crocodilian BiologyEvolution, ed. by G. Grigg, F. Seebacher. and C.E. Franklin. Surrey Beatty and Sons: Chipping Norton.
Davis, L.M., Glenn, T.C., Elsey, R.M., Dessauer, H.C. and Sawyer, R.H. (2001). Multiple paternity and matingpatterns in the American alligator, Alligator mississippiensis. Molecular Ecology 10: 1011-1024.
Davis, L.M., Glenn, T.C., Strickland, D.C., Guillette, L.J. Jr, Elsey, R.M., Rhodes, W.E., Dessauer, H.C. and Sawyer,R.H. (2002). Microsatellite DNA analyses support an east-west phylogeographic split of American alligatorpopulations. J. Exp. Zool. 294(4): 352-72.
Densmore, L.D. and White, P.S. (1991). The systematic and evolution of the Crocodylia as suggested by restrictionendonuclease analysis of mitochondrial and nuclear ribosomal DNA. Copeia 1991(3): 602-615.
Dessauer, H.C., Glenn, T.C. and Densmore, L.D. (2002). Studies on the molecular evolution of the Crocodylia:footprints in the sands of time. J. Exp. Zool. (Mol. Dev. Evol.) 294: 302-311.
Forstner, M.R.J. and Forstner, J.M.K. (2002). La utilidad del ADN en la Conservación de los Crocodylia. Pp. 99-117in Conservação e Manejo de Jacarés e Cocodrilos da America Latina - La Conservación y el Manejo de Caimanesy Cocodrilos de América Latina. Vol II, ed. by A. Larriera and L. Verdade. C.N. Editoria: Piracicaba, Brazil.
Gartside, D.F., Dessauer, H.C. and Joanen, T. (1976). Genic homozigosity in an ancient reptile (Alligatormississippiensis). Biochemical Genetics 15(7/8): 655-663.
Glenn, T.C., Dessauer, H.C. and Braun, M.J. (1998). Characterization of microsatellite DNA loci in American alligators.Copeia 1998(3): 591-601.
Glenn ,T.C., Staton, J.L., Vu, A.T., Davis, L.M., Bremer, J.R., Rhodes, W.E., Brisbin, I.L. Jr and Sawyer, R.H.(2002). Low mitochondrial DNA variation among American alligators and a novel non-coding region incrocodilians. J. Exp. Zool. 294(4): 312-24.
Janke, A. and Arnason, U. (1997). The complete mitochondrial Genome of Alligator mississippiensis and separationbetween recent Archosauria (Birds and Crocodiles). Mol. Biol. Evol. 14(2): 1266-1272.
Larriera, A. (1998). The Caiman latirostris ranching program in Santa Fe, Argentina : The first commercial rearing1998. Pp. 379-385 in Crocodiles. Proceedings of the 14th Working Meeting of the IUCN-SSC Crocodile SpecialistGroup, IUCN: Gland, Switzerland.
Lawson, R., Kofron, C.P. and Dessauer, H.C. (1989). Allozyme variation in a natural population of the Nile Crocodile.Amer. Zool. 29: 863-871.
Lynch, M. (1991). Analysis of population genetic structure by DNA fingerprinting. Pp. 113-126 in DNA FingerprintingApproaches and Applications, ed. by T. Burke, G. Dolf, A.J. Jeffreys and R. Wolf. Basel: Switzerland.
Lynch, M. and Milligan, B.G. (1994). Analysis of population genetic structure with RAPD markers. MolecularEcology 3: 91-99.
Murray, M.G. and Thompson, W.F. (1980). Rapid isolation of high molecular weight plant DNA. Nucleic AcidResearch 8: 4321-4325.
Nei, M. and Li, W.H. (1985). Mathematical model for studying genetic variation in terms of restriction nucleases.Pp. 5269-5273 in Proceedings of the National Academy of Sciences: USA.
Ray, D.A. and Densmore, L.D. (2002). The crocodilian mitochondrial control region: General structure, conservedsequences and evolutionary implications. J. Exp. Zool. (Mol. Dev. Evol.) 294: 334–345.

442
Tourn, S, Imhof, A., Costa, A.L., von Finck, M.C. and Larriera, A. (1993). Colecta de sangre y procesamiento demuestras en Caiman latirostris (Informe de avance). Pp. 25-30 in Memorias del IV Workshop sobre Conservacióny Manejo del yacaré overo (Caiman latirostris). Octubre 1993. Santa Fe: Argentina.
Verdade, L.M., Zucoloto, R.B. and Coutinho, L.L. (2002). Microgeographic variation in Caiman latirostris. J. Exp.Zool. 294(4): 387-396.
Wu, B-X., Wang, Y-Q., Zhou, K-Y., Zhu, W-Q., Nie, J-S., Wang, C-L. and Xie, W-S. (2002). Genetic variation incaptive population of Chinese alligator, Alligator sinensis, revealed by random amplified polymorphic DNA(RAPD). Biological Conservation 106(3): 435-441.
Zucoloto, R.B., Verdade, L.M. and Coutinho, L.L. (2002). Microsatellite DNA library for Caiman latirostris. J. Exp.Zool. (Mol. Dev. Evol.) 294: 346–351.
443
Caiman latirostris and Caiman yacare Population Surveysin Formosa Province, Argentina
Pablo Siroski
Proyecto Yacaré (MAGIC-MUPCN), Aristóbulo del Valle 8700, CP: 3000, Santa Fe, Argentina([email protected])
Abstract
Caiman latirostris and Caiman yacare are two crocodilians species that inhabit Formosa Province, Argentina. Thesefirst two surveys are attempt to determine spatial distribution, relative abundance and population size of both species.These studies were carried out during spring of 2002 and 2003. Night counts showed that caiman’s populations haveimportant densities for C. latirostris and C. yacare in this province. These surveys have covered a big part of theavailable habitat and these indicate that populations of caimans in Formosa appear to be adequate to sustain managementprograms based on ranching.
Introduction
Broad-snouted caiman (Caiman latirostris) and yacare caiman (Caiman yacare) are the two crocodilians species thatinhabit Argentina, and they can be easily differentiated based on cranial and nuchals structures, among others (Medem1983). The two species are simpatric over a large part of their distribution in Argentina, but because of their moresouthern and more western dispersion, broad-snouted caiman appears in an allopatric way in a bigger area. Occasionally,when the two species are seen together, the broad-snouted caiman would stop occupying certain environments tryingto find others (Micucci and Waller 1995); however, they are used to find themselves sharing the same bodies of water(Micucci and Waller 1995; Siroski 2003). This suggests that ecological preferences are not absolute but incidental.
Caiman latirostris prefers densely vegetated environments of difficult access and usually basks in floating vegetation,while Caiman yacare generally appears in environments free of floating vegetation and normally basks on beachesor coasts (Medem 1983). The presence of Caiman latirostris in the superior riverbanks of Iguazú River (Fabri 1998)is significant due to its the great flow.
The eastern limit for broad-snouted caiman distribution is the Atlantic Ocean, and the western limit is the Mountainrange of the Andes (Medem 1983). In Argentina, broad-snouted caiman inhabits Jujuy, Salta, Formosa, Santiago delEstero, Entre Ríos, Santa Fe, Corrientes, Chaco and Misiones Provinces (Yanosky 1990); while Caiman yacareinhabits the same provinces except for Salta, Jujuy and Entre Ríos.
Although our country is the southern limit of dispersion for the two species. C. latirostris reaches a bigger latitude32ºSL (Freiberg and Carvalho 1965) while C. yacare reaches 30-31ºSL (Medem 1983), many specimen have beenseen in bigger latitudes due to extraordinary situations (Micucci and Waller 1995).
There is no record of commercial use of caimans in Argentina from the end of the 1980s to the beginning of the1990s. There was a differential use between both species of caimans, due to the biggest ossification in the osteodermsthat the Caiman yacare possesses, the most looked for one was the broad-snouted caiman because of its greatereconomic value.
The diversity and extension of habitats that caimans take up in this province makes it very difficult to estimate anamount that represents the whole of populations. In these cases, it is convenient to estimate the abundance or relativedensity, for what it is necessary to choose work places that are representative and recurring for the different areas.
The objective of this work was to evaluate the population status, distribution and structure of sizes of Caiman genderin the Province of Formosa, Argentina.

444
Biogeographical Characterization
The province of Formosa occupies a part the Chaco eco-region. This eco-region is characterized to have a vast semi-arid plain that covers around 1,200,000 km2 of South America, of which about 800,000 km2 belong to the Argentinaand the rest is distributed among Bolivia and Paraguay. This province is characterized by the prevalence of subtropicalthorny forests, humid and semi-arid savannah, being very rich in wildlife, mainly in the northwest portion where theanthropic intervention is scarce. In spite of their semi-arid conditions, the abundance of wetlands stands out with adiversity in their origins as well as in their physical and biological characteristics caused by the variability in rainsyear after year. It also presents a gradient for north-south temperature (the annual average varies between 19ºC and24ºC, with maximum of up to 49ºC), and one east-west for the rain (450 to 1200 mm). The availability of habitatsduring the dry season varies significantly year after year, depending on the duration of the drought (Coutinho et al.1995). This is of ecological importance since the aquatic habitats during the drought can affect the dynamics ofwildlife population, particularly caiman populations.
The province of Formosa finds in the climatic factor a great advantage for the establishment of caiman populations.This is due chiefly to the short duration and intensity of cold months. Consecutively, Caiman yacare possesses asmall capacity to adapt to the lowest temperatures, contrary to Caiman latirostris.
Methodology
A description of crocodilians population’s abundance and distribution is generally the first step in this study, and itoften establishes the basic information for conservation and management programs. (Bayliss 1987).
The crocodilians abundance estimate is based on density indexes, for example, the number of specimen seen per kmor hectare. The importance of monitoring is to very well define the conditions with as many data as possible. Samplingplaces were characterized in situ regarding the diverse data, for example: physiognomy, dimensions, vegetable covering,type of banks and representativeness relating to other environments, inside the same bio-region, etc.
In each monitoring, different variables were registered, like: time of beginning and finalization, temperature of theair and water at the same time, cloud, wind and accessibility. Temperature was measured with a mercury bulbthermometer, which ranges from 0 to 50ºC and a 0.5ºC precision. For each studied place, indexes of relative abundancewere calculated dividing the number of caimans observed by the total covered distance during the observation expressedin km.
Structure of sizes was estimated, in most of the cases, at 5 m maximum distance of each caiman. Classification ofsizes was: Class I: <40 cm, Class II: 40-120 cm, Class III: 120-180 cm, and Class IV: >180 cm. In the cases where thedistance was not enough to assure the classification, (EO) eyes only was reported.
Results
From 4 November to 10 November 2002 and from 1 November to 7 November 2003 reports on Caiman latirostrisand Caiman yacare populations were carried out in different places of the province of Formosa. The work evaluateddistribution, relative densities and structures of monitored populations. The results are shown in the table on thefollowing page.
Discussion
During the last 20 years there has been a very important change in the relationship between conservation, exploitationand the trade. Initially, trade was seen as a problem in conservation, however, these days it seems more a solution tothe conservation problem.
A pre-requirement to fulfill the successful management of wildlife is to know the relative densities or tendencies ofpopulations (Rhodes and Wilkinson 1994). There is not much precedent about the population situation of the caiman’sspecies in the Province of Formosa, except for the first exhaustive study carried out by Siroski (2003); that is whythis type of work carried out annually constitutes a fundamental database for the handling of conservation andexploitation.
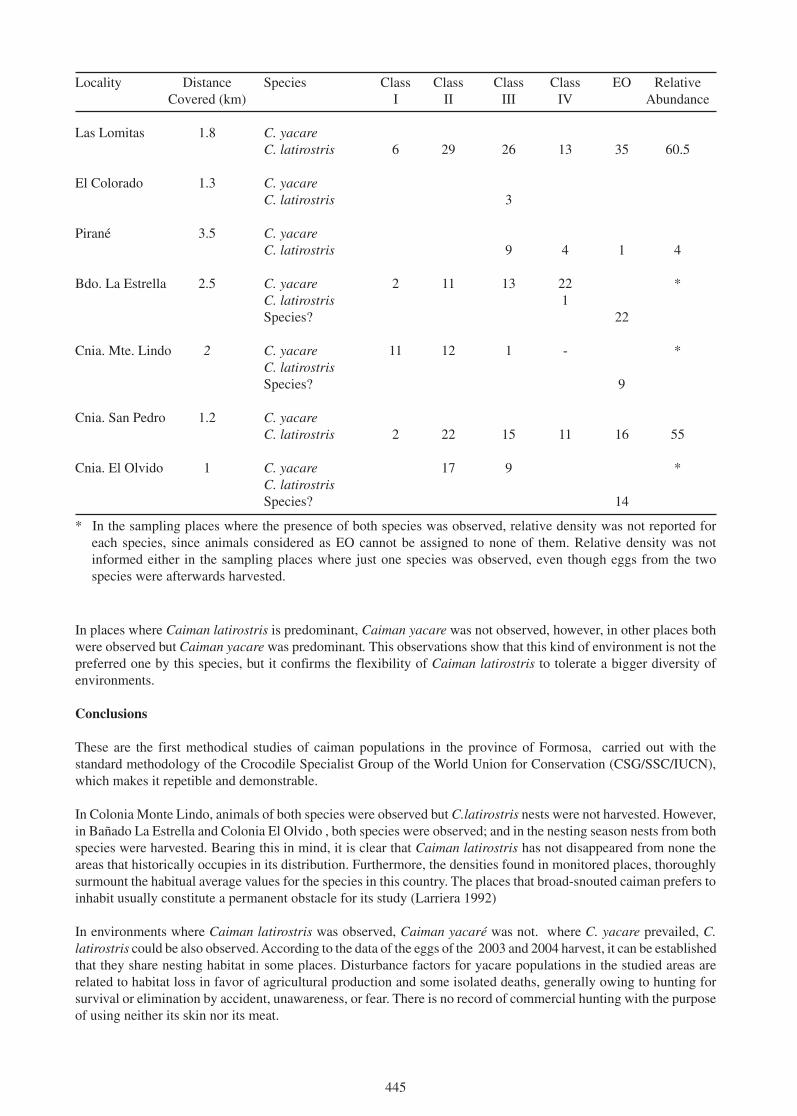
445
In places where Caiman latirostris is predominant, Caiman yacare was not observed, however, in other places bothwere observed but Caiman yacare was predominant. This observations show that this kind of environment is not thepreferred one by this species, but it confirms the flexibility of Caiman latirostris to tolerate a bigger diversity ofenvironments.
Conclusions
These are the first methodical studies of caiman populations in the province of Formosa, carried out with thestandard methodology of the Crocodile Specialist Group of the World Union for Conservation (CSG/SSC/IUCN),which makes it repetible and demonstrable.
In Colonia Monte Lindo, animals of both species were observed but C.latirostris nests were not harvested. However,in Bañado La Estrella and Colonia El Olvido , both species were observed; and in the nesting season nests from bothspecies were harvested. Bearing this in mind, it is clear that Caiman latirostris has not disappeared from none theareas that historically occupies in its distribution. Furthermore, the densities found in monitored places, thoroughlysurmount the habitual average values for the species in this country. The places that broad-snouted caiman prefers toinhabit usually constitute a permanent obstacle for its study (Larriera 1992)
In environments where Caiman latirostris was observed, Caiman yacaré was not. where C. yacare prevailed, C.latirostris could be also observed. According to the data of the eggs of the 2003 and 2004 harvest, it can be establishedthat they share nesting habitat in some places. Disturbance factors for yacare populations in the studied areas arerelated to habitat loss in favor of agricultural production and some isolated deaths, generally owing to hunting forsurvival or elimination by accident, unawareness, or fear. There is no record of commercial hunting with the purposeof using neither its skin nor its meat.
* In the sampling places where the presence of both species was observed, relative density was not reported foreach species, since animals considered as EO cannot be assigned to none of them. Relative density was notinformed either in the sampling places where just one species was observed, even though eggs from the twospecies were afterwards harvested.
Locality Distance Species Class Class Class Class EO RelativeCovered (km) I II III IV Abundance
Las Lomitas 1.8 C. yacareC. latirostris 6 29 26 13 35 60.5
El Colorado 1.3 C. yacareC. latirostris 3
Pirané 3.5 C. yacareC. latirostris 9 4 1 4
Bdo. La Estrella 2.5 C. yacare 2 11 13 22 *C. latirostris 1Species? 22
Cnia. Mte. Lindo 2 C. yacare 11 12 1 - *C. latirostrisSpecies? 9
Cnia. San Pedro 1.2 C. yacareC. latirostris 2 22 15 11 16 55
Cnia. El Olvido 1 C. yacare 17 9 *C. latirostrisSpecies? 14

446
The present work was useful not only to update the knowledge of the species in the region, but also, to verify thestriking interest of local residents in the utilization of the resource in a sustainable way.
In the Province of Formosa, populations of the gender Caiman are in a very good condition, what is shown, as wellin population counts as in the increased number of nests during the 2003 and 2004 harvests.
Finally, the educational aspects of work mechanics in the face of a flawed reality in local economies make us supposethat future economic retribution for the detection of yacare nests, will constitute a significant stimulus for the appraisalof ecosystems starting from its sustainable use in the province of Formosa.
Acknowledgements
To Cesar Pérez and Oscar Ramón Candia, for their very good and constant willingness to team up. To the vet. JuanCarlos Orozco, Director of Fauna and Parks of the Province of Formosa for his open support. To “Caimanes deFormosa SRL” corporation and the Fac. de Cs. y Tec., UADER, for financing these studies and to the vet. AlejandroLarriera for his critical review of this document and to the whole Projecto Yacaré (MAGIC-MUPCN agreement).
Literature
Bayliss, P. (1987). Survey methods and monitoring within crocodile management programes. Pp. 157-175 in WildlifeManagment: Crocodiles and Alligators, ed. by G.J.W. Webb, S.C. Manolis and P.J. Whitehead. Surrey Beattyand Sons: Chipping Norton: Sydney.
Coutinho et al. (1995). Survey of broad snouted caiman Caiman latirostris, marsh deer Blastocerus dichotomus andcapybara Hidrochaerys hidrochaerys in the area to be inundated by Porto Primavera Dam, Brazil. BiologicalConservation 73: 27-31.
Fabri, S.F. and Herrera, J.R. (1998). Prospección de Caiman latirostris en la margen Argentina del Río Iguazúsuperior. Pp. 14-15 in Resúmenes de la XIII Reunión de Comunicaciones Herpetológicas de Argentina. AsociaciónHerpetológica: Argentina.
Freiberg, M.A. and Carvalho, A.L. (1965). El yacaré sudamericano Caiman latiostris (Daudin) Physis 25(70): 351-
360.
Larriera, A., Del Barco, D., Imhof, A. and Von Fink, C. (1992). Environmental variables and its incidence on Caimanlatirostris counts. Pp. 256-260 in Crocodiles. Proceedings of the 11th Working Meeting of the IUCN-SSCCrocodile Specialist Group, Vol. I. IUCN: Gland, Switzerland.
Medem, F. (1983). Los crocodylia de Sudamérica. Vol. II. Universidad nacional de Colombia. COLCIENCIAS:Bogotá, Colombia.
Micucci, P. and Waller, T. (1995). Los Yacares en Argentina: hacia un aprovechamiento sustentable. Pp. 81-112 in LaConservación y el Manejo de Caimanes y Cocodrilos de América Latina, ed. by A. Larriera and L.M. Verdade.Fundación Banco Bica: Santo Tomé.
Siroski, P. (2003). Relevamiento de las poblaciones de caimanes en la región centro y sureste de la provincia deFormosa 2002. 40 pp.
Rhodes, W. and Wilkinson, P. (1994). Alligator night-light surveys of impoundment habitat in coastal South Carolina- a preliminary validation. Pp. 66-73 in Crocodiles. Proceedings of the 12th Working Meeting of the IUCN-SSCCrocodile Specialist Group, Vol. 2. IUCN: Gland, Switzerland.
Yanosky, A.A. (1990). Histoire naturelle du Caiman á museau large (Caiman latirostris), un alligatoriné mal connu.Rev. Fr. Aquariol. Herpetol. 17(1): 19-31.
447
“Pancuronium Bromide” - an Immobilising Agentfor Crocodiles
Laurelle Bates1, Grahame Webb2, Ken Richardson1,Adam Britton2, Jacob Bar-Lev2 and Charlie Manolis2
1Division of Veterinary and Biomedical Sciences, Murdoch University, South Street, Murdoch,WA 6150, Australia; 2Wildlife Management International Pty Limited, PO Box 530, Sanderson,
NT 0813, Australia (corresponding author: [email protected])
Abstract
Flaxedil (gallamine triethiodide) was used extensively by crocodile farms and wildlife managers for the immobilisationof Saltwater Crocodiles (Crocodylus porosus). However, as it became increasingly difficult to obtain and the costbecame prohibitive, alternative immobilising agents were sought. Preliminary testing suggested that Pavulon(pancuronium bromide) could be a potential replacement for Flaxedil. Extensive experimentation with juvenile C.porosus allowed dosage rates for Pavulon to be quantified. Dosage rates for immobilisation for 6-10 h, for largecrocodiles (>2.9 m total length), were extrapolated from limited data, and continue to be tested. Nonetheless, Pavulonhas proven to be a cheap, reliable immobilising agent for C. porosus.
Introduction
Crocodile management and research have benefited greatly from the use of injectable immobilising agents. Not onlydo these contribute to “safety” for handlers, they reduce stress, and risk of injury or death to the animals. A variety ofdrugs have been used for crocodilians, the effect of each drug on a particular species being somewhat unique in termsof dose rates, degree of immobilisation and recovery rates.
Flaxedil (gallamine triethiodide) has been the main immobilising agent used in Australia for Saltwater Crocodilesfor over 30 years. It recently became unavailable in Australia, which motivated the search for an alternative agent.Pavulon (pancuronium bromide) is a closely-related drug widely used in human medicine, and preliminary testingby WMI indicated that it could be a suitable alternative. More extensive testing was then undertaken to derive dosagerates for Saltwater Crocodiles. A range of dosage rates was tested against a number of variables, including: size ofcrocodile, sex, bodyweight, body temperature, and degree of exercise. From this we determined induction time,duration of immobilisation, recovery time, and upper lethal dose. The physiological effects of the drug were examined,and we also tested the effectiveness of the antidote, neostigmine methylsulphate.
Both Flaxedil and Pavulon are non-depolarising neuromuscular blocking agents - they impair nerve impulses to thestriated muscles, rending the animal helpless and unable to move until the drug has been metabolised. Paralysis tendsto be specific to striated muscle, leaving vital functions such as ventilation and heart function relatively unaffectedexcept at high dose rates.
Methods
Crocodiles in three size classes: juveniles (2.4-5.1 kg; <1.2 m TL), sub-adults (5.1-40 kg; 1.2-2.3 m TL) and adults(>40 kg; >2.3 m TL) were used in this study, although most testing was confined to juveniles. Dosage rates for largeranimals were extrapolated from the results obtained for juveniles, and then tested on a limited sample of largecrocodiles.
Pavulon’s performance was evaluated through a number of experiments, including recording the time for specificresponses to disappear and reappear as a measure of the level of immobilisation, assessing the influence of keyvariables (eg bodyweight, body temperature, exercise, sex) to understand the dynamics of immobilisation, physiologicaleffects, and exploring upper lethal limits.
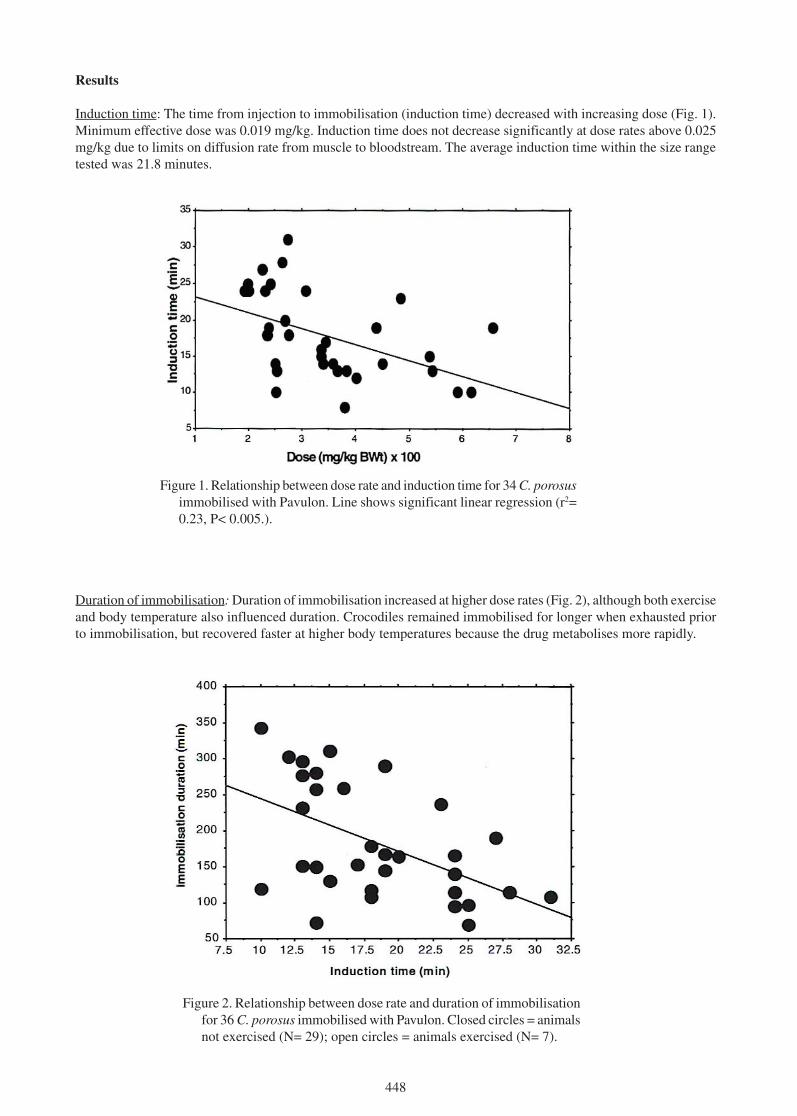
448
Results
Induction time: The time from injection to immobilisation (induction time) decreased with increasing dose (Fig. 1).Minimum effective dose was 0.019 mg/kg. Induction time does not decrease significantly at dose rates above 0.025mg/kg due to limits on diffusion rate from muscle to bloodstream. The average induction time within the size rangetested was 21.8 minutes.
Figure 1. Relationship between dose rate and induction time for 34 C. porosusimmobilised with Pavulon. Line shows significant linear regression (r2=0.23, P< 0.005.).
Duration of immobilisation: Duration of immobilisation increased at higher dose rates (Fig. 2), although both exerciseand body temperature also influenced duration. Crocodiles remained immobilised for longer when exhausted priorto immobilisation, but recovered faster at higher body temperatures because the drug metabolises more rapidly.
Figure 2. Relationship between dose rate and duration of immobilisationfor 36 C. porosus immobilised with Pavulon. Closed circles = animalsnot exercised (N= 29); open circles = animals exercised (N= 7).

449
Figure 3. Relationship between dose rate and induction time for 36 C.porosus immobilised with Pavulon.
Figure 4. Relationship between neostigmine dose rate and recoverytime for 10 C. porosus previous immobilised with 0.034 mg/kgPavulon. Solid triangles = neostigmine dose >0.02 mg/kg (N=6); crosses = neostigmine dose £0.02 mg/kg (N= 3); crossed box= no neostigmine.
Duration of immobilisation can be predicted from induction time (Fig. 3) - crocodiles that take longer to becomeimmobilised tend to recover more rapidly. However, once recovery had started (ie some reflexes were regained), thetime taken for full recovery of all reflexes was not influenced by dose rate, sex, body weight or induction time.
Antidote: Neostigmine methylsulphate was found to be highly effective at reversing the effects of Pavulon. Recoverytime was significantly reduced (<5 minutes) in all animals following injection of >0.02 mg/kg neostigmine (Fig. 4).
Lethal dosage rates: Dosage rates greater than 0.4 mg/kg (>20 times minimum effective dose rate) proved lethal innon-exercised crocs. Dosage rates of 0.2 mg/kg were lethal in crocodiles exercised to exhaustion and in crocodileswith higher body temperatures. Even in non-exercised crocodiles, dosage rates greater than 0.2 mg/kg (>10 timesminimum effective dose) could lead to respiratory distress and death unless administered with the antidote. Neostigmine

450
can prevent mortality if administered early, but is ineffective at restoring muscular movements at high dosage rates(>0.14 mg/kg). Very rapid induction time (<10 minutes) indicates a potentially lethal dose.
Physiological effects: The physiological effects appear to be a 10% increase in heart rate (tachycardia; Fig. 5) and a66% decrease in respiration rate (hypoventilation; Fig. 6) between injection and complete immobilisation. Tachycardiawas not observed using Flaxedil, and appeared to be independent of the stress response to handling. Hypoventilationwas greater than that observed using Flaxedil (66% instead of 50%).
Figure 6. Apparent physiological effect of 0.034 mg/kg Pavulonon respiration rate of juvenile C. porosus.
Figure 5. Apparent physiological effect of 0.034 mg/kg Pavulon on heart rateof juvenile C. porosus with body temperature standardised at 32.8ºC.
Larger crocodiles: To test dose rates extrapolated for larger crocodiles, the predicted effects of a normal dose werecompared with actual effects in 10 large C. porosus (12.1-240.5 kg BWt). There was a significant difference betweenthe predicted and actual effects - induction time, immobilisation duration and recovery times were all higher thanpredicted from smaller crocodiles. Minimum effective dose was also predicted to be lower than 0.02 mg/kg. Theseeffects are consistent with crocodiles of higher bodyweight taking longer to metabolise the drug.

451
Table 1. Provisional dosage rates of Pavulon (4 mg/2 ml) for wild Crocodylus porosus. Dosage ratesin shaded area are extrapolations, and should be used with caution. Line beneath “total length of2.9 m” denotes a change in dose rate. Concentration of neostigmine methylsulphate is 2.5 mg/ml.
TL BWt Partial Immobilisation Immobilisation Neostigmine(m) (kg) Immobilisation (ml) 3-6 h (ml) 6-10 h (ml) (ml)2.0 25 0.1-0.2 0.3 0.6 0.22.1 30 0.1-0.2 0.3 0.7 0.22.2 35 0.2-0.3 0.4 0.8 0.32.3 40 0.2-0.3 0.4 0.9 0.32.4 45 0.2-0.3 0.5 1.0 0.32.5 52 0.3-0.4 0.6 1.1 0.42.6 59 0.3-0.4 0.7 1.3 0.42.7 67 0.3-0.5 0.7 1.5 0.42.8 76 0.4-0.6 0.8 1.7 0.52.9 85 0.4-0.6 0.9 1.9 0.53.0 95 0.3-0.4 0.5-0.7 0.8-0.9 0.5-1.03.1 106 0.3-0.4 0.5-0.7 0.8-1.0 0.5-1.03.2 118 0.4-0.5 0.6-0.8 0.9-1.1 0.5-1.03.3 131 0.4-0.5 0.7-0.9 1.0-1.2 0.5-1.03.4 144 0.4-0.6 0.7-1.0 1.2-1.3 0.5-1.03.5 159 0.5-0.6 0.8-1.1 1.3-1.4 1.03.6 175 0.5-0.7 0.9-1.2 1.4-1.6 1.03.7 188 0.6-0.8 0.9-1.3 1.5-1.7 1.03.8 205 0.6-0.8 1.0-1.4 1.6-1.8 1.03.9 224 0.7-0.9 1.1-1.6 1.8-2.0 1.04.0 243 0.7-1.0 1.2-1.7 1.9-2.2 1.04.1 264 0.8-1.1 1.3-1.8 2.1-2.4 1.04.2 286 0.9-1.1 1.4-2.0 2.3-2.6 1.04.3 305 0.9-1.2 1.5-2.1 2.4-2.7 1.04.4 329 1.0-1.3 1.6-2.3 2.6-3.0 1.04.5 355 1.1-1.4 1.8-2.5 2.8-3.2 1.04.6 382 1.1-1.5 1.9-2.7 3.1-3.4 1.04.7 410 1.2-1.6 2.1-2.9 3.3-3.7 1.04.8 440 1.3-1.8 2.2-3.1 3.5-4.0 1.04.9 471 1.4-1.9 2.4-3.3 3.8-4.2 1.05.0 504 1.5-2.0 2.5-3.5 4.0-4.5 1.05.1 538 1.6-2.2 2.7-3.8 4.3-4.8 1.05.2 574 1.7-2.3 2.9-4.0 4.6-5.2 1.05.3 612 1.8-2.4 3.1-4.3 4.9-5.5 1.0
Conclusions
These results indicate that Pavulon is an effective immobilisation agent, and a suitable replacement for Flaxedil. Theeffective dose rate is relatively low, and there is a considerable safety margin before lethal levels are reached. Thereare relatively clear indicators if dose rates are excessively high, and unless extreme there is a possibility foradministering neostigmine - an effective antidote, particularly at normal dose rates. There appeared to be a change indynamics of immobilisation between smaller and larger crocodiles, the latter’s higher bodyweight and lowermetabolism of the drug meaning that smaller dose rates relative to body size are required. Based on the results,provisional dosage rates of Pavulon for wild Saltwater Crocodiles were derived (Table 1). However, caution shouldbe exercised with large crocodiles, as the dosage rates were derived from limited data.

452
Study and Conservation of Black Caiman (Melanosuchus niger) inFrench Guiana: a 4-years Record
Benoit de Thoisy
Kwata NGO, Cayenne, French Guiana ([email protected])
Introduction
Formerly considered as “endangered”, the status of the Black Caiman (Melanosuchus niger) has been reevaluatedrecently on the basis of ecological monitoring (eg da Silveira and Thorbjarnarson 1999), and the species is nowconsidered as “vulnerable”. Nevertheless, this status remains closely dependant to conservation program at thepopulations levels (Hilton-Taylor 2000). The monitoring of the French Guianan population was initiated in the late1999 (Blanc and de Thoisy 2001; de Thoisy et al. 2001, 2002). Since the population was formely supposed to berestricted to the Kaw Swamps area (but see de Thoisy and Auffret 2003), primary aims of the program funded by theKaw Swamps Nature Reserve and the French Ministry of Ecology, were:
- to assess the status of the population, using both field surveys and molecular markers;- to identify areas of major importance for the species;- to gather new data on ecology and biology; and,- to propose recommentations for a better management of habitat and species conservation.
Area of Study and Methods
The Kaw Swamp Nature Reserve (04°25-04°50 N, 52°00-52°15 W) comprises several habitats for caimans, includingswamps, flooded forests, and mangroves. These areas are facing different levels of anthropic pressure.
The core area of the reserve: the Angélique Swamp
Due to its inaccessibility, this 80 sq. km flooded herbaceous swamp remained in a rather pristine state. Five surveyswere realized in several permanent ponds.
The Kaw River
This 70 km-long river crosses the reserve. Its upper part is dominated by a herbaceous habitat, the lower part crossesa galery forest, and, closer to the sea, a mangrove. A small village is located on the edges of the river. Caimans wereextensively hunted during decades, until the complete protection of the species by Ministerial Decree in 1986. Todate poaching still occurs, although at a low scale. The area is exploited by unmanaged tourism, cattle ranching, andfishing. Count surveys were undertaken monthly since 4 years; as far as possible animals were marked for capture/recapture (C/R) purposes, as well as for the genetic study.
Approuague Estuary
This mangrove habitat has been identified as a important nesting site. The area was chosen for study of the growthand dispersal of youngs using C/R method. Also, a genetic approach was developed, using 2 distinct molecularmarkers: nuclear microsatellite DNA, and mitochondrial cytochrome-b in collaboration with Izeni Farias from theUniversity of Manaus.
Results
Abundances on the Kaw River
Three species are present: the Dwarf Caiman Paleosuchus palpebrosus, the Black Caiman Melanosuchus niger, andthe spectacled caiman Caiman crocodilus. A fourth species, the smooth-fronted caiman P. trigonatus, is recorded inforest tributaries, but not in the main river course.

453
Figure 2. Sizes structure of Black caimans on the Kaw Nature Reserve, French Guiana. Period2000-2003.
The abundance of the Dwarf caiman ranged from 2.8 to 5.6 individuals per 10 km. Whatever the season and thewater level, the Dwarf caiman was more present in the gallery forest area, where 67 to 100% of monthly sightingswere recorded.
The kilometric index of both Black and Spectacled caimans are shown on Figure 1. The decrease of the abundance ofthe Black caiman is significant since 4 years, and the increase of the Spectacled caiman could be an ecologicalresponse to this feature (Herron 1991, 1994). Aditionnally to very low KIs, Black caimans on the river were onlyyoung animals; alternatively the size structure recorded in the Angélique Swamps reflects a healthy population.Also, hatchlings and nesting activities were not recorded on the Kaw River. Nevertheless, large animals, althoughstill poorly represented, were recorded at a higher occurrence during the last year of survey, and may be consideredas an encouraging feature (Fig. 2). The Black caiman marks a significant preference for forest habitats (40% ofrecords located in the gallery forest area, 18% in the mangrove area, vs. 42% in savannas); the Spectacled caimanused preferably the savanna area (94% of sightings).
0
1
2
3
4
5
6
7
8
02 /00
05 /00
08 /00
11 /00
02 /01
05 /01
08 /01
11 /01
02 /02
05 /02
08 /02
11 /02
02 /03
05 /03
08 /03
11 /03
mois
KI (animals / 10 km)
KI M. niger
KI. C. croco
Figure 1. Evolution of monthly kilometric index (KI) of Black caiman Melanosuchus niger and Spectacledcaiman Caiman crocodilus on the Kaw River, Kaw Swamps Nature Reserve, French Guiana. Period 2000-2003.
0%10%20%30%40%50%60%70%80%90%
100%
Angéliqueswamps
Kaw river,2000
Kaw river,2002
Kaw river,2003
area
Population structure
TL> 250
150<TL<250
50 <TL< 150
TL < 50 cm
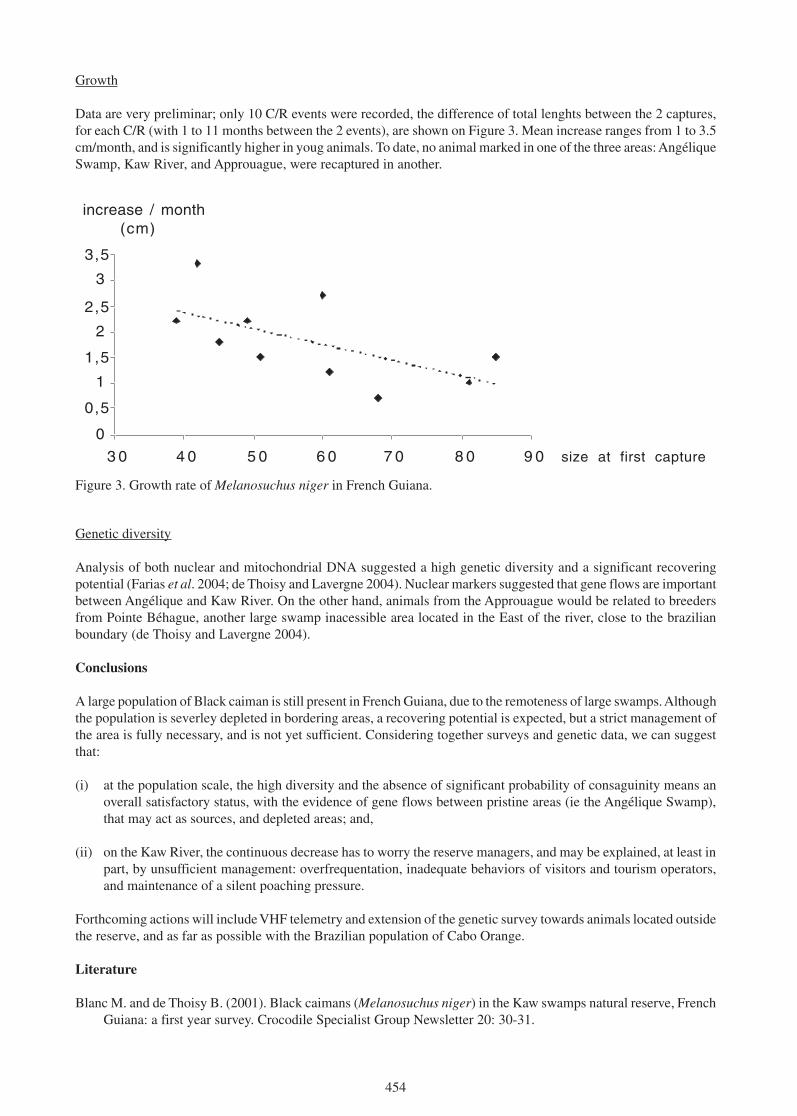
454
Growth
Data are very preliminar; only 10 C/R events were recorded, the difference of total lenghts between the 2 captures,for each C/R (with 1 to 11 months between the 2 events), are shown on Figure 3. Mean increase ranges from 1 to 3.5cm/month, and is significantly higher in youg animals. To date, no animal marked in one of the three areas: AngéliqueSwamp, Kaw River, and Approuague, were recaptured in another.
0
0,5
1
1,5
2
2,5
3
3,5
3 0 4 0 5 0 6 0 7 0 8 0 9 0 size at first capture
increase / month (cm)
Figure 3. Growth rate of Melanosuchus niger in French Guiana.
Genetic diversity
Analysis of both nuclear and mitochondrial DNA suggested a high genetic diversity and a significant recoveringpotential (Farias et al. 2004; de Thoisy and Lavergne 2004). Nuclear markers suggested that gene flows are importantbetween Angélique and Kaw River. On the other hand, animals from the Approuague would be related to breedersfrom Pointe Béhague, another large swamp inacessible area located in the East of the river, close to the brazilianboundary (de Thoisy and Lavergne 2004).
Conclusions
A large population of Black caiman is still present in French Guiana, due to the remoteness of large swamps. Althoughthe population is severley depleted in bordering areas, a recovering potential is expected, but a strict management ofthe area is fully necessary, and is not yet sufficient. Considering together surveys and genetic data, we can suggestthat:
(i) at the population scale, the high diversity and the absence of significant probability of consaguinity means anoverall satisfactory status, with the evidence of gene flows between pristine areas (ie the Angélique Swamp),that may act as sources, and depleted areas; and,
(ii) on the Kaw River, the continuous decrease has to worry the reserve managers, and may be explained, at least inpart, by unsufficient management: overfrequentation, inadequate behaviors of visitors and tourism operators,and maintenance of a silent poaching pressure.
Forthcoming actions will include VHF telemetry and extension of the genetic survey towards animals located outsidethe reserve, and as far as possible with the Brazilian population of Cabo Orange.
Literature
Blanc M. and de Thoisy B. (2001). Black caimans (Melanosuchus niger) in the Kaw swamps natural reserve, FrenchGuiana: a first year survey. Crocodile Specialist Group Newsletter 20: 30-31.
455
da Silveira R. and Thorbjarnarson, J.B. (1999). Conservation implications of commercial hunting of black andspectacled caimans in the Mamiraua sustainable development reserve, Brazil. Biological Conservation 88:103-109.
Farias I.P., Da Silveira, R., de Thoisy, B., Monjelo M.A., Thorbjarnarson, J., and Hrbek T. (2004). Genetic diversityand population stucture of Amazonian crocodilians. Animal Conservation (in press).
Herron J.C. (1991). Growth rates of black caiman Melanosuchus niger, and spectacled caiman Caiman crocodilusand the recruitment of breeders in hunted caimans populations. Biological Conservation 55: 103-113.
Herron J.C. (1994). Body size, spatial distribution, and microhabitat use in the caimans, Melanosuchus niger andCaiman crocodilus, in a Peruvian lake. J. Herp. 28: 508-513.
Hilton-Taylor, C. (2000). 2000 IUCN Red List of Threatened Species. IUCN: Gland.
de Thoisy, B., Blanc, M. and Joly, A. (2001). Distribution, abundance, and habitat use of black caiman in the Kawswamps, French Guiana: a preliminary report. V° Congreso sobre el Manejo de la fauna silvestre en LatinAmerica y Amazonia, Cartagena, Colombia.
de Thoisy, B., Lavergne, A., Blanc, M. and Joly, A. (2002). Status of the French Guianan black caiman (Melanosuchusniger) population. In Crocodiles. Proceedings of the 16th Working Meeting of the IUCN-SSC Crocodile SpecialistGroup.
de Thoisy, B. and Auffret, E. (2003). Possible extension of the distributional area of Black caiman in French Guiana.Crocodile Specialist Group Newsletter 27: 17-18.
de Thoisy, B. and Lavergne, A. (2004). Population status, structure and dynamics in Black caimans (Melanosuchusniger) in French Guiana. Submitted.

456
Blood Parasites of Crocodylus siamensis in Thailand
Jindawan Siruntawineti1, Win Chaeychomsri1, Boongeua Vajarasathira1,Anussara Ritwichai1, Tawatchai Ong-aat2 and Yosapong Temsiripong2,3
1Department of Zoology, Faculty of Science, Kasetsart University, Bangkok 10900, Thailand([email protected]);
2R & D Laboratory, Sriracha Crocodile Farm Co., Ltd., Chonburi 20110, Thailand3Crocodile Management Association of Thailand (CMAT)
Abstract
Blood samples of 383 captive freshwater crocodiles, Crocodylus siamensis, from three different parts of Thailand,central-eastern (n= 231), northeastern (n= 38) and southern parts (n= 114) were examined. Blood smears, wholeblood, white cells and red cells, were prepared, stained with Wright stain, and microscopically examined. To evaluatethe relation between hematological values and blood parasite infection, 128 whole blood samples were identified forthe pack red cell volume (PCV), differential of white blood cell (WBC) count and thrombocyte count per 100 WBC.Standardized questionnaires, concerning the diets and management practices, were collected and evaluated for theirassociation with parasitological prevalence. The results show no parasite in crocodile blood (prevalence rate= 0%).The hematological values (mean + SD) were as follows: PCV 28.90 + 2.90%, heterophil 77.52 + 3.70%, eosinophil1.30 + 0.90%, basophil 1.09 + 0.78%, lymphocyte 18.55 + 3.39%, monocyte 1.46 + 1.03%, and 117.25 + 19.76thrombocytes per 100 WBC. These values were not significantly different between sexes. However, some hematologicalvalues of crocodiles from farms that changed water once a week were significantly (P< 0.05) lower than those fromfarms that changed water once a month. These results should prove safety in crocodile blood consumption.
Introduction
Freshwater crocodiles, Crocodylus siamensis, are endemic in Thailand. At present, they are commercially important.Thus they are more frequently found in captivity than in the wild. Recently, crocodile production is increased becauseof the progress in the farming technology. Crocodile skin is the principal product for annually exporting in the exoticleather trading. Besides, crocodile by-products such as meat, fat, bile, and penises are increasing important in addingvalues of captive crocodiles. The crocodile byproducts are influential in some farming areas and are convenientlyclassified into two categories, curios/novelty items and ingredients for medicines and other products (Hutton andWebb 1993; Huchzermeyer 2003). Crocodile blood, one of the by-products, is traditionally consumed for preventingand curing allergy and asthma.
Crocodiles may be infected by a number of blood-inhabiting protozoa and nematode worms transmitted byhaematophagous arthropods. Protozoan parasites included haemosporidia in the genera Hepatozoon, and Progarnia(Siddall 1995; Smith 1996; Lainson 1995), and haemoflagellates in the genus Trypanosoma (Hoare 1931; Lainson1977). Nematode worms in the family Filariidae occur in many crocodile species (Huchzermeyer 2003). Blood-inhabiting parasites of crocodiles are of particular interest because a high incidence of parasitic infections lowersproductivity leading to important economic losses. Some blood parasites are zoonoses, transmitted between humansand animals.
The prevalence of blood parasites and parasitic species of zoonotic importance in C. siamensis has never beenreported in Thailand. To ensure safety in crocodile blood consumption, the prevalence of the parasites in crocodileblood was observed. The relationships between hematological values and parasite infections were also investigated.
Materials and Methods
Sample size and study area: The sample size was calculated following the formula described by Thrusfield (1995).The total samples (n= 383) consisted of crocodiles from three parts of Thailand, central-eastern (n= 231 from 7Provinces, 33 samples/Province), northeastern (n= 38 from 2 Provinces, 19 samples/Province) and southern parts(n= 114 from 6 Provinces, 19 samples/Province).

457
Crocodile size (Mean ± SD)Prevalence of parasites in blood
smears (%)Part/Province Length
(cm)Weight
(kg)Thorax length
(cm)No. WhB* WBC* RBC*
Central-EasternBangkok 194.21±8.42* 30.98±3.97 58.58±3.32 33 0 0 0Ayuthaya 190.81±15.62 26.94±7.18 55.30±5.98 33 0 0 0Samut Prakan 195.67±17.61 32.30±10.86 57.95±8.82 33 0 0 0Nakhon Pathom 185.61±10.67 26.42±4.99 56.27±4.96 33 0 0 0Trat 197.30±7.92 34.90±2.91 59.42±3.95 33 0 0 0Rayong 193.25±11.93 28.75±5.28 56.58±4.72 33 0 0 0Chanthaburi 185.76±6.78 27.85±3.65 56.12±3.82 33 0 0 0
NortheasternLoe i 183.89±7.87 24.33±4.07 53.63±4.27 19 0 0 0Nakhon Phanom 175.21±11.06 22.01±4.69 53.79±3.95 19 0 0 0
SouthernPetchaburi 197.21±9.37 27.34±4.75 55.84±4.09 19 0 0 0Chumporn 200.20±8.44 32.69±5.34 58.05±4.84 19 0 0 0Ranong 197.68±14.20 33.28±8.23 58.32±5.39 19 0 0 0Surat Thani 176.50±10.02 23.40±4.53 52.74±4.16 19 0 0 0Songkhla 173.95±7.08 21.82±2.89 51.21±3.44 19 0 0 0Phatthalung 195.89±10.18 30.45±5.38 56.35±3.98 19 0 0 0
Total 189.54±10.48 28.23±5.25 56.01±4.62 383 0 0 0
Table 1. Prevalence of blood parasites in freshwater crocodiles (Crocodylus siamensis) from three parts of Thailand.
*WhB: whole blood; RBC: red blood cell; WBC: white blood cell
Designed questionnaires and collection: The questionnaires were designed concerning the diets and managementpractices. The data in each questionnaire were collected by personally communicating with crocodile farm owners orvia mail. They were analyzed and evaluated for their association with parasitological prevalence.
Subjects and sample collection: Crocodiles, 2 to 3-year-old, were caught from the captive farms and transferred forslaughtering at Sriracha Crocodile Farm, Chonburi, during April 2003 and March 2004. Their weight, thorax length,and total length, from head to tail, were measured. Blood samples (5 ml) were collected from the post-occipitalvenous sinuses with sterile-technique. The samples were kept in tubes containing ethylene diamine tetraacetic acid(EDTA). The pack red cell volume (PCV) was prepared and determined according to the standard microcentrifugationmethod. The blood samples were used to produce three types of blood smear namely, whole blood, white cell and redcell smear. To make the whole blood smear, approximately 5 µl of blood was smeared on a microscope slide. Theremaining blood was centrifuged at 3000 rpm for 10 min. Afterwards, blood was divided into two layers, the upperwhite blood cell (WBC) with thrombocyte and the lower red blood cell (RBC). Each portion was then used toprepare the white and red cell smears. All blood smeared slides were individually labeled, air-dried, fixed in 100%methanol for 15 sec, and stained with Wright stain (Dip-Quick®, Clinical Diagnoties, Ltd., Part, Bangkok, Thai-land).
Smear examination: To identify parasite species, all blood smears were examined at 1000x magnification under oilimmersion. The crocodiles were classified as negative for the absence of parasites and as positive for the presence ofvarious parasite types. The prevalence of infection was defined as the percentage of infected individuals in a sample.In addition, the whole blood smears were checked for the differential WBC counts and the number of thrombocyteper 100 WBC at 1000x magnification.
Statistical analyses: The prevalence of blood parasites in freshwater crocodiles was calculated as a percentage ofcrocodile infected. Group differences were assessed by ANOVA.
Results
The sizes of crocodiles collected from different parts of Thailand are summarized in Table 1, together with theprevalence of blood parasites. The captive-bred crocodiles, 2-3 years-old, were 189.54 ± 10.48 cm in length andweighed 28.23 ± 5.25 kg. Their thorax length averaged 56.01 ± 4.62 cm. However, parasites were not detected in alltypes of blood smears, 383 specimens.
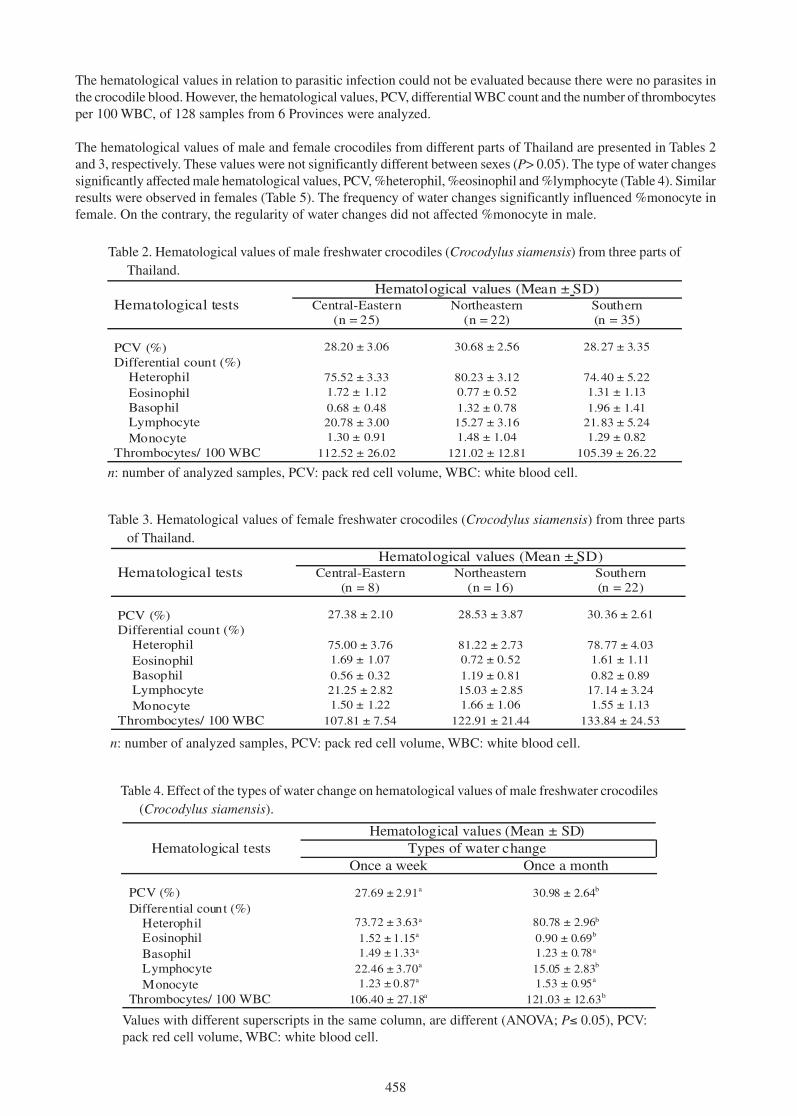
458
The hematological values in relation to parasitic infection could not be evaluated because there were no parasites inthe crocodile blood. However, the hematological values, PCV, differential WBC count and the number of thrombocytesper 100 WBC, of 128 samples from 6 Provinces were analyzed.
The hematological values of male and female crocodiles from different parts of Thailand are presented in Tables 2and 3, respectively. These values were not significantly different between sexes (P> 0.05). The type of water changessignificantly affected male hematological values, PCV, %heterophil, %eosinophil and %lymphocyte (Table 4). Similarresults were observed in females (Table 5). The frequency of water changes significantly influenced %monocyte infemale. On the contrary, the regularity of water changes did not affected %monocyte in male.
Table 2. Hematological values of male freshwater crocodiles (Crocodylus siamensis) from three parts ofThailand.
n: number of analyzed samples, PCV: pack red cell volume, WBC: white blood cell.
Hematological values (Mean ± SD)Hematological tests Central-Eastern
(n = 25)Northeastern
(n = 22)Southern(n = 35)
PCV (%) 28.20 ± 3.06 30.68 ± 2.56 28.27 ± 3.35Differential count (%) Heterophil 75.52 ± 3.33 80.23 ± 3.12 74.40 ± 5.22 Eosinophil 1.72 ± 1.12 0.77 ± 0.52 1.31 ± 1.13 Basophil 0.68 ± 0.48 1.32 ± 0.78 1.96 ± 1.41 Lymphocyte 20.78 ± 3.00 15.27 ± 3.16 21.83 ± 5.24 Monocyte 1.30 ± 0.91 1.48 ± 1.04 1.29 ± 0.82Thrombocytes/ 100 WBC 112.52 ± 26.02 121.02 ± 12.81 105.39 ± 26.22
Table 3. Hematological values of female freshwater crocodiles (Crocodylus siamensis) from three partsof Thailand.
Hematological values (Mean ± SD)Hematological tests Central-Eastern
(n = 8)Northeastern
(n = 16)Southern(n = 22)
PCV (%) 27.38 ± 2.10 28.53 ± 3.87 30.36 ± 2.61Differential count (%) Heterophil 75.00 ± 3.76 81.22 ± 2.73 78.77 ± 4.03 Eosinophil 1.69 ± 1.07 0.72 ± 0.52 1.61 ± 1.11 Basophil 0.56 ± 0.32 1.19 ± 0.81 0.82 ± 0.89 Lymphocyte 21.25 ± 2.82 15.03 ± 2.85 17.14 ± 3.24 Monocyte 1.50 ± 1.22 1.66 ± 1.06 1.55 ± 1.13Thrombocytes/ 100 WBC 107.81 ± 7.54 122.91 ± 21.44 133.84 ± 24.53
n: number of analyzed samples, PCV: pack red cell volume, WBC: white blood cell.
Hematological values (Mean ± SD)Hematological tests Types of water change
Once a week Once a month
PCV (%) 27.69 ± 2.91a 30.98 ± 2.64b
Differential count (%) Heterophil 73.72 ± 3.63a 80.78 ± 2.96b
Eosinophil 1.52 ± 1.15a 0.90 ± 0.69b
Basophil 1.49 ± 1.33a 1.23 ± 0.78a
Lymphocyte 22.46 ± 3.70a 15.05 ± 2.83b
Monocyte 1.23 ± 0.87a 1.53 ± 0.95a
Thrombocytes/ 100 WBC 106.40 ± 27.18a 121.03 ± 12.63b
Table 4. Effect of the types of water change on hematological values of male freshwater crocodiles(Crocodylus siamensis).
Values with different superscripts in the same column, are different (ANOVA; P� 0.05), PCV:pack red cell volume, WBC: white blood cell.
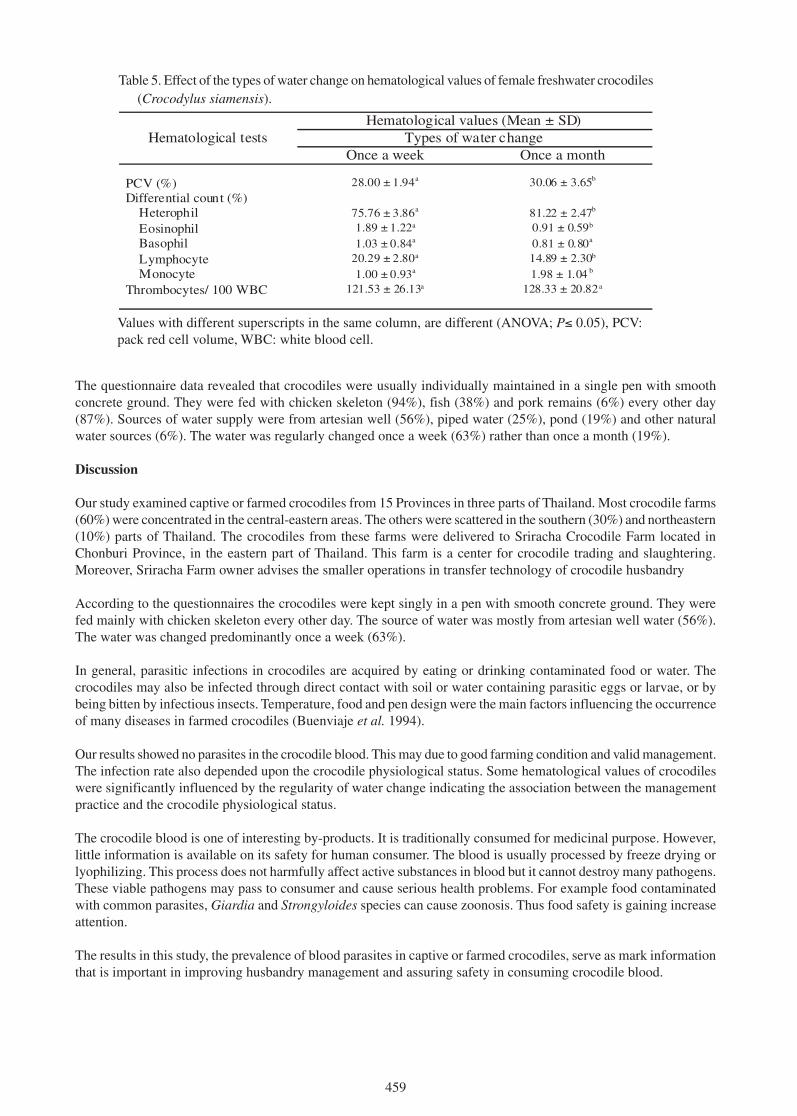
459
Hematological values (Mean ± SD)Types of water changeHematological tests
Once a week Once a month
PCV (%) 28.00 ± 1.94a 30.06 ± 3.65b
Differential count (%) Heterophil 75.76 ± 3.86a 81.22 ± 2.47b
Eosinophil 1.89 ± 1.22a 0.91 ± 0.59b
Basophil 1.03 ± 0.84a 0.81 ± 0.80a
Lymphocyte 20.29 ± 2.80a 14.89 ± 2.30b
Monocyte 1.00 ± 0.93a 1.98 ± 1.04 b
Thrombocytes/ 100 WBC 121.53 ± 26.13a 128.33 ± 20.82 a
Table 5. Effect of the types of water change on hematological values of female freshwater crocodiles(Crocodylus siamensis).
Values with different superscripts in the same column, are different (ANOVA; P� 0.05), PCV:pack red cell volume, WBC: white blood cell.
The questionnaire data revealed that crocodiles were usually individually maintained in a single pen with smoothconcrete ground. They were fed with chicken skeleton (94%), fish (38%) and pork remains (6%) every other day(87%). Sources of water supply were from artesian well (56%), piped water (25%), pond (19%) and other naturalwater sources (6%). The water was regularly changed once a week (63%) rather than once a month (19%).
Discussion
Our study examined captive or farmed crocodiles from 15 Provinces in three parts of Thailand. Most crocodile farms(60%) were concentrated in the central-eastern areas. The others were scattered in the southern (30%) and northeastern(10%) parts of Thailand. The crocodiles from these farms were delivered to Sriracha Crocodile Farm located inChonburi Province, in the eastern part of Thailand. This farm is a center for crocodile trading and slaughtering.Moreover, Sriracha Farm owner advises the smaller operations in transfer technology of crocodile husbandry
According to the questionnaires the crocodiles were kept singly in a pen with smooth concrete ground. They werefed mainly with chicken skeleton every other day. The source of water was mostly from artesian well water (56%).The water was changed predominantly once a week (63%).
In general, parasitic infections in crocodiles are acquired by eating or drinking contaminated food or water. Thecrocodiles may also be infected through direct contact with soil or water containing parasitic eggs or larvae, or bybeing bitten by infectious insects. Temperature, food and pen design were the main factors influencing the occurrenceof many diseases in farmed crocodiles (Buenviaje et al. 1994).
Our results showed no parasites in the crocodile blood. This may due to good farming condition and valid management.The infection rate also depended upon the crocodile physiological status. Some hematological values of crocodileswere significantly influenced by the regularity of water change indicating the association between the managementpractice and the crocodile physiological status.
The crocodile blood is one of interesting by-products. It is traditionally consumed for medicinal purpose. However,little information is available on its safety for human consumer. The blood is usually processed by freeze drying orlyophilizing. This process does not harmfully affect active substances in blood but it cannot destroy many pathogens.These viable pathogens may pass to consumer and cause serious health problems. For example food contaminatedwith common parasites, Giardia and Strongyloides species can cause zoonosis. Thus food safety is gaining increaseattention.
The results in this study, the prevalence of blood parasites in captive or farmed crocodiles, serve as mark informationthat is important in improving husbandry management and assuring safety in consuming crocodile blood.
460
Literature
Buenviaje, G.N., Ladds, P.W., Melville, L. and Manolis, S.C. (1994). Disease- husbandry associations in farmedcrocodiles in Queensland and Northern Territory. Aust. Vet. J. 71: 165-173.
Hoare, C.A. (1931). Studies on Trypanosoma grayi. III. Life-cycle in the tsetse-fly and in the crocodile. Parasitology23: 449-484.
Huchzermeyer, F.W. (2003). Crocodiles: biology, husbandry and diseases. CABI Publishing: Oxon.
Hutton, J.M. and Webb, G.J.W. (1993). The principles of farming crocodiles. In Proceeding of the 2nd Regional(Eastern Asia, Oceania, Australasia) meeting of the Crocodile Specialist Group. Darwin, Australia, 12-19 March1993. IUCN: Gland.
Lainson, R. (1995). Progarnia archosauriae nov. gen., nov. sp. (Haemosporina: Garniidae), a blood parasite ofCaiman crocodilus crocodilus (Archosauria: Crocodilia), and comment on the evolution of reptilian and avianhaemosporines. Parasitology 110: 513-519.
Lainson, R.J. (1977). Trypanosoma cecili n. sp., a parasite of the South American cayman, Caiman crocodiluscrocodilus (Linnaeus, 1785) (Crocodilia: Alligatoridae). Protozoology 3: 87-93.
Siddall, M.E. (1995). Phylogeny of adeleid blood parasites with a partial systematic revision of the haemogregarinecomplex. J. Eukaryot. Microbiol. 42: 116-125.
Smith, T.G. (1996). The genus Hepatozoon (Apicomplexa: Adeleina). J. Parasitol. 82: 565-585.
Thrusfield, M. (1995). Veterinary Epidemiology. Blackwell Science: London.
461
Intestinal Parasites of Freshwater Crocodiles, Crocodylus siamensis, in Thailand
Win Chaeychomsri1, Jindawan Siruntawineti1, Boongeua Vajarasathira1,Komsun Komoljindakul1, Tawatchai Ong-aat2 and Yosapong Temsiripong2,3
1Department of Zoology, Faculty of Science, Kasetsart University, Bangkok 10900, Thailand([email protected]); 2R & D Laboratory, Sriracha Crocodile Farm Co., Ltd., Chonburi 20110,
Thailand; 3Crocodile Management Association of Thailand (CMAT)([email protected])
Abstract
The prevalence of intestinal parasites in farmed juvenile crocodiles, Crocodylus siamensis, was compared with thatof adults in breeding pens. Faecal samples of 383 juveniles were gathered from three parts of Thailand, central-eastern, northeastern and southern parts. Thirty faecal specimens of adult crocodiles were also taken from SrirachaCrocodile Farm. They were examined for parasitic infection by direct smear and Modified Kato thick technique.Standardized questionnaires, dealing with the diets and management practices, were collected and evaluated for theirassociation with parasitological prevalence. The overall prevalence of coccidian parasites in juveniles was 3.13%(12/383). The highest prevalence of coccidian infection, 5.26% (2/383), was observed in north-northeastern part ofThailand. The prevalent rates of 3.51 (4/114) and 2.60% (6/231) were observed in southern and in central-easternpart of Thailand, respectively. In contrast, 23.33% (7/30) coccidian infection was found in adult crocodiles. Thedifference in coccidian prevalence between juveniles and adults, relative to diets and management practices, wasdiscussed.
Introduction
Freshwater crocodiles, Crocodylus siamensis, are promising economic animals in Thailand. The crocodile farmingbusiness is progressively growing. At present, there are over 500 crocodile farmers in Thailand. Approximately30,000 juvenile crocodiles are available for marketing as classical crocodile leather and other by-products. Parasiticinfection is one of the most important diseases affecting a wide range of animals including crocodiles. In livestock,both clinical and sub-clinical infections cause mortality, decrease growth rate and productivity and increase treatmentcost leading to economic loss. Thus far there is no information on the nature and prevalence of intestinal parasiticinfections in Thai crocodiles. Our study was therefore aimed to determine the prevalence of intestinal parasites incaptive breeding crocodiles.
Materials and Methods
Sampling frame: Sample size was calculated using the formula n= 1.962 P (1-P)/d2 according to Thrusfield (1995),with P= 0.5 and d= 0.05. As the prevalence of the parasites was unknown, each was assumed to be 50% where themaximum sample size is calculated. To meet a desired absolute precision of 5% and a 95% level of confidence, asample size of at least 383 crocodiles was required. Samples were taken from both juvenile and adult crocodiles. Thejuveniles, 383, were from three parts of Thailand and the adults, 30, were from breeding pens, Sriracha Farm.
Sample preparation and examination: The direct smear method was used to detect trophozoites of amoebae andflagellates. Faecal specimens were placed in a small container and a drop of physiological saline was added foremulsification. Subsequently, two drops of the emulsified stool was placed on a slide and observed under themicroscope. Iodine was used to stain parasitic eggs and cysts. The total area of the cover slip was scanned using 10xand 40x objectives. Trophozoite mobility and the presence of ingested red blood cells (RBCs) were observed todifferentiate between Entamoeba histolytica and other amoebae. Eimeria species were identified based on themorphology of oocysts (shape, colour, form index, presence or absence of micropyle and its cap, presence or absenceof residual, polar and stieda bodies) and time of sporulation (Coudert 1992; Eckert et al. 1995).
The Modified Kato thick smear technique was also used to estimate worm egg number in the fecal samples, especiallyof Ascaris, Opisthorchis, Trichuris, Hookworm, Schistosomes (Martin and Beaver 1968). Forty micrograms of faecalmaterial was passed through a template onto a slide and covered with a cellophane cover slip soaked in 0.3% malachite
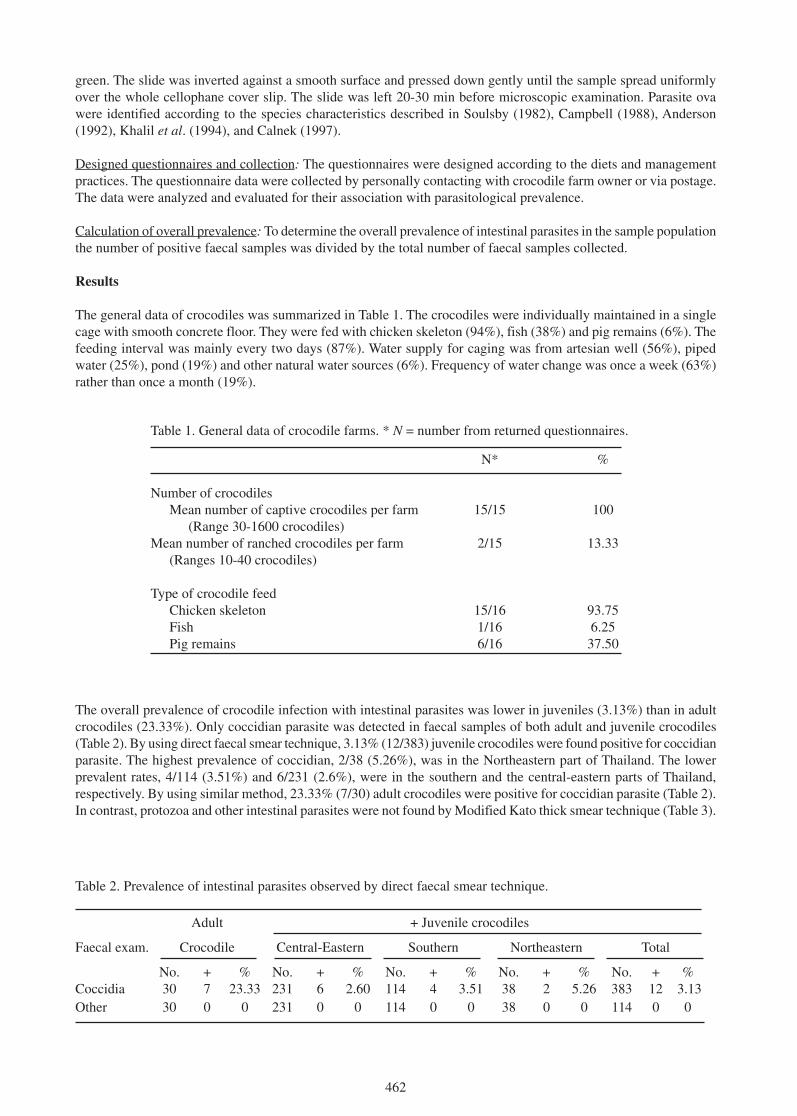
462
green. The slide was inverted against a smooth surface and pressed down gently until the sample spread uniformlyover the whole cellophane cover slip. The slide was left 20-30 min before microscopic examination. Parasite ovawere identified according to the species characteristics described in Soulsby (1982), Campbell (1988), Anderson(1992), Khalil et al. (1994), and Calnek (1997).
Designed questionnaires and collection: The questionnaires were designed according to the diets and managementpractices. The questionnaire data were collected by personally contacting with crocodile farm owner or via postage.The data were analyzed and evaluated for their association with parasitological prevalence.
Calculation of overall prevalence: To determine the overall prevalence of intestinal parasites in the sample populationthe number of positive faecal samples was divided by the total number of faecal samples collected.
Results
The general data of crocodiles was summarized in Table 1. The crocodiles were individually maintained in a singlecage with smooth concrete floor. They were fed with chicken skeleton (94%), fish (38%) and pig remains (6%). Thefeeding interval was mainly every two days (87%). Water supply for caging was from artesian well (56%), pipedwater (25%), pond (19%) and other natural water sources (6%). Frequency of water change was once a week (63%)rather than once a month (19%).
Table 1. General data of crocodile farms. * N = number from returned questionnaires.
The overall prevalence of crocodile infection with intestinal parasites was lower in juveniles (3.13%) than in adultcrocodiles (23.33%). Only coccidian parasite was detected in faecal samples of both adult and juvenile crocodiles(Table 2). By using direct faecal smear technique, 3.13% (12/383) juvenile crocodiles were found positive for coccidianparasite. The highest prevalence of coccidian, 2/38 (5.26%), was in the Northeastern part of Thailand. The lowerprevalent rates, 4/114 (3.51%) and 6/231 (2.6%), were in the southern and the central-eastern parts of Thailand,respectively. By using similar method, 23.33% (7/30) adult crocodiles were positive for coccidian parasite (Table 2).In contrast, protozoa and other intestinal parasites were not found by Modified Kato thick smear technique (Table 3).
Table 2. Prevalence of intestinal parasites observed by direct faecal smear technique.
N* %
Number of crocodilesMean number of captive crocodiles per farm 15/15 100
(Range 30-1600 crocodiles)Mean number of ranched crocodiles per farm 2/15 13.33
(Ranges 10-40 crocodiles)
Type of crocodile feedChicken skeleton 15/16 93.75Fish 1/16 6.25Pig remains 6/16 37.50
Adult + Juvenile crocodiles
Faecal exam. Crocodile Central-Eastern Southern Northeastern Total
No. + % No. + % No. + % No. + % No. + %Coccidia 30 7 23.33 231 6 2.60 114 4 3.51 38 2 5.26 383 12 3.13Other 30 0 0 231 0 0 114 0 0 38 0 0 114 0 0
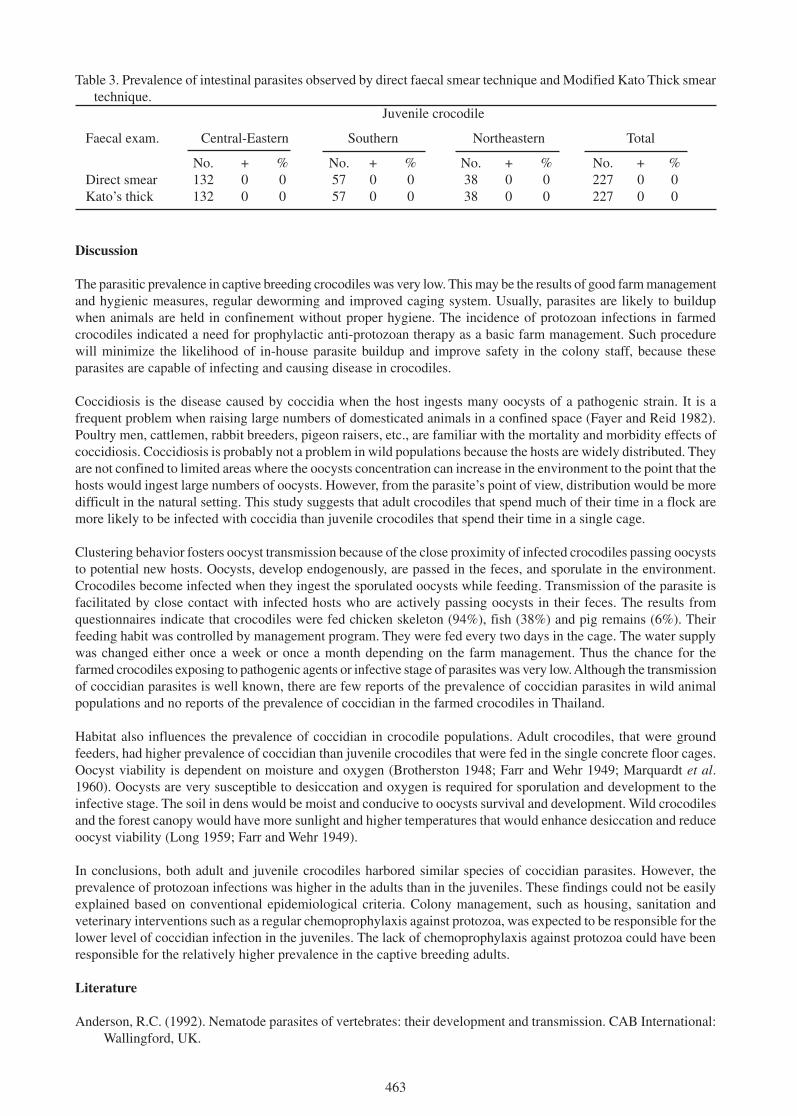
463
Discussion
The parasitic prevalence in captive breeding crocodiles was very low. This may be the results of good farm managementand hygienic measures, regular deworming and improved caging system. Usually, parasites are likely to buildupwhen animals are held in confinement without proper hygiene. The incidence of protozoan infections in farmedcrocodiles indicated a need for prophylactic anti-protozoan therapy as a basic farm management. Such procedurewill minimize the likelihood of in-house parasite buildup and improve safety in the colony staff, because theseparasites are capable of infecting and causing disease in crocodiles.
Coccidiosis is the disease caused by coccidia when the host ingests many oocysts of a pathogenic strain. It is afrequent problem when raising large numbers of domesticated animals in a confined space (Fayer and Reid 1982).Poultry men, cattlemen, rabbit breeders, pigeon raisers, etc., are familiar with the mortality and morbidity effects ofcoccidiosis. Coccidiosis is probably not a problem in wild populations because the hosts are widely distributed. Theyare not confined to limited areas where the oocysts concentration can increase in the environment to the point that thehosts would ingest large numbers of oocysts. However, from the parasite’s point of view, distribution would be moredifficult in the natural setting. This study suggests that adult crocodiles that spend much of their time in a flock aremore likely to be infected with coccidia than juvenile crocodiles that spend their time in a single cage.
Clustering behavior fosters oocyst transmission because of the close proximity of infected crocodiles passing oocyststo potential new hosts. Oocysts, develop endogenously, are passed in the feces, and sporulate in the environment.Crocodiles become infected when they ingest the sporulated oocysts while feeding. Transmission of the parasite isfacilitated by close contact with infected hosts who are actively passing oocysts in their feces. The results fromquestionnaires indicate that crocodiles were fed chicken skeleton (94%), fish (38%) and pig remains (6%). Theirfeeding habit was controlled by management program. They were fed every two days in the cage. The water supplywas changed either once a week or once a month depending on the farm management. Thus the chance for thefarmed crocodiles exposing to pathogenic agents or infective stage of parasites was very low. Although the transmissionof coccidian parasites is well known, there are few reports of the prevalence of coccidian parasites in wild animalpopulations and no reports of the prevalence of coccidian in the farmed crocodiles in Thailand.
Habitat also influences the prevalence of coccidian in crocodile populations. Adult crocodiles, that were groundfeeders, had higher prevalence of coccidian than juvenile crocodiles that were fed in the single concrete floor cages.Oocyst viability is dependent on moisture and oxygen (Brotherston 1948; Farr and Wehr 1949; Marquardt et al.1960). Oocysts are very susceptible to desiccation and oxygen is required for sporulation and development to theinfective stage. The soil in dens would be moist and conducive to oocysts survival and development. Wild crocodilesand the forest canopy would have more sunlight and higher temperatures that would enhance desiccation and reduceoocyst viability (Long 1959; Farr and Wehr 1949).
In conclusions, both adult and juvenile crocodiles harbored similar species of coccidian parasites. However, theprevalence of protozoan infections was higher in the adults than in the juveniles. These findings could not be easilyexplained based on conventional epidemiological criteria. Colony management, such as housing, sanitation andveterinary interventions such as a regular chemoprophylaxis against protozoa, was expected to be responsible for thelower level of coccidian infection in the juveniles. The lack of chemoprophylaxis against protozoa could have beenresponsible for the relatively higher prevalence in the captive breeding adults.
Literature
Anderson, R.C. (1992). Nematode parasites of vertebrates: their development and transmission. CAB International:Wallingford, UK.
Table 3. Prevalence of intestinal parasites observed by direct faecal smear technique and Modified Kato Thick smeartechnique.
Juvenile crocodile
Faecal exam. Central-Eastern Southern Northeastern Total
No. + % No. + % No. + % No. + % Direct smear 132 0 0 57 0 0 38 0 0 227 0 0 Kato’s thick 132 0 0 57 0 0 38 0 0 227 0 0
464
Brotherson, J.G. (1948). The effect of relative dryness on the oocytes of E. tenella and E. bovsis. Transactions of theRoyal Society of Tropical Medicine and Hygine 42: 10-11.
Calnek, B.W. (1997). Nematodes and acanthocephalans. Pp. 815-849 in Diseases of Poultry, 10th Edition. IowaState University Press: Ames, IA.
Campbell, T.W. (1988). Avian hematology and cytology, PhD Thesis, Iowa State University Press: Ames, IA.
Coudert, P. (1992). Eimeria species from the goat. In Proceedings of the Fourth Conference COST-89. Tours, INRA,October 1992.
Eckert, J., Taylor, M., Catchpole, J., Licois, D., Coudert, P. and Bucklar, H. (1995). Identification of Eimeria speciesand strains. Pp. 108-109 in Guidelines on Techniques in Coccidiosis Research, COST 89/820. Biotechnology.European Commission, Directorate-General XII, Science Research and Development Agriculture BiotechnologyL-2920, Luxemburg.
Farr, M.M. and Wehr, E.E. (1949). Survival of Eimeria acervulina, E. tenella and E. maxima oocyts on soil undervarious conditions. Annuals of the New York Academy of Science 52: 468-472.
Fayer, R. and Reid, W.M. (1982). Control of coccidiosis. Pp. 453-487 in The Biology of the Coccidia, ed. by P.L.Long. University Park Press: Baltimore.
Khalil, L.F., Jones, A. and Bray, R.A. (1994). Keys to the Cestode Parasites of Vertebrates. CAB International:Wallingford, UK.
Long, P.L. (1959). A study of Eimeria maxima, a coccidium of the fowl (Gallus gallus) Annual of Tropical Medicineand Parasitology 35: 325-333.
Marquardt, W.C., Senger, C.M. and Seghetti, L. (1960). The effect of physical and chemical agents on the oocysts ofEimeria zuernii (Protozoa, Coccidia). Journal of Protozoology 7: 186-189.
Martin, L.K. and Beaver, P.C. (1968). Evaluation of Kato thick smear technique for quantitative diagnosis of helminthinfection. Am. J. Trop. Med. 17: 382-391.
Soulsby, F.J.L. (1982). Pp. 767 in Helminths, Arthropods and Protozoa of Domesticated Animals. Bailliere Tindal:London.
Thrusfield, M. (1995). Veterinary Epidemiology. Blackwell Science: London.
465
Efficacy of Siamese Crocodile (Crocodylus siamensis) Serum onBacterial Growth Inhibition
Jindawan Siruntawineti 1 Win Chaeychomsri 1 Boongeua Vajarasathira1,Tawatchai Ong-aat2 and Yosapong Temsiripong2,3
1Department of Zoology, Faculty of Science, Kasetsart University, Bangkok 10900, Thailand([email protected]);2R & D Laboratory, Sriracha Crocodile Farm Co., Ltd., Chonburi 20110;3Crocodile Management Association of Thailand (CMAT)([email protected])
Abstract
Bactericidal efficacy of Thai freshwater crocodile (Crocodylus siamensis) serum was tested. Various serumconcentrations, 100, 75, 50 and 25%, were mixed with Escherichia coli, Pseudomonas aeruginosa, Bacillus subtilisand Staphylococcus aureus, incubated at 37oC for 12 h. The samples, 100 ml, were collected at 0, 1, 3, 6, 9, and 12 hintervals. The crocodile serum, inoculated with E. coli and P. aeruginosa, showed bactericidal activity depending onincubation time and serum concentration. However, the serum, inoculated with B. subtilis and S. aureus, exhibited atime- and concentration-independent inhibition of bacterial growth. The bactericidal activity of crocodile serum wascompletely inhibited by preincubating the serum at 56oC for 30 min. The mechanism of antimicrobial activity maydue to complement system and/or antimicrobial peptides presented in the crocodile serum.
Introduction
Crocodiles infrequently exhibit impairment health conditions due to infection. They often sustain serious injuries byrapidly healing and always without infection. Crocodilians have been known to live with opportunistic pathogenicbacteria with no physiological effects (Madsen et al. 1998). Their immune systems consist of two types of acquiredand innate immune systems. The first line of defense of them against pathogens and parasites is of physical nature viatheir hard skin. However, once this barrier is passed, a complex interaction of innate humoral and cellular immunereactions is induced in both tissues and body fluid in circulatory system, which results in a fast elimination ofmicroorganisms. High avidity binding of proteins to foreign material is a requisite of most humoral immunologicalrecognition events (Dodds and Alex Law 1998).
Blood is a liquid tissue that has three major functions; as a transportation, for regulation, and protection. It holdsspecialized cells and chemicals that defend the body against diseases. As in other higher vertebrate, crocodilian alsohas chemicals involving in host defense mechanisms against infection. Discerning the nature of crocodile immunity,Siamese freshwater crocodile, C. siamensis, serum was evaluated for the efficacy of antimicrobials, and validatedantimicrobial activity.
Materials and Methods
Crocodile samples: Samples were conducted on portions of Sriracha Crocodile Farm, Chonburi, Thailand. Crocodilesin 3 years age, at least 25 kg weight and 1.5-2.0 m length, were used. A blood sample, 5-10 ml, was collected from theanterior dorsal sinus, centrifuged and separated for serum. The serum was kept at -20oC until used.
Bacterial samples and cultures: Lyophilized bacterial strains were purchased from National Institute of Health (NIH,Thailand). The following ATCC-registered strains were used: Escherichia coli (25922), Pseudomonas aeruginosa(27853), Staphylococcus aureus (5638), and Bacillus subtilis (6633). Bacteria were preserved on nutrient agar slantsat 4oC. The bacteria were inoculated in 4 ml of nutrient broth culture and incubated at 37oC overnight to raise logphase growth. Serial dilutions of the log-phase cultures were performed and plated on nutrient agar in 100 x 15 mmpetri dishes. The dishes were incubated at 37oC for 18 h. Then, the cultures were determined for the colony-formingunit (CFU).
Optimized antibacterial assays: Each bacterial culture, E. coli, P. aerugenosa, B. subtilis and S. aureus, in log phasegrowth was prepared in 10-fold serial dilutions using sterile physiological saline. The samples were measured foroptical densities using a spectrophotometer (Spectronic 20 Genesys, Spectronic Instruments, Inc., USA) at 600 nm.Fresh crocodile serum samples, 450 ml, were treated with 50 ml of bacterial cultures or a dilution containing different
466
amounts of bacteria. The samples were incubated at 37oC for 18 h. One hundred ml of a dilution of each sample wasspread onto the surface of nutrient agar plates to determine the CFU. Samples were plated at three different dilutionsto obtain plates with a quantity of colonies such to provide a reasonable estimate of bacterial density (30-300 CFU/plate).
Antibacterial assays: Fresh crocodile serum (F-CS), was diluted to 25, 50, 75 and 100% with physiological saline forvariation of time and concentration dependent. Nine hundred ml samples containing various concentrations ofcrocodiles sera were inoculated with 100 ml of log phase culture of bacteria, approximately 1 x 10⁷ cell/ml. Thesamples were incubated at 37oC for 0, 1, 3, 6, 9, and 12 h. One hundred ml of each sample was spread onto the surfaceof nutrient agar plates to determine the CFU.
Inhibition of antibacterial activity: The inhibition of antibacterial activity in crocodile serum was performed byserum incubation at 56oC 30 min. Then, the inactivated sera (I-CS) were diluted to 25, 50, 75 and 100% withphysiological saline for variation of time and concentration in dependent. Nine hundred ml of samples containingvarious concentrations of crocodile sera were inoculated with 100 ml of optimum concentration that previouslyperformed. The samples were incubated at 37oC for 0, 1, 3, 6, 9, and 12 h. One hundred ml of each sample was spreadonto the surface of nutrient agar plates to determine the bacterial CFU.
Statistical analysis: To obtain valid statistical evaluation of the results, all experiments were performed in triplicate.The percentage of relative growth for each bacterial strain was calculated.
Results
The dilution of bacteria in log phase growth provided optimal colony-number for manually counting exhibited 0.2 ofoptical density at 600 nm. In this study, we used 10-7 dilution of bacteria that showed 30-300 of viable cells onnutrient agar plate. The results showed that concentration, 50-100% of fresh crocodile serum (F-CS) particularlyinhibited E. coli growth in 3 h of incubation (Fig. 1a). However, these gram-negative bacteria were incompletelyinhibited when treated with in 25% F-CS. Pseudomonas aeruginosa growth was totally suppressed by all concentrationsof F-CS approximately in 1 h of incubation (Fig. 1c). Concentration-dependent inhibition of the bacterial growth byF-CS was observed. Moreover, all concentrations of F-CS incompletely inhibited S. aureus and B. subtilis growth(Figs. 2a and 2c). These bacteria remarkably exhibited their colonies less than 150 after all period of incubations. Incontrast, heat-inactivated crocodile serum at 56oC, 30 min (I-CS) fully obliterated the antimicrobial activities (Figs.1b, 1d, 2b and 2d).
Discussion
The crocodile serum exhibited antimicrobial activity including in gram-negative and gram-positive bacteria.In thisstudy, high efficacy in bactericidal activity was observed in gram-negative bacteria, E. coli and P. aeruginosa (Figs.1a and 1c). The results revealed that the antibacterial capacity of F-CS in E. coli was higher than in P. aeruginosa.Both bacteria, as shown in Figures 1b and 1d, were inhibited depend on F-CS concentration and incubation time. Thestrengths of antibacterial activities against bacteria are probably related to bacterial membrane structure. In presentstudy, gram-positive bacteria, S. aureus and B. subtilis, cultured with crocodile serum exhibited fluctuating relativegrowth (Figs. 2a and 2c), however, their relative growth were not over than 150%. Overall results implying that inthe crocodile serum may have antimicrobial factors responsible for defense microbial invaders. Firstly, we hypothesizedthat the antimicrobial factors in serum were including proteins in complement system and antimicrobial peptides.
During the past few years, studies on the components of an immediate immune response against infectiousmicroorganism or innate immune system have established the contribution of antimicrobial peptides (AMPs). AMPsare polypeptides of fewer than 100 amino acids, found in host defense settings, and exhibiting antimicrobial activityat physiologic ambient conditions and peptide concentrations. They are expressed in many tissues, polymorphonuclearleukocytes, macrophages and mucosal epithelial cells (Brogden et al. 2003). AMPs neutralizes bacteria by interactingspecifically with their cell membranes (Lehrer and Ganz 1999). Previously, saltwater crocodile, Crocodylus niloticus,has been exhibited antibacterial activities of lung and adrenal tissues (Shaharabany et al. 1999).
Complement is a necessity part of the innate immune system and contains about 35 soluble and membrane-boundproteins. The complement system performs a major role in killing and neutralizing microorganisms. These eventsare mediated by activation of the lytic pathway and by opsonization. Complement proteins are expressed and circulatedas inactive precursor proteins that can be activated in a very precise and highly coordinated fashion (Campbell et al.

467
05 0
1 0 01 5 02 0 02 5 03 0 0
0 1 3 6 9 1 2
b
05 0
1 0 01 5 02 0 02 5 03 0 0
0 1 3 6 9 1 2
02 0
4 0
6 0
8 01 0 0
0 1 3 6 9 1 2
0
2 0
4 0
6 0
8 0
1 0 0
0 1 3 6 9 1 2
a
dd
c
Incubation time ( hr) Incubation time ( hr)
Incubation time ( hr) Incubation time ( hr)
Serum concentration (%) 25 50 75 100
Figure 1. Relative growth of gram-negative bacteria (E. coli and P. aeruginosa) after treated with fresh andheat-inactivated C. siamensis sera.
d
0
1 0 0
2 0 0
3 0 0
4 0 0
0 1 3 6 9 1 2
01 0 02 0 03 0 04 0 05 0 06 0 0
0 1 3 6 9 1 20
5 0
1 0 0
1 5 0
2 0 0
0 1 3 6 9 1 2
0
5 0
1 0 0
1 5 0
2 0 0
0 1 3 6 9 1 2
a
d
b
Incubationtime ( hr)
Incubation time ( hr)Incubationtime ( hr)
Incubation time ( hr )
Figure 2. Relative growth of gram-positive (S. aureus and B. subtilis) after treated with fresh and heat-inactivated C. siamensis sera.
Serum concentration (%) 25 50 75 100

468
1988). The complement cascade can be initiated by three distinct mechanisms, an antibody-dependent classicalpathway, an antibody-independent alternative pathway and lectin pathway (Fujita 2002). Several investigators havereported the existence of an active serum complement system in a variety of reptilian species (Koppenheffer 1987).For example, Koppenheffer (1986) has evidenced the presence of both classical and alternative pathways in turtleserum. In reptiles, the complement system has been studied almost exclusively in the cobra (Sunyer and Lambris1998). Moreover, Kuo and coworkers (2000) characterized the complement-mediated killing of the Lyme diseasespirochete (Borrelia burgdorferi) in the western fence lizard.
Using classical human serum complement inactivation conditions (incubation at 56oC, 30 min), we found antibacterialactivities obliteration in the treated crocodile serum (Figs. 1 and 2). With evidences that the major sources of AMPsare in various tissues, as described above, and concerning our data, bacterial growth inhibition of the crocodile bloodserum should correspond to serum complement system. Recently, Merchant et al. (2003) have presented antibacterialproperties of serum from the American alligator (Alligator mississippiensis) and suggested an active serum complementsystem. We have done a preliminary study of a sheep red blood cell hemolytic assay, CH50, for the function ofcrocodile complement system. Its results also supported the finding in this study. However, to our knowledge, adetailed functional description of Thai freshwater crocodile complement has not been published to date. Furtherstudies will have to be performed to find more detail in crocodile complements and AMPs.
Literature
Brogden, K.A., Ackermann, M., McCray, P.B. and Tack, B.F. (2003). Antimicrobial peptides in animals and theirrole in host defences. Int. J. Antimicrob. Agent 22: 465-478.
Campbell, R.D., Law, S.K.A., Reid, K.B.M. and Sim, R.B. (1988). Structure, organization, and regulation of theserum complement genes. Ann. Rev. Immunol. 6: 161.
Dodds, A.W. and Alex Law, S.K. (1998). The phylogeny and evolution of the thioester bond-containing proteins C3,C4 and a
2-macroglobulin. Immunol. Rev. 166: 15-26.
Fujita, T. (2002). Evaluation of the lectin-complement pathway and it’s role in innate immunity. Nature Rev. Immunol.2: 346-353.
Koppenheffer, T.L. (1986). Activation of the alternative pathway by both high and low molecular weight turtleantibodies. Am. Zool. 26: 86A.
Koppenheffer, T.L. (1987). Serum complement systems of ectothermic vertebrates. Dev. Comp. Immunol. 11: 279-286.
Kuo, M.M., Lane, R.S., and Giolas, P.C. (2000). A comparative study of mammalian and reptilian alternative pathwayof complement-mediated killing of Lyme disease spirochete (Borrelia burgdorferi). J. Parasitol. 86: 1223-1228.
Lehrer, R.I. and Ganz, T. (1999). Antimicrobial peptides in mammalian and insect host defence. Curr. Op. Immunol.11: 23-27.
Madsen, M., Hangartner, P., West, K. and Kelly, P. (1998). Recovery rates, serotypes, and antimicrobial susceptibilitypatterns of salmonellae isolated from cloacal swabs of wild Nile crocodiles (Crocodylus niloticus) in Zimbabwe.J. Zoo Wildl. Med. 29: 31-34.
Merchant, M., Roche, C., Elsey, R. and Prudhomme, J. (2003). Antibacterial properties of serum from the Americanalligator (Alligator mississippiensis). Comp. Biochem. Physiol. B, 136: 505-513.
Shaharabany, M., Gollop, N., Ravin, S., Golomb, E., DeMarco, L., Ferreira, P.C., Boson, W.L. and Friedman, E.(1999). Naturally occurring antibacterial activities of avian and crocodile tissues. J. Antimicrob. Chemother.44: 416-418.
Sunyer, J.O. and Lambris, J.D. (1998). Evolution and diversity of the complement system of poikilothermic vertebrate.Immunol Rev. 166: 39-57.

469
Amoebacidal Effects of Serum from the American Alligator(Alligator mississippiensis)
Mark Merchant1, Ruth M. Elsey2 and Phillip Trosclair III2
1McNeese State University, Department of Chemistry, PO Box 90455, Lake Charles, Louisiana 70609,USA ([email protected]); 2Louisiana Department of Wildlife and Fisheries, Rockefeller
Wildlife Refuge, 5476 Grand Chenier Hwy, Grand Chenier, Louisiana 70643, USA([email protected])
Treatment of axenic Naegleria gruberi cultures with alligator serum resulted in time-dependent amoebacidal activity,with measurable activity at 5 min and maximal activity occurring at 20 min. The amoebacidal activity wasconcentration-dependent, with measurable activity at 25% serum, while treatment of amoebas with undiluted serumresulted in only 16% survival. The efficiency was dependent on the concentration of amoebas, with higher survivalrates at high amoeba densities and lower survival at low amoeba densities. The amoeba-killing effects of alligatorserum were observed to be broad in spectrum, as the serum was effective against three strains of Naegleria speciestested. In addition, alligator serum was effective against four Acanthamoeba strains, which have been reported to beresistant to human serum complement-mediated lysis. The amoebacidal effects of alligator serum were shown to betemperature-dependent, with optimal activity at 15-30oC and a decrease in activity below 15oC and above 30 oC. Theamoebacidal activity of alligator serum was heat labile and protease sensitive, indicating the proteinaceous nature ofthe activity, and was also inhibited by EDTA, which indicated a requirement for divalent metal ions. Thesecharacteristics strongly suggest that the amoebacidal properties of alligator serum are due to complement activity.

470
GIS-based Habitat Suitability Analysis of Saltwater Crocodiles(Crocodylus porosus) in the Northern Territory
Yusuke Fukuda1, G. Boggs1 and P. Whitehead2
1RS/GIS Group, Charles Darwin University, NT 0909, Australia (s108037labmail.cdu.edu.au);2Key Centre for Tropical Wildlife Management, Charles Darwin University, NT 0909, Australia
Abstract
A habitat suitability model for saltwater crocodiles (Crocodylus porosus) in north-west coastal regions of the NorthernTerritory was constructed using GIS techniques. The requirements of saltwater crocodiles for nesting, feeding andaccess to open water, as defined by a review of the literature, were linked to surrogates mapped at 1:250,000 incoverages assembled in a Geographic Information System (GIS). GIS layers were assigned a weighting based onassessments of the relative importance of each layer for defining suitable habitat. Intersections of the layers wereused to assign a total “habitat suitability” score to all cells in the study area, derived from the sum of the weightedscores across all layers. The predicted habitat suitability map showed distinct areas with high habitat suitability,particularly in the lower floodplains of the region. The results of the habitat suitability were summarised on a catchmentbasis. The Mary River Catchment had the greatest proportion of highly suitable habitat (12%) followed by theFinniss/Reynolds River Catchment (8%) and the Adelaide River Catchment (6%) whilst the Darwin/BlackmoreRiver catchment had the lowest proportion of suitable habitat (0%). A simple validation of the model (using datafrom the Parks and Wildlife Service of the Northern Territory) showed a relatively high correspondence between thehabitat suitability prediction and the actual population data, with an overall accuracy of approximately 35%. Thismodel was based on readily available but relatively broadly defined attributes mapped at coarse scales. We arguethat, with refinement, GIS analyses may help inform management of crocodiles and their habitat in the NorthernTerritory and elsewhere.
Introduction
Geographical Information Systems (GIS) are much used in natural resource management as a powerful tool formanaging spatial and temporal information (eg Bridgewater 1993; Stow 1993; Berry 2000). Applications to wildlifemanagement have taken advantage of the opportunities to link GIS with environment models to investigate andmodel dynamic species-environment relationships (Ackakaya 1994; Koeln et al. 1996). One of the most commonGIS applications is habitat suitability analysis and mapping. A habitat suitability map is defined as a map displayingthe suitability of land or water as a habitat for specific wildlife species (Leeuw et al. 2002). Production of a habitatsuitability map requires a predictive model with a set of environmental variables that define the resources requiredby the species. GIS combines spatial representations of these variables to create the predicted habitat suitabilitymaps.
We applied GIS techniques to predict suitable habitat on catchment basis for Saltwater Crocodiles (Crocodylusporosus) in the Northern Territory of Australia. The objectives of the analysis were to: 1) model habitat suitabilitybased on environmental attributes thought to influence crocodile distribution, 2) generate a habitat suitability map ofcrocodiles based on the habitat suitability derived from the model, and 3) examine the validity of the predictedhabitat suitability by comparing it to actual crocodile density data.
Methods
Study Area
The study area is the north west coastal regions of the Northern Territory, covering the major river systems andfloodplains between the Moyle River in the west and the Glyde River (Arafura Swamp) in the northeast coast of theNorthern Territory. The total area of the study site is approximately 109,500 km2.

471
Input Data
Five different input datasets were used in this study:
• GEODATA TOPO 250K SERIES 2 - Hydrography Theme• GEODATA Australian Surface Water Management 2000 (SWMA 2000)• GEODATA 9-Second Grid Digital Elevation Model (9 Second DEM)• Wetland Vegetation Map in the NT• Crocodile Population Data in the NT
All the GEODATA datasets were obtained from Geoscience Australia. The Wetland Vegetation Map in the NT andCrocodile Population Data in the NT were provided by the Parks and Wildlife Service of the NT and WildlifeManagement International through the Key Centre for Tropical Wildlife Management.
Habitat Modelling
Requirements for suitable habitat were determined by a literature review and from expert opinion. To reflect variousaspects of crocodile biology, the habitat criteria were defined in terms of accessibility to a waterbody, availability offood, and influence on successful breeding and nesting. Based on these criteria for rating habitat favourability,environmental variables to be incorporated in the model were derived from the available data (Table 1).
Each variable was divided into 3 classes based on the statistical distribution of the variable. These classes referred toLow, Medium and High values and were assigned suitability values of 1, 2 and 3, respectively. The variables werefurther multiplied by a weighting value based on their impact on habitat suitability. The weightings were calculatedbased on the variable’s relevance to the habitat criteria and their importance as determined by the literature review(eg suitability values of any variable related to permanent water were doubled) (Table 1).
After assigning the weighted habitat suitability value to each variable, the GIS layers were overlayed and the individualsuitability values summed to calculate an overall habitat suitability score in the study area. The final habitat suitabilityscores were divided into three equal classes to represent low, medium and highly suitable areas.
Data validation of the results was performed to assess the accuracy of the model. The habitat suitability map wascompared to actual crocodile population data in the NT provided by the PWCNT. An error matrix was constructed tosee the fitness of the predictive model to the observed population data.
Results and Discussion
Overall habitat suitability
The output showed some distinct areas with high habitat suitability, particularly in the lower floodplains of theregion (Figs. 1 and 2). In terms of habitat quality, the Mary River Catchment had the greatest proportion of highsuitability habitat (12%), followed by the Finniss/Reynolds River Catchment (8%) and the Adelaide River Catchment(6%). The Darwin/Blackmore River catchment had the lowest proportion of high suitability (0%). Interestingly, theEast Alligator River had the greatest proportion of habitat rated above zero suitability (59%) although the proportionof high suitability habitat was very low (0.3%).
Model validation
At the relatively crude level of our validation, the error matrix showed an overall accuracy of approximately 35%(Table 2). It should, however, be noted that, since most animal species are mobile and use different habitat types fordifferent purposes at different times, a single assignment of habitat suitability represents a gross oversimplification(Leeuw et al. 2002). We conclude that the match between predicted habitat suitability and observation of variation indensities is sufficient to show the potential to rank habitat suitability at large spatial scales by application of GIS toreadily available mapped information.
Limitations
It is important that the application of such approaches be matched to the management objectives. We regard this
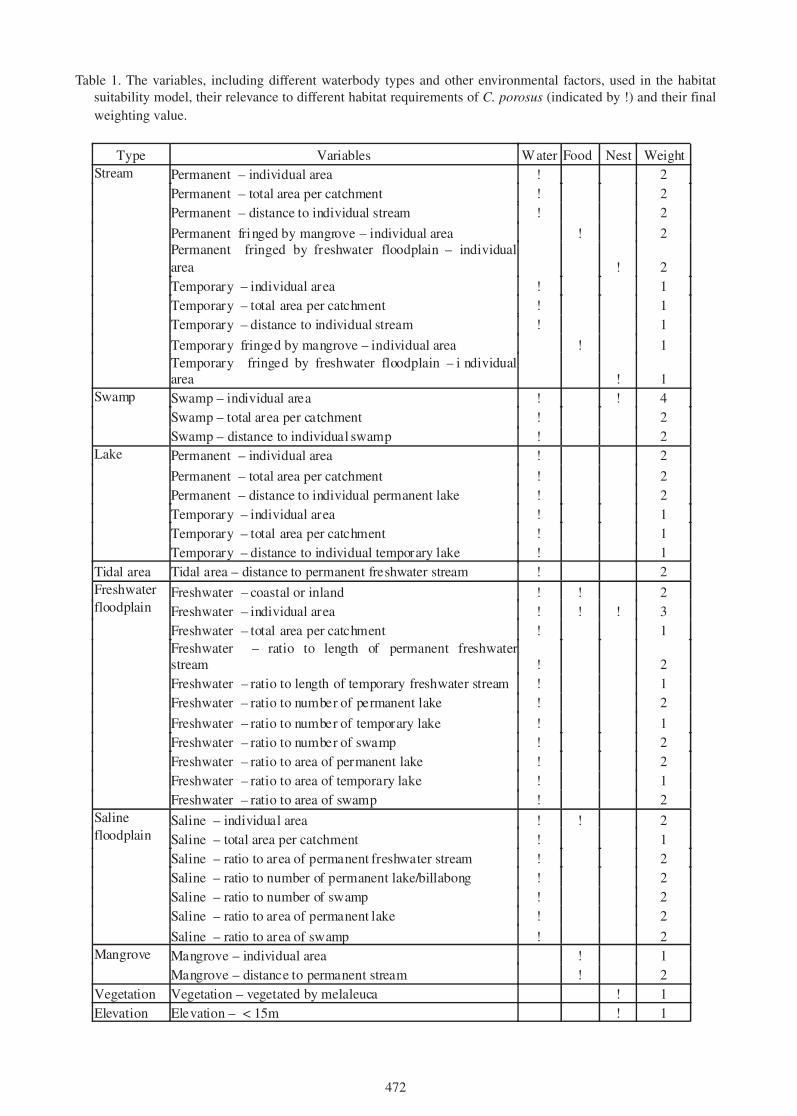
472
Type Variables Water Food Nest WeightPermanent – individual area ! 2Permanent – total area per catchment ! 2Permanent – distance to individual stream ! 2
Permanent fringed by mangrove – individual area ! 2Permanent fringed by freshwater floodplain – individualarea ! 2Temporary – individual area ! 1Temporary – total area per catchment ! 1Temporary – distance to individual stream ! 1
Temporary fringed by mangrove – individual area ! 1
Stream
Temporary fringed by freshwater floodplain – i ndividualarea ! 1Swamp – individual area ! ! 4Swamp – total area per catchment ! 2
Swamp
Swamp – distance to individual swamp ! 2Permanent – individual area ! 2
Permanent – total area per catchment ! 2Permanent – distance to individual permanent lake ! 2Temporary – individual area ! 1Temporary – total area per catchment ! 1
Lake
Temporary – distance to individual temporary lake ! 1Tidal area Tidal area – distance to permanent freshwater stream ! 2
Freshwater – coastal or inland ! ! 2Freshwater – individual area ! ! ! 3Freshwater – total area per catchment ! 1Freshwater – ratio to length of permanent freshwaterstream ! 2Freshwater – ratio to length of temporary freshwater stream ! 1Freshwater – ratio to number of permanent lake ! 2
Freshwater – ratio to number of temporary lake ! 1Freshwater – ratio to number of swamp ! 2Freshwater – ratio to area of permanent lake ! 2Freshwater – ratio to area of temporary lake ! 1
Freshwaterfloodplain
Freshwater – ratio to area of swamp ! 2
Saline – individual area ! ! 2Saline – total area per catchment ! 1Saline – ratio to area of permanent freshwater stream ! 2Saline – ratio to number of permanent lake/billabong ! 2Saline – ratio to number of swamp ! 2Saline – ratio to area of permanent lake ! 2
Salinefloodplain
Saline – ratio to area of swamp ! 2Mangrove – individual area ! 1Mangrove
Mangrove – distance to permanent stream ! 2Vegetation Vegetation – vegetated by melaleuca ! 1Elevation Elevation – < 15m ! 1
Table 1. The variables, including different waterbody types and other environmental factors, used in the habitatsuitability model, their relevance to different habitat requirements of C. porosus (indicated by !) and their finalweighting value.

473
0500
1000
1500
20002500
3000
C a t c h m e n t
High suitabality
Medium suitability
Low suitability
Figure 2. Area of each suitability class in each catchment.
473
0500
1000
1500
20002500
3000
C a t c h m e n t
High suitabality
Medium suitability
Low suitability
Figure 2. Area of each suitability class in each catchment.

474
ObservationHigh Medium Low N/A Total
High 23 44 23 10 100Medium 18 48 28 6 100
Low 16 33 34 16 100Prediction
N/A 6 20 38 36 100
Table 2. Error matrix of the predicted habitat suitability classes compared tothe observed density classes. The values are shown as a percentage of thepredicted recordings.
study as no more than a “proof of concept” in its present form. Enhancement to permit predictions relevant tomanagement (eg sites warranting special protection) will require identification of additional data sources, perhaps atfiner spatial scales, relevant to habitat needs of estuarine crocodiles. Exploration of options and refinement of methodsare presently under investigation.
Acknowledgements
We would like to thank Professor Grahame Webb and Charlie Manolis who gave us the opportunity to present thiswork at the 17th Working Meeting of the CSG. Yusuke Fukuda also appreciates the support of Asako Kobayashi.
Literature
Akcakaya, H.R. (1994). GIS Enhance Endangered Species Conservation Efforts. GIS World 7: 36-40.
Berry, J.K. (2000). GIS Technology in Environmental Management: a Brief History, Trends and Probable Future. Pp.49-76 in Global Environment Policy and Administration, ed. by D.L. Soden and B.L. Steel. Marcel Dekker:New York.
Bridgewater, P.B. (1993). Landscape ecology, geographic information systems and nature conservation. Pp. 23-36 inLandscape Ecology and Geographical Information Systems, ed. by R. Haines-Young, D.R. Green and S.H.Cousins. Taylor and Francis: London.
Leeuw, J.E., Ottichilo, W.K., Toxopeus, A.G. and Prins, H.T. (2002). Application of remote sensing and geographicinformation systems in wildlife mapping and modelling. Pp. 121-145 in Environmental Modelling with GISand Remote Sensing, ed. by A. Skidmore. Taylor and Francis: London.
Stow, D.A. (1993). The role of geographic information systems for landscape ecological studies. Pp. 365-378 inLandscape Ecology and Geographical Information Systems, ed. by R. Haines-Young, D.R. Green and S.H.Cousins. Taylor and Francis: London.

475
Temperature-sex Determination in the Broad-snouted Caiman(Caiman latirostris)
Luciano M. Verdade1,2, Carlos I. Piña2 and Maristela P. Miranda-Vilela1
1 Animal Ecology Lab/ESALQ, University of São Paulo, PO Box 09, Piracicaba, SP 13418-900, Brazil(Tel./Fax: 55 (19) 3433-1922; [email protected]);
2 C.I.C. y T.T.P. - CONICET, Fac. de Cs. y Tec., UadER, Dr. Matteri y España, 3105 Diamante,Entre Ríos, Argentina ([email protected])
[CIP = Author for Correspondence]
The present study was carried out with the captive colony of Broad-snouted caiman (Caiman latirostris) at theLaboratório de Ecologia Animal/ESALQ/USP, in the summer of 2001. We collected eggs from two clutches withinthe first 24 hours after egg-laying and incubated them at temperatures of 28, 30, 32 and 34ºC. The eggs were placedon plastic trays and covered with vermiculite, which was kept humid. Digital Thermolab® 6030 thermometers wereattached to each incubator near the egg trays, and the temperature was registered every morning. The mean hatchingsuccess at 30°C was 70%, at 32°C was 79% and at 34°C was 65%, and at 28°C was nil. At temperatures of 30°C thesex ratio produced was 10% male and 90% female; at 32°C it was 46% male and 54% female; and, at 34°C thegender produced in both nests was 100% male.
Workplace Health and Safety Queensland - Guidelines for theExhibition and Farming of Crocodiles
Ryan Anderson
Workplace Health and Safety Queensland, a Division of the Queensland Department of Industrial Relations, iscurrently rewriting its guidelines for the crocodile industry. The guidelines relate to the exhibition and farming ofcrocodiles only and not to activities such as meat processing.
Workplace Health and Safety Queensland invites stakeholders to comment on a draft copy of the guidelines availableat the poster stand. Through working with industry practical guidance material can be developed that will make theexhibition and farming of crocodiles a healthier and safer activity.
Officers from Workplace Health and Safety Queensland will be attending the stand. Please feel free to make enquiriesregarding the guidelines, the process for review or any general workplace health and safety issues.
476
Diet and Condition of American Alligators (Alligator mississippiensis)in Three Central Florida Lakes
Amanda N. Rice
Everglades National Park SFNRC, 40001 SR 9336, Homestead, FL 33034, USA([email protected], [email protected])
Understanding the diet of crocodilians is important because diet affects condition, behavior, growth, and reproduction.In this study, I examined the diet and condition of adult American alligators (Alligator mississippiensis) in threecentral Florida lakes, Griffin, Apopka, and Woodruff. Alligators ate a variety of vertebrates and invertebrates, butvertebrates were more abundant and fish dominated alligator diets in the lakes. Species composition of fish variedamong the lakes. The majority alligator diets from Lakes Apopka and Woodruff was fish, 90% and 84% respectively.Lake Apopka alligators consumed a significantly (P= 0.006) higher proportion of fish. Fish were 54% of LakeGriffin alligator diets and the infrequent occurrence of reptiles, mammals, birds, and amphibians often resulted in alarge biomass.
Alligator condition (Fulton’s Condition Factor, K) was significantly (P<0.001) different among the lakes. Alligatorsfrom Lake Apopka had the highest condition, followed by those from Lake Griffin, and alligators from Lake Woodruffhad the lowest condition. Composition of fish along with diversity and equitability of fish in alligator diets may havecontributed to differences in condition among lakes. The observed diet and condition differences probably reflectboth habitat differences and prey availability in these three lakes.

477
Cranial Morphometric Study of Chinese Alligatorsin Different Age Groups
Xue Hui1 Wu Xiaobing1, Jiang Hongxin2, Ruan Xiangdong2 and Nie Jishan3
1College of Life Sciences, Anhui Normal University, Key Lab for Conservation andUtilization of Biological Resources in Anhui, Wuhu 241000; 2Department of Wildlife Conservation,SFA, Beijing 100091; 3Anhui Researching Center for Chinese Alligator Reproduction, Xuancheng
242000, China
Abstract
Morphology study is the most basic part of biology, while cranial morphology study is especially important forcrocodilians. In this paper, 98 samples were taken from different age groups of Chinese alligator according to themeasurements adapted from Iordansky (1973), 14 variables were achieved from each specimens. Meanwhile, 10ratio variables were also introduced because the cranial morphology traits depend on some of these ratios. The ratiovariables characterized the short and broad trait of head, as well as indicated that the orbital is rather large and broad.Most of the ratios of different age groups have statistical difference except relative length of mandibular symphysis(RLSS; p= 0.369), which indicated that there were distinctions between different phases ontogenetically. This studysuggested that ratio variables vary regularly most of the time. It’s obviously useful to grasp those ratios and theirvariations among different age groups for alligator’s cranium and fossil identification, age-estimation, and wildinvestigation.
Introduction
Cranial morphology traits depend on some optimal ratio variables in crocodylidae and cranial morphology researchhas been done on many species, such as Alligator mississippiensis, Crocodylus novaeguineae, and Caiman latirostris(Allstead et al. 1995; Hall et al. 1994; Verdade et al. 1998). Beside the visual observation, the pertinent datum ismuch more necessary for qualitative analysis of cranial shape, containing the traits of length, width and height, andcomparison between interspecies, different geographical populations, and different age groups. Iordansky (1973)defined 14 measurement variables and 10 ratio variables to depict the configuration and appearance of the wholecranium. These variables were received by most of the researchers (Verdade et al. 1998; Cong et al. 1998). Measurementrecord about Chinese alligator (Alligator sinensis) had been seen in several papers (Zhu et al. 1957; Huang et al.;Cong et al. 1998). But small sample size and uncoincident measurement standards didn’t suit for comparison andanalysis of cranial morphology.
Mook (1921) and Iordansky (1973) found that the cranial shape varied with the animals growing, and snout changesfrom acute to blunt, from narrow to broad, and from short to long; orbital shape and size vary at the same time; thecranial sculpturing become more and more. Chen (1985) did some primary research on the difference of craniumbetween the young and the old, while the few samples can’t draw a conclusion for them. In this paper, the cranialshape of different age groups was compared to explore the rule in the varying course.
Materials and Methods
The samples were taken from Anhui Researching Center for Chinese Alligator Reproduction (ARCCAR). There arefive age group animals in the center, including eight-month-old, one-year-old (about 15 months), two-year-old (about27 months), three-year-old (about 39 months) and four-year-old (more than 51 months, containing few five-year-oldindividuals, as the four-year-old group and the five-year-old group were bred together and unable to be identified inARCCAR, the four-year-old is considered as matured). Fourteen head variables were taken for each alligator, inaddition to total length (TL) and snout-vent length (SVL) (Table 1). Instruments needed are simple: a steel electronicdigital caliper (0.01 mm precision, third decimal unconsidered) and a tape. The study began at the onset of theanimals’ hibernation period to reduce the infection on the animals.
Before analyzing the data, normality and homogeneity were tested by Kolmogorov-Simirnov, Shapiro-wilk and

478
Levene-test on them. After tested, some data was transformed to fit for the need of the analysis later. One-wayANOVA and Tukey’ HSD were used to test the difference significance and compare the correspondent data.
Results
Descriptive statistics for measurements of the head of each age group were shown in Table 2. Ten ratio variableswere introduced (see Table 3) and the ratio were tested by One-way ANOVA and Tukey’ HSD to find the differencebetween age groups (see Table 4). The result indicates that most of the ratio variables exist difference between eachgroup.
Analysis and Discussion
Ratios about cranium
In other species of Crocodylidae, there is a difference between two measurements - dorsal cranial length and axiallength of cranium and axial length cranial (between the tip of the snout and the posterior margin of the occipitalcondyle) is longer usually, but the two measurements are very similar in Chinese alligator. So the dorsal craniallength (DCL) is regarded as cranial length approximately. Cranial length of 8-month old Chinese alligator is about(28.35 + 0.19) of SVL, (13.53 + 0.10) of TL, while the length of the 4-year old is about (22.75 + 0.41) of SVL, (11.34+ 0.07) of TL. The proportion in SVL becomes less and less gradually from 8-month to 4-year-old (F
4, 93= 33.062,
p<0.001). Thus it can be seen, the relative length of cranium takes on reverse ratio function relationship with age (seeFig. 1).
Usually cranial width index was used to express relative cranial width, which is the major factor to decide the cranialtype, as well as directly reflect whether the cranium is broad or not. The high value of cranial width index embodiesthe short broad trait of cranium of Chinese alligator obviously. Cong et al. (1998) compared the Chinese alligatorwith other species, and found that the index of Chinese alligator was greater than most of other crocodilians. Whentesting RCW of 5 age phases of Chinese alligators, we found that the value of one-year and four-year individuals isrelatively high; that of 8-month and three-year individuals was not high; and it is relatively low in the two-yearindividuals (see Fig. 1, RCW). The cranial width index of different age varies irregularity and the RCW has no linearcorrelation with age.
Ratios about snout
Snout also can be called rostrum, whose relative length determines the stretch of itself and effects on the cranial
Abbreviation Explanation UnitDCL Dorsal cranial length: anterior tip of snout to posterior
surface of occiptal condylemm
CW Cranial width: distance between the lateral surface of themandibuar condyles of the quadrates
mm
SL Snout length: anterior tip of snout to anterior orbitalborder
mm
SW Basal snout width: width across anterior orbital borders mmOL Maximal orbital length mmOW Maximal orbital width mmIOW Minimal interorbital width mmLCR Length of the postorbital cranial roof: orbital border to
the posterolateral margin of the squamosalmm
WN Maximal width of external nares mmPXS Length of palatal premaxilary symphysis mmML Mandible length mmLMS Length of the mandibular symphysis mmWSR Surangular width mmLM Length of lower ramus mm
Table 1. Measurements (adapted from Iordansky 1973).

479
Tabl
e 2.
Des
crip
tive
stat
istic
s fo
r he
ad-s
ize
in C
hine
se A
lliga
tor.
N=
sam
ple
size
; M=
mea
n; C
V=
coe
f fic
ient
of
vari
atio
n; O
.R.=
obs
erve
d va
lue
rang
e.
8 m
onth
(N
= 1
8)O
ne y
ear
(N=
20)
Two
year
(N
= 2
0)T
hree
yea
r (N
= 2
0)Fo
ur y
ear
(N=
20)
MC
VO
.R.
MC
VO
.R.
MC
VO
.R.
MC
VO
.R.
MC
VO
.R.
DC
L39
.74
0.03
337
.96-
43.6
052
.21
0.05
447
.32-
58.4
968
.99
0.05
162
.21-
75.6
195
.67
0.05
186
.49-
105.
1413
2.42
0.05
011
7.18
-142
.46
CW
24.5
10.
054
23.0
8-25
.88
32.6
70.
074
28.8
0-39
.32
41.1
40.
045
37.8
2-44
.77
58.0
10.
053
52.4
8-63
.61
82.8
50.
068
70.7
6-90
.74
SL16
.72
0.08
611
.86-
19.0
024
.37
0.06
921
.36-
28.4
435
.01
0.08
230
.08-
39.8
148
.66
0.06
242
.73-
54.8
669
.49
0.06
062
.19-
76.7
3SW
18.8
80.
093
13.6
0-21
.80
25.0
90.
073
20.8
3-28
.44
33.9
60.
049
30.7
2-36
.69
48.9
00.
067
40.7
6-54
.37
69.4
60.
065
58.7
9-79
.01
OL
12.8
50.
038
12.1
6-13
.62
15.4
90.
054
13.9
8-17
.39
20.1
10.
058
17.9
1-22
.41
23.4
20.
054
20.7
6-25
.54
31.0
80.
087
27.0
3-37
.54
OW
10.9
90.
043
10.2
0-12
.00
12.6
50.
062
11.6
1-14
.34
15.8
90.
083
13.6
3-18
.36
18.3
00.
088
15.2
3-22
.70
22.4
10.
070
19.1
1-26
.57
IOW
2.68
0.13
21.
94-3
.34
4.48
0.12
43.
38-5
.53
5.32
0.12
43.
87-6
.44
6.78
0.12
85.
21-8
.46
8.44
0.17
05.
27-1
2.27
LC
R13
.73
0.06
212
.24-
16.4
816
.24
0.07
214
.43-
19.1
320
.17
0.06
118
.03-
22.2
425
.60
0.07
222
.55-
28.8
231
.76
0.06
928
.02-
36.1
5W
N6.
700.
029
6.28
-7.0
08.
480.
080
6.98
-9.7
310
.99
0.06
99.
39-1
2.09
16.8
60.
064
14.9
2-19
.43
24.3
60.
052
21.2
7-26
.25
PXS
8.07
0.08
16.
56-8
.84
11.0
20.
074
9.70
-12.
3814
.58
0.08
612
.24-
16.6
420
.77
0.08
317
.06-
24.1
228
.94
0.11
824
.55-
38.8
5M
L39
.32
0.03
137
.52-
41.6
855
.39
0.06
844
.44-
62.9
574
.29
0.05
266
.99-
79.7
510
3.26
0.08
075
.22-
114.
9314
5.88
0.05
112
8.70
-156
.58
LM
S6.
840.
056
6.12
-7.7
013
.09
0.09
77.
62-1
0.84
11.5
30.
085
10.2
6-13
.87
16.4
30.
067
14.5
2-18
.96
22.6
60.
090
17.8
3-27
.20
WSR
23.5
30.
045
22.0
0-26
.36
30.4
20.
073
26.0
5-33
.90
40.3
30.
062
35.1
7-45
.01
58.2
70.
056
52.0
1-65
.35
85.4
90.
065
72.8
5-95
.42
LM
22.7
00.
060
20.5
4-25
.62
39.2
20.
070
32.9
9-45
.49
54.4
80.
069
48.0
1-61
.57
74.5
80.
066
66.5
0-81
.97
101.
590.
058
90.4
2-11
5.56

480
length and shape of whole cranium. Figure 2 indicates that RLST become greater gradually and the values of differentages were documented to have significant difference by test. Obviously, the extension of snout increases step by step,at the same time the orbital location move backward relatively.
The width index of snout (100 times of RWST) is used to judge the extent of long or narrow, short or broad: °‹40refers to elongate, °›70 refers to broad, and >40, <70 refers to intermediate. Mean width indexes of snout of theyoung and the old are all about 100, even more than 100. The snout width index listed in this paper is greater thanthat with 88-83 (Cong, L.Y, 1998), which may be caused by the measurement difference between the living and theskeleton or other reasons. However, the Chinese alligator belong to broad type without any question. In the sametype, index of Broaded-snouted Caiman (Caiman latirostris) is especially great, and even reaches near to 130 insome large individuals (Verdade 1998). RWST of 8-month-old individuals is the greatest among all objects measured,one-year secondly, the three- and four-year old have no significant difference with the two aforementioned, the two-year individuals is lowest. Without considering the two-year old, snout width index take on decreasing trend with theanimals growing up.
Ratios about the orbita
The length of orbita is always greater than the width of orbita in crocodilians, the smaller the individual, the biggerthe proportion of orbita in cranium, which presents as ROL and ROW decreases with the animals growing up in the
Abbreviation ExplanationRCW Relative cranial width: CW/DCLRLST Relative length of snout: SL/DCLRWST Relative width of snout: SW/SLROL Relative orbital length: OL/DCLROW Relative orbital width: OW/OLRWI Relative interorbiatl width: IOW/OLRWN Relative width of external nares: WN/(DCL-SL)RPXS Relative length of premaxillary symphysis: PXS/DCLRLSS Relative length of mandibular symphysis: L MS/MLRWM Relative width of mandible: WSR/ML
Table 3. Head-size ratios (introduced from Iordansky 1973). Usually use the ratio asindex form, meaning 100 times of the relative length.
A 8mB 1aC 2aD 3aE 4a
age
DCL/SVL DCL/TL RCW0.00
0.20
0.40
0.60
cran
ial r
atio
A 8mB 1aC 2aD 3aE 4a
age
RLST RWST0.00
0.25
0.50
0.75
1.00
snou
t rat
io
Figure 1. The bars show the mean ratios aboutcranium of different age groups, Y scale axisrefer to the ratio value.
Figure 2. The bars show the mean ratios aboutsnout of different age groups, Y scale axis referto the ratio value.

481
measurements, whereas RWI takes on increasing trend. As Figure 3 shows, RLST and RWST reduce gradually withgrowing. This indicates the proportion of orbita in cranium shows descending trend and the shape becomes narrowrelatively. RWI is relatively low in the 8-month old; other age stages don’t differ significantly. Through comparison,values of RWST and RLST are greater than that of other species, nevertheless the RWI are lower than other ratios.These differences make up of the large and broad trait of orbita.
Other ratios
The relative length of premaxillary symphsis (RLSS) increases with the age increasing, that is to say, the proportionof premaxillary symphsis in cranium appears increasing trend and they grow relatively fast in contrast to wholecranium. The relative width of mandibular of 8-month individuals is the greatest, four-year-old individuals in thenext place, one-year, three-year-old thirdly, the two-year-old is the lowest, whole trend take on “V” shape (see Table4): the 8-month value is the greatest, then the ratio descends with growth, later rise again. No age differences wererecognized in RLSS. RWN of different age groups differs significantly and takes on rapidly increasing tendency.
Conclusions
In taxonomy, Chinese alligator belongs to genus Alligator, Family Alligatoridae. High RCW and RWST valuesdecide the outstanding morphology traits of them - broad cranium and broad snout. So, this species is classified asshort-snouted type. The value of ROW is high relatively, and the orbita is relatively broad, when compared withother species. Some ratio variables (RLST, RPXS, RWN) take on increasing trend, some (ROL, RWST) take ondescending trend, and several (RWM) takes on descending then increasing trend. Thus it can be seen, the wholeontogenetic trends of cranium in Chinese alligator take on: With age increasing, the trend of relative cranial widthwas not evident, probably the hatchlings and adults have great RCW value, while the middle ages have low value;The snout extend fast relatively, which make the snout turn narrow relatively; Both ROL and ROW reduce withindividuals growing up, which reflect the relatively lessening of orbita against the age. In addition, both the length ofpremaxillary symphsis and width of nares increase rather rapidly, and the relative width of mandibular vary in V-shaped.
It is obviously useful to grasp those ratios and their variations of different age groups for alligator’s cranium andfossil identification. It also offered a feasible way to estimate the age of Chinese alligators. When identifying thecranium and fossil, the pertinent head-size variables and ratio variables can be used as standard to compare with thevalues of cranium and fossil being identified. Meantime, the regression equations between head-size variables andsnout-vent length, the head-size variables, head ratio variables and age can predict the body length and age of thealligator met in wild.
A 8mB 1aC 2aD 3aE 4a
age
ROL ROW RWI0.00
0.20
0.40
0.60
0.80
orbi
tal r
atio
A 8mB 1aC 2aD 3aE 4a
age
RWN RPXS RWM0.00
0.20
0.40
0.60
ratio
Figure 3. The bars show the mean ratios about orbitaof different age groups, Y scale axis refer to theratio value.
Figure 4. The bars show the mean ratios of othervariables of different age groups, Y scale axisrefer to the ratio value.
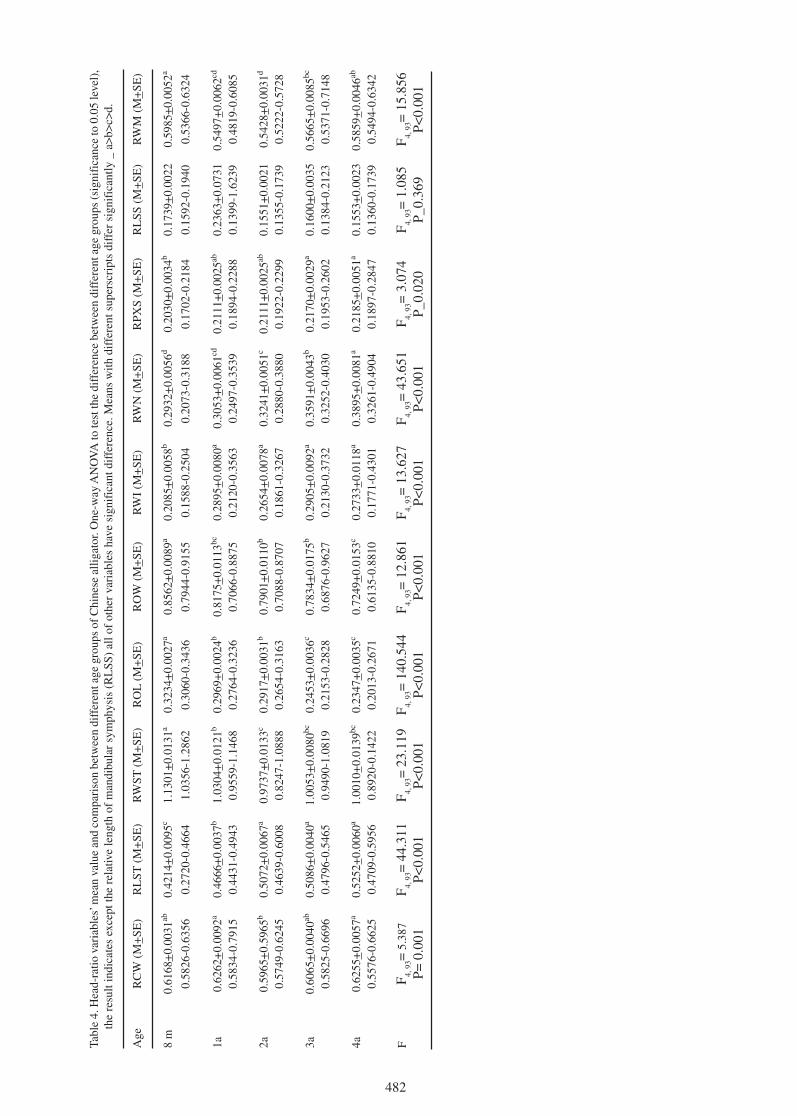
482
Tabl
e 4.
Hea
d-ra
tio v
aria
bles
’ mea
n va
lue
and
com
pari
son
betw
een
diff
eren
t age
gro
ups
of C
hine
se a
lliga
tor.
One
-way
AN
OV
A to
test
the
diff
eren
ce b
etw
een
diff
eren
t age
gro
ups
(sig
nifi
canc
e to
0.0
5 le
vel)
,th
e re
sult
indi
cate
s ex
cept
the
rela
tive
leng
th o
f m
andi
bula
r sy
mph
ysis
(R
LSS
) al
l of
othe
r va
riab
les
have
sig
nifi
cant
dif
fere
nce.
Mea
ns w
ith d
iffe
rent
sup
ersc
ript
s di
ffer
sig
nifi
cant
ly _
a>
b>c>
d.
Age
RC
W (
M+
SE)
RL
ST (
M+
SE)
RW
ST (
M+
SE)
RO
L (M
+SE
)R
OW
(M
+SE
)R
WI
(M+
SE)
RW
N (
M+
SE)
RPX
S (M
+SE
)R
LSS
(M
+SE
)R
WM
(M
+SE
)
8 m
0.61
68+
0.00
31ab
0.42
14+
0.00
95c
1.13
01+
0.01
31a
0.32
34+
0.00
27a
0.85
62+
0.00
89a
0.20
85+
0.00
58b
0.29
32+
0.00
56d
0.20
30+
0.00
34b
0.17
39+
0.00
220.
5985
+0.
0052
a
0.58
26-0
.635
60.
2720
-0.4
664
1.03
56-1
.286
20.
3060
-0.3
436
0.79
44-0
.915
50.
1588
-0.2
504
0.20
73-0
.318
80.
1702
-0.2
184
0.15
92-0
.194
00.
5366
-0.6
324
1a0.
6262
+0.
0092
a0.
4666
+0.
0037
b1.
0304
+0.
0121
b0.
2969
+0.
0024
b0.
8175
+0.
0113
bc0.
2895
+0.
0080
a0.
3053
+0.
0061
cd0.
2111
+0.
0025
ab0.
2363
+0.
0731
0.54
97+
0.00
62cd
0.58
34-0
.791
50.
4431
-0.4
943
0.95
59-1
.146
80.
2764
-0.3
236
0.70
66-0
.887
50.
2120
-0.3
563
0.24
97-0
.353
90.
1894
-0.2
288
0.13
99-1
.623
90.
4819
-0.6
085
2a0.
5965
+0.
5965
b0.
5072
+0.
0067
a0.
9737
+0.
0133
c0.
2917
+0.
0031
b0.
7901
+0.
0110
b0.
2654
+0.
0078
a0.
3241
+0.
0051
c0.
2111
+0.
0025
ab0.
1551
+0.
0021
0.54
28+
0.00
31d
0.57
49-0
.624
50.
4639
-0.6
008
0.82
47-1
.088
80.
2654
-0.3
163
0.70
88-0
.870
70.
1861
-0.3
267
0.28
80-0
.388
00.
1922
-0.2
299
0.13
55-0
.173
90.
5222
-0.5
728
3a0.
6065
+0.
0040
ab0.
5086
+0.
0040
a1.
0053
+0.
0080
bc0.
2453
+0.
0036
c0.
7834
+0.
0175
b0.
2905
+0.
0092
a0.
3591
+0.
0043
b0.
2170
+0.
0029
a0.
1600
+0.
0035
0.56
65+
0.00
85bc
0.58
25-0
.669
60.
4796
-0.5
465
0.94
90-1
.081
90.
2153
-0.2
828
0.68
76-0
.962
70.
2130
-0.3
732
0.32
52-0
.403
00.
1953
-0.2
602
0.13
84-0
.212
30.
5371
-0.7
148
4a0.
6255
+0.
0057
a0.
5252
+0.
0060
a1.
0010
+0.
0139
bc0.
2347
+0.
0035
c0.
7249
+0.
0153
c0.
2733
+0.
0118
a0.
3895
+0.
0081
a0.
2185
+0.
0051
a0.
1553
+0.
0023
0.58
59+
0.00
46ab
0.55
76-0
.662
50.
4709
-0.5
956
0.89
20-0
.142
20.
2013
-0.2
671
0.61
35-0
.881
00.
1771
-0.4
301
0.32
61-0
.490
40.
1897
-0.2
847
0.13
60-0
.173
90.
5494
-0.6
342
FF
4, 9
3= 5
.387
F4,
93=
44.
311
F4,
93=
23.
119
F4,
93=
140
.544
F4,
93=
12.
861
F4,
93=
13.
627
F 4, 9
3= 4
3.65
1F 4,
93=
3.0
74F
4, 9
3= 1
.085
F4,
93=
15.
856
P= 0
.001
P<0.
001
P<0.
001
P<0.
001
P<0.
001
P<0.
001
P<0.
001
P_0.
020
P_0.
369
P<0.
001
483
Acknowledgements
We thank the Anhui Research Center for Chinese Alligator Reproduction for their gracious assistance in the datacollection. This study was sponsored by National Natural Science Foundation of China (NSFC, No. 30270213),Natural Science Foundation of Anhui Province (No. 01043501), special funds for Anhui Young Leaders FellowshipFund (04043049), the grants from National Forestry Administration and Conservation and Utilization of ImportantBiological Resources of Anhui Key Laboratories.
Literature
Allstead, J. and Lang, J.W. (1995). Sexual dimorphism in genital morphology of alligators, Alligator mississippiensis.Herpetologica 51(3): 314-325.
Booktein, F.L. (1989). Size and shape; comment on semantics. Systematic Zoology 38(2): 173-180.
Chen B.H and Hua, Z.H. (1985). Chinese alligator. Science and Technology Press, Hefei 2: 19-28.
Cong L.Y. and Hou, L.H. (1998) The cross anatomy of Alligator sinensis Fauvel. Science Press, Beijing 2: 82-107.
Cynthia, L.G. (2003). A first look at estimating body size in dentally conservative marsupials. Journal of MammalianEvolution 10(1/2): June 2003.
Hall, P.M. and Portier, K.M. (1994). Cranial morphometry of New Guinea crocodiles (Crocodylus novaeguineae):ontogenetic variation in relative growth of the skull and an assessment of its utility as a predictor of the sex andsize of individuals. Herpetological Monographs 8: 203-225.
Herbert, J.D. and Coulson, T.D. (2002). Growth rate of Chinese and American alligators. Comp. Biochem. Physiol.Part A 131: 909-916.
Iordansky, N.N. (1973). The skull of the Crocodilia. Pp. 201-262 in Biology of the Reptilia. Vol. 4. Morphology D,ed. by C. Gans and T.S. Parsons. Academic Press: London.
Magnusson, W.E. (1982). Techniques of surveying for crocodiles. Pp. 389-403 in Crocodiles. Proceedings of the 5thWorking Meeting of the IUCN-SSC Crocodile Specialist of Group. Florida State Museum, Gainesville, Florida,USA.
Mook, C.C. (1921). Individual and age variation in the skulls of Recent Crocodilia. Bull. Amer. Mus. Nat. Hist. 44(7): 51-56.
Verdade, L.M. (1990). Regression equations between body and head measurements in the Broad-snouted Caiman.Rev. Brasil. Biol. 60(3): 469-482
Verdade, L.M. (1997). Morphometric Analysis of the Broad-snouted Caiman (Caiman latirostris): An Assessment ofIndividual’s Clutch, Body Size, Sex, Age, and Area of Origin. PhD Dissertation, University of Florida, Gainesville,Florida, USA, 174 pp.
Webb, G.J.W. and Messel, H. (1977). Crocodile capture techniques. J. Wildl. Manage. 41: 572-575.
Wermuth, H. (1953. Systematik der rezenten Krokidile. Mitt. Zool. Mus. Berlin 29(2): 375-514.
Wermuth, H. and Mertens, R. (1961). Schildkröten. Krokodile Brückeneschsen. Veb Gustav Fisher Verlag: Jena,Germany.

484
Wild Harvest of Crocodile Eggs: The Economic Benefits to Resource Ownersand its Effect on Habitat Conservation.
David H Wilken and Eric Langelet
Mainland Holdings Ltd, PO Box 196, Lae 411, Papua New Guinea([email protected])
Introduction - Background
Papua New Guinea’s two species of crocodiles, the Saltwater crocodile (Crocodylus porosus) and the New GuineaFreshwater crocodile (Crocodylus n. novaguineae) are not only an integral part of the traditional culture for the SepikRiver people but, since the 1950s have also become a commercially valuable natural resource.
Because both species were extensively exploited for their skin and to a lesser extend their meat, the PNG Governmentin 1966 enacted the Crocodile Trade (Protection) Act to regulate the crocodile industry. Monitoring mechanisms toensure their long term survival and, consideration for the welfare of the rural population have also been introduced.
In the early 1980s, the introduction of ranching and farming schemes added even more incentives for village peopleto continue benefiting from their natural resources while also encouraging them to actively protect the environment.
To further enhance the impact of its crocodile management program, the Department of Environment and Conservationin 1985 introduced a selective harvest of wild crocodile eggs in the surveyed area of the Middle Sepik River. Thisactivity is run conjointly with the aerial survey and is closely monitored by DEC wildlife rangers. Mainland HoldingsLtd (MH), the largest commercial farm in Papua New Guinea, is an integral part of this national conservation policy.The company’s ranching program largely contributes to the economic success of the wild harvest of juvenile crocodilesand crocodile eggs.
Eggs Harvest - 2002 and 2003
Over the years, the combination of regular awareness campaigns, the effective enforcement of the Crocodile Trade(Protection) Act and various private commercial incentives have encouraged the steady recovery of both crocodilespecies in the Sepik.
Since 2000, the Sepik Wetlands Management Initiative, a local non-Government organization based in Ambunti, hasalso actively campaigned to strengthen the concept of “sustainable use of the wildlife” amongst the villagers. AParticipatory Rural Appraisal has concluded that crocodiles still constituted a major source of incomes for the MiddleSepik communities but, also raised concerns about the long term sustainability of the nesting habitat.
Consequently, in March 2002, the DEC agreed to further increase the harvest program for the wild Saltwater crocodileeggs in the Middle Sepik, in return for habitat conservation. A total of 3542 fertile eggs from 62 nests were purchasedin this first motorised canoe harvest.
Again, in February 2003, a team of two Mainland employees accompanied by a DEC wildlife ranger and localguides departed Ambunti in two groups to harvest saltwater crocodile nests. One team visited the areas from Kubkainto the mouth of the May River, while the other team concentrated its search from Kubkain down to Wagu Lakes.
During this time 138 nests and 8346 eggs were harvested. Later, some more nests were brought in by the landownersduring the annual aerial nests survey conducted by the DEC. At third trip was organized to make cash payment forthe eggs harvested. Unfortunately by that time most of the remaining nests had already hatched or were flooded.
In 2003, it was generally observed that most of the habitats had well regenerated since the widespread burning of the1997 “El Niño” drought and, only one hook / trap was found. The landowners were found to be very enthusiasticwith the concept and keen to protect the nesting areas while at the same time reaping a better financial benefit ascompared to hunting juvenile crocodiles.
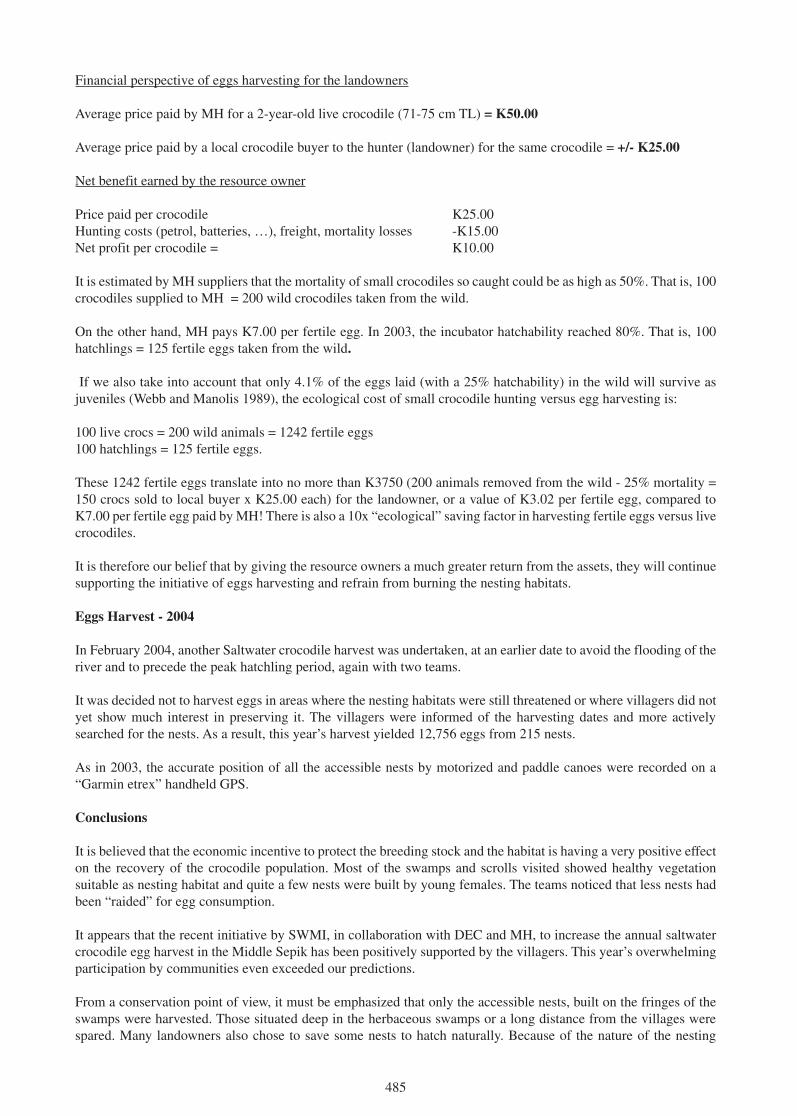
485
Financial perspective of eggs harvesting for the landowners
Average price paid by MH for a 2-year-old live crocodile (71-75 cm TL) = K50.00
Average price paid by a local crocodile buyer to the hunter (landowner) for the same crocodile = +/- K25.00
Net benefit earned by the resource owner
Price paid per crocodile K25.00Hunting costs (petrol, batteries, …), freight, mortality losses -K15.00Net profit per crocodile = K10.00
It is estimated by MH suppliers that the mortality of small crocodiles so caught could be as high as 50%. That is, 100crocodiles supplied to MH = 200 wild crocodiles taken from the wild.
On the other hand, MH pays K7.00 per fertile egg. In 2003, the incubator hatchability reached 80%. That is, 100hatchlings = 125 fertile eggs taken from the wild.
If we also take into account that only 4.1% of the eggs laid (with a 25% hatchability) in the wild will survive asjuveniles (Webb and Manolis 1989), the ecological cost of small crocodile hunting versus egg harvesting is:
100 live crocs = 200 wild animals = 1242 fertile eggs100 hatchlings = 125 fertile eggs.
These 1242 fertile eggs translate into no more than K3750 (200 animals removed from the wild - 25% mortality =150 crocs sold to local buyer x K25.00 each) for the landowner, or a value of K3.02 per fertile egg, compared toK7.00 per fertile egg paid by MH! There is also a 10x “ecological” saving factor in harvesting fertile eggs versus livecrocodiles.
It is therefore our belief that by giving the resource owners a much greater return from the assets, they will continuesupporting the initiative of eggs harvesting and refrain from burning the nesting habitats.
Eggs Harvest - 2004
In February 2004, another Saltwater crocodile harvest was undertaken, at an earlier date to avoid the flooding of theriver and to precede the peak hatchling period, again with two teams.
It was decided not to harvest eggs in areas where the nesting habitats were still threatened or where villagers did notyet show much interest in preserving it. The villagers were informed of the harvesting dates and more activelysearched for the nests. As a result, this year’s harvest yielded 12,756 eggs from 215 nests.
As in 2003, the accurate position of all the accessible nests by motorized and paddle canoes were recorded on a“Garmin etrex” handheld GPS.
Conclusions
It is believed that the economic incentive to protect the breeding stock and the habitat is having a very positive effecton the recovery of the crocodile population. Most of the swamps and scrolls visited showed healthy vegetationsuitable as nesting habitat and quite a few nests were built by young females. The teams noticed that less nests hadbeen “raided” for egg consumption.
It appears that the recent initiative by SWMI, in collaboration with DEC and MH, to increase the annual saltwatercrocodile egg harvest in the Middle Sepik has been positively supported by the villagers. This year’s overwhelmingparticipation by communities even exceeded our predictions.
From a conservation point of view, it must be emphasized that only the accessible nests, built on the fringes of theswamps were harvested. Those situated deep in the herbaceous swamps or a long distance from the villages werespared. Many landowners also chose to save some nests to hatch naturally. Because of the nature of the nesting

486
habitat and the harvesting technique, it was virtually impossible to quantify the proportion of nests left. Only asystematic aerial survey would enable an observer to scientifically determine the harvesting index.
Literature
Cox, J. (2002). Participation Rural Appraisal Techniques for Conservation of Crocodile Nesting Habitat in the MiddleSepik. Unpublished Technical Report No. 1, Port Moresby.
Genolagani. J.M.G. (1994). Conservation, management and farming of crocodiles in Papua New Guinea. In Crocodiles.Proceedings of the 2nd Regional (Eastern Asia, Oceania, Australasia) Meeting of the Crocodile Specialist Group,IUCN: Gland.
McKie, R. and McKie, G. (1993). Reflections of the Sepik. Crawford House Press.
Solmu, G.C. (2002) Participatory Rural Appraisal. A report produced in participation with the Sepik WetlandsManagement Initiative. DEC: Port Moresby.
Webb, G.J.W and Manolis, S.C. (1989). Crocodiles of Australia. Reed Books: Australia.
Whitaker, R. and Mitchell, G. (1989). Comparison of farms. Pp. 214-215 in Crocodiles and Alligators, ed. by C.A.Ross and S. Garnett. Golden Press: Silverwater.

487
Observations of the Effect of Toxic Blue Green Algae on Crocodiles
Vicki R. Lowing
6 Minnipa Drive, Hallett Cove 5158, SA, Australia ([email protected])
Introduction
An 8-year-old Australian Freshwater Crocodile (Crocodylus johnstoni), raised from a hatchling in a domesticenvironment near the township of Deniliquin, located in the Murray-Darling Basin Region, southwestern New SouthWales, Australia, was observed to develop abnormal various signs and symptoms following exposure to watercontaining high blue green algal cell counts.
This area is predominately rice production, requiring high levels of irrigation with increasing usage of herbicides,pesticides and fertilizers (nutrient pollutants, particularly phosphates). Eutrophication is recognized as a criticalfactor in creating an algal bloom; as well as low flow of water (irrigation) and high summer temperatures. Theenvironmental impact is one of increasing mixed strains of blue green algal cells in the local water supply.
Findings
During the period from December 2002 to April 2003, environmental daytime temperatures ranged from approximately
Figure 1. High algae alert.
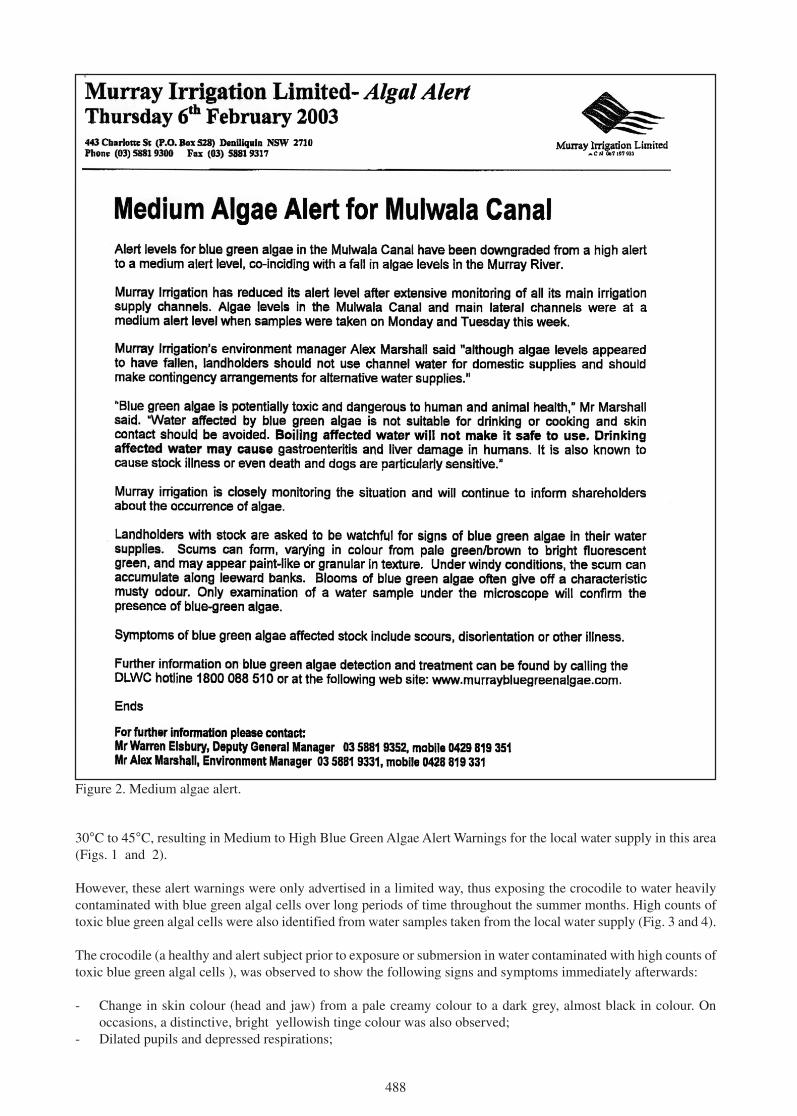
488
30°C to 45°C, resulting in Medium to High Blue Green Algae Alert Warnings for the local water supply in this area(Figs. 1 and 2).
However, these alert warnings were only advertised in a limited way, thus exposing the crocodile to water heavilycontaminated with blue green algal cells over long periods of time throughout the summer months. High counts oftoxic blue green algal cells were also identified from water samples taken from the local water supply (Fig. 3 and 4).
The crocodile (a healthy and alert subject prior to exposure or submersion in water contaminated with high counts oftoxic blue green algal cells ), was observed to show the following signs and symptoms immediately afterwards:
- Change in skin colour (head and jaw) from a pale creamy colour to a dark grey, almost black in colour. Onoccasions, a distinctive, bright yellowish tinge colour was also observed;
- Dilated pupils and depressed respirations;
Figure 2. Medium algae alert.
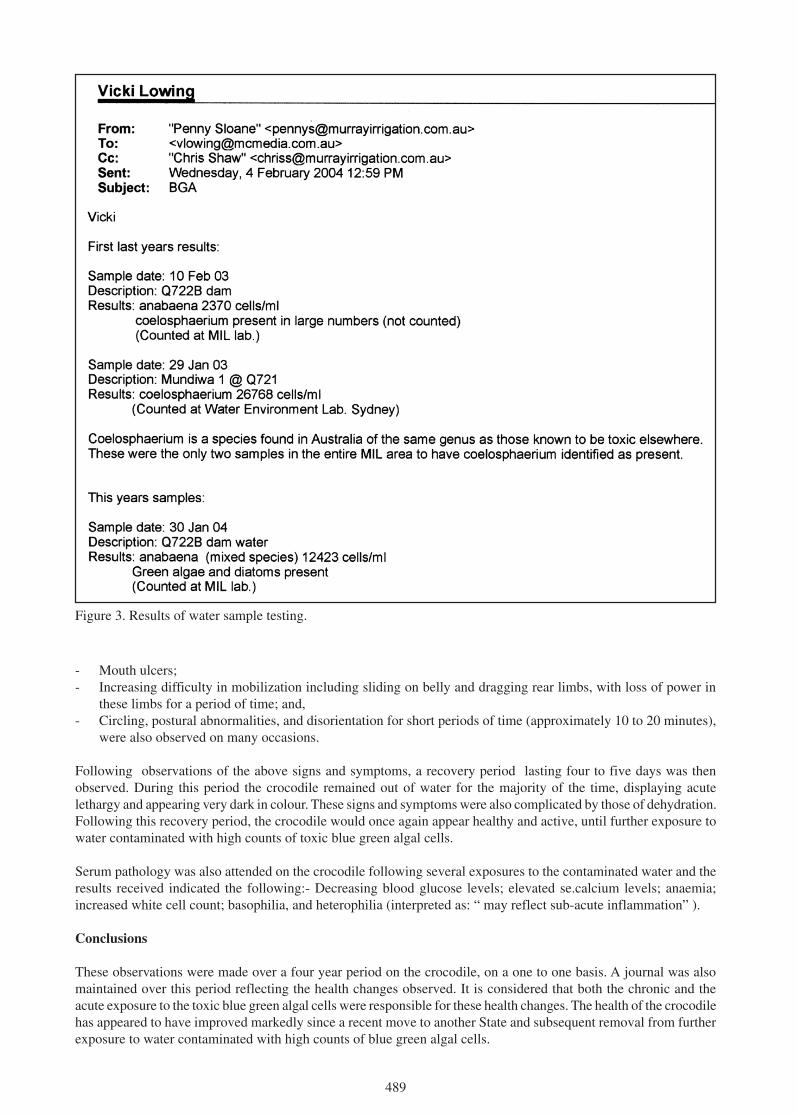
489
- Mouth ulcers;- Increasing difficulty in mobilization including sliding on belly and dragging rear limbs, with loss of power in
these limbs for a period of time; and,- Circling, postural abnormalities, and disorientation for short periods of time (approximately 10 to 20 minutes),
were also observed on many occasions.
Following observations of the above signs and symptoms, a recovery period lasting four to five days was thenobserved. During this period the crocodile remained out of water for the majority of the time, displaying acutelethargy and appearing very dark in colour. These signs and symptoms were also complicated by those of dehydration.Following this recovery period, the crocodile would once again appear healthy and active, until further exposure towater contaminated with high counts of toxic blue green algal cells.
Serum pathology was also attended on the crocodile following several exposures to the contaminated water and theresults received indicated the following:- Decreasing blood glucose levels; elevated se.calcium levels; anaemia;increased white cell count; basophilia, and heterophilia (interpreted as: “ may reflect sub-acute inflammation” ).
Conclusions
These observations were made over a four year period on the crocodile, on a one to one basis. A journal was alsomaintained over this period reflecting the health changes observed. It is considered that both the chronic and theacute exposure to the toxic blue green algal cells were responsible for these health changes. The health of the crocodilehas appeared to have improved markedly since a recent move to another State and subsequent removal from furtherexposure to water contaminated with high counts of blue green algal cells.
Figure 3. Results of water sample testing.
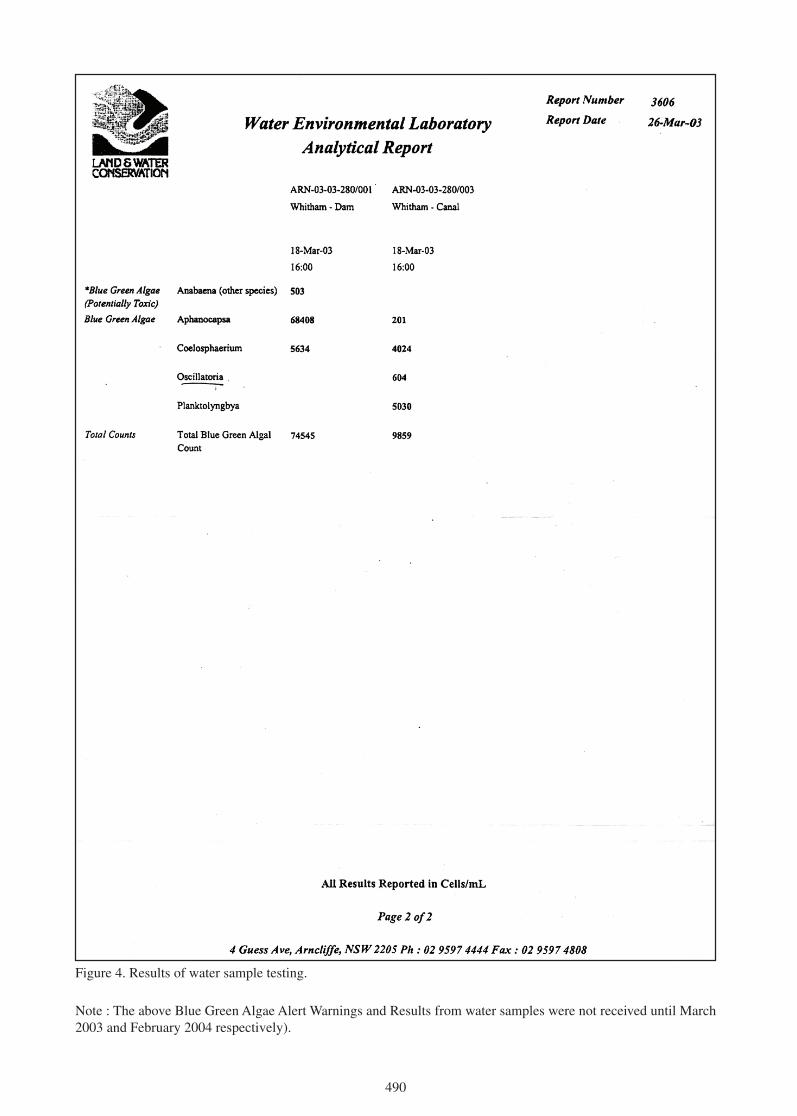
490
Figure 4. Results of water sample testing.
Note : The above Blue Green Algae Alert Warnings and Results from water samples were not received until March2003 and February 2004 respectively).
490
Figure 4. Results of water sample testing.
Note : The above Blue Green Algae Alert Warnings and Results from water samples were not received until March2003 and February 2004 respectively).

491
Thyroid Hormone Biology of Embryonic Saltwater Crocodiles(Crocodylus porosus)
Caroline A. Shepherdley1, Samantha J. Richardson1, Julie A. Monk1, Barbara K. Evans2,Christopher B. Daniels3, Sandra Orgeig3, Eduard R. Kühn4 and Veerle M. Darras4
1Department of Biochemistry and Molecular Biology, The University of Melbourne, VIC 3010,Australia; 2Department of Zoology, The University of Melbourne, VIC 3010, Australia; 3School of
Earth and Environmental Sciences, University of Adelaide, SA 5005, Australia; 4Laboratory ofComparative Endocrinology, Zoological Institute, Catholic University Leuven, B-3000 Leuven,
Belgium
Thyroid hormones (THs) are essential for vertebrate development. This study investigated three aspects of thyroidhormone biology during the development of embryonic saltwater crocodile. Free thyroxine (T
4) and free
triiodothyronine (T3) levels in blood gradually rose during the late stages of incubation (days 60, 68 and 75), and
were maximal at hatching (day 80). These changes could have been brought about by an increase in T4 release from
the thyroid gland, and changes in the metabolism of THs by iodothyronine deiodinases. Specifically, we showed adecrease in hepatic T
3 to diiodothyronine (T
2) conversion by a low Km inner ring deiodinase, and an increase in T
4 to
T3 conversion by a high Km outer ring deiodinase. Thyroid hormone distribution proteins (THDPs) are required for
distribution of THs. Albumin was present as a THDP in serum at all ages examined. A second THDP was identifiedas transthyretin and was detected in serum at days 60, 68, 75 of incubation, and at day-1 post-hatch, but not in serumfrom 6 month-old or adult crocodiles. Changes in TH serum levels, TH metabolism and the presence of a secondTHDP demonstrate the importance of THs during the late stages of embryonic development.
Relationship between Telomere Length and Body Lengthin Alligator mississippiensis
Nicole Scott1, M. Haussmann1, C. Vleck1, Phillip Trosclair2 and Ruth Elsey2
1Dept of EEOBiology, Iowa State University, Ames, IA USA; 2Louisiana Dept. of Wildlife and Fisher-ies, Grand Chenier, LA, USA
Free-living American alligators grow about 30 cm per year until they reach about 2 m. Then growth slows, so size isnot an accurate estimator of age. Our goal was to determine whether telomere lengths in blood cells shorten withgrowth in a predictable manner. Telomeres are DNA sequences at the end of each chromosome that do not fullyreplicate at cell division in most animals; thus telomeres are usually shorter in older animals. We sampled erythrocyteDNA from wild-caught animals of different body lengths and from captive-reared yearlings. Telomere length wasdetermined by separation of restriction-digested DNA by electrophoresis, followed by hybridization to P32-labeledoligonucleotides specific for the telomere. Mean telomere length for each animal was determined by densitometry.We found no significant difference in telomere lengths over the range of animals sampled (~30-300 cm), althoughmales tended to have longer telomeres than females. The mechanisms preserving telomere length in these long-livedanimals are not known.
492
Pit Holes in Nile Crocodile Skins
Fritz W. Huchzermeyer1 and J F Putterill2
1PO Box 12499, Onderstepoort, 0110, South Africa; 2Onderstepoort Veterinary Institute,Private Bag X05, Onderstepoort 0110, South Africa
Abstract
Deep holes in skins of three-year-old farmed Nile crocodiles were dubbed “pit holes”. In histopathological sectionsthey appeared to be branched and were lined by an intact epidermis. Earlier lesions from two-year-old animals werein similar form but the surrounding tissue contained remnants of inflammatory cells. The skins of one-year-oldanimals contained large cysts of a diameter equal to the thickness of the dermis. These cysts were surrounded by anintense inflammatory reaction and only partially lined by epidermis. Investigations into the cause of the pit holescontinue.
Introduction
The skin diseases of crocodiles were reviewed by Huchzermeyer (2003). Small holes of unknown causes in Americanalligator skins were described by Haire (1997). These were dubbed “pix” and later found to be caused by eruptingdermal granulomata from which the fungus Hortaea werneckii was isolated (Dickson et al. 2002).
A South African crocodile farmer had a number of skins downgraded because of small holes, “pit holes”, foundprevalently in the ventrolateral region of affected Nile crocodile skins. At close examination these holes were visiblealso in the skin of live crocodiles before slaughter. This paper describes the preliminary findings of an investigationinto the cause of the pit holes.
Materials and Methods
Samples were taken from the skins of slaughtered crocodiles as well as from selected younger age groups. Thesewere fixed in 10% buffered formalin and after fixation processed for routine histological sectioning, stained withhaematoxylin-eosin stain and examined using light microscopy.
Results
The histopathological examination of the skins from slaughtered crocodiles (three years old) showed deep holeslined with a healed epidermis and without any inflammatory reaction. Two-year-old crocodiles had similarly healedlesions but with some inflammatory and pigment cells in the dermis surrounding the lesion. The one-year-old crocodileshad active lesions consisting of deep cysts penetrating the whole dermis, empty or filled with debris and surroundedby an intense inflammatory reaction.
Discussion
The canals seen in the histopathological specimens from 2- and 3-year-old crocodiles are believed to be collapsedcysts seen in skin preparations of the youngest animals. Preliminary investigations appear to indicate that the pitholes are caused by an infectious agent and that the incidence of this condition is linked to poor hygiene, althoughbacterial and fungal cultures so far gave negative results. The incidence appears not to be limited to one farm only. Italso appears that the condition has been seen before but veterinarians were not consulted. Investigations continue.
Literature
Dickson, H., Cardeilhac, P. and Ashley, J.D. (2002). Pix skin disease in the American alligator (Alligatormississippiensis). Pp. 187 in Crocodiles. Proceedings of the 16th Working Meeting of the IUCN-SSC CrocodileSpecialist Group. IUCN: Gland.

493
Haire, D. (1997). Concern over American alligator skin pitting. Crocodile Specialist Group Newsletter 16(1): 22-23.
Huchzermeyer, F.W. (2003). Crocodiles: Biology, Husbandry and Diseases. CABI Publishing: Wallingford, UK.
493
Haire, D. (1997). Concern over American alligator skin pitting. Crocodile Specialist Group Newsletter 16(1): 22-23.
Huchzermeyer, F.W. (2003). Crocodiles: Biology, Husbandry and Diseases. CABI Publishing: Wallingford, UK.
494
Economic Valuation of the Tarcoles River C. acutus PopulationUsing the Travel Costs Method
Gerardo Abadia
Programa Regional en Manejo de Vida Silvestre para Mesoamérica y el Caribe, Universidad Nacionalde Costa Rica, Apartado Postal 1350-3000 Heredia, Costa Rica ([email protected])
The value of crocodiles as an incentive for ecotourism at the Río Grande de Tárcoles in Costa Rica was measured byusing the travel cost method. By analyzing travel behavior, the study reveals that foreigners are willing to payconsiderably for the experience of visiting the site to see crocodiles. The travel cost method takes into account thetotal expenses undergone by visitors and assumes that costs increase with the distance to the site and therefore thenumber of visitors decrease with increasing costs. The economic value of a natural resource is estimated according topeople’s willingness to assume the cost of visiting a natural site. The present value of the Río Grande de Tárcoles’crocodile population, based on tourism, is found to be 19.5 times in magnitude greater than the purchase pricecurrently paid for the hides. Ecoturism then proves to be an important conservation strategy because it focuses on thesustainable use of natural resources by providing an income to local communities.
The Ecological Distribution of Crocodiles in South West Cameroon:Threats and Conservation Potentials
Gonwouo Nono Legrand
University of Yaounde, Cameroon
The ecological distribution of crocodiles from the rain forest of South West Cameroon was carried out between 2002and 2003. Investigations indicate that three species of the African crocodile, Crocodylus niloticus, Crocodyluscataphractus and Osteolaemus tetraspis, still exist in southwest Cameroon. Evidence reveals the later has a scattereddistribution all over the region in tributaries of larger rivers, swamps and water ponds. It appears to be abundant butthreatened by bush meat trade. Five smoked specimens where observed from an individual in a bush meat market.Larger rivers harbour considerable populations of the Nile crocodile with seven sites identified. It is hunted for itsflesh, skin and eggs (an individual found with 53 eggs) sold at high prices. C. cataphractus is the rarest in the regionand no direct evidence was recorded. These observations suggest areas where efforts of conservation and managementshould be implemented.

495
The Population Status of Rescued Chinese Alligators From Wildin Anhui Research Center for Chinese Alligator Reproduction
Nie Jishan1, Wang Chaolin1, Gu Changming2 and Xie Wanshuo1
1Anhui Research Center for Chinese Alligator Reproduction, Xuanzhou, 2320034, P.R. China;Anhui Natural Conservation Management, Hefei 230001, P.R. China
We analysed 212 rescued Chinese alligators and 21 nests in the wild from 1980 to 1988. The rescued alligators weremainly distributed in Xintian, Yishan and Yangling (24.5, 14.6 and 12.7% respectively), and included hatchlings(8.5%), subadults (18.5%) and adults (73%). These alligators laid a mean of 3 nests with mean of 13 eggs per nestevery year. After breeding for several years, 14 individuals (6 males, 8 females) produced by the rescued alligatorswere released into the wild. The rescued alligators were also bred as stock populations of present breeding populationsin Anhui Research Center for Chinese Alligator Reproduction.
Research on Habitat Selection by Wild Chinese Alligator (Alligator sinensis)
Wu Lu-Sheng1, Wu Xiao-Bing1, Jiang Hong-Xing2,3, Ruan Xiang-Dong3 and Gu Chang-Ming4
1College of Life Sciences, Anhui Normal University, Wuhu 241000, China; 2Research Institute ofForestry Ecology, Environment and Protection, Chinese Academy of Forestry, Beijing 100091,
P.R. China; 3National Wildlife Research and Development Center, State Forestry Administration,Beijing 100091, P.R. China; 4Anhui Natural Conservation Management, Hefei 230001, P.R. China
Research on the habitat selection of wild Chinese Alligator was conducted from September 2002 to July 2003 atNatural Conservation Regions of Chinese Alligator in southern Anhui Province. We sampled 22 specimens in orderto research habitat selection by Chinese alligator. Eight ecological factors in correlation to subsistence of alligatorsuch as shelter condition of bank, island of water area, stabilization of water, pH value of water, snail abundance, soiltexture, density of bamboo and vegetation type were selected according to data of investigation on the spot. Weadopted the methods of resource selection functions and principal components to analyze habitat selection. Theresults show that the model of first and second Principal Component: Z
1 the first Principal Component, Z
1= 1.312X
1
- 0.253X2- 0.269X
3+ 0.035X
4- 0.149X
5+ 0.160X
6- 0.070X
7- 0.174X
8; Z
2 the second Principal Component, Z
2= -
0.127X1- 0.047X
2- 0.092X
3- 0.054X
4+ 1.138X
5+ 0.123X
6- 0.145X
7+ 0.095X
8. The Logistic regression model is
logist P = -2.451 + 2.612Z1
+ 1.434Z2+ 1.564Z
3+ 0.941Z
4- 1.044Z
5+ 1.408Z
6+ 1.423Z
7- 0.039Z
8. The results
suggested that shelter condition of bank influenced habitat selection significantly and the subordinate ecology factorwas pH value of water, while the ecological factors (Island of water area and Vegetation type) influenced habitatselection slightly.

496
Spotlight Surveys of New Guinea Freshwater Crocodile (Crocodylusnovaeguineae) in Mid-Zone Memberamo River (Memberamo and Rouffaer
River Systems), Papua Province, Indonesia
Hellen Kurniati1 and Charlie Manolis2
1Research Centre for Biology, Indonesian Institute of Sciences (LIPI),Widyasatwaloka Building-LIPI, Jalan Raya Cibinong Km 46, Cibinong 16911,
West Java, Indonesia, PO Box 2 ([email protected]);2Wildlife Management International Pty. Limited, PO BOX 530, Sanderson, NT 0812, Australia
Abstract
All available spotlight survey data for the New Guinea Freshwater Crocodile (Crocodylus novaeguineae) in mid-zone Memberamo River, Papua Province, Indonesia, were analysed. Survey areas consist of four rivers (MemberamoMati, Jaro, Baso and Soi) and 10 lakes (Sobaki, Kamika, Waropen, Kweri Satu, Kweri Dua, Apuse, Bernekam Satu,Bernekam Dua, Cabang Tiga Satu and Cabang Tiga Dua), surveyed at different times between 1987 and 2002.
Results from the Jaro River (1989-2002) indicated a significant increase in non-hatchling density over time. Allother areas surveyed indicated stable non-hatchling densities over the periods of survey. The latest surveys (2001-2002) were affected by high water levels (flooding), which are likely to have reduced the sightability of crocodiles.
Trends in live crocodile and skin harvests appear to be driven by market forces and a moratorium (early 1990s),rather than any limitations of the crocodile resource. In general, the population of C. novaeguineae in Mid-zoneMemberamo River has been relatively stable, despite extensive harvesting.
Introduction
The people of Indonesia have historically used crocodiles for a variety of non-commercial purposes. In the past tenyears, commercial collection from the wild has threatened the population status of Indonesian crocodiles. As pressurefrom the commercial hunting is continuous, the successful conservation of Indonesian crocodiles will depend on theconstant monitoring of their populations. Papua is one of several provinces in Indonesia which historicallyaccommodate unknown numbers of commercial crocodiles (Webb and Jenkins 1991).
Monitoring of the crocodile population in the Mid-zone Memberamo River (see Appendix 1 for the region) wasconducted from 2000 to 2002, with spotlight surveys in Kamika Lake (Kaureh District) and Waropen, Kweri Satu,Kweri Dua, Apuse, Bernekam Satu, Bernekam Dua, Cabang Tiga Satu and Cabang Tiga Dua Lakes (MemberamoHulu District). Additional surveys were undertaken in 2001-2002 in the Memberamo Mati, Jaro, Baso and SoiRivers, and Sobaki Lake (Memberamo Hulu District), all of which had been surveyed previously by the FAO-PHPAProject. All of these areas are within the Memberamo and Rouffaer River systems. Interviews with local people andharvest data indicate that the dominant species is Crocodylus novaeguineae.
This paper presents the most recent spotlight survey data (Table 1), and summarizes all spotlight data and populationtrends (total numbers and non-hatchlings) for C. novaeguineae in Papua Province.
Methodology
1. Timing of Surveys
Surveys in 2000-2002 were undertaken in September-December each year (Table 1).
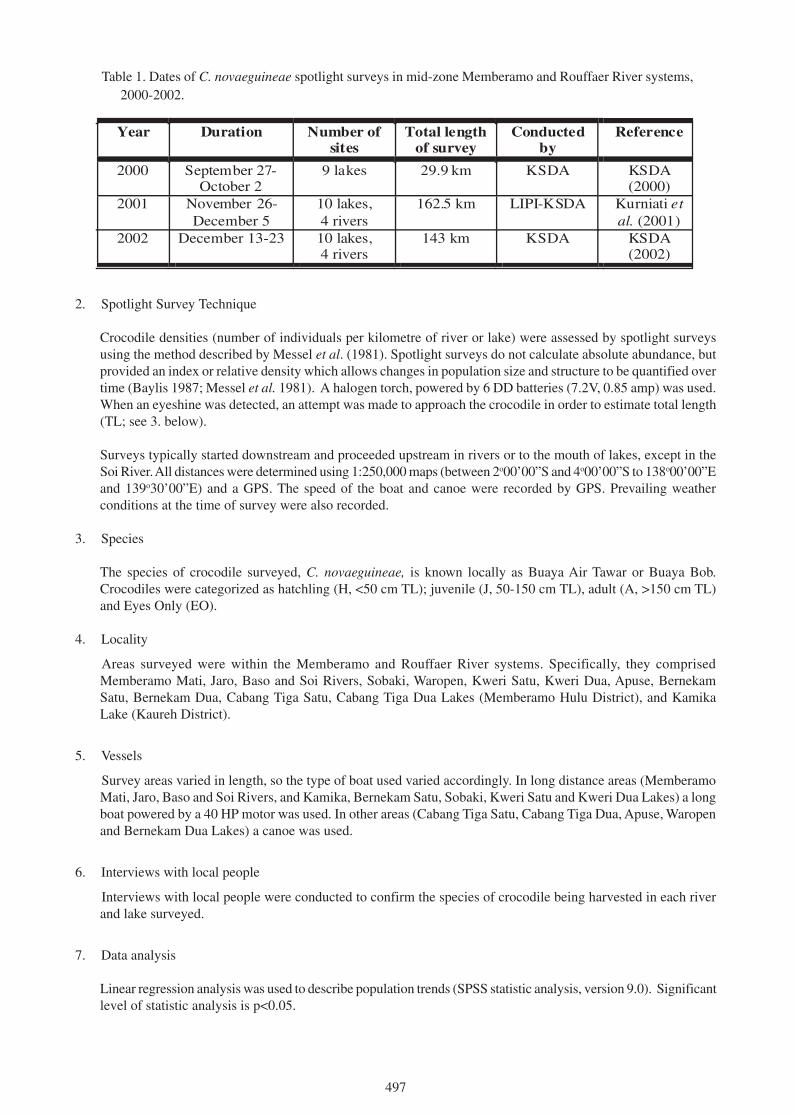
497
Table 1. Dates of C. novaeguineae spotlight surveys in mid-zone Memberamo and Rouffaer River systems,2000-2002.
2. Spotlight Survey Technique
Crocodile densities (number of individuals per kilometre of river or lake) were assessed by spotlight surveysusing the method described by Messel et al. (1981). Spotlight surveys do not calculate absolute abundance, butprovided an index or relative density which allows changes in population size and structure to be quantified overtime (Baylis 1987; Messel et al. 1981). A halogen torch, powered by 6 DD batteries (7.2V, 0.85 amp) was used.When an eyeshine was detected, an attempt was made to approach the crocodile in order to estimate total length(TL; see 3. below).
Surveys typically started downstream and proceeded upstream in rivers or to the mouth of lakes, except in theSoi River. All distances were determined using 1:250,000 maps (between 2o00’00”S and 4o00’00”S to 138o00’00”Eand 139o30’00”E) and a GPS. The speed of the boat and canoe were recorded by GPS. Prevailing weatherconditions at the time of survey were also recorded.
3. Species
The species of crocodile surveyed, C. novaeguineae, is known locally as Buaya Air Tawar or Buaya Bob.Crocodiles were categorized as hatchling (H, <50 cm TL); juvenile (J, 50-150 cm TL), adult (A, >150 cm TL)and Eyes Only (EO).
4. Locality
Areas surveyed were within the Memberamo and Rouffaer River systems. Specifically, they comprisedMemberamo Mati, Jaro, Baso and Soi Rivers, Sobaki, Waropen, Kweri Satu, Kweri Dua, Apuse, BernekamSatu, Bernekam Dua, Cabang Tiga Satu, Cabang Tiga Dua Lakes (Memberamo Hulu District), and KamikaLake (Kaureh District).
5. Vessels
Survey areas varied in length, so the type of boat used varied accordingly. In long distance areas (MemberamoMati, Jaro, Baso and Soi Rivers, and Kamika, Bernekam Satu, Sobaki, Kweri Satu and Kweri Dua Lakes) a longboat powered by a 40 HP motor was used. In other areas (Cabang Tiga Satu, Cabang Tiga Dua, Apuse, Waropenand Bernekam Dua Lakes) a canoe was used.
6. Interviews with local people
Interviews with local people were conducted to confirm the species of crocodile being harvested in each riverand lake surveyed.
7. Data analysis
Linear regression analysis was used to describe population trends (SPSS statistic analysis, version 9.0). Significantlevel of statistic analysis is p<0.05.
Year Duration Number ofsites
Total lengthof survey
Conductedby
Reference
2000 September 27-October 2
9 lakes 29.9 km KSDA KSDA(2000)
2001 November 26-December 5
10 lakes,4 rivers
162.5 km LIPI-KSDA Kurniati etal. (2001)
2002 December 13-23 10 lakes,4 rivers
143 km KSDA KSDA(2002)
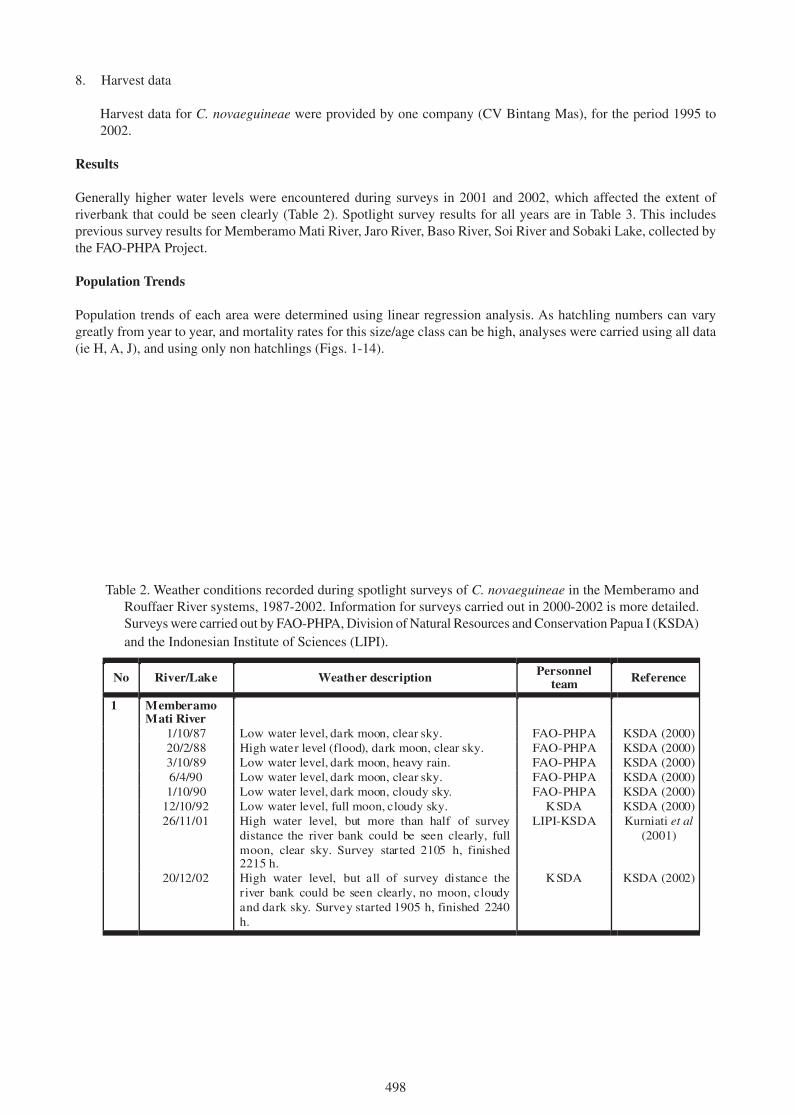
498
8. Harvest data
Harvest data for C. novaeguineae were provided by one company (CV Bintang Mas), for the period 1995 to2002.
Results
Generally higher water levels were encountered during surveys in 2001 and 2002, which affected the extent ofriverbank that could be seen clearly (Table 2). Spotlight survey results for all years are in Table 3. This includesprevious survey results for Memberamo Mati River, Jaro River, Baso River, Soi River and Sobaki Lake, collected bythe FAO-PHPA Project.
Population Trends
Population trends of each area were determined using linear regression analysis. As hatchling numbers can varygreatly from year to year, and mortality rates for this size/age class can be high, analyses were carried using all data(ie H, A, J), and using only non hatchlings (Figs. 1-14).
No River/Lake Weather description Personnelteam Reference
1 MemberamoMati River
1/10/87 Low water level, dark moon, clear sky. FAO-PHPA KSDA (2000)20/2/88 High water level (flood), dark moon, clear sky. FAO-PHPA KSDA (2000)3/10/89 Low water level, dark moon, heavy rain. FAO-PHPA KSDA (2000)6/4/90 Low water level, dark moon, clear sky. FAO-PHPA KSDA (2000)1/10/90 Low water level, dark moon, cloudy sky. FAO-PHPA KSDA (2000)
12/10/92 Low water level, full moon, cloudy sky. KSDA KSDA (2000)26/11/01 High water level, but more than half of survey
distance the river bank could be seen clearly, fullmoon, clear sky. Survey started 2105 h, finished2215 h.
LIPI-KSDA Kurniati et al(2001)
20/12/02 High water level, but all of survey distance theriver bank could be seen clearly, no moon, cloudyand dark sky. Survey started 1905 h, finished 2240h.
KSDA KSDA (2002)
Table 2. Weather conditions recorded during spotlight surveys of C. novaeguineae in the Memberamo andRouffaer River systems, 1987-2002. Information for surveys carried out in 2000-2002 is more detailed.Surveys were carried out by FAO-PHPA, Division of Natural Resources and Conservation Papua I (KSDA)and the Indonesian Institute of Sciences (LIPI).

499
No River/Lake Weather descriptionPersonnel
teamReference
2 Jaro River24/9/89 Low water level, dark moon, clear sky. FAO-PHPA KSDA (2000)30/7/91 Low water level, dark moon, clear sky. FAO-PHPA KSDA (2000)
29/11/01 High water level (flood), but more than half ofsurvey distance the river bank could be seenclearly, 3/4 full moon, cloudy sky and shower.Survey started 2105 h, finished 2205 h.
LIPI-KSDA Kurniati et al(2001)
19/12/02 High water level, flooding, full moon, clear sky.Survey started 1915 h, finished 2250 h.
KSDA KSDA (2002)
3 Baso River30/9/89 Low water level, dark moon, heavy cloudy sky. FAO-PHPA KSDA (2000)4/8/91 Low water level, dark moon, clear sky. FAO-PHPA KSDA (2000)4/12/01 High water level (flood), but most of s urvey
distance the river bank could be seen very clearly,strong water current, heavy cloudy sky, no moonshine. Survey started 1930 h, finished 2100 h.
LIPI-KSDA Kurniati et al(2001)
21/12/02 High water level, less than half of survey distancethe river bank could be seen clearly, full moon,cloudy sky. Survey started 1930 h, finished 2305h.
KSDA KSDA (2002)
4 Soi River26/4/89 High water level (flood), full moon, cloudy sky. FAO-PHPA KSDA (2000)18/7/91 High water level (flood), full moon, clear sky. FAO-PHPA KSDA (2000)5/12/01 High water level (flood), but most of s urvey
distance the river bank could be seen clearly, darksky, no moon shine, shower to heavy rain. Surveystarted 1825 h, finished 2005 h.
LIPI-KSDA Kurniati et al(2001)
22/12/02 High water level, less than half of survey distancethe river bank could be seen clearly, full moon,cloudy sky. Survey started 1915 h, finished 2200h.
KSDA KSDA (2002)
5 Sobaki Lake26/9/89 Low water level, dark moon, cloudy sky. FAO-PHPA KSDA (2000)14/7/91 High water level (flood), dark moon, heavy cloudy
sky.FAO-PHPA KSDA (2000)
5/12/01 High water level, only about half of surveydistance the river bank could be seen clearly, darksky, no moon shine, shower. Survey started 2215h, finished 2300 h.
LIPI-KSDA Kurniati et al(2001)
23/12/02 High water level, less than half of survey distancethe river bank could be seen clearly, full moon,cloudy sky. Survey started 1900 h, finished 2115h.
KSDA KSDA (2002)
6 Kamika Lake27/9/00 Low water level, dark moon, clear sky. KSDA KSDA (2000)
30/11/01 High water level (flood), about half os surveydistance the lake bank could be seen clearly, fullmoon, cloudy sky. Survey started 2130 h, f inished0040 h.
LIPI-KSDA Kurniati et al(2001)
7 Waropen lake28/9/00 Low water level, dark moon, clear sky. KSDA KSDA (2000)
30/11/01 High water level (flood), full moon, shower.Survey started 1930 h, finished 2000 h.
LIPI-KSDA Kurniati et al(2001)
15/12/02 High water level, flooding, half of survey distancethe river bank could be seen clearly, half moon,cloudy and dark sky. Survey started 1905 h,finished 2220 h.
KSDA KSDA (2002)
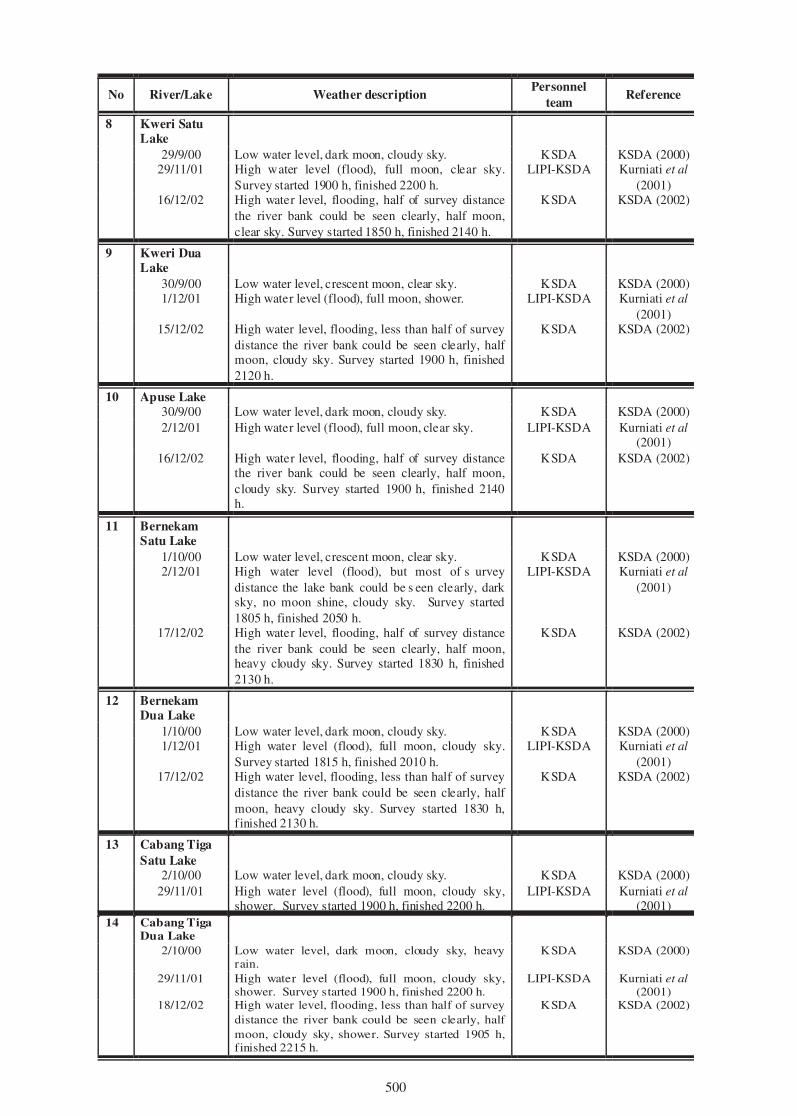
500
No River/Lake Weather descriptionPersonnel
teamReference
8 Kweri SatuLake
29/9/00 Low water level, dark moon, cloudy sky. KSDA KSDA (2000)29/11/01 High water level (flood), full moon, clear sky.
Survey started 1900 h, finished 2200 h.LIPI-KSDA Kurniati et al
(2001)16/12/02 High water level, flooding, half of survey distance
the river bank could be seen clearly, half moon,clear sky. Survey started 1850 h, finished 2140 h.
KSDA KSDA (2002)
9 Kweri DuaLake
30/9/00 Low water level, crescent moon, clear sky. KSDA KSDA (2000)1/12/01 High water level (flood), full moon, shower. LIPI-KSDA Kurniati et al
(2001)15/12/02 High water level, flooding, less than half of survey
distance the river bank could be seen clearly, halfmoon, cloudy sky. Survey started 1900 h, finished2120 h.
KSDA KSDA (2002)
10 Apuse Lake30/9/00 Low water level, dark moon, cloudy sky. KSDA KSDA (2000)2/12/01 High water level (flood), full moon, clear sky. LIPI-KSDA Kurniati et al
(2001)16/12/02 High water level, flooding, half of survey distance
the river bank could be seen clearly, half moon,cloudy sky. Survey started 1900 h, finished 2140h.
KSDA KSDA (2002)
11 BernekamSatu Lake
1/10/00 Low water level, crescent moon, clear sky. KSDA KSDA (2000)2/12/01 High water level (flood), but most of s urvey
distance the lake bank could be s een clearly, darksky, no moon shine, cloudy sky. Survey started1805 h, finished 2050 h.
LIPI-KSDA Kurniati et al(2001)
17/12/02 High water level, flooding, half of survey distancethe river bank could be seen clearly, half moon,heavy cloudy sky. Survey started 1830 h, finished2130 h.
KSDA KSDA (2002)
12 BernekamDua Lake
1/10/00 Low water level, dark moon, cloudy sky. KSDA KSDA (2000)1/12/01 High water level (flood), full moon, cloudy sky.
Survey started 1815 h, finished 2010 h.LIPI-KSDA Kurniati et al
(2001)17/12/02 High water level, flooding, less than half of survey
distance the river bank could be seen clearly, halfmoon, heavy cloudy sky. Survey started 1830 h,finished 2130 h.
KSDA KSDA (2002)
13 Cabang TigaSatu Lake
2/10/00 Low water level, dark moon, cloudy sky. KSDA KSDA (2000)29/11/01 High water level (flood), full moon, cloudy sky,
shower. Survey started 1900 h, finished 2200 h.LIPI-KSDA Kurniati et al
(2001)14 Cabang Tiga
Dua Lake2/10/00 Low water level, dark moon, cloudy sky, heavy
rain.KSDA KSDA (2000)
29/11/01 High water level (flood), full moon, cloudy sky,shower. Survey started 1900 h, finished 2200 h.
LIPI-KSDA Kurniati et al(2001)
18/12/02 High water level, flooding, less than half of surveydistance the river bank could be seen clearly, halfmoon, cloudy sky, shower. Survey started 1905 h,finished 2215 h.
KSDA KSDA (2002)
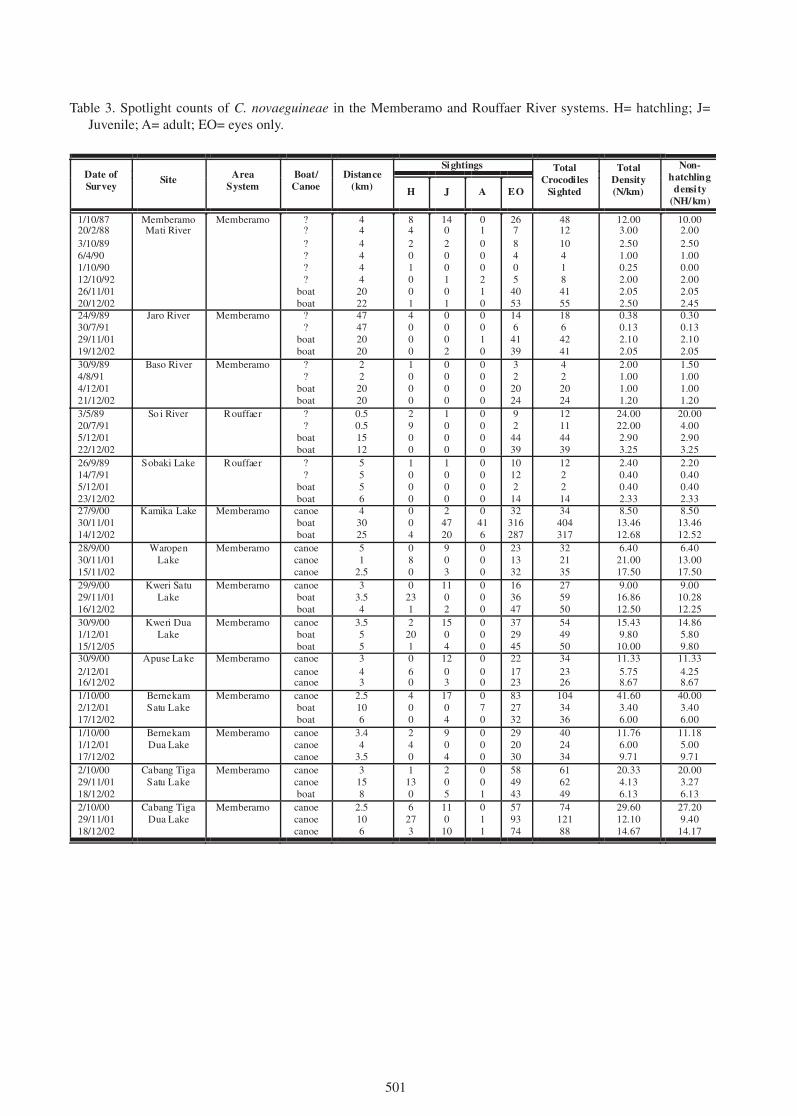
501
SightingsDate ofSurvey
Site AreaSystem
Boat/Canoe
Distance(km) H J A EO
TotalCrocodi les
Sighted
TotalDensity(N/km)
Non-hatchling
densi ty(NH/km)
1/10/8720/2/883/10/896/4/901/10/9012/10/9226/11/0120/12/02
MemberamoMati River
Memberamo ??????
boatboat
444444
2022
84201001
140200101
01000210
2678405
4053
4812104184155
12.003.002.501.000.252.002.052.50
10.002.002.501.000.002.002.052.45
24/9/8930/7/9129/11/0119/12/02
Jaro River Memberamo ??
boatboat
47472020
4000
0002
0010
146
4139
1864241
0.380.132.102.05
0.300.132.102.05
30/9/894/8/914/12/0121/12/02
Baso River Memberamo ??
boatboat
22
2020
1000
0000
0000
32
2024
422024
2.001.001.001.20
1.501.001.001.20
3/5/8920/7/915/12/0122/12/02
So i River Rouffaer ??
boatboat
0.50.51512
2900
1000
0000
92
4439
12114439
24.0022.002.903.25
20.004.002.903.25
26/9/8914/7/915/12/0123/12/02
Sobaki Lake Rouffaer ??
boatboat
5556
1000
1000
0000
10122
14
122214
2.400.400.402.33
2.200.400.402.33
27/9/0030/11/0114/12/02
Kamika Lake Memberamo canoeboatboat
43025
004
24720
0416
32316287
34404317
8.5013.4612.68
8.5013.4612.52
28/9/0030/11/0115/11/02
WaropenLake
Memberamo canoecanoecanoe
51
2.5
080
903
000
231332
322135
6.4021.0017.50
6.4013.0017.50
29/9/0029/11/0116/12/02
Kweri SatuLake
Memberamo canoeboatboat
33.54
0231
1102
000
163647
275950
9.0016.8612.50
9.0010.2812.25
30/9/001/12/0115/12/05
Kweri DuaLake
Memberamo canoeboatboat
3.555
2201
1504
000
372945
544950
15.439.80
10.00
14.865.809.80
30/9/002/12/0116/12/02
Apuse Lake Memberamo canoecanoecanoe
343
060
1203
000
221723
342326
11.335.758.67
11.334.258.67
1/10/002/12/0117/12/02
BernekamSatu Lake
Memberamo canoeboatboat
2.5106
400
1704
070
832732
1043436
41.603.406.00
40.003.406.00
1/10/001/12/0117/12/02
BernekamDua Lake
Memberamo canoecanoecanoe
3.44
3.5
240
904
000
292030
402434
11.766.009.71
11.185.009.71
2/10/0029/11/0118/12/02
Cabang TigaSatu Lake
Memberamo canoecanoeboat
3158
1130
205
001
584943
616249
20.334.136.13
20.003.276.13
2/10/0029/11/0118/12/02
Cabang TigaDua Lake
Memberamo canoecanoecanoe
2.5106
6273
110
10
011
579374
7412188
29.6012.1014.67
27.209.40
14.17
Table 3. Spotlight counts of C. novaeguineae in the Memberamo and Rouffaer River systems. H= hatchling; J=Juvenile; A= adult; EO= eyes only.

502
Figure 1b. Non-hatchling density of C. novaeguineae sighted during spotlight surveysin the Memberamo Mati River, 1987-2002. Solid line indicates the non-significanttrend between 1988 and 2002 (see text).
Year
Non
-Hat
chlin
g D
ensi
ty (
N/k
m)
0
1
2
3
4
5
6
7
8
9
1 0
1 1
1986 1988 1990 1992 1994 1996 1998 2000 2002 2004
Year
Den
sity
(N
/km
)
0
2
4
6
8
1 0
1 2
1 4
1986 1988 1990 1992 1994 1996 1998 2000 2002 2004
Figure 1a. Total density of C. novaeguineae sighted during spotlight surveys in theMemberamo Mati River, 1987-2002. Solid line indicates the non-significant trendbetween 1988 and 2002 (see text).
Memberamo Mati River
Data for the Memberano Mati River span 14 years, from 1987 to 2001 (Table 3). Two spotlight surveys were carriedout in 1990 (April, October) - the April (end of wet season) data were used in the analysis (Table 3). Since 1988density (total and non-hatchlings) has been stable. Excluding the 1987 data, there was no significant relationshipbetween density and time, for either total crocodile density (r2= 0.00, p= 0.99, n= 6; Fig. 1a) or non-hatchling density(r2= 0.11, p= 0.53, n= 6; Fig. 1b). Non-hatchling density decreased from a high of 10.0/km in 1987 to 2.0/km in 1988(Table 3; Fig. 1b), and has stayed relatively stable since that time [mean= 2.18 NH/km (1988-2002)].

503
Jaro River
Notwithstanding the limited number of surveys carried out in the Jaro River, there has been a significant increase intotal crocodile density (r2= 0.947, p= 0.027, n= 4; Fig. 2a) and non-hatchling density (r2= 0.959, p= 0.021, n= 4; Fig.2b) over time. The trends in the intervening period between surveys (10 years) are unknown. Certainly high densitieshave been recorded in both of the most recent surveys. Given the high water levels at the time of these surveys, theincrease may actually be greater than recorded.
Year
Non
-Hat
chlin
g D
ensi
ty (
N/k
m)
0
.25
.5
.75
1
1.25
1.5
1.75
2
2.25
1988 1990 1992 1994 1996 1998 2000 2002 2004
Figure 2a. Total density of C. novaeguineae sighted during spotlight surveys in theJaro River, 1989-2002. Solid line indicates the significant linear regression trend(see text).
Figure 2b. Non-hatchling density of C. novaeguineae sighted during spotlight surveysin the Jaro River, 1989-2002. Solid line indicates the significant linear regressiontrend (see text).
Year
Den
sity
(N
/km
)
0
.25
.5
.75
1
1.25
1.5
1.75
2
2.25
1988 1990 1992 1994 1996 1998 2000 2002 2004
503
Jaro River
Notwithstanding the limited number of surveys carried out in the Jaro River, there has been a significant increase intotal crocodile density (r2= 0.947, p= 0.027, n= 4; Fig. 2a) and non-hatchling density (r2= 0.959, p= 0.021, n= 4; Fig.2b) over time. The trends in the intervening period between surveys (10 years) are unknown. Certainly high densitieshave been recorded in both of the most recent surveys. Given the high water levels at the time of these surveys, theincrease may actually be greater than recorded.
Year
Non
-Hat
chlin
g D
ensi
ty (
N/k
m)
0
.25
.5
.75
1
1.25
1.5
1.75
2
2.25
1988 1990 1992 1994 1996 1998 2000 2002 2004
Figure 2a. Total density of C. novaeguineae sighted during spotlight surveys in theJaro River, 1989-2002. Solid line indicates the significant linear regression trend(see text).
Figure 2b. Non-hatchling density of C. novaeguineae sighted during spotlight surveysin the Jaro River, 1989-2002. Solid line indicates the significant linear regressiontrend (see text).
YearD
ensi
ty (
N/k
m)
0
.25
.5
.75
1
1.25
1.5
1.75
2
2.25
1988 1990 1992 1994 1996 1998 2000 2002 2004
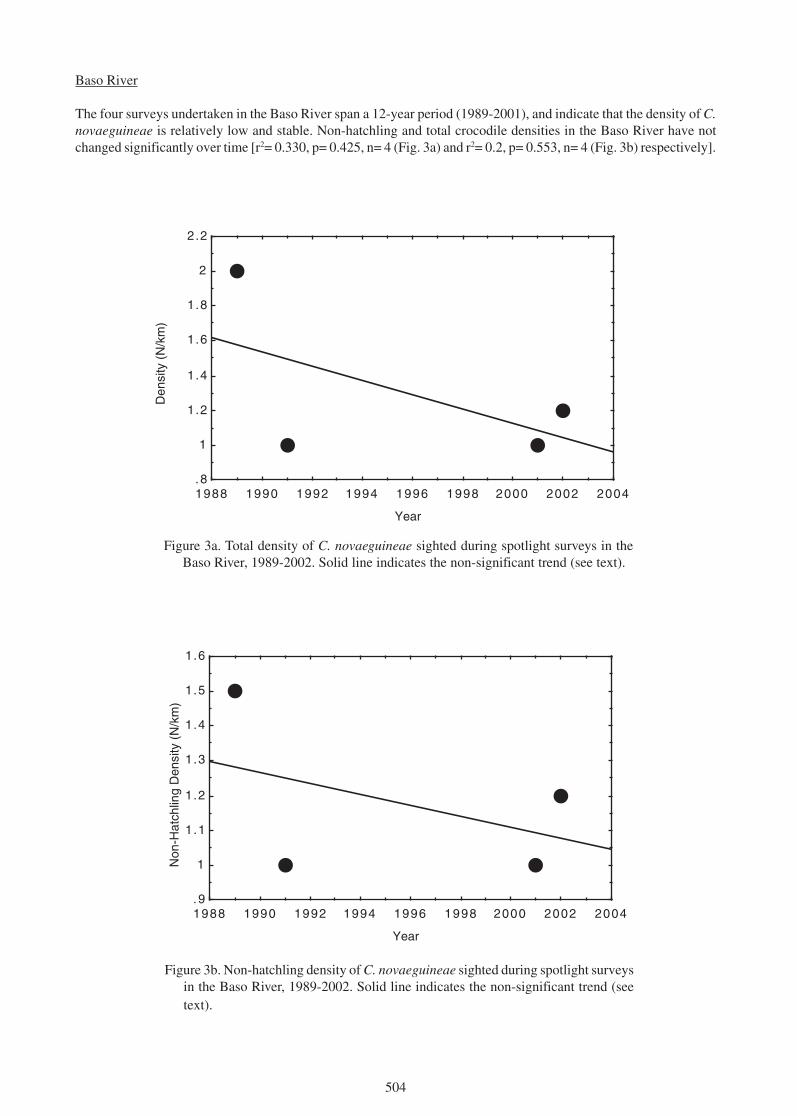
504
Year
Non
-Hat
chlin
g D
ensi
ty (
N/k
m)
. 9
1
1.1
1.2
1.3
1.4
1.5
1.6
1988 1990 1992 1994 1996 1998 2000 2002 2004
Figure 3b. Non-hatchling density of C. novaeguineae sighted during spotlight surveysin the Baso River, 1989-2002. Solid line indicates the non-significant trend (seetext).
Baso River
The four surveys undertaken in the Baso River span a 12-year period (1989-2001), and indicate that the density of C.novaeguineae is relatively low and stable. Non-hatchling and total crocodile densities in the Baso River have notchanged significantly over time [r2= 0.330, p= 0.425, n= 4 (Fig. 3a) and r2= 0.2, p= 0.553, n= 4 (Fig. 3b) respectively].
Year
Den
sity
(N
/km
)
. 8
1
1.2
1.4
1.6
1.8
2
2.2
1988 1990 1992 1994 1996 1998 2000 2002 2004
Figure 3a. Total density of C. novaeguineae sighted during spotlight surveys in theBaso River, 1989-2002. Solid line indicates the non-significant trend (see text).
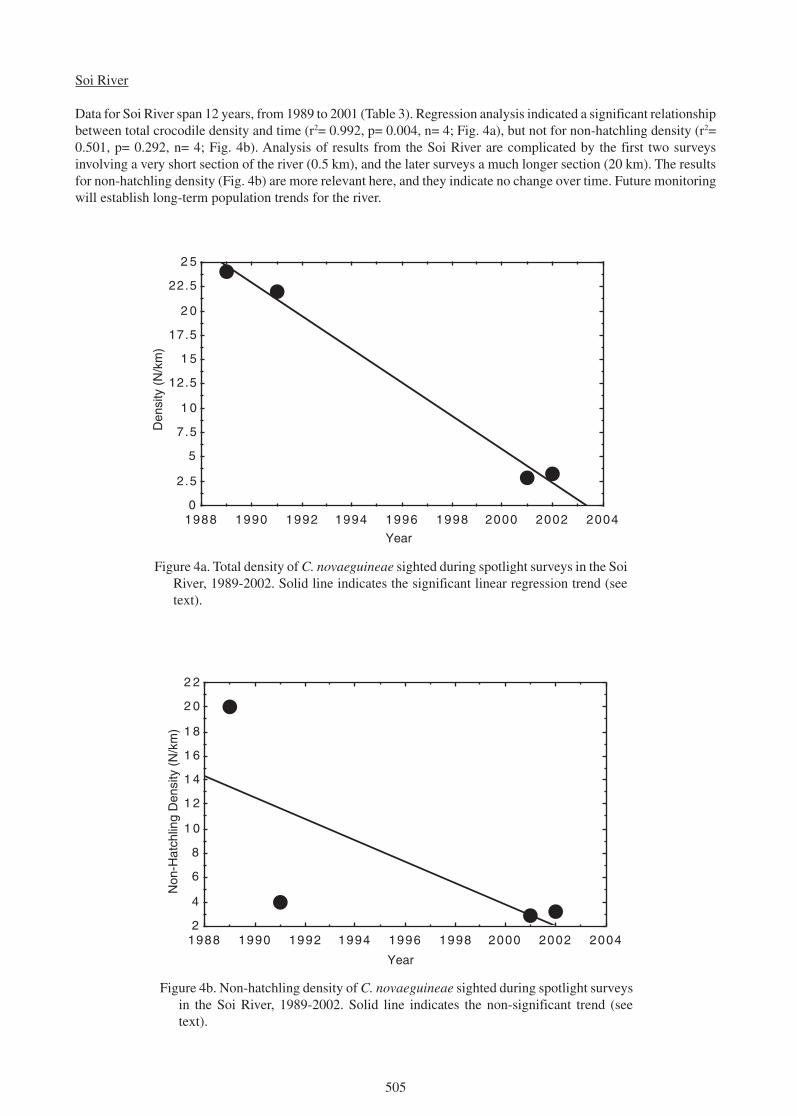
505
Soi River
Data for Soi River span 12 years, from 1989 to 2001 (Table 3). Regression analysis indicated a significant relationshipbetween total crocodile density and time (r2= 0.992, p= 0.004, n= 4; Fig. 4a), but not for non-hatchling density (r2=0.501, p= 0.292, n= 4; Fig. 4b). Analysis of results from the Soi River are complicated by the first two surveysinvolving a very short section of the river (0.5 km), and the later surveys a much longer section (20 km). The resultsfor non-hatchling density (Fig. 4b) are more relevant here, and they indicate no change over time. Future monitoringwill establish long-term population trends for the river.
Year
Den
sity
(N
/km
)
0
2 .5
5
7.5
1 0
12.5
1 5
17.5
2 0
22.5
2 5
1988 1990 1992 1994 1996 1998 2000 2002 2004
Figure 4a. Total density of C. novaeguineae sighted during spotlight surveys in the SoiRiver, 1989-2002. Solid line indicates the significant linear regression trend (seetext).
Figure 4b. Non-hatchling density of C. novaeguineae sighted during spotlight surveysin the Soi River, 1989-2002. Solid line indicates the non-significant trend (seetext).
Year
Non
-Hat
chlin
g D
ensi
ty (
N/k
m)
2
4
6
8
1 0
1 2
1 4
1 6
1 8
2 0
2 2
1988 1990 1992 1994 1996 1998 2000 2002 2004
505
Soi River
Data for Soi River span 12 years, from 1989 to 2001 (Table 3). Regression analysis indicated a significant relationshipbetween total crocodile density and time (r2= 0.992, p= 0.004, n= 4; Fig. 4a), but not for non-hatchling density (r2=0.501, p= 0.292, n= 4; Fig. 4b). Analysis of results from the Soi River are complicated by the first two surveysinvolving a very short section of the river (0.5 km), and the later surveys a much longer section (20 km). The resultsfor non-hatchling density (Fig. 4b) are more relevant here, and they indicate no change over time. Future monitoringwill establish long-term population trends for the river.
Year
Den
sity
(N
/km
)
0
2 .5
5
7.5
1 0
12.5
1 5
17.5
2 0
22.5
2 5
1988 1990 1992 1994 1996 1998 2000 2002 2004
Figure 4a. Total density of C. novaeguineae sighted during spotlight surveys in the SoiRiver, 1989-2002. Solid line indicates the significant linear regression trend (seetext).
Figure 4b. Non-hatchling density of C. novaeguineae sighted during spotlight surveysin the Soi River, 1989-2002. Solid line indicates the non-significant trend (seetext).
YearN
on-H
atch
ling
Den
sity
(N
/km
)
2
4
6
8
1 0
1 2
1 4
1 6
1 8
2 0
2 2
1988 1990 1992 1994 1996 1998 2000 2002 2004
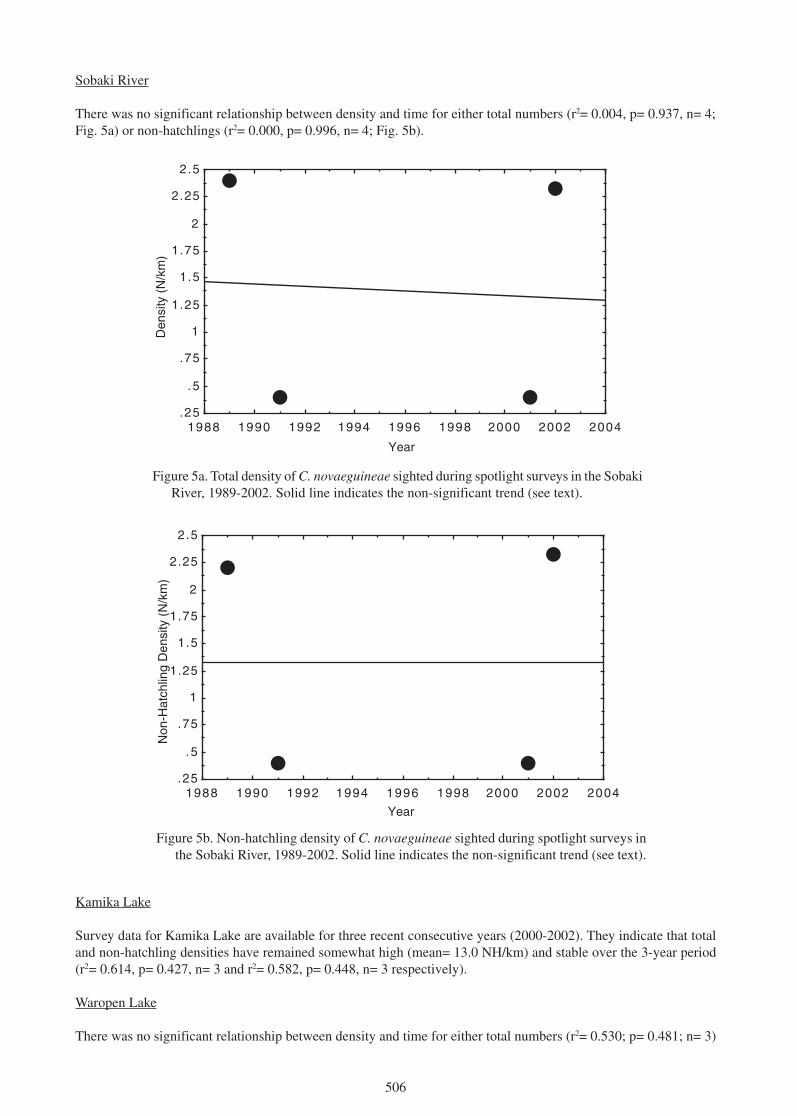
506
Year
Non
-Hat
chlin
g D
ensi
ty (
N/k
m)
. 25
.5
.75
1
1.25
1.5
1.75
2
2.25
2.5
1988 1990 1992 1994 1996 1998 2000 2002 2004
Figure 5b. Non-hatchling density of C. novaeguineae sighted during spotlight surveys inthe Sobaki River, 1989-2002. Solid line indicates the non-significant trend (see text).
Sobaki River
There was no significant relationship between density and time for either total numbers (r2= 0.004, p= 0.937, n= 4;Fig. 5a) or non-hatchlings (r2= 0.000, p= 0.996, n= 4; Fig. 5b).
Year
Den
sity
(N
/km
)
. 25
.5
.75
1
1.25
1.5
1.75
2
2.25
2.5
1988 1990 1992 1994 1996 1998 2000 2002 2004
Figure 5a. Total density of C. novaeguineae sighted during spotlight surveys in the SobakiRiver, 1989-2002. Solid line indicates the non-significant trend (see text).
Kamika Lake
Survey data for Kamika Lake are available for three recent consecutive years (2000-2002). They indicate that totaland non-hatchling densities have remained somewhat high (mean= 13.0 NH/km) and stable over the 3-year period(r2= 0.614, p= 0.427, n= 3 and r2= 0.582, p= 0.448, n= 3 respectively).
Waropen Lake
There was no significant relationship between density and time for either total numbers (r2= 0.530; p= 0.481; n= 3)
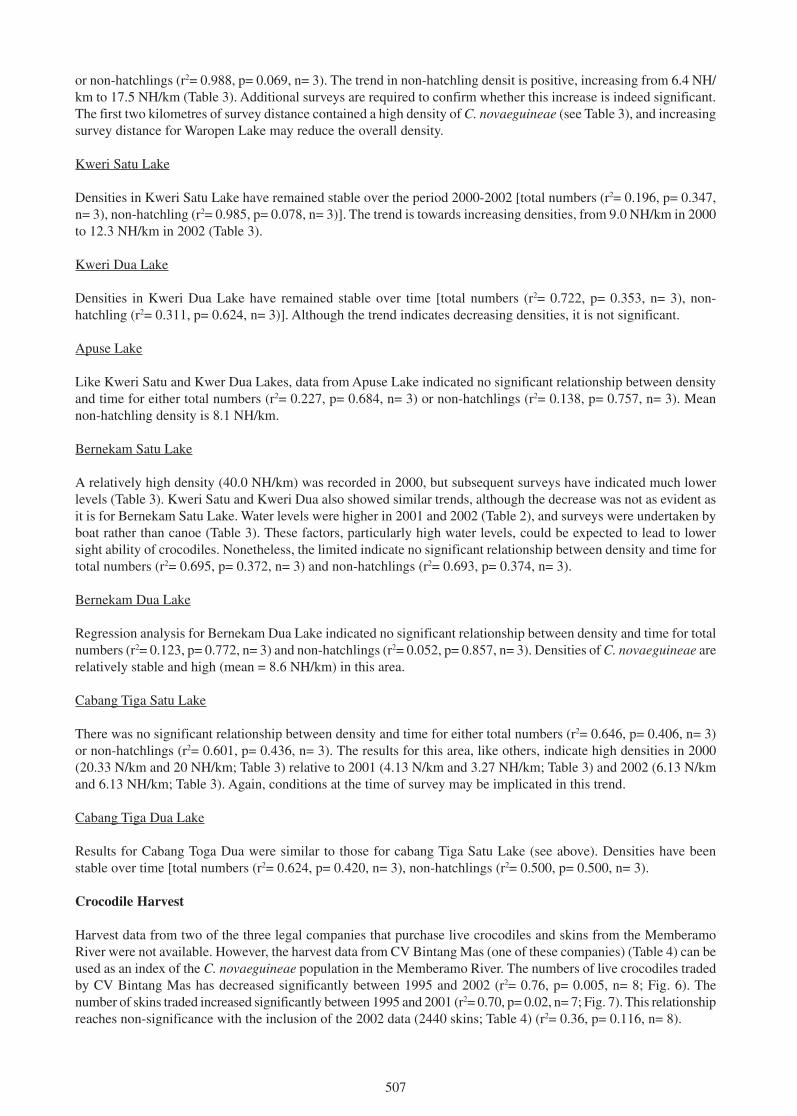
507
or non-hatchlings (r2= 0.988, p= 0.069, n= 3). The trend in non-hatchling densit is positive, increasing from 6.4 NH/km to 17.5 NH/km (Table 3). Additional surveys are required to confirm whether this increase is indeed significant.The first two kilometres of survey distance contained a high density of C. novaeguineae (see Table 3), and increasingsurvey distance for Waropen Lake may reduce the overall density.
Kweri Satu Lake
Densities in Kweri Satu Lake have remained stable over the period 2000-2002 [total numbers (r2= 0.196, p= 0.347,n= 3), non-hatchling (r2= 0.985, p= 0.078, n= 3)]. The trend is towards increasing densities, from 9.0 NH/km in 2000to 12.3 NH/km in 2002 (Table 3).
Kweri Dua Lake
Densities in Kweri Dua Lake have remained stable over time [total numbers (r2= 0.722, p= 0.353, n= 3), non-hatchling (r2= 0.311, p= 0.624, n= 3)]. Although the trend indicates decreasing densities, it is not significant.
Apuse Lake
Like Kweri Satu and Kwer Dua Lakes, data from Apuse Lake indicated no significant relationship between densityand time for either total numbers (r2= 0.227, p= 0.684, n= 3) or non-hatchlings (r2= 0.138, p= 0.757, n= 3). Meannon-hatchling density is 8.1 NH/km.
Bernekam Satu Lake
A relatively high density (40.0 NH/km) was recorded in 2000, but subsequent surveys have indicated much lowerlevels (Table 3). Kweri Satu and Kweri Dua also showed similar trends, although the decrease was not as evident asit is for Bernekam Satu Lake. Water levels were higher in 2001 and 2002 (Table 2), and surveys were undertaken byboat rather than canoe (Table 3). These factors, particularly high water levels, could be expected to lead to lowersight ability of crocodiles. Nonetheless, the limited indicate no significant relationship between density and time fortotal numbers (r2= 0.695, p= 0.372, n= 3) and non-hatchlings (r2= 0.693, p= 0.374, n= 3).
Bernekam Dua Lake
Regression analysis for Bernekam Dua Lake indicated no significant relationship between density and time for totalnumbers (r2= 0.123, p= 0.772, n= 3) and non-hatchlings (r2= 0.052, p= 0.857, n= 3). Densities of C. novaeguineae arerelatively stable and high (mean = 8.6 NH/km) in this area.
Cabang Tiga Satu Lake
There was no significant relationship between density and time for either total numbers (r2= 0.646, p= 0.406, n= 3)or non-hatchlings (r2= 0.601, p= 0.436, n= 3). The results for this area, like others, indicate high densities in 2000(20.33 N/km and 20 NH/km; Table 3) relative to 2001 (4.13 N/km and 3.27 NH/km; Table 3) and 2002 (6.13 N/kmand 6.13 NH/km; Table 3). Again, conditions at the time of survey may be implicated in this trend.
Cabang Tiga Dua Lake
Results for Cabang Toga Dua were similar to those for cabang Tiga Satu Lake (see above). Densities have beenstable over time [total numbers (r2= 0.624, p= 0.420, n= 3), non-hatchlings (r2= 0.500, p= 0.500, n= 3).
Crocodile Harvest
Harvest data from two of the three legal companies that purchase live crocodiles and skins from the MemberamoRiver were not available. However, the harvest data from CV Bintang Mas (one of these companies) (Table 4) can beused as an index of the C. novaeguineae population in the Memberamo River. The numbers of live crocodiles tradedby CV Bintang Mas has decreased significantly between 1995 and 2002 (r2= 0.76, p= 0.005, n= 8; Fig. 6). Thenumber of skins traded increased significantly between 1995 and 2001 (r2= 0.70, p= 0.02, n= 7; Fig. 7). This relationshipreaches non-significance with the inclusion of the 2002 data (2440 skins; Table 4) (r2= 0.36, p= 0.116, n= 8).
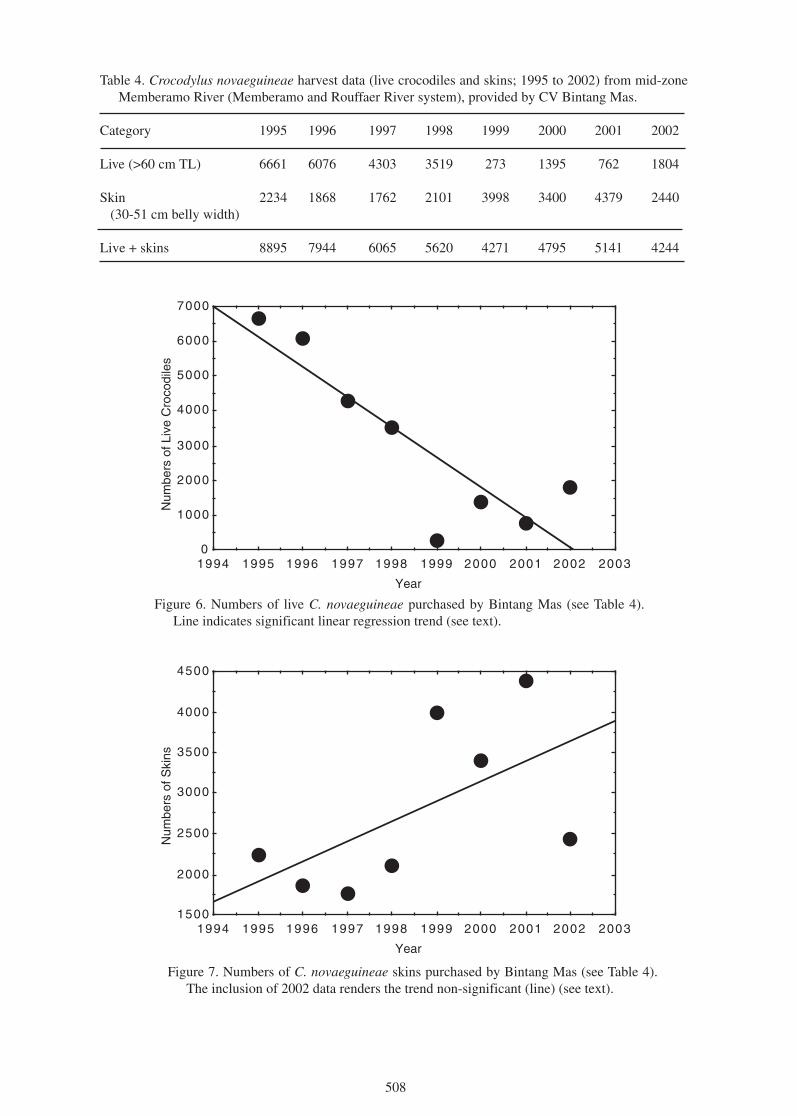
508
Year
Num
bers
of L
ive
Cro
codi
les
0
1000
2000
3000
4000
5000
6000
7000
1994 1995 1996 1997 1998 1999 2000 2001 2002 2003
Figure 6. Numbers of live C. novaeguineae purchased by Bintang Mas (see Table 4).Line indicates significant linear regression trend (see text).
Table 4. Crocodylus novaeguineae harvest data (live crocodiles and skins; 1995 to 2002) from mid-zoneMemberamo River (Memberamo and Rouffaer River system), provided by CV Bintang Mas.
Category 1995 1996 1997 1998 1999 2000 2001 2002
Live (>60 cm TL) 6661 6076 4303 3519 273 1395 762 1804
Skin 2234 1868 1762 2101 3998 3400 4379 2440 (30-51 cm belly width)
Live + skins 8895 7944 6065 5620 4271 4795 5141 4244
Year
Num
bers
of S
kins
1500
2000
2500
3000
3500
4000
4500
1994 1995 1996 1997 1998 1999 2000 2001 2002 2003
Figure 7. Numbers of C. novaeguineae skins purchased by Bintang Mas (see Table 4).The inclusion of 2002 data renders the trend non-significant (line) (see text).
508
Year
Num
bers
of L
ive
Cro
codi
les
0
1000
2000
3000
4000
5000
6000
7000
1994 1995 1996 1997 1998 1999 2000 2001 2002 2003
Figure 6. Numbers of live C. novaeguineae purchased by Bintang Mas (see Table 4).Line indicates significant linear regression trend (see text).
Table 4. Crocodylus novaeguineae harvest data (live crocodiles and skins; 1995 to 2002) from mid-zoneMemberamo River (Memberamo and Rouffaer River system), provided by CV Bintang Mas.
Category 1995 1996 1997 1998 1999 2000 2001 2002
Live (>60 cm TL) 6661 6076 4303 3519 273 1395 762 1804
Skin 2234 1868 1762 2101 3998 3400 4379 2440 (30-51 cm belly width)
Live + skins 8895 7944 6065 5620 4271 4795 5141 4244
YearN
umbe
rs o
f Ski
ns
1500
2000
2500
3000
3500
4000
4500
1994 1995 1996 1997 1998 1999 2000 2001 2002 2003
Figure 7. Numbers of C. novaeguineae skins purchased by Bintang Mas (see Table 4).The inclusion of 2002 data renders the trend non-significant (line) (see text).
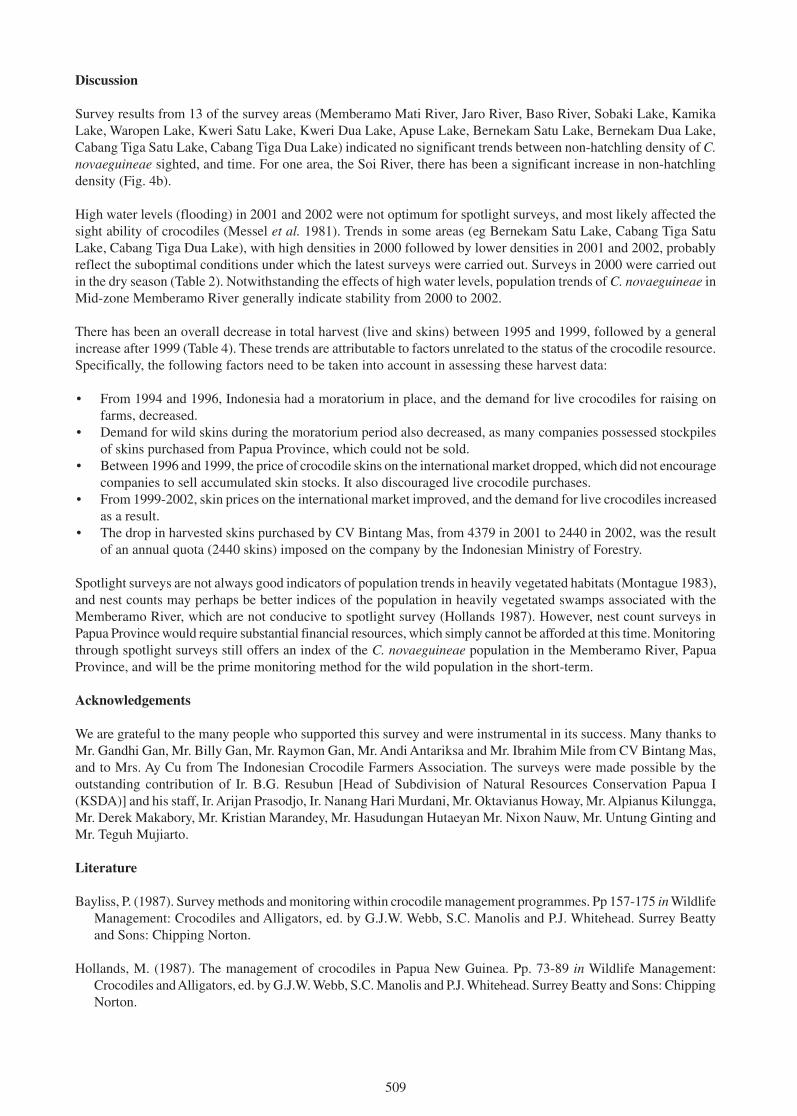
509
Discussion
Survey results from 13 of the survey areas (Memberamo Mati River, Jaro River, Baso River, Sobaki Lake, KamikaLake, Waropen Lake, Kweri Satu Lake, Kweri Dua Lake, Apuse Lake, Bernekam Satu Lake, Bernekam Dua Lake,Cabang Tiga Satu Lake, Cabang Tiga Dua Lake) indicated no significant trends between non-hatchling density of C.novaeguineae sighted, and time. For one area, the Soi River, there has been a significant increase in non-hatchlingdensity (Fig. 4b).
High water levels (flooding) in 2001 and 2002 were not optimum for spotlight surveys, and most likely affected thesight ability of crocodiles (Messel et al. 1981). Trends in some areas (eg Bernekam Satu Lake, Cabang Tiga SatuLake, Cabang Tiga Dua Lake), with high densities in 2000 followed by lower densities in 2001 and 2002, probablyreflect the suboptimal conditions under which the latest surveys were carried out. Surveys in 2000 were carried outin the dry season (Table 2). Notwithstanding the effects of high water levels, population trends of C. novaeguineae inMid-zone Memberamo River generally indicate stability from 2000 to 2002.
There has been an overall decrease in total harvest (live and skins) between 1995 and 1999, followed by a generalincrease after 1999 (Table 4). These trends are attributable to factors unrelated to the status of the crocodile resource.Specifically, the following factors need to be taken into account in assessing these harvest data:
• From 1994 and 1996, Indonesia had a moratorium in place, and the demand for live crocodiles for raising onfarms, decreased.
• Demand for wild skins during the moratorium period also decreased, as many companies possessed stockpilesof skins purchased from Papua Province, which could not be sold.
• Between 1996 and 1999, the price of crocodile skins on the international market dropped, which did not encouragecompanies to sell accumulated skin stocks. It also discouraged live crocodile purchases.
• From 1999-2002, skin prices on the international market improved, and the demand for live crocodiles increasedas a result.
• The drop in harvested skins purchased by CV Bintang Mas, from 4379 in 2001 to 2440 in 2002, was the resultof an annual quota (2440 skins) imposed on the company by the Indonesian Ministry of Forestry.
Spotlight surveys are not always good indicators of population trends in heavily vegetated habitats (Montague 1983),and nest counts may perhaps be better indices of the population in heavily vegetated swamps associated with theMemberamo River, which are not conducive to spotlight survey (Hollands 1987). However, nest count surveys inPapua Province would require substantial financial resources, which simply cannot be afforded at this time. Monitoringthrough spotlight surveys still offers an index of the C. novaeguineae population in the Memberamo River, PapuaProvince, and will be the prime monitoring method for the wild population in the short-term.
Acknowledgements
We are grateful to the many people who supported this survey and were instrumental in its success. Many thanks toMr. Gandhi Gan, Mr. Billy Gan, Mr. Raymon Gan, Mr. Andi Antariksa and Mr. Ibrahim Mile from CV Bintang Mas,and to Mrs. Ay Cu from The Indonesian Crocodile Farmers Association. The surveys were made possible by theoutstanding contribution of Ir. B.G. Resubun [Head of Subdivision of Natural Resources Conservation Papua I(KSDA)] and his staff, Ir. Arijan Prasodjo, Ir. Nanang Hari Murdani, Mr. Oktavianus Howay, Mr. Alpianus Kilungga,Mr. Derek Makabory, Mr. Kristian Marandey, Mr. Hasudungan Hutaeyan Mr. Nixon Nauw, Mr. Untung Ginting andMr. Teguh Mujiarto.
Literature
Bayliss, P. (1987). Survey methods and monitoring within crocodile management programmes. Pp 157-175 in WildlifeManagement: Crocodiles and Alligators, ed. by G.J.W. Webb, S.C. Manolis and P.J. Whitehead. Surrey Beattyand Sons: Chipping Norton.
Hollands, M. (1987). The management of crocodiles in Papua New Guinea. Pp. 73-89 in Wildlife Management:Crocodiles and Alligators, ed. by G.J.W. Webb, S.C. Manolis and P.J. Whitehead. Surrey Beatty and Sons: ChippingNorton.

510
KSDA (Division of Natural Resources and Conservation Irian Jaya, I) (2000). Monitoring and survey report ofcrocodile population in Memberamo Zone, Irian Jaya. Jayapura. ii+18 pp. [Balai Konservasi Sumber Daya AlamIrian Jaya I (KSDA). (2000). Laporan monitoring dan survai populasi buaya di Zona Memberamo, Irian Jaya.Jayapura. ii+18 pp.]
KSDA (Division of Natural Resources and Conservation Papua I.) (2002). Survey and monitoring of crocodilepopulation in Pagay (Kaureh District) and Dabra (Memberamo Hulu District), Jayapura Regency, Papua Province.Jayapura. v+14 pp+16 appendices. [Balai Konservasi Sumber Daya Alam Papua I (KSDA). (2002). Survey danmonitoring populasi buaya di habitat alam di Pagay (Distrik Kaureh) dan Dabra (Distrik Memberamo Hulu)Kabupaten Jayapura, Propinsi Papua. Jayapura.v+14 pp+16 lampiran].
Kurniati, H., Prasodjo, A., Murdani, N.H., Howay, O., Kilungga, A., Makabory, D. and Marandey, D. (2001). Crocodilespotlight surveys in mid-zone Memberamo River (Memberamo and Rouffaer River systems), Irian Jaya, Indonesia.Indonesian Institute of Sciences, Cibinong. 12 pp.
Messel, H., Vorlicek, G.C., Wells, A.G. and Green, W.J. (1981). Surveys of Tidal River Systems in The NorthernTerritory of Australia and Their Crocodile Populations. Monograph 1. Pergamon Press: Oxford.
Montague, J.J. (1983). Influence of water level, hunting pressure and habitat type on crocodile abundance in the FlyRiver drainage, Papua New Guinea. Biological Conservation 26: 309-339.
Webb, G.J.W. and Jenkins, R.W.G. (1991). A proposal to transfer the Indonesian population of Crocodylus porosusSchneider (1801) from Appendix I to Appendix II of CITES. Pp. 36 in Management of Crocodilians in Indonesia:a Review with Recommendations.
511
Report on the Activities and Actual Situation of the Crocodylia in Mexico
Recompilation of information by Manuel I. Muñiz(Credit to authors in Annex)
Sociedad para el Estudio y Conservación de los Cocodrilos en México a.c. (SECOCOM a.c.) Dec.2003., Apartado Postal 41– 601, Lomas de Chapultepec, c.p. 11000 México D.F. México.
[email protected] or [email protected]
Abstract
Decades have passed studying, investigating and producing articles related to caimans, Caiman crocodilus chiapasius(not yet confirmed as subspecies), American crocodiles, Crocodylus acutus and Morelet’s crocodiles, Crocodylusmoreletii in our country, but little of these results are known outside Mexico. That’s why the main objective of thiswork is to let know in a synthesis the situation and activities done around the crocodilians that inhabit in Mexico. Wecan find in 16 of the 32 States in Mexico crocodilians. From Sinaloa to Chiapas along the Pacific coast; fromTamaulipas and San Luis Potosí all the way to the Peninsula of Yucatan and in inland at the central depression ofChiapas State.
The Mexican authority in charge of environment regulations is SEMARNAT, through the Wildlife General Direction(DGVS), CITES Administration; CONABIO CITES scientific; PROFEPA inspection; and INE.
All three specie are protected by Mexican laws under the category Special Protection, which permits and allowssustainable use. Registered are 35 farms and more than 80 zoo and collections with crocodilians, 3 of them haveCITES permits and 1 farm working with caimans, which doesn’t need to register with CITES for exports. Mexicohas imported more than 250,000 hides of caiman and other crocodilians which are transformed and re-exported asfinished products and sub-products to the rest of the world.
Introduction
Decades have passed studying, investigating and elaborating articles related with Caimans, American crocodiles andMorelet’s crocodile in our country, but little of these results are known outside Mexico. That’s why, the main objectof this work is to let know in a synthesis the situation and activities done around the crocodilian that inhabit inMexico. As is known, in Mexico live 3 of the 23 species of crocodilians (Ross 1998) that we actually can find in ourworld. The caiman, Caiman crocodilus chiapasius (not yet confirmed as subspecies); American crocodile, Crocodylusacutus; and Morelet’s crocodile, Crocodylus moreletii.
Mexican species, as with most crocodilians, are threatened because of the destruction, transformation, contaminationand invasion of their habitat. In addition they are victims of hunting and illegal trade. With great effort between thecommunities, cooperatives, investigators, private investors, ONG, Government entities, academics and institutionshad invert and minimize these threats. But still a lot of work has to be done to guarantee the recovery of the threecrocodilian species in Mexico.
Because of their ecological value and keystone importance in their habitat, the Mexican crocodilians are considerateas charismatic and priority species, acquiring with this, a high priority for their conservation and protection.
From the 32 States of the Mexican Republic, in 16 of them, we can find crocodilians. From Sinaloa to Chiapas alongthe Pacific cost; from Tamaulipas and San Luis Potosí all the way to the Peninsula of Yucatan and in inland at thecentral depression of Chiapas State.
Also during the last four year Mexico has imported more than 250,000 hides of caiman and other crocodilians whichtransform and re-exports finish products and sub-products to the rest of the world.

512
En Español
Décadas han transcurrido estudiando, investigando y elaborando artículos en torno a los caimanes, a los cocodrilosde río y a los cocodrilos de pantano en nuestro país, pero poca de estos resultados se han dado a conocer a nivelinternacional. Por ello, el objetivo principal de este trabajo es dar a conocer en síntesis la situación y actividades quese realizan en torno a los cocodrilianos que habitan en México.
Como se conoce en México existen 3 de las 23 especies de cocodrilianos (Ross 1998) que actualmente se puedenencontrar en el planeta. El caimán, Caiman sclerops chiapasius, el cocodrilo de río, Crocodylus acutus, y el cocodrilode pantano, Crocodylus moreletii.
Como la mayoría de las especies de cocodrilianos las especies mexicanas se encuentran amenazadas por la destrucción,transformación, contaminación e invasión de su hábitat, además son victimas de cacerías y comercio ilegales. Congrandes esfuerzo entre las comunidades, cooperativas, investigadores, iniciativa privada, organizaciones nogubernamentales, entidades gubernamentales, académicos, e instituciones se han vertido y minimizado algunas deestas amenazas. Sin embargo falta mucho más por realizar para garantizar la recuperación de las tres especies decocodrilianos en México.
Por su valor ecológico y eslabón importante en su hábitat, los cocodrilianos son considerados en México comoespecies carismáticas y prioritarias. Adquiriendo con ello una mayor importancia para su conservación y protección.
De los 32 estados en la República mexicana, en 16 de estos, podemos encontrar cocodrilianos. Desde Sinaloa hastaChiapas por toda la costa del pacífico, desde Tamaulipas, pasando por San Luis Potosí y toda la península de Yucatány adentrándose hasta la depresión central del estado de Chiapas.
Además en los últimos cuatro años México a importado más de 250,000 pieles de caimán y otros cocodrilianos quetransforma y re-exporta productos y subproductos terminados al resto del mundo.
Situation with the Three Species of Mexican Crocodilians
Identification of the three species
Even though, in other part of the distribution of these species, other authors mention some characteristic, here we’regoing to describe and resemble the characteristics and the observation made by Mexican investigators and scientists.
Caiman sclerops chiapasius
Described by Bocourt, the Caiman sclerops chiapasius is now know as Caiman crocodilus fuscus becausethere’s not enough information and studies on the species and subspecies of caimans to validate this data. ButÁlvarez del Toro and Luis Sigler (2001), mentioned and described the subspecies. Medem (1962) analysed,suggested, classified and described the subspecies of caimans, mentioning the Caiman sclerops chiapasius. Alsosome DNA studies suggest that Caiman crocodilus fuscus and Caiman crocodilus chiapasius are in the samenatural group (Ross 1998). Though, we’ve seen morphological differences between the Mexican caiman, (Caimansclerops chiapasius or Caiman crocodilus chiapasius) and the morphological descriptions made by other authorsfor the Caiman crocodilus crocodilus and Caiman crocodilus fuscus.
Sizes: Adults’ maximum sizes registered, 2.50 m. Adults sizes 1.20 m minimum (females) up to 2.00 m or more(males). Hatchlings average sizes 22.5 cm. Minimum 18.5 cm, maximum 25.5 cm. Females lays an average of30 eggs, maximum 37 eggs. (Lopez M, per.com.)
Conformation: Snout is short, triangular and round tip. Measuring between 1.2 to 1.5 times as long as broad atthe level of the front corners of the eyes. A transverse bony ridge connects the anterior points of the orbits. On theupper eyelid presents a high point or tubercle. On the lower jaw presents two, three or more blotches.
Scutellation: The belly skin of caimans has osteoderms and without the integumentary sensory organs (ISO)(Richardson, Webb and Manolis 2002). Postoccipitals: One or two transversal row of 6 to 8 scales irregularlyarranged. Nuchals: 4 to 5 transverse rows of 4 to 2 scales, continuous with the dorsal scales. Collar: A single rowof enlarged scales on collar.

513
Distribution: The species, Caiman crocodilus could be found from the south Pacific coast of Mexico all the wayto north of Argentina. The subspecies Caiman sclerops chiapasius, as described by Medem, is registered to theTonala region, northwest cost of Chiapas, so we believed that the distribution of this subspecies could find fromthe south of Oaxaca state throw all the pacific cost of Chiapas as high as 50 meter above sea level (Álvarez andSigler 2001). Not knowing is the distribution of this subspecies goes on Central America. Some authors mentionit all the way to Panama.
Crocodylus acutus
Sizes: Adults’ maximum sizes registered, 7.00 m (Brazaitis 1973). In Mexico, is the biggest of all three species,Alvarez del Toro (1974) measured one specimen with a total length of 6.25 m, and also Pérez Higareda andfriends (1991) reported one specimen of the same sizes. Nowadays, it’s difficult to find specimens larger than 5m. Adults sizes 2.10 m minimum (females) up to 5.00 m or more (males). Hatchlings average sizes 28 cmminimum 24 cm, maximum 31.5 cm. Females lays an average of 34 eggs, maximum 51 eggs. Eggs average sizes7.69 cm (+4.2) x 4.69 (+1.6) cm (Valtierra 2001; Sigler et al. 2000)
Conformation: Skull and snout are slender and elongate, 1.8 to 2.5 times as long as broad at the level of the frontcorners of the eyes. Adults develop a hump on the snout anterior to the orbit. Iris is greenish and eyelid wrinkled.
Scutellation: The scutellation is highly irregular and variable among individuals. The dorsal scales are enlargeand high. Postoccipitals: A single transversal row of 1 to 6 enlarged scales medially divided by soft skin. Nuchals:The nuchal rosette has 4 enlarged scales in a quadrant and 2 scales flanked by the sides. Variability in pattern isgreat among individuals.
Distribution: Crocodylus acutus is found from south Florida, United States, Northwest Pacific coast of Mexicoall the way to Venezuela and Colombia. Also found in Cuba, Jamaica, Dominique Republic, Antilles, and almostin all small island and cay in the Caribbean Sea. In Mexico, could be found from the north Pacific coast as highas La Bojonea, north of El Fuerte River all the way to the Suchiate River at the border of Guatemala and Mexico,inhabiting all mayor costal mangroves, marshes, swamps, rivers, lagoons, and larger ponds (Ponce 2002; Valtierra2001; Sigler 2000). Also reported in the coast, cay and small islands of Quintana Roo State in the YucatanPeninsula. It hasn’t been confirm to inhabit the Gulf of Mexico specially at Tabasco and Campeche States(Carballar J., 2002). There’s a particular isolated population of Crocodylus acutus living in the Grijalva Riverbetween massive high hydroelectric damps and high mountains, the Sierra Madre cordillera, in the middle ofChiapas State (Sigler 1998, 2000, 2002).
Crocodylus moreletii
Sizes: Adults’ maximum sizes registered, 3.50 m. Adults sizes 1.30 m minimum (females) up to 3.10 m or more(males). Hatchlings average size of 26.2 cm, minimum 20 cm. maximum 31.5 cm. Females lay an average of 35eggs, maximum 50 eggs. Eggs average 6.8 cm x 4.3 cm (Muñiz 2000).
Conformation: Snout short, massive and wide, not more than 1.5 times as long as broad at the level of the frontcorners of the eyes.
Scutellation: The belly skin of Morelet’s crocodile is highly prized because it has few osteoderms (Richardson,Webb and Manolis 2002). Presents inclusions on tail and on ventral skin. Postoccipitals: a single transversal rowof 4 to 6 scales divided by smooth skin. Nuchals: Presents a nuchal rosette with one row of 4 scales and anotherrow with 2 scales.
Distribution: Occurs on the Atlantic side in the Gulf of Mexico from centre as high as Laguna Madre, 42º 30’latitude north in Tamaulipas State down throw Veracruz, San Luis Potosí, Oaxaca and Tabasco to Campeche,Yucatan and Quintana Roo in the Peninsula of Yucatan (Hinojosa 2001; Bautista 1999; Dominguez 2003; Figueroaet al. 2000; Gómez 2002; Pani 1999; Pérez 2002; Merediz 1999; Cedeño 2002). Inland as far as in the HuastecaPotosina at San Luis Potosi State in the north and in the south occurs in the northwest and northeast of ChiapasState, El Caracol lagoon, El Aguacate lagoon; Lacanja river and River Lacantún at Montes Azules biospherereserve, Usumacinta river (the border between Guatemala and Mexico) up to 800 m above sea level. (Martinez2001; Sigler et al. 2001; Sigler 2002). Also occurs in Belize and north of Guatemala (Platt 1997; Castañeda2001).
514
Status of the Three Species
National and international list, laws and conventions that affects and controls Mexican crocodilians.
• NOM-059-ECOL-2001: is the official norm that identifies the species and population that are in risk of wildflora and fauna in the Mexican Republic. Based on a list that corresponded to the risk, the criteria of inclusion,of exclusion and changes of categories. See Categories in chapter of legislation.
• CITES: Convention on International Trade in Endangered Species of Wild Fauna and Flora.
• IUCN (International Union for the Conservation of Nature and Natural Resources) - The World ConservationUnion Red List.
• ESA: Endanger Species Act, United States law.
• CSG: Crocodile Specialist Group, Species Survival Commission, IUCN.
Caiman sclerops chiapasius: Considered as Caiman crocodilus fuscus.NOM-059-ECOL-2001: Special Protection.CITES: Appendix IIIUCN 1996: Not listed.ESA: Not listedCSG 1998: Availability of survey data - Adequate, Need for wild population recovery - low, Potential for sustainablemanagement - highest. Though in Mexico requires more survey data - poor.Threats: Habitat loss and illegal hunting.
Crocodylus acutusNOM-059-ECOL-2001: Special Protection.CITES: Appendix IIUCN 1996: Listed. Vulnerable. Criteria A.1.a.c. inferred decline >20% in 3 generations, inferred from reductionin extent of occurrence.ESA: ListedCSG 1998: Availability of survey data - poor, Need for wild population recovery - high, Potential for sustainablemanagement - moderate.Threats: Habitat loss and illegal hunting
Crocodylus moreletiiNOM-059-ECOL-2001: Special Protection.CITES: Appendix I and Special permits for 3 farms. Num. 501, 502 and 503IUCN 1996: Listed.ESA: ListedCSG 1998: Availability of survey data – poor, Need for wild population recovery – moderate, Potential forsustainable management - moderate.Threats: Habitat loss and illegal hunting
Responsible Government Agencies, Legislation and Internal Control System
Management and Scientific Authorities:
Secretaria del Medio Ambiente y Recursos Naturales, (SEMARNAT) is the Secretary of Environment and NaturalResources in charge of everything related with the environment and our natural resources.
CITES Management Authority: Dirección General de Vida Silvestre, SAGP, SEMARNAT, (DGVS); is the generaldirection of Wildlife Service.Address: Av. Revolución no.- 1475, Colonia Tlacopac, México D.F.
CITES Scientific Authority: Comisión Nacional para el Conocimiento y Uso de la Biodiversidad (CONABIO) is theNational Commission for the Knowledge and use of the Biodiversity.
515
Inspection, Control and Supervision
Procuraduria Federal para la Protección del Medio Ambiente (PROFEPA,) is the Federal Attorney’s offices forenvironmental protection, is in charge of verifying the environmental legislation compliance, regarding naturalresources and wildlife usage. In accordance, PROFEPA carries out a national inspection programme, which includesinspection of foreign trade of specimens, products and sub-products. It has inspection offices located in 65 ports,airports and borders where wild flora and fauna imports and exports permits are verified, as well as the sanitaryconditions of wood and fishery products and sub-products, and also verifying all tips of Management units of wildlife.(UMAS)
Laws
In Mexico we have different laws that protects, conserves and establish the methods for the sustainable use of wildand captive flora and fauna.
Ley General de Vida Silvestre
The most important law in Mexico related with the wildlife, it’s conservation, protection and sustainable use isthe “General Law for wildlife” = “Ley general de Vida Silvestre”, published on July 3, 2000 by the president Dr.Ernesto Zedillo Ponce de Leon. It’s related to the conservation and sustainable use of wildlife and their habitat inthe Mexican territory and the zones where the nation has jurisdiction. With the exception of the sustainable useon timber forest and fishery, who have their own law.
Ley General del Equilibrio Ecológico y la Protección al Ambiente. (LGEEPA) (1996)
This is the General Law for the Ecological Equilibrium and Protection of the Environment. Includes all lawsrelated with the environment, our natural resources and its protection. Since December 1996, the article 87 ofthis law (LGEEPA) permits the use of wild flora and fauna species, when privates grants a controlled reproductionand growth in captivity or semi-captivity, including a management plan to conserve and protect their populations.
NOM-059-ECOL-2001Norma Oficial Mexicana, NOM-059-ECOL-2001, Protección ambiental – especies de flora y fauna silvestres deMéxico. Published in March 2002, this norm has for object to identify the species and subspecies of wild floraand fauna in the Mexican Republic that are in risked or endangered to disappear. Through the integration of alist, which categories, classifies, and determines the risk and threats of the wildlife.
Categories of risk:
1. Probablemente extinta en el medio Silvestre = Probably extinct in the wild
Those species natives of Mexico whose individual had disappear from the wild in the Mexican territory,from which, we have the knowledge that specimens live in captivity or outside the country.
2. En peligro de extinccion = In danger of extinction
Those species which distribution areas and population in the national territory had been diminishdramatically. (This category coincided partially with the categories of critically endanger and in dangerof extinction on the IUCN classification).
3. Amenazada = Threatened
Those species or their populations, that could get in danger of extinction or disappear in a short ormiddle period of time if the threats on the species continue. (This category coincided partially with thecategories of low risk on the IUCN classification).
4. Protección especial = Special protection
Those species and their population that could get threaten by negative factors, and has determined the

516
need to recover, conserve or both the habitat and populations associated with the species and species.(This category could included the low risk IUCN classifications).
Other laws
Apart from the above laws, the hunting law, the Fishing Law, the Forest Laws and other are the fundaments forthe conservation, protection and sustainable use of wildlife.
Inspection and Supervision
PROFEPA, (Procuraduria Federal para la Protección Ambiental) is the authority in charge to see that the lawsare carried out.
CITES, Authorised Farms for exportation of Hides
CITES has authorised 3 farms to commercialise Morelet’s crocodile hides, products and subproducts.
Cocodrilos Mexicanos s.a. de c.v., Cocomex - MexNumber: A-MX-501 or Mx / 12.2002/ 1-1With an estimated production of 12,000 eggs per year, it’s commercialising at present between 6500 and 4800hides per year. Principal markets Mexico, Japan and Spain.
Industrias Moreletii sa de cvNumber: A-MX-502 or Mx / 12.2002/ 1-2With an estimated production of 3000 to 4000 eggs per year, it’s commercialising at present around 1500 hidesa year. Principal markets Mexico, Spain and Italy.
Cocodrilos de Chiapas s.a. de c.v.Number: A-MX-503 or Mx / 12.2002 / 1-3Not working at present and no data obtained.
Caimanes y Cocodrilos de ChiapasDoes not need a CITES permit to export. With an estimated production of 1000 eggs per year, it’s commercialisingCaiman crocodilus.
No other farms had applied for registration, though there are a few other farms that in a few years will apply.
Activities and Work done in each Region of the Mexican Republic
To simplify the work, the Mexican Republic has been divided in four regions. Each region has different climate andvegetation even though sharing some characteristic in the habitat. List of principal investigation projects and farmsin each region are (in Spanish):
1. North Pacific Coast, including Sinaloa, Nayarit, Jalisco, Colima and Michoacán States
The north Pacific coast characterized by a long dry season and low jungle (Caducifolian forest) with a thin lineof mangrove cost and short rivers. Only Crocodylus acutus occurs.
• Abreu, Alberto et al. Evaluación genética del hato reproductor en Cocodrilos mexicanos y establecimiento deun programa de selección genética.
• León, Francisco et al. Chirricahueto Lagoon, Culiacán City, Sinaloa State.
• Huerta, Sara et al. Dinámica Poblacional del “Caimán” (Crocodylus acutus Cuvier 1807, Crocodylidae), enJalisco, México.
• Huerta, Sara et al. Interacción Hombre-Cocodrilo en la Costa de Jalisco, México.

517
• Ponce, Paulino et al. Relación de factores físicos del hábitat con eventos reproductivos del “Caimán” Crocodylusacutus Cuvier, 1807.
• Ponce, Paulino et al. Distribución y situación actual de las poblaciones del “caimán” Crocodylus acutus enJalisco
• Curul, Fabio et al. Ecología y Conservación del Cocodrilo de Río (Crocodylus acutus) en Bahía de Banderas,Jalisco-Nayarit, México
• Valtierra, Marciano. Ecología y Conservación del cocodrilo americano (Crocodylus acutus) en la Reserva dela Biosfera Chamela-Cuixmala, Jalisco, México.
• Navarro, Carlos. Determinación del estatus poblacional de Crocodylus acutus en el extremo norte de Sinaloay sur de Sonora, México.
• Cocodrilos Mexicanos, Culiacán City, Sinaloa State. Is the biggest farm in Mexico with more than 25,000crocodiles. Reproducing and commercializing, Crocodylus moreletii.
• Reptilario Cipactli, in Puerto Vallarta city, Jalisco State. Houses around 20 crocodiles at the Puerto VallartaUniversity, it’s for exhibition, investigation, conservation and reproduction of Crocodylus acutus.
• Cocodrilos del Pacífico, Lagunas de Monte Negro, at Coquimatlán, Colima State. Houses more than 250Crocodylus acutus. It’s for investigation, reproduction and sustainable use.
2. South Pacific Coast, including Guerrero, Oaxaca and Chiapas States
Caimanes y Cocodrilos de Chiapas, CAICROCHIS, in Tapachula City, Chiapas State. Breed Caiman crocodilus,Crocodylus acutus and Crocodylus moreletii. Housing over 1000 crocodilians. It has also South American speciesand African tortoise.
• Sigler, Luis et al. Cañón del Sumidero Project, Chiapas State, Zoomat.
• López, María de la Paz et al. Crecimiento y Desarrollo poblacional del Caimán (Caiman crocodilus) en Estadode Chiapas México.
• García, Jesús. Diseño de una estrategia de manejo del cocodrilo de río (Crocodylus acutus) en el estero LaVentanilla, Oaxaca.
• Giselle, Claudia et al. Estado Actual de la Población del Caimán Caiman crocodilus chiapasius en la zona del“Castaño” Reserva de la Biosfera La Encrucijada, Costa de Chiapas, México.
• López, Andrés et al. Estado Actual de la Población y dieta alimenticia del Caimán Caiman crocodilus chiapasiusen la zona de Laguna de Chantuto, Reserva la Biosfera La Encrucijada, Costa de Chiapas, México.
• Gordillo, Omar et al. Recuperación del Crocodylus acutus en la Reserva de la Biosfera La Encrucijada, Chiapas.
• Martínez, Ivonne et al. SSS Guardianes de la Selva, Pico de Oro Chiapas.
3. Gulf of Mexico, Tamaulipas, San Luis Potosí, Veracruz and Tabasco States
• Domínguez, Jerónimo et al. Contribución al conocimiento de la distribución del cocodrilo de pantano(Crocodylus moreletii) en el estado de San Luis Potosí.
• Domínguez, Jerónimo et al. Determinación de la densidad poblacional del cocodrilo de río (Crocodylus acutus)en los cuerpos de agua de Ixtapa - Zihuatanejo. Guerrero.
• Domínguez, Jerónimo et al. Desarrollo productivo y operacional en la UMA de cocodrilos paraíso HustecoTanchachin, en el municipio de Auismón, San Luis Potosí.

518
• Domínguez, Jerónimo et al. Estrategias para el desarrollo productivo de cocodrilo de pantano en la Cienega decabezas, municipio de Tamasopo, San Luis Potosí.
• Domínguez, Jerónimo et al. Exploración para la identificación y localización de poblaciones cocodrilanas enlos estados de Querétaro e Hidalgo como nuevos sitios con presencia de los Crocodylia en México.
• Domínguez, Jerónimo et al. Análisis genético de fragmentos polimorficos de las especies de cocodrilianosmexicanos, (Crocodylus acutus, Crocodylus moreletii y Caiman crocodilus fuscus).
Industrias Moreletii, at Villahermosa City, Tabasco State. Is the second biggest farm in Mexico, with more than5000 crocodiles, reproducing and commercializing Crocodylus moreletii.
Reptilario Cipactli, in Puerto Vallarta city, Jalisco State. Houses around 20 crocodiles at the Puerto VallartaUniversity, it’s for exhibition, investigation, conservation and reproduction of Crocodylus acutus.
4. Yucatan Peninsula, including Campeche, Yucatan and Quintana Roo States
• Carballar, Javier et al. Estudio, Manejo y Conservación de las poblaciones de cocodrilos en el Sistema LagunarNichupte, Cancún, Quintana Roo, México.
• Carballar, Javier et al. Monitoreo de cocodrilos de la reserva de la biosfera banco chinchorro.
ª Romero, Miriam et al. Proyecto cocodrilo CETMAR Campeche importancia, justificación, avances y metas.
• Gómez, Yadira. “Hábitos alimentarios de Crocodylus moreletii y Crocodylus acutus en la zona norte de laReserva de la Biosfera Sian Ka’an”
Cocodrilos Maya, in Ciudad del Carmen, Campeche State. Houses around 250 crocodiles, it’s for investigation,reproduction and commerce of Crocodylus moreletii.
Crococun, in Cancún City, Quintana Roo State. Houses around 100 crocodiles, it’s for exhibition, investigation,conservation and reproduction of Crocodylus acutus and Crocodylus moreletii.
CET-MAR Univerisity, in Campeche City, Campeche State. Houses around 250 crocodiles at the CET-MARUniversity, it’s for exhibition, investigation, conservation and reproduction of Crocodylus moreletii.
Commerce, Importations, Exportations and Domestic Market
The sustainable use of wildlife, has establish the way to conserve and protect the environment and the wild populationin the world.
But Mexico has become more an importer than a producer, in crocodilian terms. We’re producing around 8000 to10,000 legal skins per year between all 12 commercial farms including the Caiman species and Crocodylus moreletii;this compared with the 250,000 hides imported every year is a big difference, because none of these imports provideincentives for the protection and conservation of the three species of crocodilians that live in our country.
These hides are transformed and 60 to 75% of the finished products are re-exported, mostly to the United States, withsmaller quantities to Spain, Italy, Japan and southeast Asia (León, pers. comm., DGVS 2002).
Most imported hides come from Venezuela and Colombia, some other come from the United States, Argentina andBrazil in South America, Zimbabwe in Africa and Australia (Table 1, Fig. 1).
Principal tannery cities in Mexico are Leon in Guanajuato State, Juarez City and Chuihuahua City in ChihuahuaState, Guzman City in Sonora, Guadalajara City in Jalisco State, Tapachula City in Chiapas State and in Mexico City.
Most of the goods are cowboy boots, belts, bags, wallets, and smaller products.

519
Table 1. Imports of crocodilian hides into Mexico, 1993-2001.
Species 1993 1994 1995 1996 1997 1998 1999 2000 2001 Total
A. mississippiensis 526 1377 758 795 7615 14,683 16,830 10,056 4385 57,025C. c. crocodilus 10 143 153C. c. chiapasius 13,972 13,972C. c. fuscus 181 899 5650 43,334 24,550 74,374 146,165 260,018 243,334 798,505C. yacare 210 9396 15,450 23,713 3999 600 1500 5444 60,312C. johnstoni 2 40 42C. niloticus 8190 204 4550 19,536 9898 6102 48,480C. moreletii 35 70 50 155C. novaeguineae 1 165 166C. porosus 100 152 20 272
Totals 708 2586 15,958 81,751 56,157 97,819 183,346 281,472 259,285 979,082
Figure 1. Imports of hides into Mexico, by genus, 1993-2001.

520
Some “Gavials” are Tomistoma schlegelii
Franklin D. Ross and Norna R. Ross
Department of Vertebrates, Nationaal Natuurhistorisch Museum,PO Box 9517, 2300 RA Leiden, the Netherlands
Abstract
While examining older anatomical literature about the morphology of the trachea in crocodilians, we discovered anerror in an original text, which caused a considerable amount of confusion. When reexamining the data about thetracheal rings and the rings of the exposed bronchi, and the total number of cartilage rings in the windpipes system,we conclude that the data supports contradictory systematic arrangements.
Introduction
When the anatomist Heinrich Rathke (1866) used the word "Gavialen" in the context that the number of trachealcartilage rings in the gavials is smaller than the number in the genus Crocodylus, it contradicted the correspondingdata in his accompanying table. What Rathke meant to say is that Gavialis schlegelii, now called Tomistoma schlegelii,has fewer tracheal rings than has any species within the genus Crocodylus or the species Gavialis gangeticus. Thereason for Rathke's unfortunate wording is not known. However, because Rathke's (1866) dissections of a taxonomicallydiverse series of the modern Crocodylia were so completely and well reported and illustrated, his works have becomean often cited source.
When Professor C.K. Hoffmann at Leiden University wrote the reptiles section in H.G. Bronn's prestigious "Klassenund Ordnungen des Thier-Reichs" book series, he relied heavily on Rathke for details and conclusions about manyanatomical subjects, including the cartilage rings in the extra-pulmonary windpipes-system commonly known as thetrachea and the two exposed bronchial tubes. Hoffmann's (1890: 1034) assertion that the number of tracheal rings"bei den Gavialen am kleinsten, bei den Crocodilen (ie bei der Gattung Crocodilus) am grossten" is remarkablysimilar to Rathke's (1866: 150) statement that "bei den Gavialen am kleinssten, hingegen bei den Thieren der GattungCrocodilus am grossten" in that both phrases assert that the "Gavialen" (plural of gavial) have fewer cartilage ringsin their tracheas, while normal crocodiles such as Crocodylus have the most.
In comparison with Rathke's fairly rare set of papers (1857 material listed, 1866 windpipes reported), Bronn's editedbook-series containing Hoffmann's (1890) summaries of crocodilian anatomy has become widely circulated. Someauthors like Reese (1915a-b) have attributed Hoffmann's (1890) German paraphrases of Rathke's original German toRathke or to Bronn, without mentioning Hoffmann (see quotation of part of Reese's text, below); and, in this particularcase, if Reese had consulted the original Rathke publication, he would have noticed the table saying that Gavialisgangeticus has more tracheal rings than any of the Crocodylus species.
Later and independently, when Steven F. Perry (1998: 36) said about "the number of cartilaginous rings in thetrachea and extrapulmonary bronchi" that "the number is least in Gavialis, and greatest in Crocodylus (Hoffmann,1890)", Perry and his editors fell into the trap of equating "Gavialen" with Gavialis gangeticus, the only livingGavialis species today. Their compound error not only misrepresented gangeticus; but, it also misrepresented schlegeliibecause, in 1998, the genus Gavialis did not include schlegelii as a species.
Discussion
The German "Gavialen" was a compound group in 1857-1866, when Rathke (in the 1866 table especially) putschlegelii and gangeticus in the same genus; and, it is interesting to note that Reese in 1915 was also using "gavials"to include Gavialis gangeticus and Tomistoma schlegelii together, following a classification system popularized byDitmars and based on feeding habits or "the shape of the head" as Reese (1915a: 1-3) put it. Thus it is even moredifficult to understand Reese. However, Perry in 1998, is very clear wording; and, because it appeared in the "Biologyof the Reptilia" series, edited by Carl Gans, it is both highly respected, and globally circulated. In its final (1998)form, the statement is totally false; because, Rathke's data in the table showed Tomistoma to have the least number of
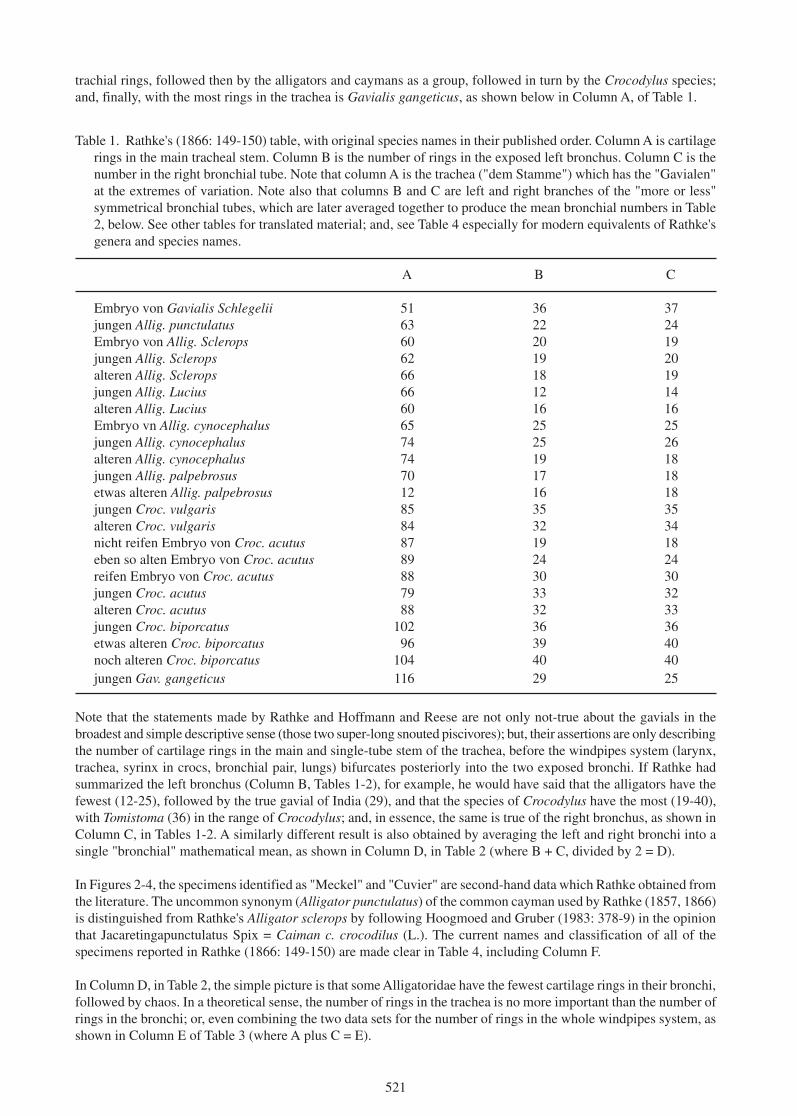
521
trachial rings, followed then by the alligators and caymans as a group, followed in turn by the Crocodylus species;and, finally, with the most rings in the trachea is Gavialis gangeticus, as shown below in Column A, of Table 1.
Table 1. Rathke's (1866: 149-150) table, with original species names in their published order. Column A is cartilagerings in the main tracheal stem. Column B is the number of rings in the exposed left bronchus. Column C is thenumber in the right bronchial tube. Note that column A is the trachea ("dem Stamme") which has the "Gavialen"at the extremes of variation. Note also that columns B and C are left and right branches of the "more or less"symmetrical bronchial tubes, which are later averaged together to produce the mean bronchial numbers in Table2, below. See other tables for translated material; and, see Table 4 especially for modern equivalents of Rathke'sgenera and species names.
A B C
Embryo von Gavialis Schlegelii 51 36 37jungen Allig. punctulatus 63 22 24Embryo von Allig. Sclerops 60 20 19jungen Allig. Sclerops 62 19 20alteren Allig. Sclerops 66 18 19jungen Allig. Lucius 66 12 14alteren Allig. Lucius 60 16 16Embryo vn Allig. cynocephalus 65 25 25jungen Allig. cynocephalus 74 25 26alteren Allig. cynocephalus 74 19 18jungen Allig. palpebrosus 70 17 18etwas alteren Allig. palpebrosus 12 16 18jungen Croc. vulgaris 85 35 35alteren Croc. vulgaris 84 32 34nicht reifen Embryo von Croc. acutus 87 19 18eben so alten Embryo von Croc. acutus 89 24 24reifen Embryo von Croc. acutus 88 30 30jungen Croc. acutus 79 33 32alteren Croc. acutus 88 32 33jungen Croc. biporcatus 102 36 36etwas alteren Croc. biporcatus 96 39 40noch alteren Croc. biporcatus 104 40 40jungen Gav. gangeticus 116 29 25
Note that the statements made by Rathke and Hoffmann and Reese are not only not-true about the gavials in thebroadest and simple descriptive sense (those two super-long snouted piscivores); but, their assertions are only describingthe number of cartilage rings in the main and single-tube stem of the trachea, before the windpipes system (larynx,trachea, syrinx in crocs, bronchial pair, lungs) bifurcates posteriorly into the two exposed bronchi. If Rathke hadsummarized the left bronchus (Column B, Tables 1-2), for example, he would have said that the alligators have thefewest (12-25), followed by the true gavial of India (29), and that the species of Crocodylus have the most (19-40),with Tomistoma (36) in the range of Crocodylus; and, in essence, the same is true of the right bronchus, as shown inColumn C, in Tables 1-2. A similarly different result is also obtained by averaging the left and right bronchi into asingle "bronchial" mathematical mean, as shown in Column D, in Table 2 (where B + C, divided by 2 = D).
In Figures 2-4, the specimens identified as "Meckel" and "Cuvier" are second-hand data which Rathke obtained fromthe literature. The uncommon synonym (Alligator punctulatus) of the common cayman used by Rathke (1857, 1866)is distinguished from Rathke's Alligator sclerops by following Hoogmoed and Gruber (1983: 378-9) in the opinionthat Jacaretingapunctulatus Spix = Caiman c. crocodilus (L.). The current names and classification of all of thespecimens reported in Rathke (1866: 149-150) are made clear in Table 4, including Column F.
In Column D, in Table 2, the simple picture is that some Alligatoridae have the fewest cartilage rings in their bronchi,followed by chaos. In a theoretical sense, the number of rings in the trachea is no more important than the number ofrings in the bronchi; or, even combining the two data sets for the number of rings in the whole windpipes system, asshown in Column E of Table 3 (where A plus C = E).
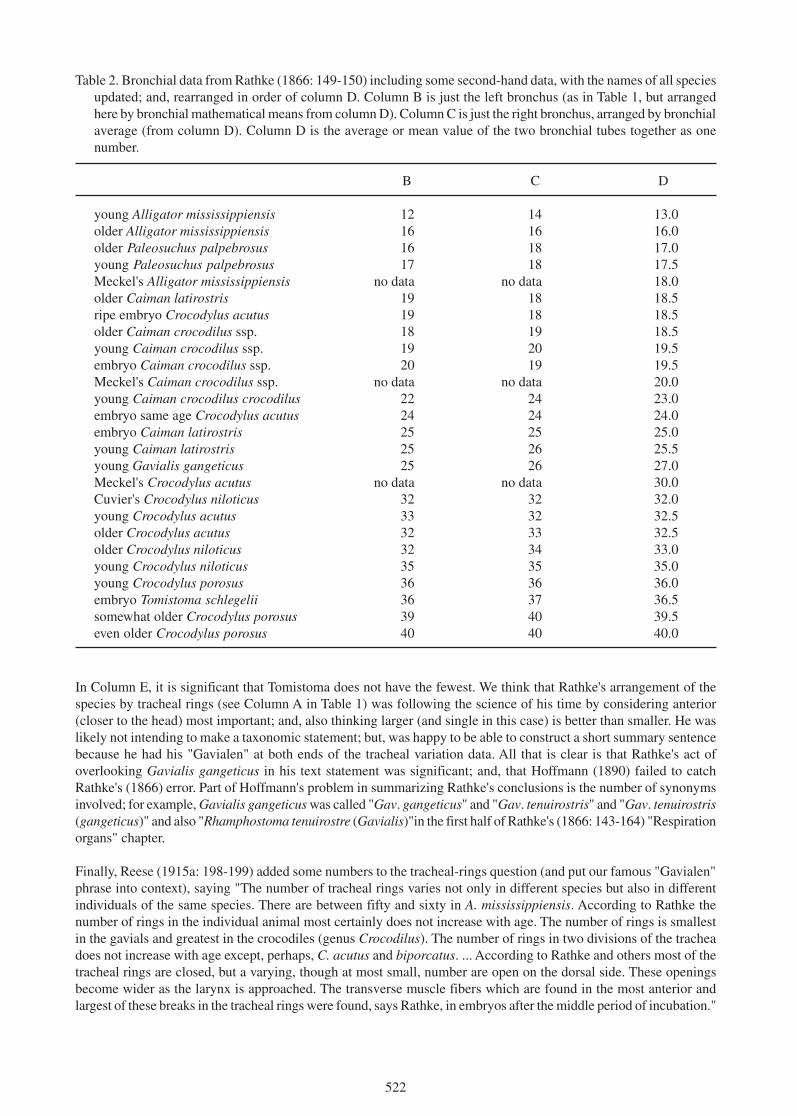
522
In Column E, it is significant that Tomistoma does not have the fewest. We think that Rathke's arrangement of thespecies by tracheal rings (see Column A in Table 1) was following the science of his time by considering anterior(closer to the head) most important; and, also thinking larger (and single in this case) is better than smaller. He waslikely not intending to make a taxonomic statement; but, was happy to be able to construct a short summary sentencebecause he had his "Gavialen" at both ends of the tracheal variation data. All that is clear is that Rathke's act ofoverlooking Gavialis gangeticus in his text statement was significant; and, that Hoffmann (1890) failed to catchRathke's (1866) error. Part of Hoffmann's problem in summarizing Rathke's conclusions is the number of synonymsinvolved; for example, Gavialis gangeticus was called "Gav. gangeticus" and "Gav. tenuirostris" and "Gav. tenuirostris(gangeticus)" and also "Rhamphostoma tenuirostre (Gavialis)"in the first half of Rathke's (1866: 143-164) "Respirationorgans" chapter.
Finally, Reese (1915a: 198-199) added some numbers to the tracheal-rings question (and put our famous "Gavialen"phrase into context), saying "The number of tracheal rings varies not only in different species but also in differentindividuals of the same species. There are between fifty and sixty in A. mississippiensis. According to Rathke thenumber of rings in the individual animal most certainly does not increase with age. The number of rings is smallestin the gavials and greatest in the crocodiles (genus Crocodilus). The number of rings in two divisions of the tracheadoes not increase with age except, perhaps, C. acutus and biporcatus. ... According to Rathke and others most of thetracheal rings are closed, but a varying, though at most small, number are open on the dorsal side. These openingsbecome wider as the larynx is approached. The transverse muscle fibers which are found in the most anterior andlargest of these breaks in the tracheal rings were found, says Rathke, in embryos after the middle period of incubation."
Table 2. Bronchial data from Rathke (1866: 149-150) including some second-hand data, with the names of all speciesupdated; and, rearranged in order of column D. Column B is just the left bronchus (as in Table 1, but arrangedhere by bronchial mathematical means from column D). Column C is just the right bronchus, arranged by bronchialaverage (from column D). Column D is the average or mean value of the two bronchial tubes together as onenumber.
B C D
young Alligator mississippiensis 12 14 13.0older Alligator mississippiensis 16 16 16.0older Paleosuchus palpebrosus 16 18 17.0young Paleosuchus palpebrosus 17 18 17.5Meckel's Alligator mississippiensis no data no data 18.0older Caiman latirostris 19 18 18.5ripe embryo Crocodylus acutus 19 18 18.5older Caiman crocodilus ssp. 18 19 18.5young Caiman crocodilus ssp. 19 20 19.5embryo Caiman crocodilus ssp. 20 19 19.5Meckel's Caiman crocodilus ssp. no data no data 20.0young Caiman crocodilus crocodilus 22 24 23.0embryo same age Crocodylus acutus 24 24 24.0embryo Caiman latirostris 25 25 25.0young Caiman latirostris 25 26 25.5young Gavialis gangeticus 25 26 27.0Meckel's Crocodylus acutus no data no data 30.0Cuvier's Crocodylus niloticus 32 32 32.0young Crocodylus acutus 33 32 32.5older Crocodylus acutus 32 33 32.5older Crocodylus niloticus 32 34 33.0young Crocodylus niloticus 35 35 35.0young Crocodylus porosus 36 36 36.0embryo Tomistoma schlegelii 36 37 36.5somewhat older Crocodylus porosus 39 40 39.5even older Crocodylus porosus 40 40 40.0

523
For Reese's "between fifty and sixty" cartilage rings in the trachea data, we take the middle number of 55 trachealrings, partly because it leaves the FALSE and TRUE "Gavialen" at the extremes of variation, as shown in Column A,in Table 4. This arrangement is so visually attractive that even we are willing to play with the numbers to keep gators(50 is less than 51) from having the fewest cartilage rings in their tracheas, though they apparently do.
Conclusion
The data in Rathke (1866) and in Reese (1915a) about cartilage rings in the trachea is probably meaningless in ataxonomic sense; because, arranging the species and genera by bronchial counts gives different results, as doesarranging the data by the numerical variation in the total exposed windpipes system (tracheal and bronchus numberscombined). All assertions that the gharials or gavials or Gavialis have the fewest tracheal rings are most likely inerror; because, Tomistoma schlegelii has very few, and is at the lower extreme of alligators; while, Gavialis gangeticushas the most, and is beyond the extreme of proper crocodiles.
Literature
Hoffmann, C.K. (1890). "Dr. H.G. Bronn's Klassen und Ordnungen des Thier-Reichs, wissenschaftlich dargestellt inWort und Bild, volume 6, section 3: Reptilien. part 2: Eidechsen und Wasserechsen." = "Sechster Band. IllAbtheilung Reptilien. II Eidechsen und Wasserechsen". C.F. Winter'sche Verlagshandlung, Leipzig, Germany, i-ii & 443-1399, & plates 49-107.
Table 3. Total windpipes-system data from Rathke (1866 incl. lit. cites) arranged in strict numerical order of columnE. Column A and Column C are the same data as in Tables 1-2, though slightly expanded, and rearranged in orderof column E. Column E is the total of the whole windpipes-system (trachea and bronchial-average combined).
A C E
alteren Alligator mississippiemis 60 16.0 76.0jungen Alligator mississippiensis 66 13.0 79.0Embryo von Caiman crocodilus ssp. 60 19.5 79.5jungen Caiman crocodilus ssp. 62 19.5 81.5older Caiman crocodilus ssp. 66 18.5 84.5jungen Caiman crocodilus crocodilus 63 23.0 86.0Embryo von Tomistoma schlegelii 51 36.5 87.5jungen Paleosuchus palpebrosus 70 17.5 87.5etwas alteren Paleo. palpebrosus 72 17.0 89.0Embryo vn Caiman latirostris 65 25.0 90.0alteren Caiman latirostris 74 18.5 92.5Meckel's (70-80) Alligator mississippiensis 75 18.0 93.0Meckel's (70-80) Caiman crocodilus ssp. 75 20.0 95.0jungen Caiman latirostris 74 25.5 99.5nicht reifen Embryo Croc. acutus 87 18.5 105.5jungen Crocodylus acutus 79 32.5 111.5eben so alten Embryo von Croc. acutus 89 24.0 113.0Cuvier's (82) Crocodylus niloticus 82 32.0 114.0alteren Crocodylus niloticus 84 33.0 117.0reifen Embryo von Crocodylus acutus 88 30.0 118.0jungen Crocodylus niloticus 85 35.0 120.0Meckel's (90) Crocodylus acutus 90 30.0 120.0alteren Crocodylus acutus 88 32.5 120.5etwas alteren Crocodylus porosus 96 39.5 135.5jungen Crocodylus porosus 102 36.0 138.0jungen Gavialis gangeticus 116 27.0 143.0noch alteren Crocodylus porosus 104 40.0 144.0

524
Hoogmoed, M.S. and Ulrich Gruber (1983). Spix and Wagler type specimens of reptiles and amphibians in the natualhistory musea in Munich (Germany) and Leiden (The Netherlands). Spixiana (supplement 9) 319-415. Munich,Germany.
Perry, S.F. (1998). Lungs: comparative anatomy, functional morphology, and evolution. Pp. 1-92 in Biology of theReptilia. Volume 19: Morphology G, ed. by C. Gans and A.S. Gaunt.
Rathke, H. (1857) "Untersuchungen über die Aortenwurzeln und die von ihnen ausgehenden Arterien der Saurier."Denkschriften der kaiserlichen Akademie der Wissenschaften (Mathematisch-Naturwissenschaftlich Classe) 13(2): 51-142, including explanation pages for plates pp. 136-142, & plates 1-6. Vienna, Austria.
Rathke (1866). Untersuchungen über die Entwickelung und den Korperbau der Krokodile (= Investigations into thedevelopment and structure of the body of crocodiles). Friedrich Vieweg und Sohn: Braunschweig, Germany, i-viii, & 1-275 pp.; and, plates 1-11.
Reese (1915a). The Alligator and its Allies. G.P. Putnam's Sons: New York. 358 pp. & 28 plates 28.
Reese (1915b). The development of the lungs of the alligator. Smithsonian Miscellaneous Contributions 65 (2): 1-11.Not seen (J.P. Ross, pers. comm.).
Table 4. Just the main-stem tracheal rings: Rathke 1866, and Reese 1915, combined and arranged in numerical order.Column F is subfamily (Tomistominae) or family (gators, crocs, gharial) classification. Column A is here expandedto include Reese’s, Meckel’s and Cuvier’s data; and, here arranged in actual numerical order.
F A
Gavialis Schlegelii = Tomistoma schlegelii Tomistominae 51Reese (50-60) Alligator mississippiensis Alligatoridae 55Alligator Sclerops = Caiman crocodilus ssp. Alligatoridae 60Alligator Lucius = Alligator mississippiensis Alligatoridae 60Alligator Sclerops = Caiman crocodilus ssp. Alligatoridae 62Alligator punctulatus = Caiman c. crocodilus Alligatoridae 63Alligator cynocephalus = Caiman latirostris Alligatoridae 65Alligator Sclerops = Caiman crocodilus ssp. Alligatoridae 66Alligator Lucius = Alligator mississippiensis Alligatoridae 66Alligator palpebrosus = Paleosuchus palpebrosus Alligatoridae 70Alligator palpebrosus = Paleosuchus palpebrosus Alligatoridae 72Alligator cynocephalus = Caiman latirostris Alligatoridae 74Alligator cynocephalus = Caiman latirostris Alligatoridae 74M’s Allig. Sclerops = Caiman crocodilus ssp. Alligatoridae 75M’s Alligator Lucius = Alligator mississippiensis Alligatoridae 75Crocodilus acutus = Crocodylus acutus Crocodylidae 79C’s Crocodilus vulgaris = Crocodylus niloticus Crocodylidae 82Crocodilus vulgaris = Crocodylus niloticus Crocodylidae 84Crocodilus vulgaris = Crocodylus niloticus Crocodylidae 85Crocodilus acutus = Crocodylus acutus Crocodylidae 87Crocodilus acutus = Crocodylus acutus Crocodylidae 88Crocodilus acutus = Crocodylus acutus Crocodylidae 88Crocodilus acutus = Crocodylus acutus Crocodylidae 89M’s Crocodilus acutus = Crocodylus acutus Crocodylidae 90Crocodilus biporcatus = Croc. porosus Crocodylidae 96Crocodilus biporcatus = Crocodylus porosus Crocodylidae 102Crocodilus biporcatus = Crocodylus porosus Crocodylidae 104Gavialis gangeticus = Gavialis gangeticus Gavialidae 116
525
Workshop Reports
Workshop 1: Skin Quality Workshop (Fritz Huchzermeyer)
A list of skin defects was established and discussed. It was agreed that the current secrecy surrounding this issue isentirely counterproductive and it was then decided to produce a document with a description and illustration of allknown defects, with their causes if known, to be presented at the next CSG meeting in 2006. The participantspromised to contribute knowledge and photographic material to this end.
Workshop 2: Human-Crocodile Conflict Workshop (Rich Fergusson)
There are now over 50 CSG members who have expressed interest in this groups’ activities at either the 16th or 17thWorking Meetings. It was agreed that the group needed to keep in close contact to ensure activity between CSGmeetings. To facilitate this a number of regional co-ordinators offered to keep contact with interested people in theirareas and to compile information and updates on HCC. The regional co-ordinators are:
USA Allan Woodward ([email protected])Meso America Miriyam Venegas ([email protected])Australasia Mark Read ([email protected])Africa Rich Fergusson ([email protected])SE Asia Nikhil Whitaker ([email protected]) and
S.M.A. Rashid ([email protected])
The workshop agreed there was urgent need to deliver a number of products. It was agreed that these would be:
• Consolidated guidelines on the prevention and management of HCC that are approved by CSG that may beprovided to government wildlife authorities that have the problem but no solution.
• A database of all attacks by crocodiles on humans and livestock. It was recognised that this maybe difficult toachieve in a globally compatible format but that within regions this should be achievable. There are two aims tothis product - to formalise the capture and reporting of information on HCC incidents and to use this compilationto indicate how countermeasures may be applied.
• A “fact sheet” that combines information from the above two products. It is intended that this is provided to printand broadcast media pre-emptively and when HCC incidents occur, with the aim of minimising the hype thatfrequently appears, at least in the more developed countries.
It was further agreed that the group needed to improve the impact and reach of educational material and efforts. Inthis regard members of the group will react whenever possible to advise on the realities of HCC and its prevention,that “crocodile tourism” would be encouraged provided that this carries a strong message on responsible actions andthat the African Educational Film Foundation would be approached to assist.
Finally it was agreed that more information and research was needed on crocodile populations, the incidence ofHCC, factors increasing the risk of HCC, and countermeasures that can be employed, including harvesting to reducecrocodile populations. It was noted that harvesting alone was unlikely to provide a solution to HCC.
Workshop 3: Major Issues Affecting Sustainability of Crocodilian Trade (Don Ashley)
The results of this workshop are presented within the paper entitled “ Major issues affecting crocodilian sustainabletrade”, pages 341-343 in this volume.

526
Workshop 4: CSG Core Business (Perran Ross)
CSG is at pivotal point in its development with substantial structural and financial strength, a strong record ofachievement and success and good global credibility. Impending leadership change and new and previously unforeseenissues make consideration of Core issues and guidance for the immediate time frame of 2004- to the next WorkingMeeting, strategically important. The 17th Working Meeting provided a unique opportunity for broad member inputto this process.
After discussion at Steering Committee and with core CSG leaders, a draft ‘statement of core business’ was proposedand a process to examine the views and opinions of meeting participants on this important issues was developed.
‘The core business of the CSG is crocodilian conservation’
However, the exact direction, details and structure to achieve this general goal requires elaboration. To accomplishthis, a simple questionnaire was developed and distributed to all participants on the first day of the meeting with therequest that people would respond within 24 hours. Responses were collected, collated and a small team attempted ageneral analysis of the responses received. The questionnaire is attached as Appendix 1.
The questionnaire attempted to identify respondents according to their membership in CSG and knowledge about therelationship of CSG and its parent IUCN-SSC and then explored preferences of respondents regarding general themesand specific actions that CSG should be concerned with in the intermediate time frame of 1-3 years.
The results and analysis are severely limited by some inherent biases and constraints that must be considered beforeaccepting the results as ‘truth’. However, we believe that this exercise did allow a free and open discussion andcontributions by the respondents and should be carefully considered as a general guide to future CSG strategydevelopment. Biases and limitations of the process include the following:
• The questionnaire was ad-hoc and not scientifically designed and therefore represents the biases of its drafters.• The respondents are neither a random sample of CSG members nor were they a fully representative sample.
Respondents were a group of CSG members and non members, present at the meeting and choosing to provideresponses. The result should be interpreted with these evident biases in mind.
• A specific and obvious bias was that a large proportion of meeting participants, and therefore of respondents,was Australian and reflects their national preoccupations and concerns. This bias is clearly evident in some ofthe results.
• The analysis we conducted was informal and hasty, not statistically robust.
For all these reasons the results should be taken as a general indication of opinions from a specific subgroup of CSGinterests and should not be generalized. Rather they should serve as a foundation for further inquiry.
We distributed questionnaires to 230 meeting participants and received 81 responses, a creditable 35% response rate.We divided the responses according to whether the respondents were CSG members or not and whether they indicatedtheir interaction with CSG was positive and useful (Question 2) or otherwise. Five responding CSG members suggestedtheir interaction with CSG was negative. The reasons for this discontent needs to be identified and rectified.
The first question we analyzed was respondents understanding of SSC-IUCN. There was a clear difference in responsebetween members and non- members. Most CSG members claimed to understand IUCN while many non-membersdid not.
The estimation of the value of the association with IUCN also segregated strongly by CSG membership and less soby positive feelings about CSG. As the Chairman of SSC was present in the audience, we are gratified that overall -most members appear to value the association with SSC.
CSG members Non-Members
CSG +ve 27 14CSG neutral or -ve 18 (5 -ve) 17

527
Question 12 asked respondents to choose from a list of possible ‘Core business’ topics. Some very clear positive andnegative responses emerged. Percent of positive (supporting) responses are shown in the following table.
Core Business IS:b. Develop conservation policy (92%)a. Prevent extinction (83%)c. Advising national agencies (77%)h. Advising IUCN (65%)
Core Business is NOT:g. Local activism (16%)j. Political advocacy (35%)
Question 13 inquired about the most important structural elements that CSG needed to address. Again there wereclear majority indications of both preferences and dislikes. The percentage of positive (supportive) responses isindicated against the sub-question of question 13 (see Appendix).
Strong supportb.i Fundraising for Core activity (71%)k. Broader integration of topics (66%)
Weak supportg., h. Changing size (15%)j (ii.) Narrow commercial focus (30%)i. Increasing paid staff (38%)
Interestingly, on the question of number of members, many respondents checked both ‘do not increase’ and ‘do notdecrease’ indicating they think the size of the group is about right.
Question 14 asked respondents to indicate preferences from a list of issues deemed to be important for CSG. Ofinterest is the poor support for some emerging and newly identified threats to crocodilians. However, traditionalCSG interests remain strongly supported.
Most Importante. Sustainable management (88%)f. Habitat loss (80%)g. Critically endangered species (79%)
Least Importantj. Wildlife disease (36%)d. Increased use (38%)h. Pollution (41%)
A sub-question of question 14 gave respondents an opportunity to express a preference for a species they consideredof high priority. The results suggest that a few species have their dedicated proponents, but most respondents have
CSG members Non-MembersCSG +ve CSG -ve Non-Member +ve Non-Member -ve
Question 5Understanding of IUCNYES 24 15 8 5NO 3 3 6 12
Questions 6 & 7Value of IUCN+ve 24 15-17 3 5Neutral 2 1 0-2 2-ve 0 0 0-2 0

528
no species priority.
• No species preference (48)• Tomistoma (5)• C. porosus (5)• Gharial (4)• C. siamensis (3)• A. sinensis, C. mindorensis, (2)• Osteolaemus, Caiman yacare (1)
The final question gave respondents the opportunity to write in their own expressions of priority issues. This sectionis important because it is not constrained by the structure or content of the questionnaire and might more accuratelyreflect respondent interests. Analysis of this question was difficult, but we grouped the 118 responses into broadcategories defined by consensus of the analysis team and indicate the number of similar statements for each group.
• Critically Endangered species (26 responses)Asia, new approaches, active programs, interaction with government
• National Conservation and Management (26 responses)Habitat loss, monitoring, capacity building, CITES compliance. Australian safari hunting, reintroduction programs
• Research (18 responses)Biology, human-croc conflict, skin quality
• Trade and Use (17 responses)Linking use and conservation, monitoring trade, sustainability, farming guidelines, promoting use, OccupationalHealth and Safety regulations in Australia.
• Information Issues (17 responses)Public awareness, encourage young people, exchange with diverse groups
It is unclear why a significant number of respondents suggested that increased public awareness of crocodilian issueswas needed but this item received very low support in question 12.
Finally, question 9 addressed a number of possible structural rearrangements for CSG. A short and useful list emergedof issues that respondents felt CSG should address.
• Reorganize regionally (questionnaire support 46%)• Improve contact to IUCN• Avoid internal politics• Diversify fundraising• Improve networking• Empower members
In conclusion, we feel that this exercise has provided rough but useful indicators of the sentiments of this importantgathering of CSG members and supporters. It has given a large number of people the opportunity to express theirviews. The results, while rough, are intriguing and indicators for additional inquiry. Overall, the results suggest arather conservative perspective by these respondents. They do not support or propose any drastic departures fromcurrent structure or activity. However, there are a number of issues, identified in the tables above that are suggestedfor further examination and action.
Thanks for assistance in data collection, compilation and analysis to Akira Matsuda, Sally Isberg, Col Stephenson,Amanda Rice, Laurel Converse, Vicki Simlesa and Nancy Fitzsimmons. Significant assistance with concept, thequestionnaire and the development of the core business statement was provided by Harry Messel, Grahame Webb,Charlie Manolis and members of the CSG Steering Committee.
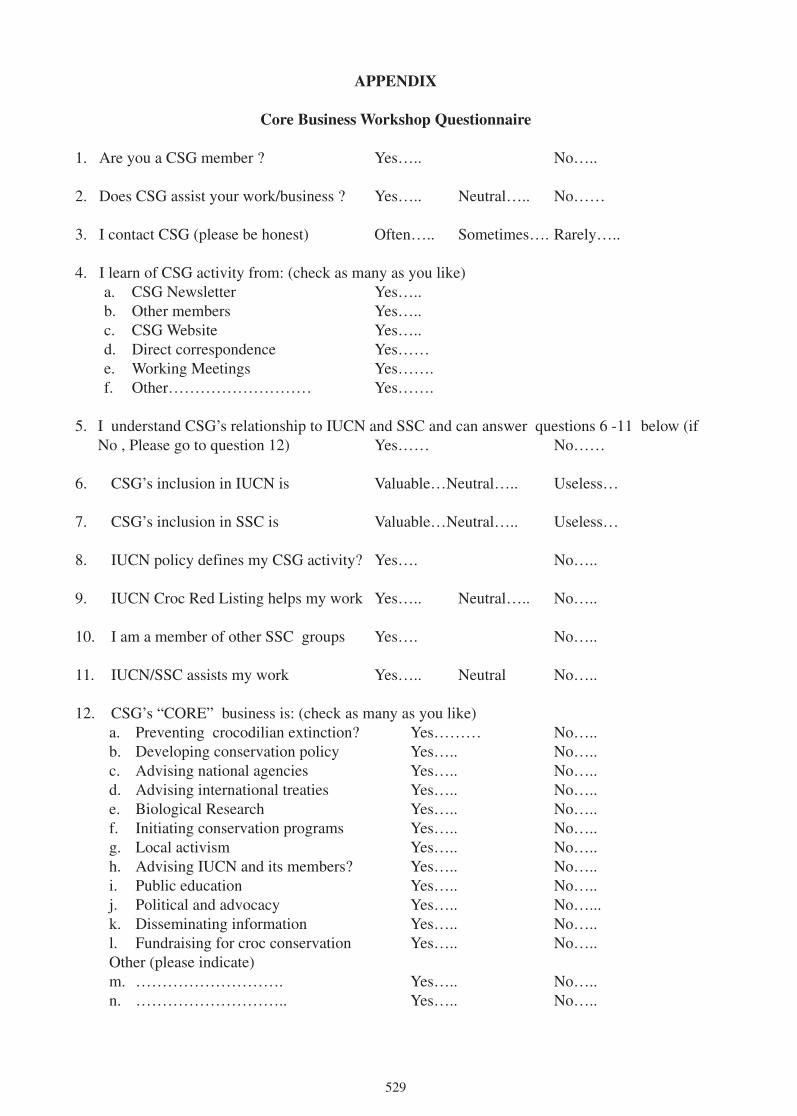
529
APPENDIX
Core Business Workshop Questionnaire
1. Are you a CSG member ? Yes….. No…..
2. Does CSG assist your work/business ? Yes….. Neutral….. No……
3. I contact CSG (please be honest) Often….. Sometimes…. Rarely…..
4. I learn of CSG activity from: (check as many as you like)a. CSG Newsletter Yes…..b. Other members Yes…..c. CSG Website Yes…..d. Direct correspondence Yes……e. Working Meetings Yes…….f. Other……………………… Yes…….
5. I understand CSG’s relationship to IUCN and SSC and can answer questions 6 -11 below (ifNo , Please go to question 12) Yes…… No……
6. CSG’s inclusion in IUCN is Valuable…Neutral….. Useless…
7. CSG’s inclusion in SSC is Valuable…Neutral….. Useless…
8. IUCN policy defines my CSG activity? Yes…. No…..
9. IUCN Croc Red Listing helps my work Yes….. Neutral….. No…..
10. I am a member of other SSC groups Yes…. No…..
11. IUCN/SSC assists my work Yes….. Neutral No…..
12. CSG’s “CORE” business is: (check as many as you like)a. Preventing crocodilian extinction? Yes……… No…..b. Developing conservation policy Yes….. No…..c. Advising national agencies Yes….. No…..d. Advising international treaties Yes….. No…..e. Biological Research Yes….. No…..f. Initiating conservation programs Yes….. No…..g. Local activism Yes….. No…..h. Advising IUCN and its members? Yes….. No…..i. Public education Yes….. No…..j. Political and advocacy Yes….. No…...k. Disseminating information Yes….. No…..l. Fundraising for croc conservation Yes….. No…..Other (please indicate)m. ………………………. Yes….. No…..n. ……………………….. Yes….. No…..
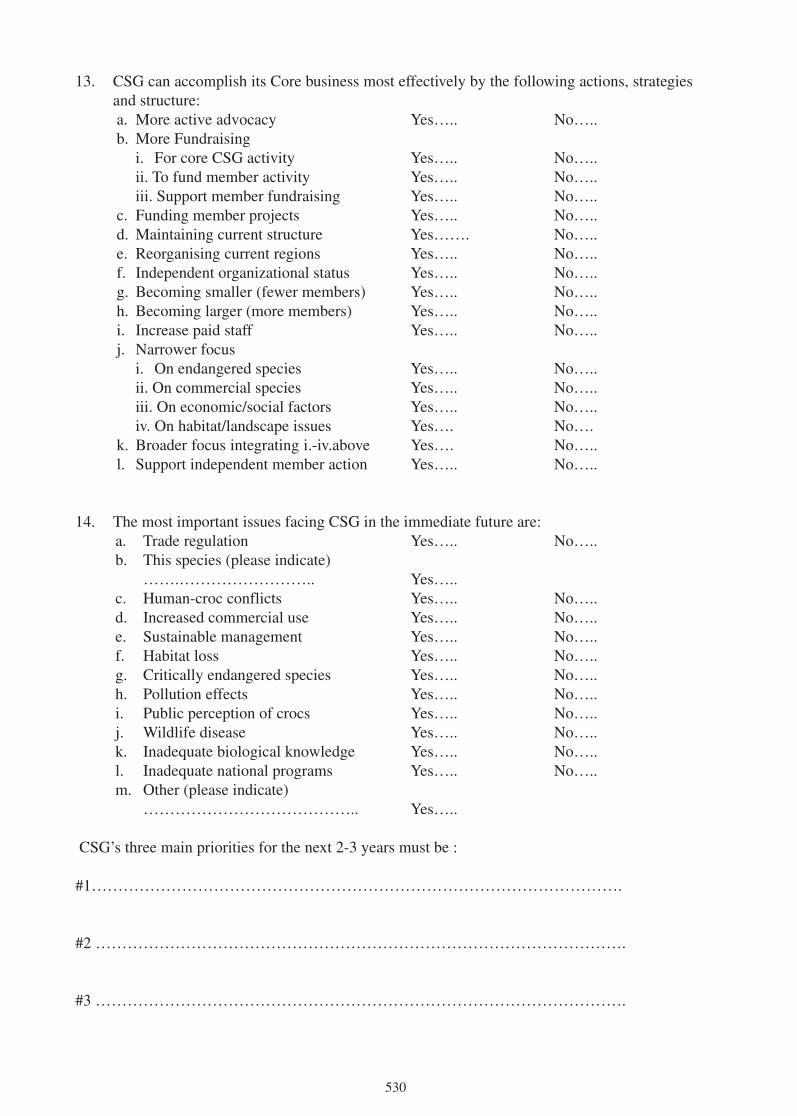
530
13. CSG can accomplish its Core business most effectively by the following actions, strategiesand structure:a. More active advocacy Yes….. No…..b. More Fundraising
i. For core CSG activity Yes….. No…..ii. To fund member activity Yes….. No…..iii. Support member fundraising Yes….. No…..
c. Funding member projects Yes….. No…..d. Maintaining current structure Yes……. No…..e. Reorganising current regions Yes….. No…..f. Independent organizational status Yes….. No…..g. Becoming smaller (fewer members) Yes….. No…..h. Becoming larger (more members) Yes….. No…..i. Increase paid staff Yes….. No…..j. Narrower focus
i. On endangered species Yes….. No…..ii. On commercial species Yes….. No…..iii. On economic/social factors Yes….. No…..iv. On habitat/landscape issues Yes…. No….
k. Broader focus integrating i.-iv.above Yes…. No…..l. Support independent member action Yes….. No…..
14. The most important issues facing CSG in the immediate future are:a. Trade regulation Yes….. No…..b. This species (please indicate)
…….…………………….. Yes…..c. Human-croc conflicts Yes….. No…..d. Increased commercial use Yes….. No…..e. Sustainable management Yes….. No…..f. Habitat loss Yes….. No…..g. Critically endangered species Yes….. No…..h. Pollution effects Yes….. No…..i. Public perception of crocs Yes….. No…..j. Wildlife disease Yes….. No…..k. Inadequate biological knowledge Yes….. No…..l. Inadequate national programs Yes….. No…..m. Other (please indicate)
………………………………….. Yes…..
CSG’s three main priorities for the next 2-3 years must be :
#1……………………………………………………………………………………….
#2 ……………………………………………………………………………………….
#3 ……………………………………………………………………………………….