wetland loss – a closer look at wetland loss research ... · pdf filewetland loss...
TRANSCRIPT
Wetland Loss – A Closer Look at Wetland Loss Research Activities in
Jamaica Bay
Patti Rafferty and Charles RomanNational Park Service
Northeast Region
Wetland Loss in Jamaica Bay• Research: Rate of loss
Sediment Elevation
Biogeochemistry
Sediment Budget
Circulation
• Restoration: Big Egg
Elders Point East
• New Initiatives and Research Needs
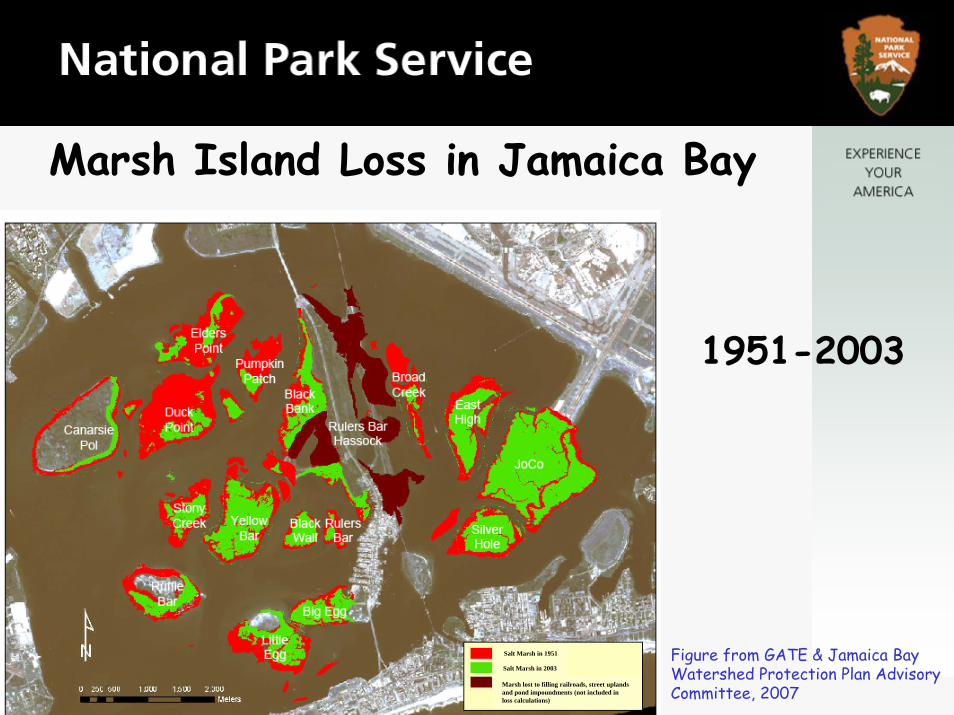
Marsh Island Loss in Jamaica Bay
Figure from GATE & Jamaica Bay Watershed Protection Plan Advisory Committee, 2007
1951-2003
Salt Marsh in 1951
Salt Marsh in 2003
Marsh lost to filling railroads, street uplands and pond impoundments (not included in loss calculations)
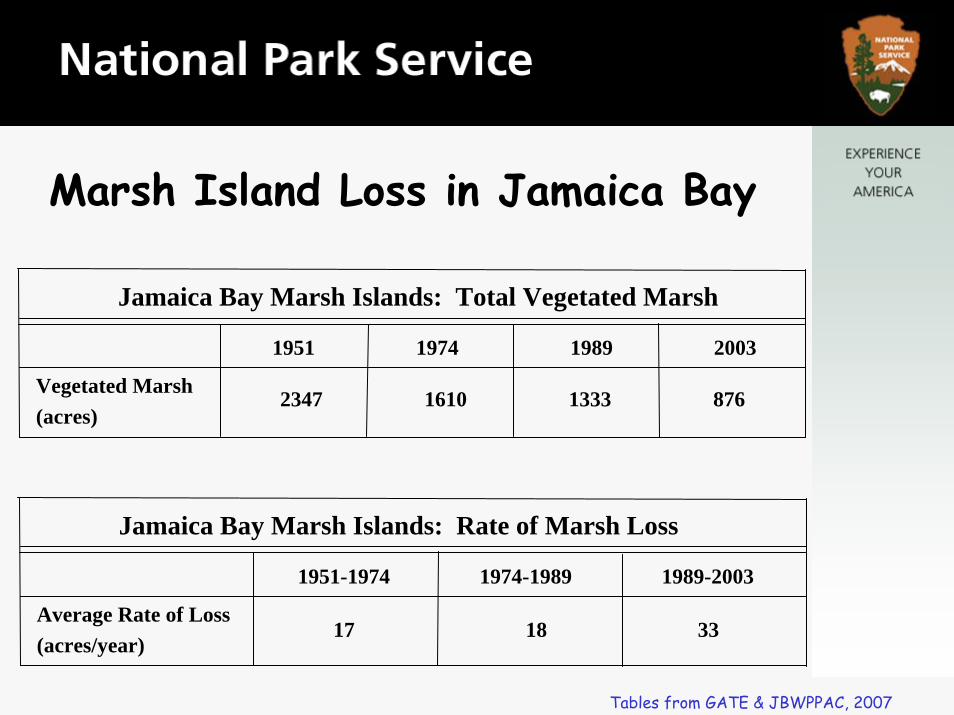
Jamaica Bay Marsh Islands: Total Vegetated Marsh
1951 1974 1989 2003
Vegetated Marsh(acres)
2347 1610 1333 876
Jamaica Bay Marsh Islands: Rate of Marsh Loss
Average Rate of Loss(acres/year)
17 18 33
1951-1974 1974-1989 1989-2003
Marsh Island Loss in Jamaica Bay
Tables from GATE & JBWPPAC, 2007
Marsh Elevation & Accretion
• Evaluate relationship between marsh elevation change and rates of relative sea level rise• Understand the surface and subsurface processes that influence marsh elevation change
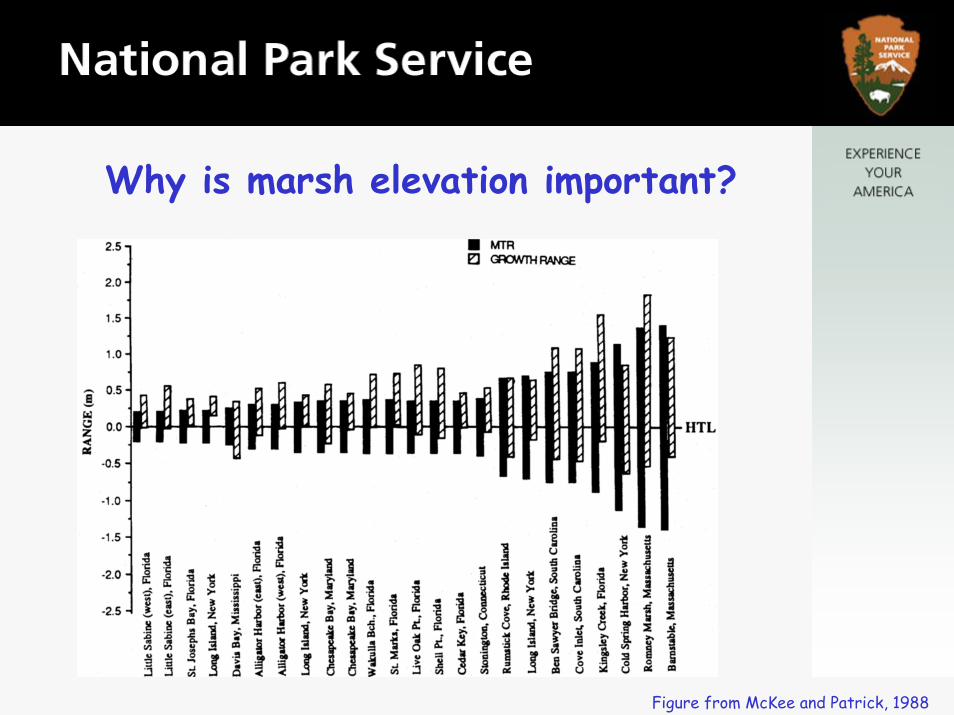
Figure from McKee and Patrick, 1988
Why is marsh elevation important?
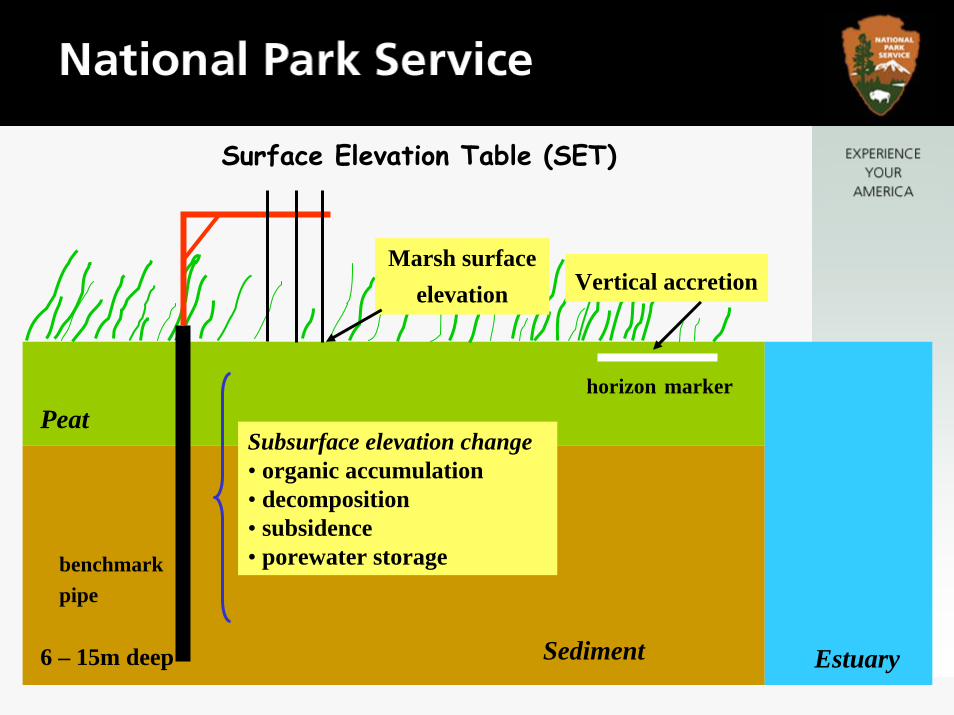
Peat
Sediment Estuary
Vertical accretion
horizon marker
Marsh surfaceelevation
Subsurface elevation change• organic accumulation• decomposition• subsidence• porewater storage
6 – 15m deep
Surface Elevation Table (SET)
benchmarkpipe
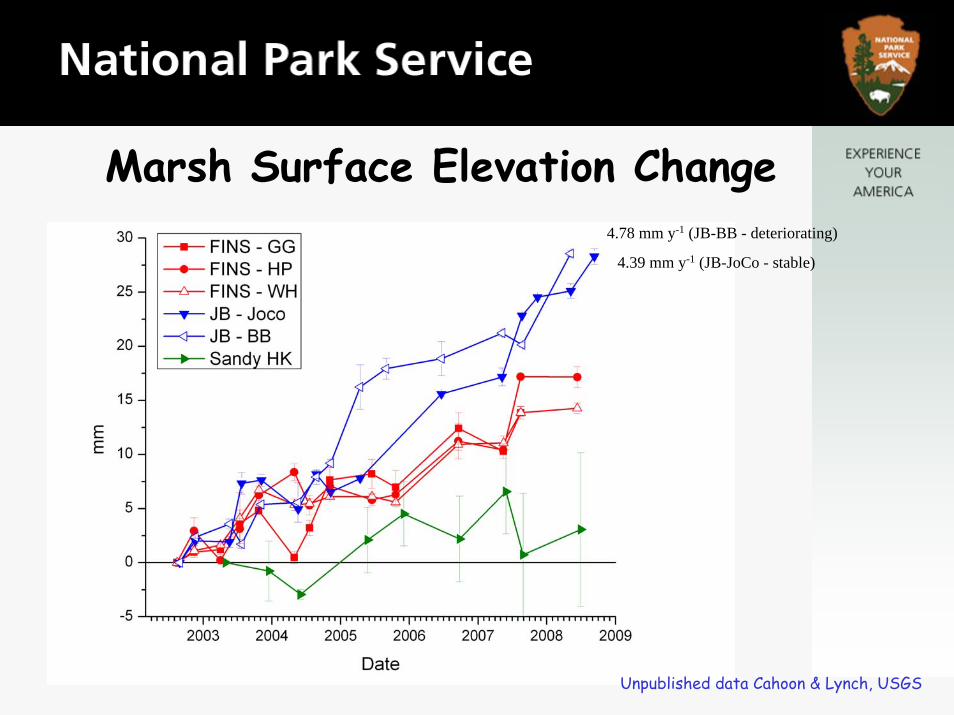
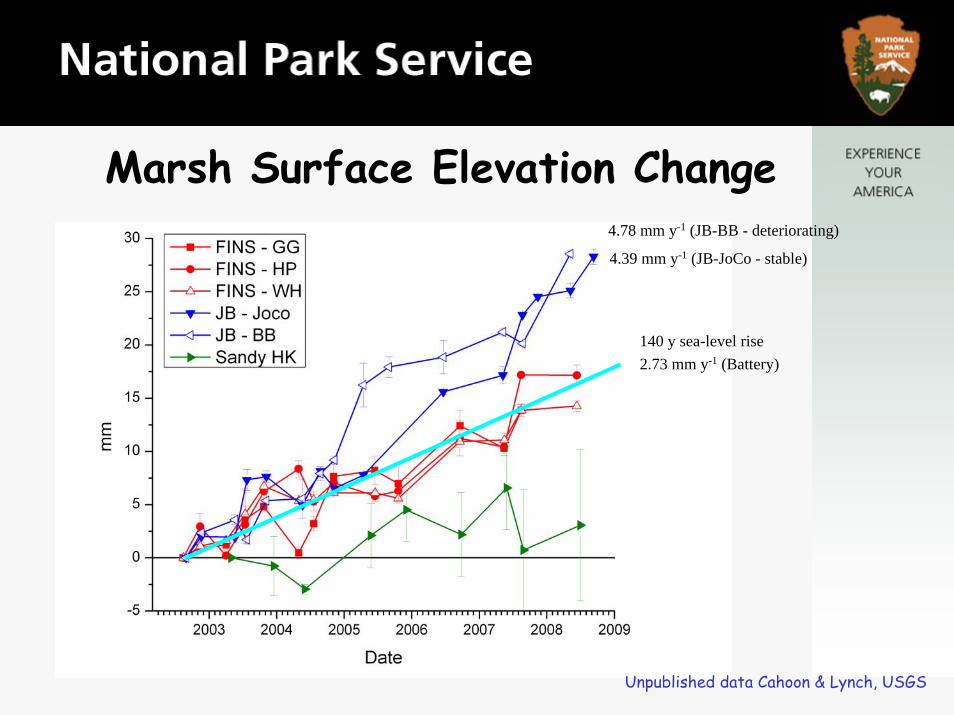
4.78 mm y-1 (JB-BB - deteriorating)
4.39 mm y-1 (JB-JoCo - stable)
Unpublished data Cahoon & Lynch, USGS
Marsh Surface Elevation Change
4.78 mm y-1 (JB-BB - deteriorating)
4.39 mm y-1 (JB-JoCo - stable)
Unpublished data Cahoon & Lynch, USGS
Marsh Surface Elevation Change
140 y sea-level rise 2.73 mm y-1 (Battery)
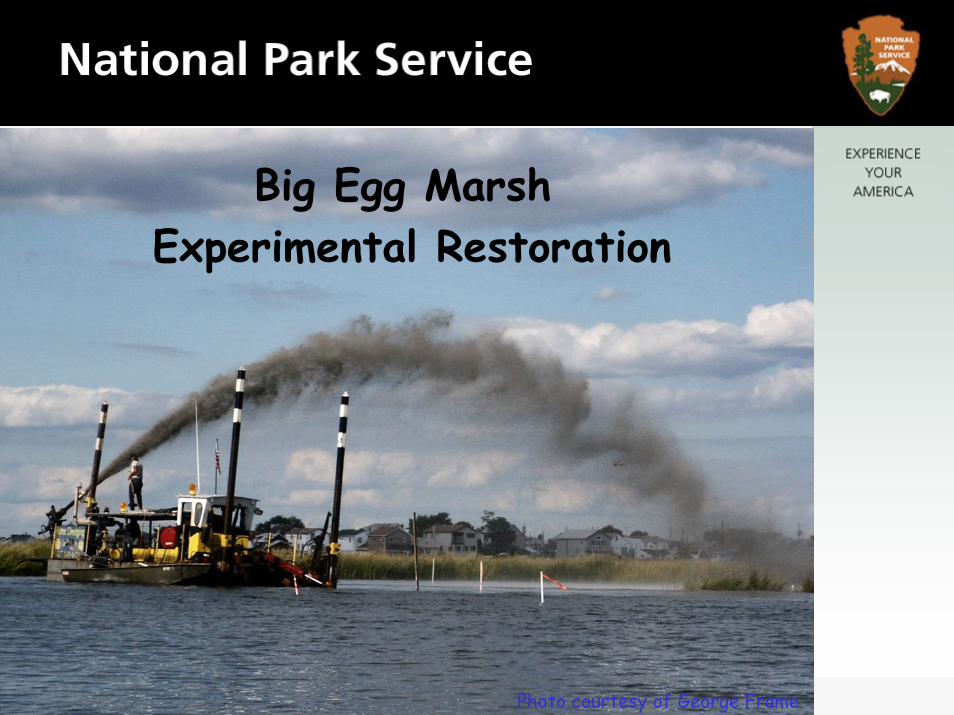
Big Egg Marsh Experimental Restoration
Photo courtesy of George Frame

Big Egg Marsh Restoration
Restored Marsh
Reference Marsh 2007Fall 2003
Fall 2004
Fall 2006

Big Egg Marsh Restoration Monitoring
• Determine factors contributing to the success or failure of the restoration• Evaluate various restoration techniques • Identify problems requiring remedial action (adaptive management)• Better understand factors contributing to salt marsh loss
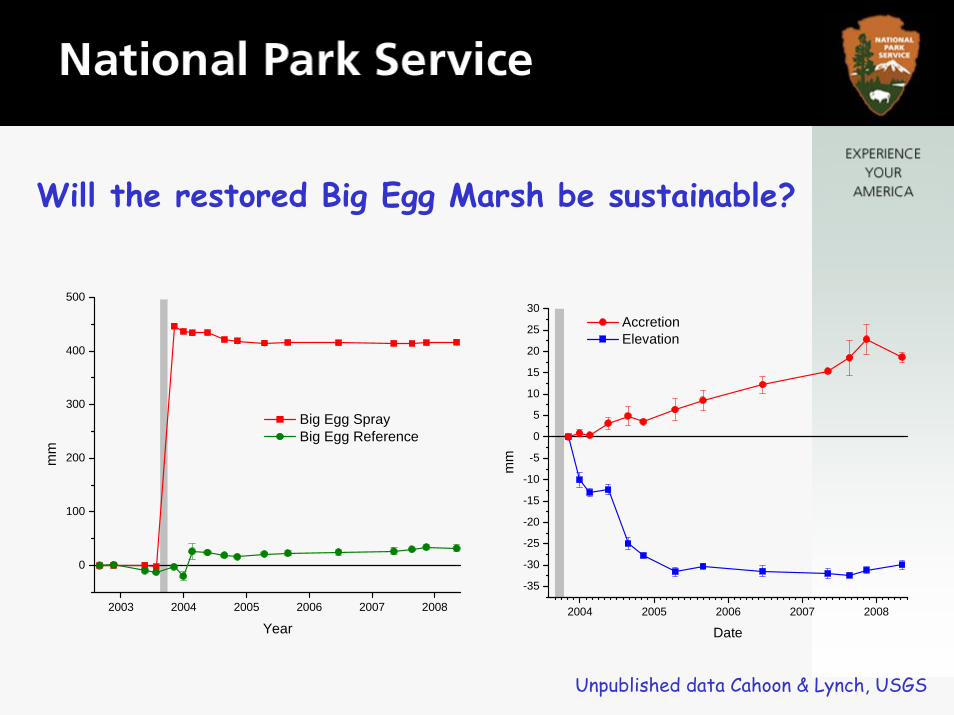
Will the restored Big Egg Marsh be sustainable?
2003 2004 2005 2006 2007 2008
0
100
200
300
400
500
mm
Year
Big Egg Spray Big Egg Reference
Unpublished data Cahoon & Lynch, USGS
2004 2005 2006 2007 2008
-35
-30
-25
-20
-15
-10
-5
0
5
10
15
20
25
30
mm
Date
Accretion Elevation
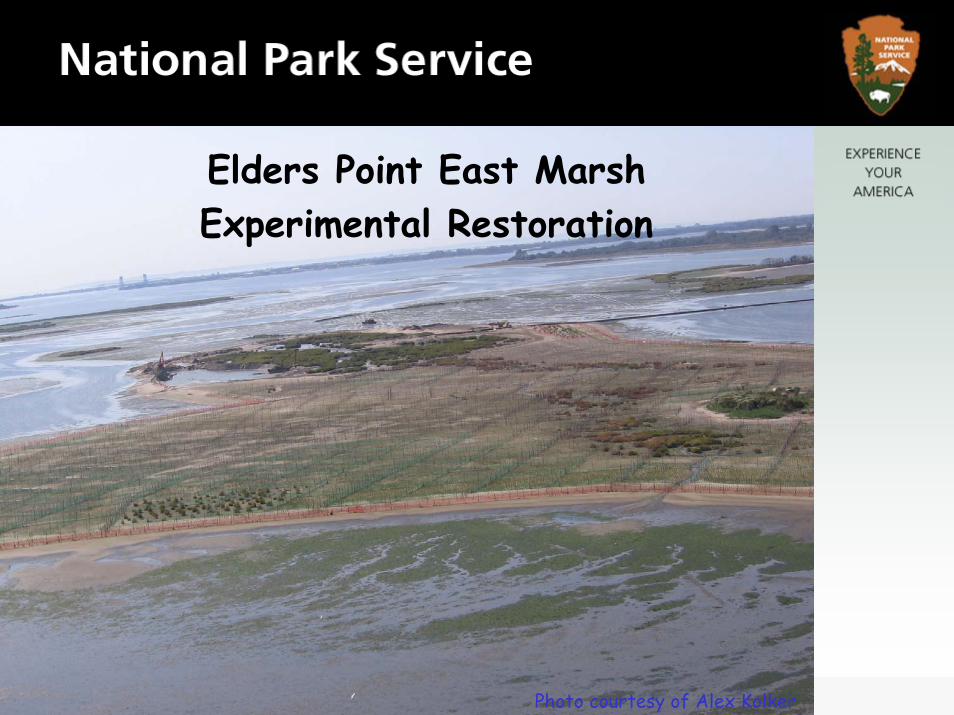
Elders Point East MarshExperimental Restoration
Photo courtesy of Alex Kolker

Elders Point Marsh Restoration
2006
2007
2007
2008

Elders Point East Marsh Restoration Monitoring
• Determine factors contributing to the success or failure of the restoration• Evaluate various planting techniques • Identify problems requiring remedial action (adaptive management)• Better understand factors contributing to salt marsh loss

Figure from Craft et al. 2003
How does restoration monitoring contribute to an understanding of wetland loss?

0
200
400
600
800
1000
1200
Elders East JoCo
200520062007
Biom
ass
(gm
-2)
Sample SiteElders East JoCo
Sample Site and Depth Interval
0
1000
2000
3000
4000
5000
6000
7000
8000
9000
0-15 15-30 0-15 15-30
200520062007
Mean Total Biomass
Unpublished data Rafferty, NPS
Aboveground Belowground
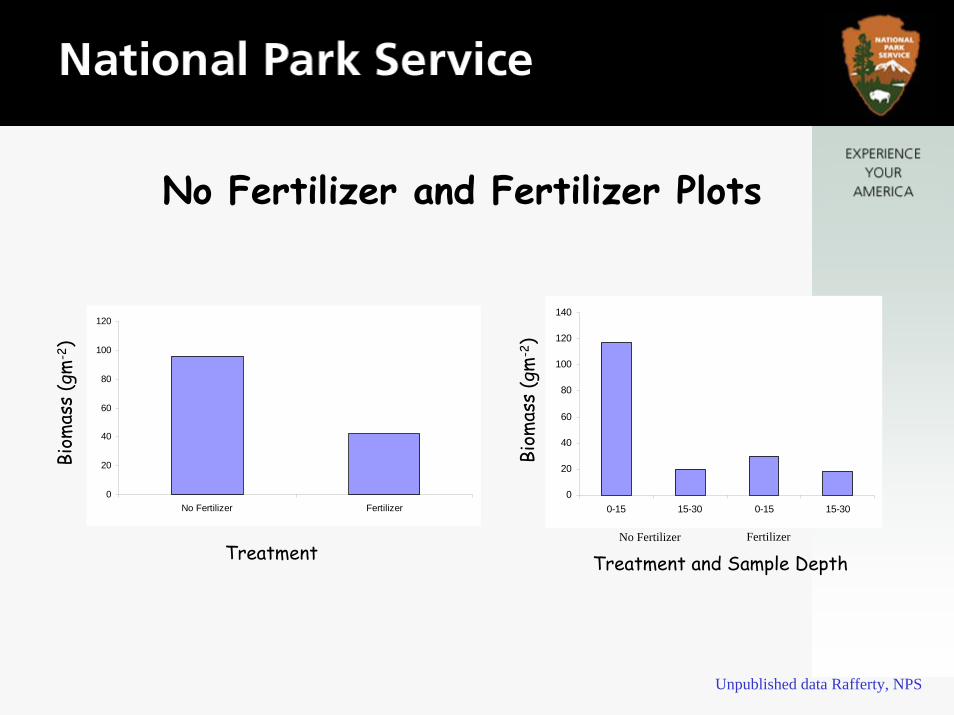
No Fertilizer and Fertilizer Plots
Biom
ass
(gm
-2)
0
20
40
60
80
100
120
No Fertilizer Fertilizer0
20
40
60
80
100
120
140
0-15 15-30 0-15 15-30
Biom
ass
(gm
-2)
No Fertilizer Fertilizer
Treatment and Sample Depth
Unpublished data Rafferty, NPS
Treatment
Biogeochemistry
• Evaluate the role of nutrients and hydrogen sulfide in marsh loss• Characterize the biogeochemistry of Jamaica Bay salt marsh islands• Understand the evolution of biogeochemical processes in a newly restored salt marsh
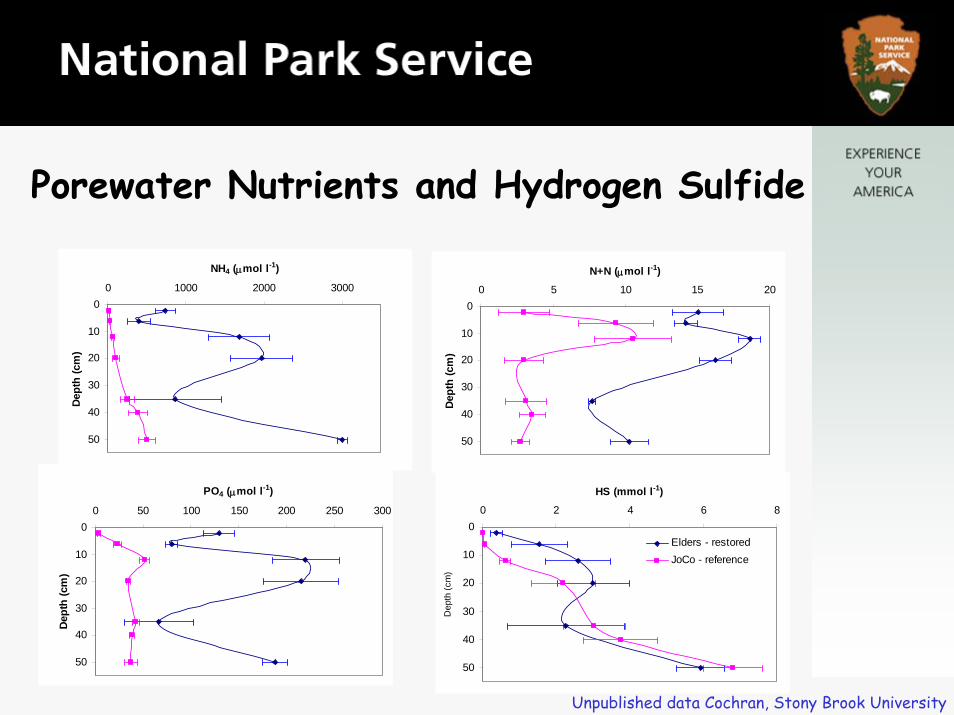
Porewater Nutrients and Hydrogen Sulfide
Unpublished data Cochran, Stony Brook University
0
10
20
30
40
50
0 1000 2000 3000
NH4 (μmol l-1)
Dept
h (c
m)
0
10
20
30
40
50
0 5 10 15 20
N+N (μmol l-1)
Dep
th (c
m)
0
10
20
30
40
50
0 50 100 150 200 250 300
PO4 (μmol l-1)
Dept
h (c
m)
0
10
20
30
40
50
0 2 4 6 8
HS (mmol l-1)
Dep
th (c
m)
Elders - restoredJoCo - reference
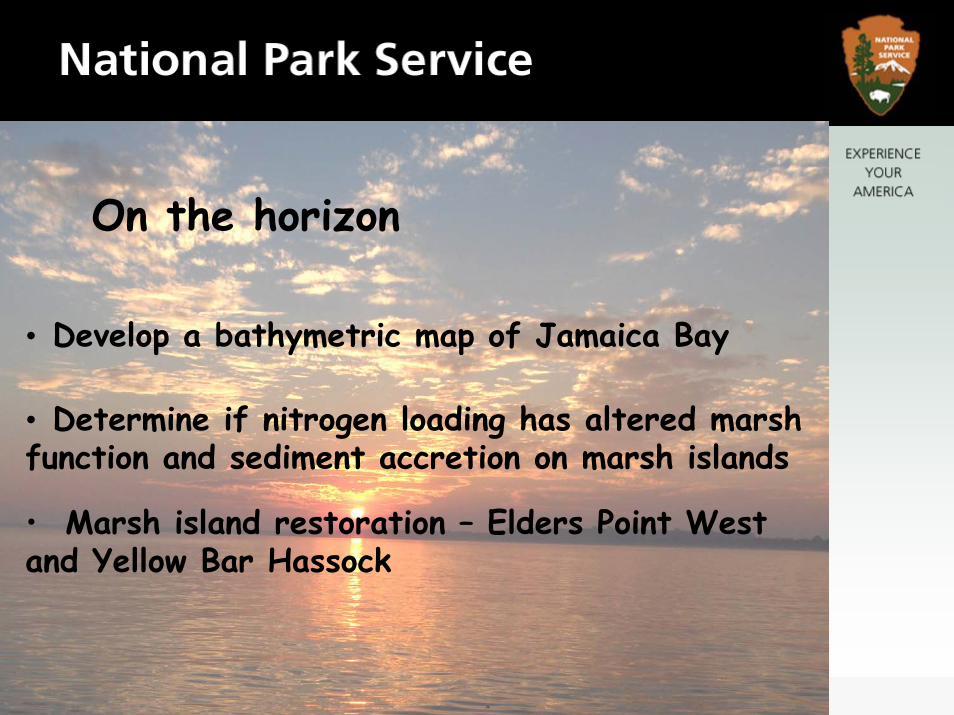
On the horizon
• Develop a bathymetric map of Jamaica Bay
• Determine if nitrogen loading has altered marsh function and sediment accretion on marsh islands
• Marsh island restoration – Elders Point West and Yellow Bar Hassock
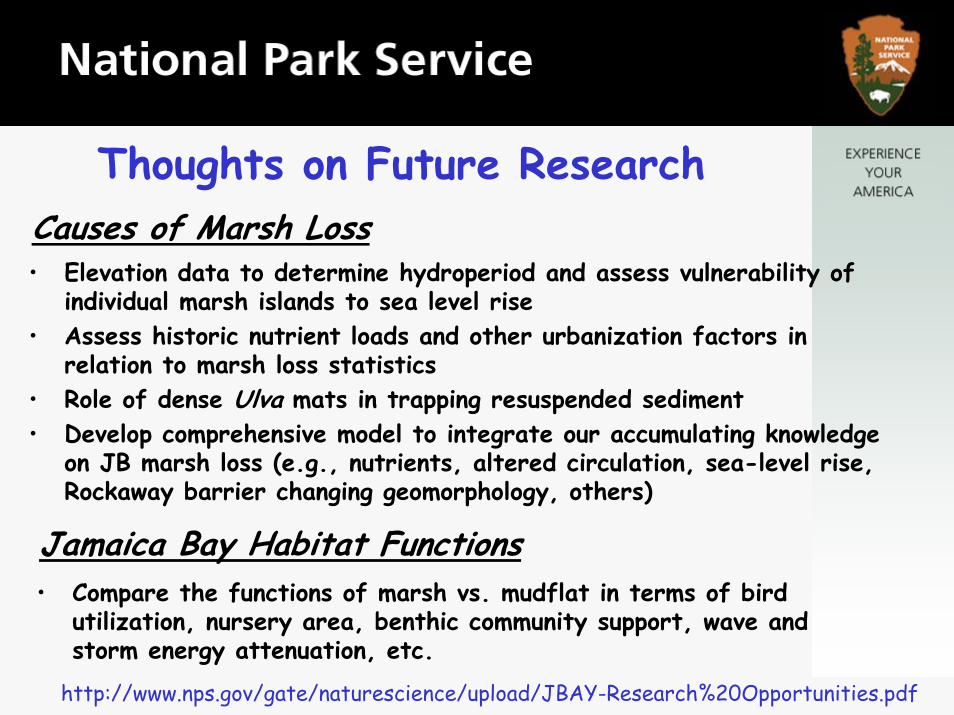
Thoughts on Future Research
• Elevation data to determine hydroperiod and assess vulnerability of individual marsh islands to sea level rise
• Assess historic nutrient loads and other urbanization factors inrelation to marsh loss statistics
• Role of dense Ulva mats in trapping resuspended sediment• Develop comprehensive model to integrate our accumulating knowledge
on JB marsh loss (e.g., nutrients, altered circulation, sea-level rise, Rockaway barrier changing geomorphology, others)
Causes of Marsh Loss
Jamaica Bay Habitat Functions• Compare the functions of marsh vs. mudflat in terms of bird
utilization, nursery area, benthic community support, wave and storm energy attenuation, etc.
http://www.nps.gov/gate/naturescience/upload/JBAY-Research%20Opportunities.pdf