westfield group for personal use only · good progress continues on $4.9bn (group share: $1.3bn) of...
TRANSCRIPT

Westfield Holdings Limited ABN 66 001 671 496
Westfield Management Limited ABN 41 001 670 579 AFS Licence 230329 as responsible entity for Westfield Trust ABN 55 191 750 378 ARSN 090 849 746
Westfield America Management Limited ABN 66 072 780 619 AFS Licence 230324 as responsible entity for Westfield America Trust ABN 27 374 714 905 ARSN 092 058 449
Westfield Group Level 30
85 Castlereagh Street
Sydney NSW 2000
GPO Box 4004
Sydney NSW 2001
Australia
Telephone 02 9358 7000
Facsimile 02 9358 7241
Internet www.westfield.com
26 February 2014 The Manager Company Announcements Office ASX Limited Level 4, Exchange Centre 20 Bridge Street SYDNEY NSW 2000 Dear Sir/Madam WESTFIELD GROUP (ASX:WDC) RESULTS PRESENTATION Please find attached the Results Presentation for the Westfield Group’s full year results for the year ended 31 December 2013. Yours faithfully WESTFIELD GROUP
Simon Tuxen Company Secretary Encl.
For
per
sona
l use
onl
y

WESTFIELD GROUP
2013 FULL YEAR RESULTS
26 February 2014
For
per
sona
l use
onl
y

The financial information included in this release is based on the Westfield Group’s IFRS financial statements. Non IFRS financial information has not been audited or reviewed.
This release contains forward-looking statements, including statements regarding future earnings and distributions. These forward-looking statements are not guarantees or predictions of future performance, and involve known and unknown risks, uncertainties and other factors, many of which are beyond our control, and which may cause actual results to differ materially from those expressed in the statements contained in this release. You should not place undue reliance on these forward-looking statements. These forward-looking statements are based on information available to us as of the date of this presentation. Except as required by law or regulation (including the ASX Listing Rules) we undertake no obligation to update these forward-looking statements.
DISCLAIMER
2013 FULL YEAR RESULTS 2
Note: All currency figures within this presentation are presented in Australian dollars unless otherwise stated
For
per
sona
l use
onl
y

2013 FULL YEAR RESULTS - KEY METRICS
2013 FULL YEAR RESULTS 3
FFO & Distribution12 months to Dec‘13
($m)
% Change
Net Property Income
- adjusted for $7bn of Divestments1
2,000 0%
+8%
Management Income 140 +9%
Project Income 204 +5%
Funds From Operations (FFO) per security 66.5 cents +2.3%
Distribution per security 51.0 cents +3.0%
Portfolio December 13
Assets Under Management $70bn +9%
Return on Contributed Equity 11.8% +40bps
Balance Sheet December 13
Total Assets $37.2bn
Net Debt $12.9bn
Gearing 35.8%
Available Liquidity $4.3bn
Interest Coverage 3.9 times
1 In 2012 and 2013
For
per
sona
l use
onl
y

2013 HIGHLIGHTS
2013 FULL YEAR RESULTS 4
► FFO and Distribution in line with forecast
► Focus on creating & owning world leading retail destinations
► Continued strategic repositioning of the portfolio
� Divestments:− 7 non-core malls in the United States for US$1.64bn − Joint venture interests in Brazil and Karrinyup in Australia
� Joint Ventures:− US$1.28bn joint venture over a portfolio of 6 existing malls in the United States− Croydon in London
� Announced the acquisition of the remaining 50% interest in the Westfield World Trade Center in New York
OPERATING
► High productivity with growth in comparable property NOI and specialty sales across all markets
� Comparable net operating income growth− Australia +2.0%− United States +4.7%− United Kingdom +4.3%
� Comparable specialty retail sales growth− Australia +1.4%− United States +5.7%− United Kingdom +3.2%
► Property management income and project income of $344mFor
per
sona
l use
onl
y

2013 HIGHLIGHTS
2013 FULL YEAR RESULTS 5
DEVELOPMENT
► Australia / New Zealand
� Good progress continues on $4.9bn (Group share: $1.3bn) of current and future projects
� $1.9bn of current projects (Group share: $300m) include Miranda in Sydney and Mt Gravatt in Brisbane
� In early 2014, works commenced on the $670m project at Pacific Fair (Queensland), on behalf of AMP Capital
� Future development pipeline of over $3bn (Group share: $1bn)
► International
� Good progress continues on current and future projects
� Current projects include Westfield World Trade Center (New York), Garden State Plaza (New Jersey) and Montgomery (Maryland)
� In 2014, works already commenced on the £260m project at Bradford (UK), on behalf of Meyer Bergman, and WDC expects to soon commence the US$250m development of The Village at Topanga (Los Angeles)
� Future development pipeline of US$9bn (Group share: US$4bn)
CAPITAL MANAGEMENT
► Bought back 150.3m securities in 2013, with a total of 230.9m WDC securities acquired for $2.43bn, at an average price of $10.53 per security
► $4.0bn of new and renewed bilateral bank facilities and secured mortgages
► Early retirement of US$1.8bn US bonds due to mature in 2014, with no debt maturities until 2015 For
per
sona
l use
onl
y

► In December 2013, WDC announced a restructure proposal to split the Group’s Australia/NZ business from its international business thereby creating two pre-eminent, separate and fully integrated retail property groups
► As part of that proposal:
� WDC’s Australia/NZ business will merge with Westfield Retail Trust (WRT) to form Scentre Group
� WDC’s international business will become Westfield Corporation
► The restructure positions the new entities for better growth:
� WDC’s international business and the Australia/NZ business have grown in scale and quality to the stage where they can now stand on their own
� provides securityholders of both WDC and WRT with better long term return prospects
► Under the proposal:
� WRT securityholders to receive 918 securities of Scentre Group plus $285 per 1,000 WRT securities
� WDC securityholders to receive 1,000 securities of Westfield Corporation and 1,246 securities of Scentre Group per 1,000 WDC securities
► The proposal has the unanimous support of the WDC Board and the independent directors of WRT
► Consistent with the timetable outlined in December 2013, the Explanatory Memorandum is expected to be available in late April 2014 ahead of the securityholders meeting to consider the proposal which is expected to be held in late May 2014
RESTRUCTURE PROPOSAL
2013 FULL YEAR RESULTS 6
For
per
sona
l use
onl
y

► To develop and own world leading retail destinations in major cities by integrating food, fashion, leisure and entertainment using technology to better connect retailers with consumers.
► WDC’s assets are:
� highly productive
� create strong franchise value
� attract the world’s leading retail brands
► Continue to strategically reposition and improve the quality of our portfolio through:
� development
� acquisition opportunities in existing and new markets
� non-core asset disposals
► Actively manage capital position to enhance our return on contributed equity
STRATEGY
2013 FULL YEAR RESULTS 7
For
per
sona
l use
onl
y

OUTLOOK
2013 FULL YEAR RESULTS 8
.
► 2014 Forecast – Prior to Restructure Proposal:
� FFO: 68.6 cents per security, up +3.2%
� Distribution: 52.5 cents per security, up 3%
� Comparable property net operating income growth:
− Australia +2.0% - 2.5%
− United States +4.0% - 5.0%
− United Kingdom +10.0% - 11.0%
► 2014 Proforma Forecast FFO – Restructure Proposal:
� Scentre Group: 21.5 cents per security
� Westfield Corporation: US39.8 cents per security
� The combined FFO forecast for Scentre Group and Westfield Corporation equates to 70.5 cents per equivalent WDC security for 2014 – up 6% on WDC’s FFO per security for 2013
For
per
sona
l use
onl
y

PORTFOLIO SUMMARY
CurrentUnited States Australia
United Kingdom
New Zealand Total
� Centres 38 38 5 9 90
� Retail Outlets 6,747 11,135 1,245 1,409 20,536
� GLA (m sqm) 4.3 3.4 0.6 0.4 8.7
� WDC Interests (bn) US$12.1 $13.4 £3.2 NZ$1.4 $34.0
� JV Partner Interests (bn) US$6.1 $22.6 £2.8 NZ$1.4 $36.0
� Assets Under Management (bn) (AUM) US$18.2 $36.0 £6.0 NZ$2.8 $70.0
� WDC Share of AUM 66% 37% 53% 50% 49%
2013 FULL YEAR RESULTS 9
Gross Lettable Area Assets Under Management WDC Interests
Australia39%
NZ5%
US49%
UK7%
Australia51%
NZ4%
US29%
UK16%
Australia39%NZ
4%
US40%
UK17%
Note: Exchange rates as at of 31 December 2013: AUD/USD:0.8932, AUD/GBP:0.5401, AUD/NZD:1.0869For
per
sona
l use
onl
y

SHOPPING CENTRE OPERATING PERFORMANCE
2013 FULL YEAR RESULTS 10
As at 31 Dec 2013
Portfolio Leased
(%)
Specialty Occupancy
Cost
(%)
Specialty Retail Sales
(MAT)
Specialty Retail Sales
Growth
(%) 3
Lease Deals Completed YTD
(Number/Area)
Average Specialty Store Rent
Comparable NOI Growth
(%) 3
AmountGrowth
YOY (%)
Australia &New Zealand
>99.5 19.2$9,901 psm
NZ$8,542 psm
Aus: 1.4
NZ: 0.4
2,461
298,110 sqm
$1,537 psmNZ$1,128 psm
Aus: 1.8 NZ: 0.4
Aus: 2.0 NZ: 0.3
United States1 94.5 14.6 US$582 psf 5.7806
2,210,440 sqfUS$73.95 psf 3.8 4.72
United Kingdom 99.3 14.04 £825 psf4 3.24172
612,597 sqf£71.40 psf 2.7 4.3
1 Excludes six assets considered non-core valued at US$1.2bn with annual specialty sales of US$324psf2 Total comparable portfolio3 12 months to 31 December 20134 For Westfield London & Stratford City. Occupancy cost includes all storesF
or p
erso
nal u
se o
nly

DEVELOPMENT & CONSTRUCTION ACTIVITY
2013 FULL YEAR RESULTS 11
Total Project
$m
WDC Share
$mYield
Anticipated Completion
United States (US$)
� Garden State Plaza
� Montgomery
� Westfield World Trade Center
160
90
1,425
80
45
1,425
2014
2014
2015
Australia
� Mt Gravatt
� Miranda
400
435
200
109
2014
2014 / 2015
Third Party
• Macquarie (Aus)1
• Pacific Fair (Aus)1
• Bradford (UK £)2
390
670
260
-
-
-
2014
2016
2015
Other Projects 495 375 2014 – 2015
Total 4.7bn 2.4bn 6.5% - 7.5%
► $4.7bn of projects currently under construction (WDC share $2.4bn, of which $0.4bn incurred to date)
1 Design and construction project for AMP Capital2 Development, design and construction project for Meyer Bergman
For
per
sona
l use
onl
y

► The Group is undertaking pre-development activity on $3bn (WDC share: $1bn) of future development opportunities in Australia and New Zealand, including:
► Target unlevered internal rates of return of between 12% to 15% on investment
MAJOR DEVELOPMENT OPPORTUNITIES – AUSTRALIA/NZ
2013 FULL YEAR RESULTS 12
Australia New Zealand
� Carousel (WA)
� Chermside (QLD)
� Knox (VIC)
� Kotara (NSW)
� Marion (SA)
� North Lakes (QLD)
� Plenty Valley (VIC)
� Tea Tree Plaza (SA)
� Tuggerah (NSW)
� Warringah (NSW)
� Whitford City (WA)
� Albany (NZ)
� Newmarket (NZ)
� St Lukes (NZ)
For
per
sona
l use
onl
y

► The Group is undertaking pre-development activity on US$9bn (WDC share: US$4bn) of future development opportunities in the United States, the United Kingdom and in Europe, including:
► Target unlevered internal rates of return of between 12% to 15% on investment
MAJOR DEVELOPMENT OPPORTUNITIES - INTERNATIONAL
2013 FULL YEAR RESULTS 13
United States UK/Europe
� Century City (California)
� UTC (California)
� Valley Fair (California)
� The Village at Topanga (California)
� London (UK)
� Milan (Italy)
� Croydon (UK)
� Stratford City (UK)
For
per
sona
l use
onl
y

FUNDS FROM OPERATIONS
2013 FULL YEAR RESULTS 14
$mDec ’13
ActualDec ’12
% Change% Change Proforma
1
Net Property Income
Management income
Project income
2,000
140
204
- %
9%
5%
8%
Gross Income 2,344 - %
Overheads (208) 7%
EBIT 2,136 1% 9%
Net Interest
Currency derivatives
(508)
29
(15)%
21%
Earnings before tax 1,657 (2)%
Tax
Minority interest2
(102)
(117)
(7)%
-
FFO 1,438 (2)%
Weighted average number of securities 2,162.1 (5)%
FFO per security 66.5 cents 2.3%
1 Adjusted for divestments in 2012 and 2013 2 Comprises Carindale Property Trust: $10m, Property Linked Notes: $84m and convertible preference securities: $23m
For
per
sona
l use
onl
y

SUMMARISED AIFRS INCOME STATEMENT
2013 FULL YEAR RESULTS 15
$m 12 months to Dec ’13 12 months to Dec ’12
Property revenue
Contribution from equity accounted investments (excluding revaluations and capital transactions)
Management income
Project income
1,435
819
140
204
1,595
751
128
194
Total Income 2,598 2,668
Property expenses and outgoings
Overheads
Property revaluations (including equity accounted property revaluations)
Financing costs
Currency derivatives
Interest on other financial liabilities
Mark to market of derivatives, currency gain/(loss), preference shares and Property Linked Notes
Gain/(Loss) on capital transactions (including equity accounted capital transactions)
Financing Gain/(Loss) from capital transactions
(421)
(208)
864
(433)
29
(107)
(288)
14
(141)
(490)
(224)
820
(377)
24
(108)
(309)
(14)
(27)
Profit before tax 1,907 1,963
Tax expense
Deferred tax
Minority interests
(86)
(199)
(19)
(78)
(126)
(41)
Profit after tax 1,603 1,718For
per
sona
l use
onl
y

BALANCE SHEET1
2013 FULL YEAR RESULTS 16
$m 31 Dec ’13 31 Dec ’12
Cash
Property investments
� Shopping centres
� Construction in progress
� Assets held for redevelopment
1,299
32,227
417
1,389
1,271
30,965
292
938
Total Property investments 34,033 32,195
Inventory
Deferred tax assets
Other assets
84
93
1,738
92
108
1,927
Total assets 37,247 35,593
Interest bearing liabilities
� Current
� Non-current
Finance lease liabilities
Deferred tax liabilities
Other liabilities
8
14,160
77
3,464
2,437
483
12,031
68
3,047
2,757
Total liabilities2
20,146 18,386
Net Assets 17,101 17,207
Minority interest3
(1,989) (1,877)
Net Assets attributable to the Westfield Group 15,112 15,330
Number of securities (millions) 2,072.2 2,222.5
1 The net investment in equity accounted entities of $15,484m (31/12/12 $13,362m) has been allocated to individual assets and liabilities2 Excludes $1,760m (31/12/12 $1,656m) of convertible preference securities & Property Linked Notes shown in minority interest given their equity characteristics3 Includes $229m relating to Carindale (31/12/12 $221m)
For
per
sona
l use
onl
y

► Estimated yield for each region:
PROPERTY INVESTMENTS
2013 FULL YEAR RESULTS 17
31 Dec ’13 31 Dec ’12
Weighted Avg Weighted Avg
United States 5.7% 6.1%
Australia 5.9% 5.9%
United Kingdom 5.6% 5.6%
New Zealand 7.3% 7.5%
12 months to Dec ’13
Gross property investments opening balance
Revaluations
Divestments
Acquisitions
Capital expenditure
Exchange rate impact
32.2
0.9
(3.2)
0.2
0.8
3.1
Gross property investments closing balance 34.0
► Change in value of gross property investments ($bn)
For
per
sona
l use
onl
y

FINANCIAL POSITION
2013 FULL YEAR RESULTS 18
► Strong balance sheet and liquidity position:
� 35.8% gearing on a look through basis (as at 31 December 2013)
� $4.3bn available liquidity provided by committed bank facilities and cash
► Debt capital management since January 2013:
� $2.1bn of new and renewed bilateral bank facilities
� US$1.7bn of new and renewed secured mortgages
� US$1.8bn US bonds retired early
► Average term of bonds and mortgages at 5.4 years and bank facilities at 2.8 years
► 68% of interest rate exposure is currently fixed
► Common borrowing structure for all unsecured, unsubordinated lenders who rank pari passu irrespective of the jurisdiction of the borrower
For
per
sona
l use
onl
y

FACILITY MATURITY PROFILE
2013 FULL YEAR RESULTS 19
-
1.7
2.0
2.5
2.3
1.4
0.4
1.1
1.9
0.9
0.5
2.0
0.5 -
0.0
1.0
2.0
3.0
2014 2015 2016 2017 2018 2019 2020 2021 2022 2023
$bn
Bonds Mortgages Bank Undrawn Facilities
Liquidity Summary $bn
Total Committed Financing Facilities
Amounts Drawn
17.2
(14.2)
Undrawn Financing Facilities 3.0
Cash 1.3
Total Liquidity 4.3
For
per
sona
l use
onl
y

APPENDICES
For
per
sona
l use
onl
y
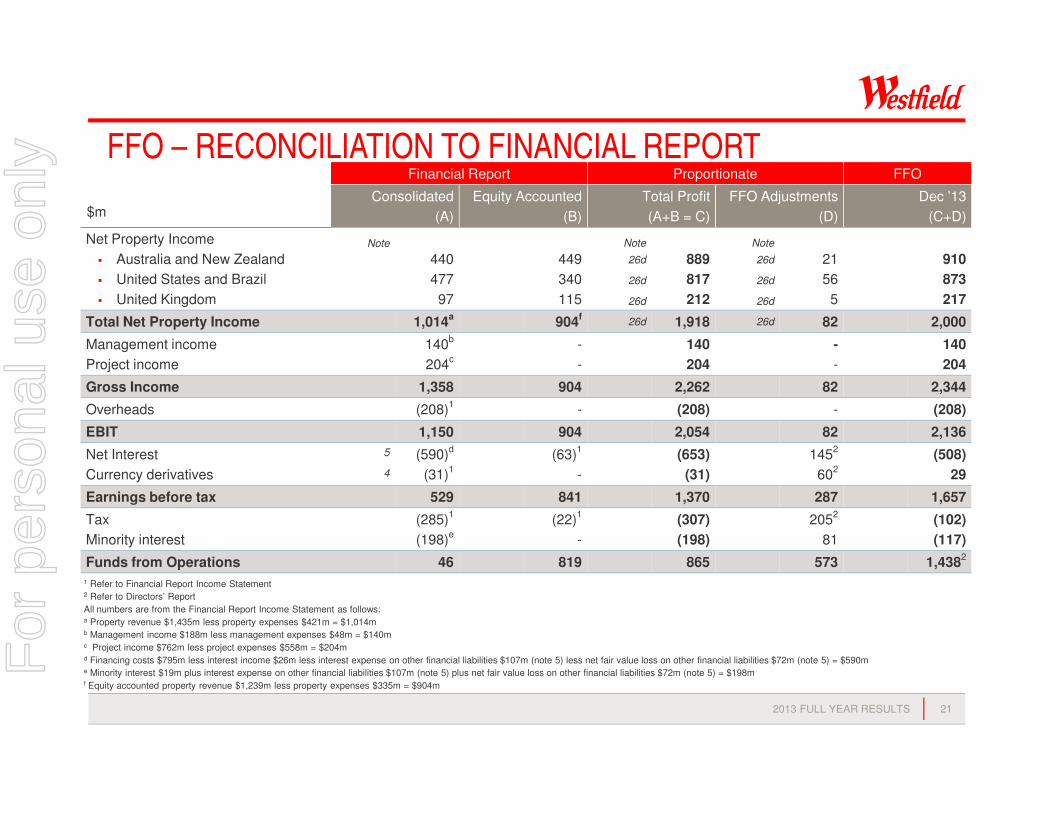
FFO – RECONCILIATION TO FINANCIAL REPORT
2013 FULL YEAR RESULTS 21
$m
Financial Report Proportionate FFO
Consolidated
(A)
Equity Accounted
(B)
Total Profit
(A+B = C)
FFO Adjustments
(D)
Dec ’13
(C+D)
Net Property Income
� Australia and New Zealand
� United States and Brazil
� United Kingdom
Note
440
477
97
449
340
115
Note
26d
26d
26d
889
817
212
Note
26d
26d
26d
21
56
5
910
873
217
Total Net Property Income 1,014a
904f
26d 1,918 26d 82 2,000
Management income
Project income
140b
204c
-
-
140
204
-
-
140
204
Gross Income 1,358 904 2,262 82 2,344
Overheads (208)1
- (208) - (208)
EBIT 1,150 904 2,054 82 2,136
Net Interest
Currency derivatives
5
4
(590)d
(31)1
(63)1
-
(653)
(31)
1452
602
(508)
29
Earnings before tax 529 841 1,370 287 1,657
Tax
Minority interest
(285)1
(198)e
(22)1
-
(307)
(198)
2052
81
(102)
(117)
Funds from Operations 46 819 865 573 1,4382
1 Refer to Financial Report Income Statement2 Refer to Directors’ Report
All numbers are from the Financial Report Income Statement as follows:a Property revenue $1,435m less property expenses $421m = $1,014m b Management income $188m less management expenses $48m = $140m c Project income $762m less project expenses $558m = $204m d Financing costs $795m less interest income $26m less interest expense on other financial liabilities $107m (note 5) less net fair value loss on other financial liabilities $72m (note 5) = $590m e Minority interest $19m plus interest expense on other financial liabilities $107m (note 5) plus net fair value loss on other financial liabilities $72m (note 5) = $198m f Equity accounted property revenue $1,239m less property expenses $335m = $904m
For
per
sona
l use
onl
y

NET PROPERTY INCOME
2013 FULL YEAR RESULTS 22
$m
Dec’13
Local Currency
Dec’12
Local Currency (Actual)
% Change
Proforma1
United States
� Revenue
� Expenses
1,210
(371)
1,361
(423)
Net Property Income (US$) 839 938 5%
Australia
� Revenue
� Expenses
1,055
(242)
1,022
(236)
Net Property Income (A$) 813 786 5%
United Kingdom
� Revenue
� Expenses
195
(61)
204
(71)
Net Property Income (£) 134 133 3%
New Zealand
� Revenue
� Expenses
150
(35)
162
(38)
Net Property Income (NZ$) 115 124 -%
Brazil
� Revenue
� Expenses
17
(4)
38
(8)
Net Property Income (R$) 13 30 n/a
Total Net Property Income (A$) 2,000 2,007
1 Adjusted for $7bn of net divestments in 2012 and 2013
For
per
sona
l use
onl
y

RETURN ON CONTRIBUTED EQUITY
2013 FULL YEAR RESULTS 23
$m
Contributed equity prior to the capital distribution to WRT
Net assets distributed to WRT
20,172
(7,281)
Contributed equity at 31 Dec 2010 for purposes of calculation 12,891
FFO Retained:
2011 – (FFO $1,492m less distribution $1,115m = $377m)
2012 – (FFO 1st half $751m less distribution $558m = $193m)
– (FFO 2nd half $723m less distribution $550m = $173m weighted 10 months = $144m)
2013 – (FFO 1st half $729m less distribution $551m = $178m weighted 4 months)
377
337
59
Equity buyback :
2012
2013 - ($1,662m weighted average for the period to 31 December 2013)
(770)
(670)
Contributed equity 31 December 2013 for purposes of calculation 12,224
FFO – Year ended 31 December 2013 1,438
Return on contributed equity (annualised) 11.8%For
per
sona
l use
onl
y

ASSETS UNDER DEVELOPMENT
2013 FULL YEAR RESULTS 24
Local Currency
At 31 December 2013
Construction in
Progress
Assets Held for
RedevelopmentTotal
United States (US$)
Australia & New Zealand (A$)
United Kingdom / Europe (£)
303
78
-
338
198
439
641
276
439
Total A$ 417 1,389 1,806
For
per
sona
l use
onl
y

BALANCE SHEET - 31 DECEMBER 2013
2013 FULL YEAR RESULTS 25
$m Consolidated Equity Accounted Total
Cash
Property investments
� Shopping centres
� Construction in progress
� Assets held for redevelopment
1,153
15,406
84
972
146
16,821
333
417
1,299
32,227
417
1,389
Total property investments 16,462 17,571 34,033
Net investment in equity accounted entities
Inventory
Deferred tax assets
Other assets
15,484
84
93
1,632
(15,484)
-
-
106
-
84
93
1,738
Total assets 34,908 2,339 37,247
Interest bearing liabilities
� Current
� Non-current
Finance lease liabilities
Deferred tax liabilities
Other liabilities
3
12,272
44
3,358
2,130
5
1,888
33
106
307
8
14,160
77
3,464
2,437
Total liabilities1
17,807 2,339 20,146
Net Assets 17,101 - 17,101
Minority interest2
(1,989) - (1,989)
Net Assets attributable to the Westfield Group 15,112 - 15,112
1 Excludes $1,760m of convertible preference securities & Property Linked Notes shown in minority interest given their equity characteristics2 Includes $229m relating to Carindale
For
per
sona
l use
onl
y

BALANCE SHEET - NTA
2013 FULL YEAR RESULTS 26
NTA at 31 December 2013Book value
$mPer Security
$
NTA reported
Deferred tax
15,112
3,371
7.29
1.63
NTA before deferred tax 18,483 8.92
Income not valued in NTA
12 months to Dec‘13
Income
$m% of FFO
Management income
Project Income
140
204
9.7%
14.2%
Total 344 23.9%For
per
sona
l use
onl
y

► Diversified funding base made up of bonds, syndicated bank facilities, bilateral bank facilities and secured mortgages
FINANCING FACILITIES
2013 FULL YEAR RESULTS 27
Bank Facilities -Undrawn 17%
Bank Facilities -Drawn 18%
Mortgages 18%
GBP Bonds 11%
USD Bonds 36%
Total Bonds 47%
TotalFacilities
$17.2 billion
For
per
sona
l use
onl
y

KEY RATIOS UNDER THE GROUP’S LATEST 144A1
BOND OFFERING
2013 FULL YEAR RESULTS 28
1 October 2012 issue
Bond Covenants 31 Dec’13
Net Debt / Net Assets Not greater than 65% 34.8%
Secured Debt Not greater than 45% 3.6%
Interest Coverage At least 1.5 times 3.9 times
Unencumbered Leverage Not less than 125% 241%
For
per
sona
l use
onl
y

INTEREST RATE HEDGING PROFILE
2013 FULL YEAR RESULTS 29
Outstanding as at Dec
$ interest swap
payable
US$ fixed debt payable
US$ interest swap payable
£ fixed debt payable
£ interest swap
payable
NZ$ interest swap payable
$ interest swap receivable
US$ interest swap receivable
£ interest swap receivable
$mFixed Rate1
%US$m
Fixed Rate2
%US$m
Fixed Rate1
%£m
Fixed Rate2
%£m
Fixed Rate1
%NZ$m
Fixed Rate1
%
$mFixed Rate1
%US$m
Fixed Rate1
%
£m
Fixed Rate1
%
2014 (1,124.0) 4.20% (7,513.5) 5.56% (2,750.0) 1.82% (1,050.0) 4.87% (225.0) 1.82% (250.0) 3.97% 200.0 6.77% 4,214.5 2.74% 125.0 1.12%
2015 (1,044.5) 4.21% (6,641.7) 5.55% - - (1,050.0) 4.87% (225.0) 1.82% (125.0) 4.27% - - 3,464.5 2.79% 250.0 1.18%
2016 (689.5) 3.93% (5,592.6) 5.54% - - (1,050.0) 4.87% (225.0) 1.82% (55.0) 4.22% - - 3,464.5 2.79% 250.0 1.18%
2017 (203.5) 3.47% (5,367.2) 5.52% - - (450.0) 4.18% - - (20.0) 3.70% - - 714.5 3.19% - -
2018 - - (4,258.1) 5.11% - - (450.0) 4.18% - - - - - - 714.5 3.19% - -
2019 - - (2,997.8) 4.45% - - (450.0) 4.18% - - - - - - 714.5 3.19% - -
2020 - - (2,649.2) 4.14% - - (450.0) 4.18% - - - - - - 214.5 2.05% - -
2021 - - (1,646.2) 3.86% - - (450.0) 4.18% - - - - - - 214.5 2.05% - -
2022 - - (659.0) 3.98% - - - - - - - - - - 64.5 2.96% - -
1 Excludes margin2 Includes marginF
or p
erso
nal u
se o
nly

INTEREST RATE OPTIONS & CURRENCY DERIVATIVES
2013 FULL YEAR RESULTS 30
1 Excludes margin
As at Dec
NZ$ Collar - interest payable
$ Collar - interest payable US$ Cap - interest payable
$mStrike Rates
1
%$m
Strike Rates1
%US$m
Strike Rate1
%
2014 (70.0) 4.45% / 5.25% (50.0) 2.53% / 4.00% (27.4) 3.50%
2015 (70.0) 3.39% / 5.25% - - - -
2016 (70.0) 3.39% / 5.25% - - - -
2017 (70.0) 3.39% / 5.25% - - - -
2018 (70.0) 3.39% / 5.25% - - - -
Maturing during period ended Dec
Forward Exchange Contracts
(Sell)
US$m
Contract Rate
Buy
US$m
Contract Rate
2014 (73.4) 0.7869 73.4 0.9139
Maturing during period ended Dec
Cross currency receivable/(payable)
$m US$m £m
2014 (580.1) 250.0 171.0
2015 (906.6) 750.0 -
(1,486.7) 1,000.0 171.0
For
per
sona
l use
onl
y

2013 FULL YEAR RESULTS 31
RETAIL SALES – UNITED STATES
Specialty Retail Sales
Period to 31 December 20131
Moving Annual Turnover (MAT)
Sales psf
(MAT)
Comparable Change
12 months 3 months
Specialties US$5.7bn US$582 5.7% 5.8%
By Category:
Fashion 0.4% 0.0%
Jewellery 5.9% 4.1%
Leisure 19.1% 22.3%
Food retail (0.6)% (1.0)%
General retail 1.6% 1.0%
1 Excludes six assets considered non-core valued at US$1.2bn with annual specialty sales of US$324psf
For
per
sona
l use
onl
y

RETAIL SALES – AUSTRALIA & NEW ZEALAND
2013 FULL YEAR RESULTS 32
Retail Sales
Period to 31 December 2013
Moving Annual Turnover (MAT) MAT Growth
Comparable Change
12 months 3 months
Australia
� Majors
� Mini Majors
� Specialties
2.7 %
(0.7)%
1.4%
1.6%
(0.3)%
3.0%
Total $20.2bn 2.5% 1.7% 2.1%
New Zealand
� Majors
� Mini Majors
� Specialties
(0.4)%
(7.7)%
0.4%
0.4%
(9.5)%
0.6%
Total NZ$2.0bn (0.9)% (0.7)% (0.6)%For
per
sona
l use
onl
y

COMPARABLE CHANGE IN RETAIL SALES BY CATEGORY – AUSTRALIA
2013 FULL YEAR RESULTS 33
Retail Sales
Period to 31 December 2013
12 months 3 months
Majors:
� Department Stores
� Discount Department Stores
� Supermarkets
Cinemas
(0.8)%
(0.5)%
7.5%
(2.5)%
0.1%
(1.3)%
5.1%
(0.1)%
Mini-Majors: (0.7)% (0.3)%
Specialties - Total: 1.4% 3.0%
� Fashion
� Food Catering
� Food Retail
� Footwear
� General Retail
� Homewares
� Jewellery
� Leisure
� Retail Services
0.0%
2.4%
0.4%
1.9%
(0.1)%
(0.6)%
5.5%
1.4%
2.3%
1.9%
1.7%
1.4%
5.9%
1.5%
(2.5)%
7.2%
8.0%
1.8%For
per
sona
l use
onl
y

RETAIL SALES – UNITED KINGDOM
342013 FULL YEAR RESULTS
Retail Sales
Period to 31 December 2013
Moving Annual Turnover (MAT)
12 months 3 months
Westfield London £982m 2.2% 2.1%
Westfield Stratford £973m 4.1% 4.7%
London Region £1,955m 3.1% 3.4%
For
per
sona
l use
onl
y

► Income Statement – average exchange rates for the 12 months to:
► Balance Sheet – exchange rates as at:
EXCHANGE RATES
2013 FULL YEAR RESULTS 35
31 Dec 2013 31 Dec 2012 % Change
AUD/USD 0.9678 1.0359 (6.6)%
AUD/GBP 0.6192 0.6537 (5.3)%
AUD/NZD 1.1795 1.2787 (7.8)%
AUD/BRL 2.0815 2.0220 2.9%
31 Dec 2013 31 Dec 2012 % Change
AUD/USD 0.8932 1.0370 (13.9)%
AUD/GBP 0.5401 0.6416 (15.8)%
AUD/NZD 1.0869 1.2613 (13.8)%
AUD/BRL 2.1099 2.1240 (0.7)%For
per
sona
l use
onl
y