western canadian resource plays
TRANSCRIPT


November 3, 2016
Western Canadian Resource Plays: Play-based Type Curve EURs for Resource Plays Mark Lenko, M.Ec., P.Eng.,
Managing Director (Interim) and Engineering Director

Disclaimer
Disclaimers The information contained herein has been prepared solely for information purposes and is not intended to be used for trading or investment purposes or as an offer to sell or the solicitation of an offer to buy any security or financial product. The information has been compiled by Canadian Discovery from internal sources as well as prepared from various public and industry sources that we believe are reliable, but no representation or warranty, expressed or implied is made by Canadian Discovery, its affiliates or any other person as to the accuracy or completeness of the information. Such information is provided with the expectation that it will be read as part of a mosaic of analyses and should not be relied upon on a stand-alone basis. Past performance should not be taken as an indication or guarantee of future performance, and Canadian Discovery makes no representation of warranty regarding future performance. The opinions expressed in this report (presentation) reflect the judgment of Canadian Discovery as of the date of this report and are subject to change without notice. This report (presentation) is not an offer to sell or a solicitation of an offer to buy any securities. To the full extent provided by law, neither Canadian Discovery nor any of its affiliates, nor any other person accepts any liability whatsoever for a direct or consequential loss arising from any use of this report (presentation) or the information contained herein. As in all aspects of oil and gas evaluation, there are uncertainties in the interpretation of engineering, reservoir and geological data: therefore, the recipient should rely solely on its own independent investigation, evaluation, and judgment with respect to the information contained herein and any additional information provided by Canadian Discovery or its representatives. All trademarks, service marks, and trade names not owned by Canadian Discovery are the property of their respective owners. Forward-Looking Statements This presentation may contain certain forward-looking information as defined in applicable securities laws (referred to herein as “forward-looking statements”). Forward-looking statements involve known and unknown risks, uncertainties and other factors which are beyond Canadian Discovery’s ability to predict or control and may cause Canadian Discovery’s actual results, performance or achievements to be materially different from any of its future results, performance or achievements expressed or implied by forward-looking statements. Accordingly, readers should not place undue reliance on forward-looking statements. The forward-looking statements contained herein are made as of the date hereof, or such other date or dates specified in such statements. Canadian Discovery undertakes no obligation to update publicly or otherwise revise any forward-looking statements contained herein whether as a result of new information or future events or otherwise, except as may be required by law. If the Company does update one or more forward-looking statements, no inference should be drawn that it will make additional updates with respect to those or other forward-looking statements.

EURs Across the Basin
• EURs for almost 360,000 wells in the WCSB
• Covering all resource plays and conventional pools
• EURs can be used to benchmark operations and competitors

EUR Methodology for Horizontal and Vertical Wells

Horizontal Wells
• Uses probabilistic method to generate type curves
• Performed on horizontal wells drilled in unconventional reservoirs
• Wells grouped according to similar geology
• Type curves created for each group
• Addresses uncertainty in decline characteristics
Vertical Wells
• Uses exponential or hyperbolic decline best fit
• Assumes that wells reach boundary dominated flow in the near term
• Performed on vertical and deviated wells
• Performed on each individual well
EUR Calculation Methodology Horizontal vs Vertical Wells

EUR Calculation Methodology Why Use Probabilistic Type Curves?
• Wells drilled in unconventional reservoirs have different decline characteristics than conventional reservoirs Early time flow has a super harmonic decline HMSF wells take a long time to reach boundary dominated flow
(i.e. exponential decline) The time to boundary dominated flow varies depending on the resource play PTC methodology effectively determines the unique decline parameters for wells
early in production
0
500
1,000
1,500
2,000
2,500
3,000
3,500
4,000
0 1,000 2,000 3,000 4,000 5,000
Rate
Time
Exponential, b=0 EUR50yrs = 13,750
Super harmonic, b=2 EUR50yrs = 23,000
Where should this point be?
Boundary Dominated Flow = Exponential
Well
Transient Flow = Super harmonic
Time to get to boundary = ?

EUR Calculation Methodology Horizontal Wells: Identifying Typeable Wells
• Type curves are generated on a play level • To be included in the well group used to generate type curves,
wells must yield the following: Produce the same primary fluid as the play Have at least 6 months of production
• For certain plays, the well groups are further delineated by the completion:
1. Open hole 2. Multi-stage fractured
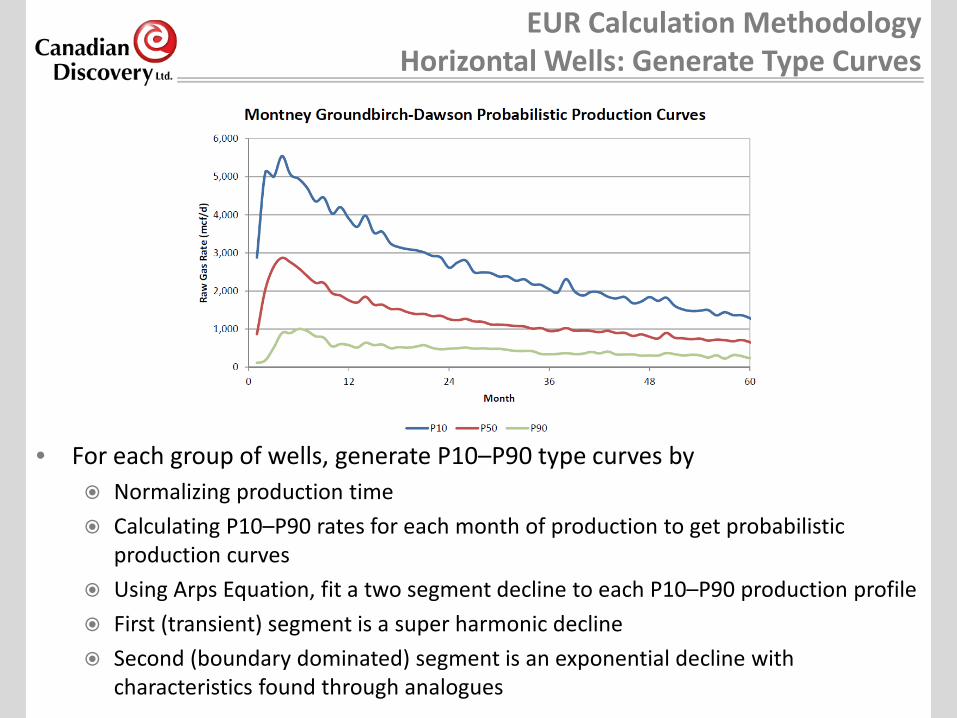
EUR Calculation Methodology Horizontal Wells: Generate Type Curves
• For each group of wells, generate P10–P90 type curves by Normalizing production time Calculating P10–P90 rates for each month of production to get probabilistic
production curves Using Arps Equation, fit a two segment decline to each P10–P90 production profile First (transient) segment is a super harmonic decline Second (boundary dominated) segment is an exponential decline with
characteristics found through analogues

EUR Calculation Methodology Horizontal Wells: Individual Well EUR
• Each individual well is matched to a type curve by Calculating the average rate over the most recent 6 months of production Matching this rate to the current normalized production month Finding the type curve that most closely matches the rate at the current month
• EUR is calculated as a sum of the cumulative production and the forecasted future production

EUR Calculation Methodology Horizontal Wells: By-Product Yields
• By-products for each well are calculated as a ratio to the primary product
• Oil wells Calculate GOR from cumulative production Shallow/Deep cut applied to gas
• Gas wells Free liquids estimated from public information Deep-cut yields obtained from CDL’s GLLO study
• By-product yield applied to the primary product • Cumulative production, primary and secondary products are summed
to obtain the EUR for each well

EUR Calculation Methodology Vertical Wells: Curve Fit
• Procedure to select exponential vs hyperbolic decline, best statistical fit: Fit an exponential decline through the last 10 years of primary
fluid production Find the r2 value of this curve Using the initial rate and decline rate from the exponential equation,
fit a hyperbolic curve to the data Find the r2 value of this curve Use the curve with the highest r2 for EUR calculations
1,000
10,000
0 1000 2000 3000 4000
Ln (R
ate)
Time
Exponential
Hyperbolic
r2 = 0.55
r2 = 0.59
Pick exponential for EUR calculation

EUR Calculation Methodology Vertical Wells: Forecasting
• Forecasting to calculate EUR Forecast best fit curve to
1. Abandonment Rate (Gas = 5mcf/d) 2. 50 years total production (Oil = 1 bbl/d)
Calculate EUR as cumulative production at the lower of abandonment rate or 50 years production
This will ensure hyperbolic curves do not produce for an unreasonable amount of time
• EUR in mboe calculated from wellhead production data
0500
1,0001,5002,0002,5003,0003,5004,0004,5005,000
0 5000 10000 15000 20000 25000
Rate
Time
Abandonment Rate
50 years production
EUR Calculation Methodology Summary
• Broadest available dataset of EURs for all resource and conventional plays
• Well EURs updated as new production data become available (monthly)
• Detailed and consistent methodology applied to all plays for all wells
• High-quality data allow users to focus effort on evaluations and decisions NOT on data collection and aggregation

Selected Resource Plays
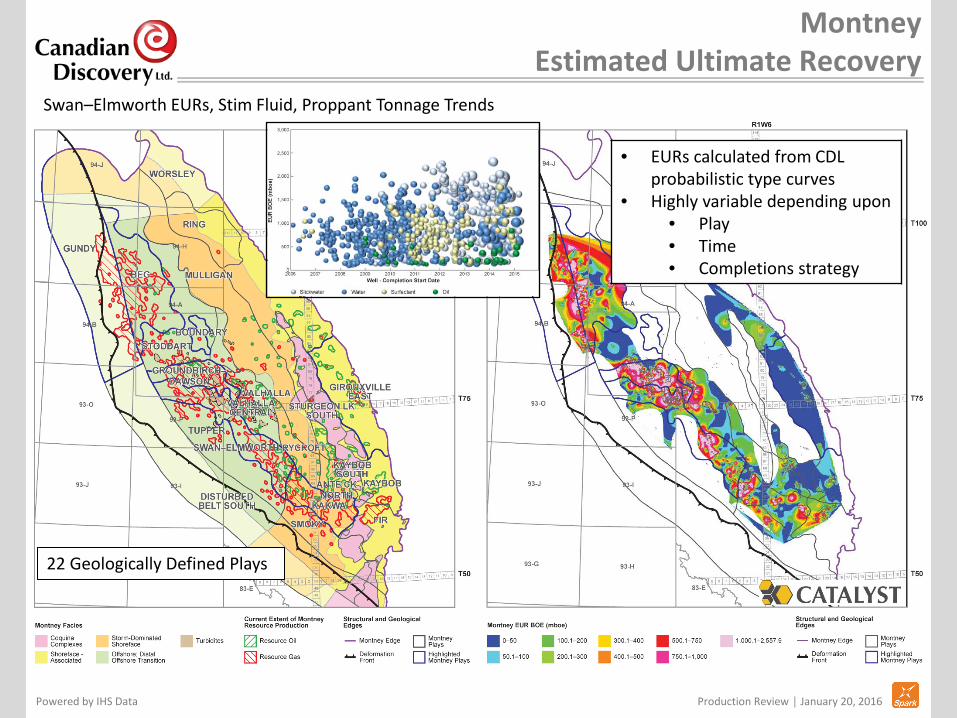
Montney Estimated Ultimate Recovery
Powered by IHS Data
22 Geologically Defined Plays
• EURs calculated from CDL probabilistic type curves
• Highly variable depending upon • Play • Time • Completions strategy
Production Review │ January 20, 2016
Swan–Elmworth EURs, Stim Fluid, Proppant Tonnage Trends
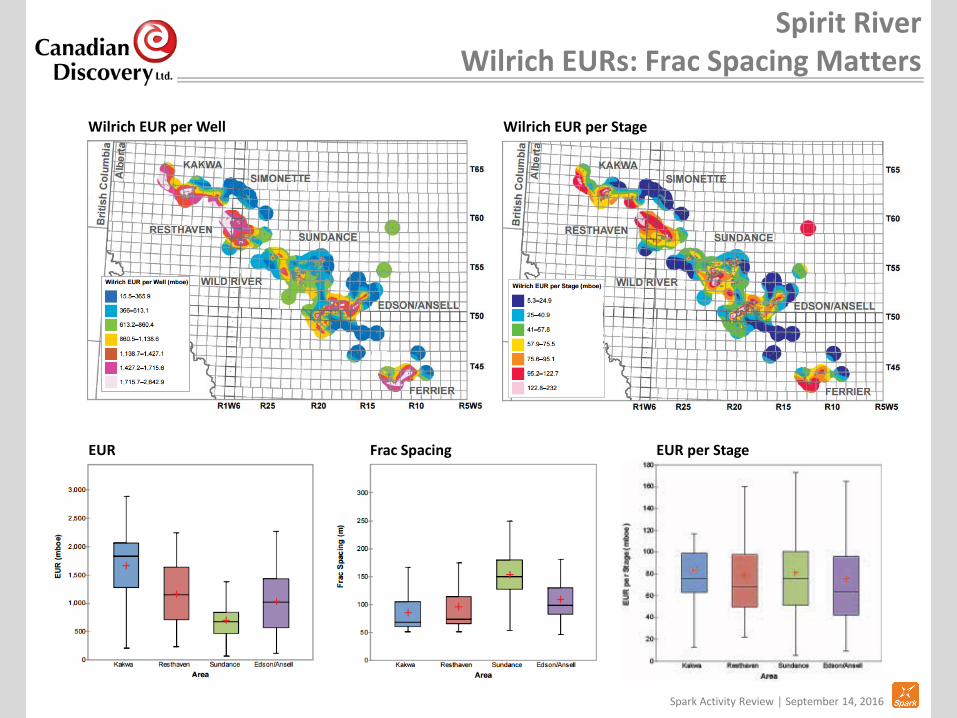
Spirit River Wilrich EURs: Frac Spacing Matters
Wilrich EUR per Well
Spark Activity Review │ September 14, 2016
EUR
Wilrich EUR per Stage
EUR per Stage Frac Spacing

Viking Dodsland: Impact of Downspacing on EURs
EUR per Well
Spark Activity Review │ March 30, 2016
Impact of Well Density on EURs
Total Oil Recovery per Section
Well Spacing
Sum
EU
Rs (m
bbls)
Wells/Section
Coun
t
Avg
EUR
Oil
(mbb
ls)
Wells/Section

Shaunavon Upper vs Lower: Different Rocks, Similar EURs
U Shaunavon EUR per Well
Spark Activity Review │ July 6, 2016
Type Curves L Shaunavon EUR per Well
Shaunavon Logs
Upper Shaunavon EUR (mbbls)
Lower Shaunavon EUR (mbbls)
P10 172 172
P50 68 61
P90 17 12
U Shaunavon
L Shaunavon
U Int bedded carbonates/ clastics L Carbonate

Bakken/Torquay Viewfield EURs and Completions Technology
Activity Review │ February 17, 2016 EURs from CDL’s Catalyst; Frac Data from CDL’s WCFD
Bakken/Three Forks EUR Map
Bakken EUR, Completion Technology, Time
Bakken Cum Probability Distribution: Technology

Cardium Resource Plays

Up Cret Cardium Resource Play
NW
SE Spirit River
Viking
Cardium
Horn River
Montney
Duvernay
Montney
Cardium
Heavy Oil
Viking
Bakken/Torquay Midale
Williston Basin
Cardium

Cardium Play Development
Wapiti
Kaybob South
Pembina
Garrington
Lochend
Stolberg Willesden Green
Ferrier

Cardium Estimated Ultimate Recovery
Activity Review │ May 27, 2015 Paleogeography from Geological Atlas of WCSB, 1994
21 Geologically Defined Plays • Facies • Reservoir Pressure • Reservoir Temperature
Better quality reservoirs = higher EURs

Cardium Cardium Oil Completions Trends
Data from Canadian Discovery's Well Completions & Frac Database
28
570 3,300
Quarterly Completions Analysis │ September 22, 2016
Technology Group Distribution Avg D&C Costs per Well
Avg Stages, Measure Depth and Completed Length per Well Avg Proppant and Fluid per Well
3,600 1,400
$1.5MM $0.8MM
Stages Length
Proppant Cost

Cardium Estimated Ultimate Recovery
Activity Review │ May 27, 2015 Paleogeography from Geological Atlas of WCSB, 1994
*EURs updated August 2016
*Wild River Gas & NGLs Beware of 6:1 boe
R1W6 R1W5
T50
T25
Garrington
Lochend
Ferrier
SW Pembina Ferrier

Cardium Shift in Stimulation Technology Increases EURs
Spark Activity Review │ October 12, 2016

Cardium Shift in Stimulation Technology Increases EURs
Spark Activity Review │ October 12, 2016
Number of Stages Completed Length
Frac Spacing

Cardium Shift in Stimulation Technology Increases EURs
Spark Activity Review │ October 12, 2016
Proppant per Stage Proppant per Well
EUR per Stage
EUR per Well
D&C Cost per Well D&C Cost per BOE

Cardium Whitecap Boosts EURs with ERHs
Cardium Location Map Whitecap Completed Length Comparison EUR BOE
Whitecap Completed Length by Year
D&C Cost per BOE
Cardium completed length increased 65% • 2007—850m • 2015—1,400m
Spark Activity Review │ September 14, 2016

Wrap Up

Maximum EUR per Section (mboe)
Thank you to other contributors • Pearl Meyer ― ppt maestro • Candace Keeler ― cartographer • Svetlana Suvorova ― graphic designer • Paul Patton ― infographic • Zenith Phillips ― graphic designer • Joshua Lee and Samantha Foster ― EURs • Luigi Malinis and Ricky La ― completions • Ben McKenzie ― data maestro
CDL products used for this presentation:
To download this presentation, visit www.canadiandiscovery.com
Powered by IHS Data

Contact Information
For inquiries with respect to this presentation, please contact:
403.269.3644
Find us on: