western canadian grain catchment - albertafile/grain_catchment_august15_web.pdf · the current...
TRANSCRIPT

Benchmark of Current
Grain Flows of Canadian
Wheat Board Grains
Western Canadian Grain Catchment
April 2013
Economics and Competitiveness Division Competitiveness and Market Analysis
_______________________________________________________________________
_______________________________________________________________________
Western Canadian Grain Catchment
Benchmark of Current Grain Flows of Canadian Wheat
Board Grains Competitiveness and Market Analysis Branch Economics and Competitiveness Division Alberta Agriculture and Rural Development Contact: Rosalie Cunningham Coordinating Researcher
Phone (780) 415-9013
April 2013

Economics and Competitiveness Division Competitiveness and Market Analysis
_______________________________________________________________________
_______________________________________________________________________
I
Executive Summary Currently the catchment zones and grain flows for Western Canadian grains can be summed up as follows: Canadian processing for wheat, durum or barley is either in the main production zone for the grain or bordering it. For exported grains, end destination determines port choice. Wheat and barley are mainly going through west coast ports to reach Asian destinations. Durum is just as likely to go through an east coast port in order to reach Europe and the Middle East. Since the US is a top importer of wheat, durum and barley, shipping via rail or road to the established processing facilities south of the border represents a viable route for all three crops. As new domestic and international opportunities for Canadian producers are realized they may end up changing these transportation flows, but only time will tell.

Economics and Competitiveness Division Competitiveness and Market Analysis
_______________________________________________________________________
_______________________________________________________________________
II
Table of Contents
Executive Summary ............................................................................................................ I
Introduction ........................................................................................................................ 1
Factors Affecting Grain Catchment .................................................................................. 1
External Considerations .................................................................................................... 1
Transportation .............................................................................................................. 1
Current System/Infrastructure .......................................................................................... 2
General ........................................................................................................................... 4
Wheat ............................................................................................................................. 4
Durum ............................................................................................................................ 6
Barley ............................................................................................................................. 8
Changes and Implications ............................................................................................... 10
Appendix: Maps .................................................................................................................. i
Wheat ............................................................................................................................. ii
Durum ........................................................................................................................... iii
Barley ............................................................................................................................ iv
References ........................................................................................................................... v

Economics and Competitiveness Division Competitiveness
_______________________________________________________________________
_______________________________________________________________________ 1
Introduction The elimination of mandatory single desk marketing through the Canadian Wheat Board (CWB) in August 2012 represented a fairly significant change to the selling of wheat and barley in Western Canada. Traditionally the CWB had a great deal of influence on the timing, direction, and departure port of board grains. Now with more options available to producers, there are expected impacts on the grain marketing and handling system within Western Canada. The purpose of this paper is to capture the current catchment and transportation flows of wheat and barley before the policy change. The intent is to have a benchmark for future comparison when the impacts on the grain marketing and handling system have been fully realized. A review of the grain handling system or the railways is outside of scope of this particular project.
Factors Affecting Grain Catchment The main factors in determining grain catchment areas are costs (production, storage, transportation, time) and demand (what, where, when and price). Product is pulled to destinations that are willing to pay a price that reflect the costs, quality and timing requirements plus some margin. Processing plants and ports traditionally draw the grains they need from production areas that will offer the desired product at a certain quality, reasonable shipping cost and preferred options.
External Considerations
Transportation
Modern transportation of goods is all about economies of scale. The current Panamax ocean vessel carries about 60,000 tons of dry product. This is the equivalent to 4-5 barge tows, 600 rail cars or 2,400 semi-trucks. In Canada, the two transportation options available are truck and rail. In comparison, the US has truck and rail but also river barges down the Mississippi, Ohio or Columbia rivers. This gives the US a distinct competitive advantage in transportation. The completion of the Panama Canal expansion in 2015 will definitely build upon the US’s shipping advantage. When completed, the upgrades will allow for cargo ships twice the size of the current Panamax to pass through. Increasing the size of cargo and reducing the waiting time for passage through the canal represents a very attractive option for shipping product from Central and Eastern US to Asian destinations. If Brazil improves its highway infrastructure to their ports, they too could reap benefits from the canal’s quicker passage to Asian consumers. Figure 1 shows the major ocean shipping routes. For product going to Asia from North American, the shortest and quickest route for the majority of the continent is from a western port. Product destined for Europe, the Middle East and most of Africa is more likely to go via an eastern port. This is true for Canadian grain exported internationally.

Economics and Competitiveness Division Competitiveness
_______________________________________________________________________
_______________________________________________________________________ 2
Figure 1: Major Ocean Shipping Routes Source: Rodrigue 2010
Current System/Infrastructure The current grain handling system in Canada was developed for shipping bulk quantities of products out of the country. More variety adds more complexity and additional costs to the system. Wheat and barley are not the only crops shipped out of Western Canada. Canola, in particular, competes with wheat and barley for transportation infrastructure (i.e. hopper cars, bin space) and acreage. For that matter grains and oilseeds are not the only products that depend on rail to get to port. Oil, coal and consumer product compete for rail space. The final product destination determines the path that the grains take to get from the farmer to end user. Generally, for products bound to export markets, the usual path is bringing the grains by truck to grain handling companies’ elevators. Product is loaded into hopper rail cars for shipping to a port and then transferred into an ocean vessel for transport to the destination country. Transfers are kept to a minimum since each time grains are transferred into another vessel, additional time, costs and opportunities for delay are added. As stated above, products destined for Asia usually go out a west coast port, for Europe or the Middle East it is an east coast port. Domestic product usually goes via truck or rail. Those bound for the US or Mexico go by truck, rail or water.

Economics and Competitiveness Division Competitiveness
_______________________________________________________________________
_______________________________________________________________________ 3
There is very little formal documentation on the actual hauling distance from the farm to the grain handling companies’ elevators. Quorum Corporation estimates that the average distance to the nearest elevator ranges from 23 to 50 miles (or 37 to 80 km) depending on the farm’s location. This may not be the distance that the grain was actually transported. It just represents the average distance to the nearest elevator. Catchment area for an elevator is usually thought to be about 50 to 100 km. After transportation from the farm, the next link involves the grain handling companies and their network of primary elevators. In the four western provinces, there are about 5.66 million tonnes of storage in primary elevators. Just over 50% is in Saskatchewan and roughly a third in Alberta. Glencore International Plc. owns 28% of the capacity, Richardson Pioneer Limited 23% and Cargill Limited 13%. Grain is loaded from the primary elevator sites into rail cars usually in 50 or 100 cars blocks. There are also over 200+ producer car loading spots from which anywhere from 1 to 20 cars can be loaded. Western Canada is served by two rail lines, Canadian National (CN) and Canadian Pacific (CP), which allows for the flow of product to both coasts and the US. It is a critical link in the transportation chain for grain as well as other bulk commodities such as coal, lumber and oil. Both CN and CPR do try to capitalize upon economies of scale offering better costs to shippers who use more cars (50 to 100). With only two rail companies (in some areas only one), true market competition is not possible. As a result many measures (legislative and policy) have been put in place over the years to try to balance this. The 2012 amendment to the “Canadian Transportation Act”, the “Fair Rail Freight Service Bill”, includes a shipper’s right to a service agreement and the option to arbitration if things do not go well. The formation of the Crops Logistics Working Group, made up of stakeholders, was formed to explore efficiencies in this chain. Given the critical role rail plays in shipping, it is probable that this link will continue to be carefully monitored by government and affected players. From rail, the next step is usually an ocean port. Canada has four ports that handle grain. The west coast ports are located in Vancouver and Prince Rupert. The east coast ports at Thunder Bay and Churchill. Vancouver, while not the largest, does on average handle the most grain in a given year.
Port Facilities Capacity (tonnes)
Average Annual (million tonnes)
Vancouver 6 954,290 14.6
Prince Rupert 1 209,000 4.6
Thunder Bay 8 1,250,000 5.9
Churchill 1 140,000 0.5
Figure 2: Comparison of Canadian Ports. Source: Quorum Corporation 2012

Economics and Competitiveness Division Competitiveness
_______________________________________________________________________
_______________________________________________________________________
4
General
The maps used in this discussion were generated by Informa Economics using Statistics Canada, USDA and their internal data sources. Full maps with complete legends are attached in the appendices. Production, export values and rail volume to port are based upon three year averages (2009-2011). Processing facilities were mapped as of January 1, 2013. Changes in operations and ownership have occurred since that date and will be noted in the discussion.
Wheat
This category of wheat (i.e. non-durum) is used mainly in baking. Figure 3 shows the production zone and major processing facilities in Alberta and Saskatchewan. Included on the map are the class one rail lines (pink line), major highways (blue line) and primary elevators (yellow dots).
Figure 3: Excerpt of Wheat Map. Source: Informa Economics 2013.
(Full Map including Legend in Appendix)
(1) Horizon Milling
(2) P&H Milling
ADM Milling
P&H Milling
Permolex (API)
ADM (Closed 2013)

Economics and Competitiveness Division Competitiveness
_______________________________________________________________________
_______________________________________________________________________ 5
The main production zone for wheat in Alberta and Saskatchewan is a horseshoe shaped area starting in south-east/south-central Alberta coming up to Edmonton and down to Saskatoon. The darker the green shading represents the higher density of production. Western Canadian flour mills of significant size are located in or border this production zone. The two largest mills are ADM Milling Company in Calgary and Horizon Milling in Saskatoon. Their capacities are between 600 and 700 tonnes per day. The next set of mills are in the 250 to 350 tonnes per day range. P&H Milling Group in Lethbridge and Saskatoon are both in this range. Since these maps were generated ADM Milling Group has closed their 372 tonnes per day plant in Medicine Hat, moving the milling production to their Calgary plant. The repercussions have yet to unfold. There are several other smaller mills in Alberta, often more specialized. Permolex in Red Deer processes not only flour but ethanol and gluten. Sunny Boy Mills in Camrose handles organic and specialty grains. Something to note are several mills of comparable or larger capacities just across the American border in Montana and North Dakota. Either state could be reached by rail or road from Western Canada. The largest in Grand Forks, North Dakota has wheat capacity of 1,361 tonnes per day and is owned by the North Dakota Mill and Elevator Association. North Dakota itself is one of the main production zones for wheat in North America. The US is a top importer of Alberta wheat. Figure 4 shows the top importers of Alberta wheat over the last five years. Asian countries figure prominently in the top six. In fact in 2011, 42 % of Alberta wheat was bound for Asia, which means a west coast port.
Figure 4: Top 6 Importers of Alberta Wheat (Non-durum). Source: Statistics Canada
West coast ports have on average handled the bulk of the Alberta wheat exports. Vancouver’s three year average is about 2.8 million tonnes and Prince Rupert about 1.8 million tonnes. In contrast Thunder Bay and Churchill together accounted for about 91,000 tonnes. Not an unexpected result considering that Asia is the dominant export destination.
-
200
400
600
800
2007 2008 2009 2010 2011
Th
ou
san
ds
To
nn
es
Year
Top 6 Importers of Alberta Wheat (non-durum)
United States
Korea, South
Japan
Bangladesh
Indonesia
Mexico

Economics and Competitiveness Division Competitiveness
_______________________________________________________________________
_______________________________________________________________________
6
In terms of North America, Mexico is a significant destination with a three year average of about 313,000 tonnes. The top three US states for Alberta wheat were Ohio (~123,000 tonnes), Minnesota (~72,000) and Oregon (~62,000). The processing in those states explains the demand pull for wheat. Ohio borders the grain belt and is within one day transport to the major eastern population centers. There are many food processing companies in Ohio including 11 flour mills (Kraft, Conagra among them). Minnesota has eight mills and Pillsbury, General Mills and International Multifoods Corporation operations. While Oregon has fewer mills (1-4 depending on source), it is the home to several Bimbo Bakeries USA, one of the largest bakery companies in the US.
Durum
Figure 5: Excerpt of Durum Map. Source: Informa Economics 2013.
(Full Map including Legend in Appendix)
P&H Milling
Horizon Milling

Economics and Competitiveness Division Competitiveness
_______________________________________________________________________
_______________________________________________________________________ 7
Durum is used mainly for making pastas and noodles. Figure 4 shows the production zone and major processing facilities in Alberta and Saskatchewan. Included on the map are the class one rail lines (pink line), major highways (blue line) and the primary elevators (yellow dots). The production zone for durum wheat consists of the south east corner of Alberta and southern Saskatchewan. The darker greens indicate higher production densities are located more in Saskatchewan, southwest central region. Given the smaller production zone than non-durum wheat it is not surprising there are fewer mills in Western Canada. The millers for durum border the production zone. Horizon Milling Group in Saskatchewan has an approximate capacity of 340 tonnes per day. In Lethbridge, P&H Milling Group has capacity of about 177 tonnes per day. Both facilities also process non-durum wheat. North Dakota and Montana again have comparable or larger mills accessible by rail or road. Minot Milling in Minot, North Dakota is the largest of these at just under 400 tonnes per day capacity. The US is one of the top three destinations for Alberta durum. However Italy is the current top importer for durum. Given pasta’s prominence in the Italian diet this is not surprising. Unlike other wheat, in 2011 37% of Alberta durum went to a European destination, 22% went to the Middle East and 11% of Alberta durum was bound for Asia. This translates to more durum shipments through an east coast port.
Figure 6: Top 5 Importers of Alberta Durum. Source: Statistics Canada
Durum’s three year average movement through Vancouver was just over 250,000 tonnes and Thunder Bay just under 250,000 tonnes. Prince Rupert’s was about 14,000 tonnes and none went through Churchill. The top US destinations for Alberta durum were Missouri (~30,000 tonnes), Iowa (~17,000 tonnes) and North Dakota (almost 16,000 tonnes). These states have large durum and pasta processors. Missouri is the home to American Italian Pasta Company and Barilla has operations in Iowa. North Dakota, a region of US durum production, has two durum mills and Dakota Growers Pasta (now part of Glencore/Viterra).
-
50
100
150
200
2007 2008 2009 2010 2011
Th
ou
san
ds
To
nn
es
Year
Top 5 Importers of Alberta Durum
Italy
United States
Morocco
Venezuela
Japan

Economics and Competitiveness Division Competitiveness
_______________________________________________________________________
_______________________________________________________________________
8
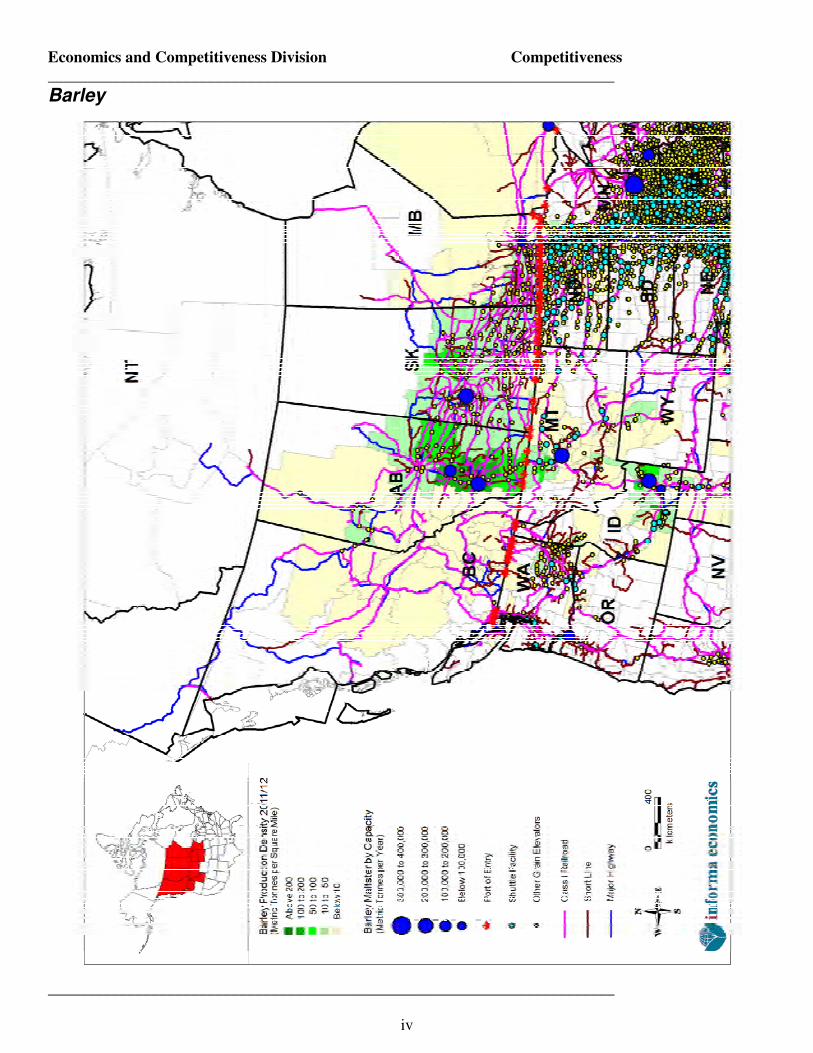
Barley
Barley is predominantly used for malt, beer, feed and limited food products. Figure 7 shows the production zone and major processing facilities in Alberta and Saskatchewan. Included on the map are the class one rail lines (pink line), major highways (blue line) and the primary elevators (yellow dots). The production zone for barley covers most of Alberta and Saskatchewan but the highest density region is in central Alberta surrounding the QEII Highway and in central Saskatchewan.
Figure 7: Excerpt of Barley Map. Source: Informa Economics 2013.
(Full Map including Legend in Appendix)
The intensive livestock feeding operations and the malt processing facilities are near or border this zone. Canada Malting in Calgary and Prairie Malt Ltd. in Biggar,
Rahr Malting
Canada Malting Co.
Prairie Malt Ltd.

Economics and Competitiveness Division Competitiveness
_______________________________________________________________________
_______________________________________________________________________ 9
Saskatchewan are between 220,000-250,000 tonnes per year capacity range. Rahr Malting in Alix, Alberta is slightly smaller at 140,000 tonnes per year capacity. The closest US facility is Malteurop (formerly ADM Malting) in Great Falls, Montana. Its capacity is comparable at 200,000 tonnes per year and is accessible from Western Canada by road and rail. The US is one of the top importers of Alberta barley along with Japan and China. While 20% of 2011 Alberta exports were destined for North America, 47% were bound for Asia and another 22% for the Middle East. This would indicate west coast ports would be the port of choice for the majority of Alberta barley. A Middle East destination would probably indicate the barley’s end use is either food or feed opposed to beer.
Figure 8: Top Importers of Alberta Barley. Source Statistics Canada
As a three year average, Vancouver shipped the vast majority of Alberta barley at just over 300,000 tonnes. Prince Rupert handled roughly 174,000 tonnes. Thunder Bay had a mere 7,500 tonnes and none was shipped through the port of Churchill. West coast ports indeed are the port of choice for Alberta barley. The top US destinations for Alberta barley are North Dakota (~44,000 tonnes), Missouri (~13,000 tonnes), Minnesota (~10,000 tonnes) and Wisconsin (~10,000 tonnes). Like the other grains, the processing companies in those states do explain why barley is pulled there. North Dakota was until recently the top barley producing state and is where Rahr Malting has a procurement and distribution facility. Major maltsters are in North Dakota (Cargill), Minnesota (Malteurop, Rahr and Anheuser-Busch) and Wisconsin (Cargill, Malteurop and Briess Malt & Ingredient Co.). Major brewing companies are located in Missouri (Anheuser-Busch) and Wisconsin (MillersCoors). This does not include the craft brewers.
-
100
200
300
400
2007 2008 2009 2010 2011
Th
ou
san
ds
To
nn
es
Year
Top 4 Importers of Alberta Barley
Japan
United States
Saudi Arabia
China

Economics and Competitiveness Division Competitiveness
_______________________________________________________________________
_______________________________________________________________________
10
Changes and Implications Since the removal of the single desk, companies involved in the buying, selling, transporting and processing of grains are adapting to the removal of the CWB. The nature of the investments reveal where these stakeholders believe changes might happen. Western Canada grain trading is still seen as attractive. International and established Canadian grain traders are opening or expanding Canadian operations. Glencore International Plc. (a Swiss based company) has completed their takeover of Viterra. Richardson Pioneer will receive 19 grain elevators in this deal and is investing $120 million in the Vancouver Port Facilities. Paterson Grain launched a terminal in Alberta and expanded operation in Alberta and Manitoba. Other grain companies are seeing opportunities in Western Canada with the removal of the single desk. Lansing Trading Group (US based) and Olam International (Singapore based commodities trader) have formed a Canadian based joint venture in order to source Canadian grains and oilseeds for international markets. CHS (a US based farmer owned cooperative) opened a Winnipeg office and is rumored to be aggressively seeking assets in Western Canada. Motomco Group (Brazil based producer of grain quality control products) selected Winnipeg as their North American base of operations for their Canadian affiliate Canada Moisture Analyzers. CN is investing over $150 million for additional siding on the Edmonton-Prince Rupert line. While crops will not be the sole beneficiary of this they will benefit from the infrastructure investment. They announced the purchase of 558 new high capacity covered grain cars. The rail has also modified their operation to offer fixed services days allowing for better scheduling and greater efficiencies. This shows new money is being invested to support the west coast infrastructure for grain handling. On the other hand, the time-limited (five year) Churchill Port Utilization subsidy, a federal program to encourage use of the port of Churchill indicates that left to market forces, grain will cease to be shipped out of this east coast port. The lack of year round access to Churchill does present a challenge to increasing its volumes. The subsidy appears to be mainly in place to allow the port to adjust to this anticipated change. The numbers already show it is not a significant port for western grain. As long as Asia continues to be the top market destination for these products, west coast ports will continue to draw the grain. In terms of investments by crop, canola is attracting new processing. Cargill announced the construction of a new canola crusher to be located in Camrose. While not new processing, barley operations have pulled additional infrastructure. Rahr Malting will be tripling the storage capacity at Alix with a $6 million investment. The closure of one of the flour mills, suggests that wheat is consolidating its processing not expanding operations in Western Canada. Given that wheat is easier to transport and has a longer shelf life than flour there is logic in milling the wheat closer to the food processor and the end market. Western Canadian wheat will probably continue to be processed in international mills close to the larger populations in the US and Asia.

Economics and Competitiveness Division Competitiveness
_______________________________________________________________________
_______________________________________________________________________
11
There may be other opportunities that open up for further processing due to the market’s ability to deal directly with producers for wheat and barley. This may open the way for processors to connect with producers to get crops grown to a processors unique specifications, identity preserved or more niche products. This has shipping implications and could increase container usage for these products as they are better suited to ship traceable product in a bulk system. For barley, the rise of craft brewers and the decline of US domestic production (corn and other crops are edging it out) could result in additional demand pull from the US to feed into the established maltsters and smaller micro-brewers. Malt also is a viable export. The top two export markets for Alberta malt are Japan and the US. Interestingly these two markets already import roughly the same tonnage of Alberta barley processed into malt as they do barley. With the removal of the administrative burden represented by the
single desk, it is conceivable that more barley could be processed domestically.
Currently the catchment zones and grain flows for Western Canadian grains can be summed up as follows: Canadian processing for wheat, durum or barley is either in the main production zone for the grain or bordering it. For exported grains, end destination determines port choice. Wheat and barley are mainly going through west coast ports to reach Asian destinations. Durum is just as likely to go through an east coast port in order to reach Europe and the Middle East. Since the US is a top importer of wheat, durum and barley, shipping via rail or road to the established processing facilities south of the border represents a viable route for all three crops. As new domestic and international opportunities for Canadian producers are realized they may end up changing these transportation flows, but only time will tell.

Economics and Competitiveness Division Competitiveness
_______________________________________________________________________
_______________________________________________________________________ i
Appendix: Maps
Source: Informa Economics

Economics and Competitiveness Division Competitiveness
_______________________________________________________________________
_______________________________________________________________________
ii
Wheat

Economics and Competitiveness Division Competitiveness
_______________________________________________________________________
_______________________________________________________________________
iii
Durum
Economics and Competitiveness Division Competitiveness
_______________________________________________________________________
_______________________________________________________________________
iv
Barley

Economics and Competitiveness Division Competitiveness
_______________________________________________________________________
_______________________________________________________________________ v
References Agriculture and Agrifood Canada (Nov. 10, 2012). “Harper Government and Grain Industry Collaborate to Improve Grain Value Chain”. News Release. http://www.agr.gc.ca/cb/index_e.php?s1=n&s2=2012&page=n121120 American Bakers Association: www.americanbakers.org Atamanchuk, W. & R Miller. (Oct 30, 2012). “Breakthrough Service Innovation in Western Grain.” CN presentation for Alberta Grains Council. Brewers Association: www.brewassociation.org Canadian Newswire. (Sept. 4, 2012). “CN acquiring more than 2,200 new freight cars and 1,300 containers to support traffic growth and improve customer service”. http://www.newswire.ca/en/story/1029907/cn-acquiring-more-than-2-200-new-freight-cars-and-1-300-containers-in-2012-to-support-traffic-growth-and-improve-customer-service Cargill. (Oct 1, 2012). “Cargill to build canola crush plant near Camrose, Alberta”. Cargill News Release. http://www.cargill.com/news/releases/2012/NA3067455.jsp Conner, J.M. & W.A. Schiek. (1997) “Food Processing: An Industrial Powerhouse in Transition.” Second Edition. New York. Cross, Brian. (July 12, 2012). “New players join the grain race”. Western Producer. http://www.producer.com/2012/07/new-players-join-the-grain-race%E2%80%A9/ Cross, Brian. (April 20, 2012). “Churchill grain receives funding”. Western Producer. http://www.producer.com/2012/04/churchill-grain-receives-funding%E2%80%A9/ Hamilton, M. (Nov. 9, 2012). “Field on Wheels”. Canadian Pacific presentation at 17th Annual Field on Wheels Conference. http://umanitoba.ca/faculties/management/ti/2012FieldsonWheels.html Heaps, T. et al. (1994). “Simulation of the Optimal Structure of a Regional Transport System.” Canadian Journal of Regional Science. http://www.cjrs-rcsr.org/archives/17-1/Heaps-et-al.pdf Informa Economics. (2012). Internal Databases for agricultural and food processing facilities. Informa Economics. (2012). Custom wheat, durum and barley production, processing, and export maps produced for Alberta Agriculture.

Economics and Competitiveness Division Competitiveness
_______________________________________________________________________
_______________________________________________________________________
vi
Lawrence, Russell J. (2011). “Grains, Trains and Chains: An Agent Based Model of the Western Canadian Grain Handling and Transportation Supply Chain”. University of Saskatchewan. http://ecommons.usask.ca/bitstream/handle/10388/ETD-2011-08-142/LAWRENCE-THESIS.pdf?sequence=3 National Pasta Association: www.ilovepasta.org North American Millers Association: www.namamillers.org Quorum Corporation. (Jan. 2012). “The Canadian Grain Handling and Transportation System: Western Canada’s logistics and grain transportation system.” Presentation for Saskatchewan Agriculture “Marketing Your Grain in 2012” program. http://www.agriculture.gov.sk.ca/adx/aspx/adxGetMedia.aspx?DocID=d50e0504-9c80-44c2-9c01-ac4b93cbdfed&MediaID=12284&Filename=Quorum+-+Western+Canada's+logistics+and+grain+transportation+system.pdf&l=English Quorum Corporation. (May 2011). “Traffic, Market and Logistical Changes in the Western GHTS: 1980 to 2010”. http://www.quorumcorp.net/Downloads/SupplementalReports/TraffMktLogChanges1980-2010.pdf Rodrigue, Dr. Jean-Paul. (2010). “Factors Impacting North American Freight Distribution in View of the Panama Canal Expansion” The Van Horne Institute. http://people.hofstra.edu/jean-paul_rodrigue/downloads/Panama%20Canal%20Study%202011%20Final.pdf Red Deer Advocate. (Nov. 1, 2012). “Rahr Malting announces $6M expansion to Alix Plant”. http://www.reddeeradvocate.com/business/Rahr_Malting_announces_6M_expansion_to_Alix_plant_133021178.html Statistics Canada. (2012). Alberta exports of Wheat (excluding durum), durum and barley by country. Prepared by: Alberta Agriculture and Rural Development, Economics and Competitiveness Division, Statistics and Data Development Branch World Grain. (Oct 2, 2012). “Richardson to invest in port terminal facility”. http://www.world-grain.com/News/News%20Home/World%20Grain%20News/2012/10/Richardson%20to%20invest%20in%20port%20terminal%20facility.aspx?cck=1