western australian meat industry snapshot chickens and a range of other meats form a second tier of...
TRANSCRIPT
WESTERN AUSTRALIAN
MEAT INDUSTRY SNAPSHOT
A summary of Western Australian Meat Industry - Overview for Potential Investors and Other Stakeholders
available at agric.wa.gov.au/WAagrifood-industryguides
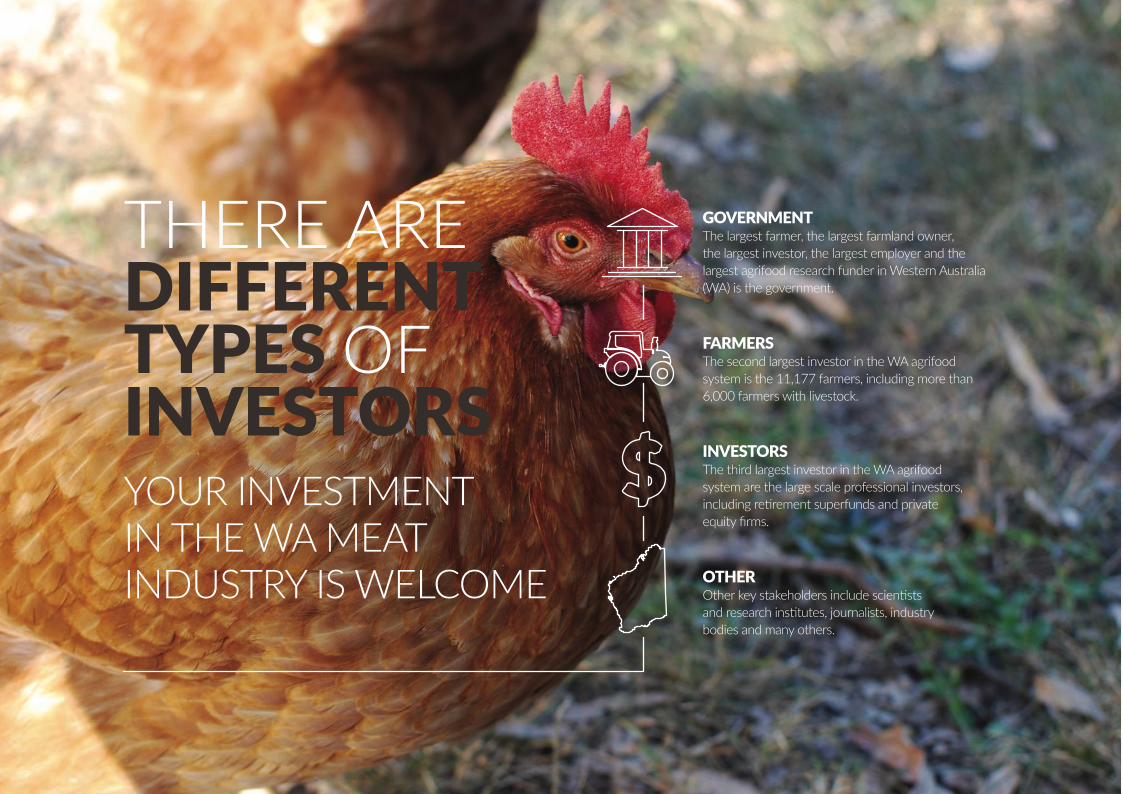
YOUR INVESTMENT IN THE WA MEAT INDUSTRY IS WELCOME
THERE ARE DIFFERENT TYPES OF INVESTORS
GOVERNMENT The largest farmer, the largest farmland owner, the largest investor, the largest employer and the largest agrifood research funder in Western Australia (WA) is the government.
FARMERS The second largest investor in the WA agrifood system is the 11,177 farmers, including more than 6,000 farmers with livestock.
INVESTORS The third largest investor in the WA agrifood system are the large scale professional investors, including retirement superfunds and private equity firms.
OTHER Other key stakeholders include scientists and research institutes, journalists, industry bodies and many others.

Source: World Bank; United Nations; FAO; Coriolis analysis
TOTAL MEAT IMPORT VOLUME (T; M)
3%CHINA
16%TAIWAN
26%SOUTH KOREA
39%JAPANIMPORTS AS A %
OF COUNTRIES TOTAL MEAT SUPPLY
0.20.9
2.1
5.3
7.5
201320051995198519751965
13.4GROWING DEMAND FROM ASIA
IN DEMAND OVER THE LAST DECADEBILLION GROWTH
These include; Saudi Arabia, Other Middle East, South/South East Asia, Other East Asia, South Korea, Japan, Hong Kong (ASR) and China.
Meat import value (2005 – 2015)
US

Western Australia is the closest, most accessible broadacre, rangelands and Mediterranean climate zone to Asia; it is in the same time zone as Beijing, Manila, Hong Kong and Kuala Lumpur.
“ The advantage of Western Australia is the close proximity to SE Asia. The geographic location is a windfall. We get a good logistics advantage. ” REGIONAL DIRECTOR, MULTINATIONAL AGRIBUSINESS
WESTERN AUSTRALIA WELL POSITIONED TO DELIVER
Shipping times and time zones from Perth
PERTH12 DAYS
23 DAYS 20 DAYS
10 DAYS
12 DAYS
15 DAYS
16 DAYS
20 DAYS
21 DAYS22 DAYS
-1 HOUR
SAME TIME ZONE +1 HOUR

NZ (ANZCERTA)SINGAPORE (SAFTA)US (AUSFTA)THAILAND (TAFTA)CHILE (ACIFTA)
ASEAN-NZ (AANZFTA)MALAYSIA (MAFTA) KOREA (KAFTA) JAPAN (JAEPA)CHINA (CHAFTA)
CURRENT FTAs
GULF (GCCFTA)INDIA (AICECA)INDONESIA (IACEPA)
FTAs UNDER NEGOTIATION
EXCELLENT TRADE ACCESS
“ The (lamb) tariff into China is reducing to zero within 6 years. That will definitely help us to be more competitive. ” MANAGER, MEAT PROCESSOR, LARGE
PERTH

COMPARATIVE ADVANTAGESUITED TO GRAZINGLarge area of land well suited to high quality, grass-fed meat production
• Size of Western Europe with the population of Jamaica
• A dry Mediterranean climate
• Rain-fed areas that do not require irrigation
Experienced and efficient livestock farmers
• Large farming units by global scale
• Large production per farming unit
• Modern industry with solid systems
• Deep pool of experienced farm operators
• No agricultural subsidies
CLOSE TO KEY MARKETSMid-sized producer but major exporter in Asia
• Small local population with flat consumption
• Industry focused on exports for 100+ years
Rapid economic and population growth of parts of Asia and “Westernisation” of the diet – has increased their demand for “Western” meat (e.g. beef). Growing regional production of intensively produced meat is insufficient to meet total demand, driving imports. Western Australia is the natural and logical supplier of grass-fed meat to the tropical climate countries of South-East Asia and well positioned to supply East Asia and the Middle-East.
RESOURCESHuge land area (the size of Western Europe)
Approximately 30% of the State is grazed, with significant opportunties for productivity increases
Small local population to feed (2.6m people)
Readily available farming inputs (e.g. fertiliser)
SKILLS AND SYSTEMSEducated population
Modern farming systems
High productivity
Deep pool of capacity
Efficient logistics
Well organised industry
REPUTATION“Brand Australia” recognised across key markets
Lack of many key plant diseases
Strong biosecurity
High levels of food safety
Modern handling & processing facilities
WESTERN AUSTRALIA CAN PRODUCE MORE
LIVE ANIMALSUnlike most developed countries, Western Australia exports large numbers of live sheep and cattle by ship to markets in South East Asia and the Middle East.
The majority of WA cattle are produced in the Blue Tongue Virus Free Zone, with ports throughout the state that are available to load live stock for a myriad of export destinations.
SAFE SUPPLYWestern Australia (WA) produces a range of high quality, safe, eco-friendly, ethically produced livestock and meat products.
WA livestock have high animal health status, free from major transmissible diseases, backed by supply chain assurance programs and an effective biosecurity system which includes mandatory traceability and surveillance.

DOMESTIC
Modern, well developed industry
Recent investment for growth targeting state shortage
CHICKEN
KEY EXPORT MEATS
Low cost/low intensity system
Small local population; large surplus available for export
Secondary Australian producer overall
Growing animal numbers
BEEFLow cost/low intensity system
Falling domestic consumption; large surplus available for export
Major global sheep trader (live and processed)
SHEEP
SECONDARY
Modern, well developed industry
Small by global standards
Constant, steady long term growth
Developing strong domestic position in free range
PORK

FOCUSED ON THREE PRODUCTSThe Western Australian meat production system focuses on three key export meats where it has clear comparative advantage: sheep, beef and pork.
Goat, chickens and a range of other meats form a second tier of emerging opportunities.
BEEFGlobal demand for imported beef is growing. Australia is the largest global beef supplier and is growing with the market. Western Australia is a significant beef producer, achieving long-term growth in stock numbers. Western Australia exported A$160m in beef (YE Mar-17), representing 2.2% of total Australian beef exports.
SHEEP MEATAustralia and New Zealand dominate the global sheep meat trade. The market is growing moderately; chilled is more valuable than frozen and showing stronger growth. North America, Middle East and China are major destinations. Western Australia has the second largest flock behind New South Wales, but flock numbers continue to decline. Processing numbers are not declining as rapidly, however the trajectory for the future is unclear.
PORK Western Australia is well positioned to produce more pork. The Western Australia pork industry accounts for 13% of domestic pig meat production, but 28% of export value. Australian pork exports go predominantly to Singapore, Hong Kong, New Zealand and Papua New Guinea.
OTHER MEATSWestern Australia has interesting opportunities in other meats that may suit some investors. Chicken production is growing; replacing imports from the eastern states. Many in the industry see goat as an opportunity in the future.

3PRODUCTION SYSTEMS
DIFFERENT
FREE-RANGE, GRASS-FED• Animals graze freely on open land for whole of life• Low cost, low intensity system• Leverages Western Australia’s large amounts of land• Primarily sheep, cattle and goats; pigs being developed• May use some amounts of seasonal supplementary feeding• Opportunity for hormone-free and antibiotic-free• Opportunities to certify more land as organic (as it basically is already); organic meat sells at a premium
GRASS-FED THEN FEEDLOT• Animals graze freely on open land and then moved to contained feeding prior to slaughter• Primarily cattle, though some sheep• Most feedlot operations are small by global standards• Unit size partially a function of regulations and water pricing system• Cyclical industry returns• Industry needs strategy to access more low cost feeds
INTENSIVE FEEDING SYSTEMS• Animals housed in contained production units• Using modern high input/high output production systems• Primarily targeted at domestic markets• Exports minor; opportunities in specific niche markets• Key meats protected from global competition by biosecurity (hence profitable)• Poultry growing strongly; pork growing steadily• Cyclical industry returns• Industry needs strategy to access more low cost feeds
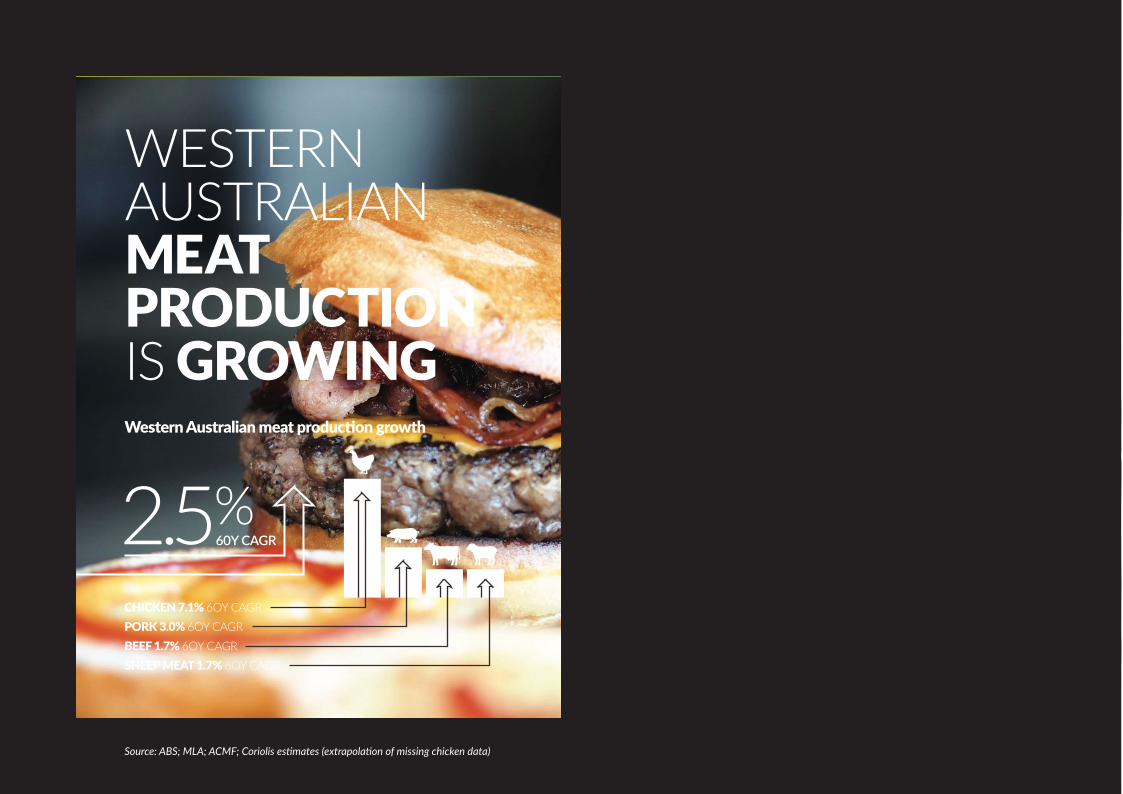
WESTERN AUSTRALIAN MEAT PRODUCTION IS GROWINGWestern Australian meat production growth
CHICKEN 7.1% 6OY CAGRPORK 3.0% 6OY CAGRBEEF 1.7% 6OY CAGRSHEEP MEAT 1.7% 6OY CAGR
Source: ABS; MLA; ACMF; Coriolis estimates (extrapolation of missing chicken data)
2.5%60Y CAGR

Source: ABS; Coriolis analysis
LIVE ANIMALS
BEEF
PROCESSED MEATS
LAMB, GOAT & PORK
1996
$407
1997
$420
1998
$456
1999
$479
2000
$597
2001
$667
2002
$731
2003
$754
2004
$719
2005
$775
2006
$848
2007
$843
2008
$754
2009
$947
2010
$802
2011
$892
2012
$704
2013
$663
2014
$905
2015
$990
2016
$1110
2017
$1108
WESTERN AUSTRALIA IS ACHIEVING MEAT EXPORT GROWTHWestern Australian meat and live animal export value (A$; m; YE June; 1996-2016; YE April 2017)
5.0%20Y CAGR

THERE WILL BE SOLID DEMAND IN THE FUTURE
LIVE SHEEP TRADE 10YR CAGR
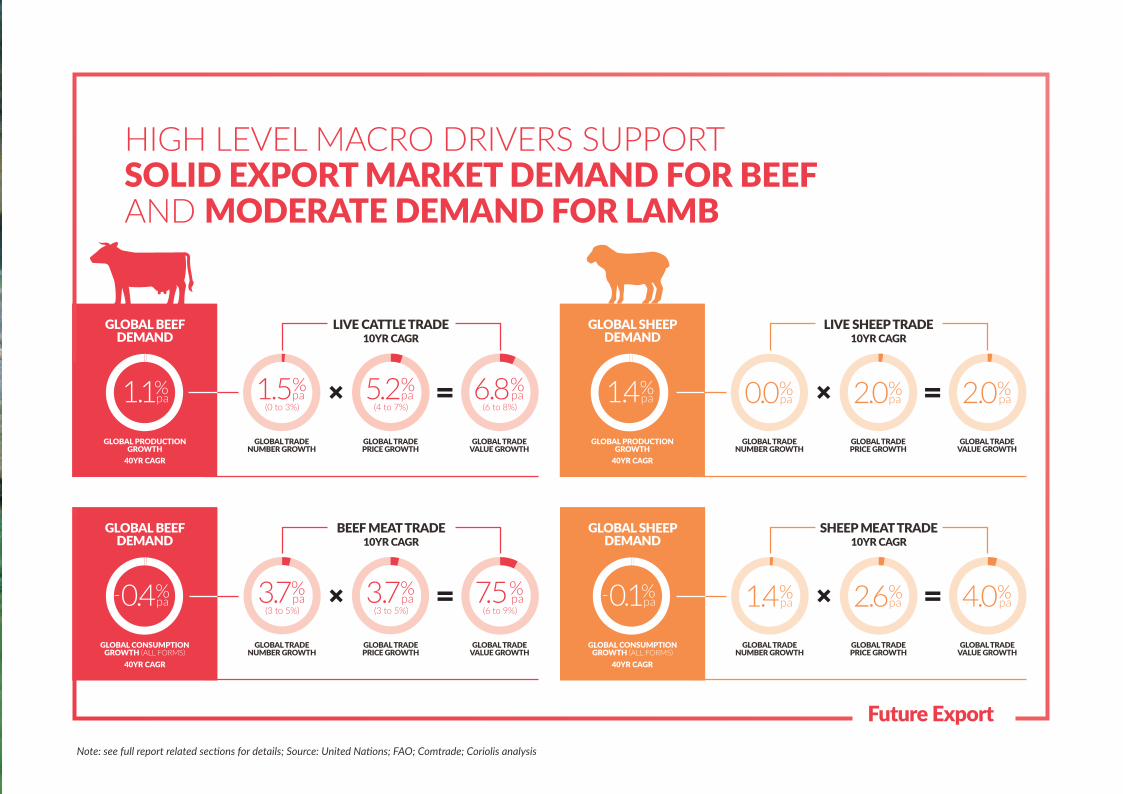
HIGH LEVEL MACRO DRIVERS SUPPORT SOLID EXPORT MARKET DEMAND FOR BEEF AND MODERATE DEMAND FOR LAMB
GLOBAL BEEF DEMAND
GLOBAL PRODUCTION GROWTH
40YR CAGR
1.1%pa
LIVE CATTLE TRADE 10YR CAGR
1.5%pa
(0 to 3%)5.2%
pa(4 to 7%)
6.8%pa
(6 to 8%)
GLOBAL TRADE NUMBER GROWTH
GLOBAL TRADE PRICE GROWTH
GLOBAL TRADE VALUE GROWTH
GLOBAL BEEF DEMAND
GLOBAL CONSUMPTION GROWTH (ALL FORMS)
0.4%pa
BEEF MEAT TRADE 10YR CAGR
3.7%pa
(3 to 5%)3.7%
pa(3 to 5%)
7.5%pa
(6 to 9%)
GLOBAL TRADE NUMBER GROWTH
GLOBAL TRADE PRICE GROWTH
GLOBAL TRADE VALUE GROWTH
-
GLOBAL SHEEP DEMAND
GLOBAL CONSUMPTION GROWTH (ALL FORMS)
0.1%pa
SHEEP MEAT TRADE 10YR CAGR
1.4%pa 2.6%
pa 4.0%pa
GLOBAL TRADE NUMBER GROWTH
GLOBAL TRADE PRICE GROWTH
GLOBAL TRADE VALUE GROWTH
-
Note: see full report related sections for details; Source: United Nations; FAO; Comtrade; Coriolis analysis
Future Export
40YR CAGR 40YR CAGR
GLOBAL SHEEP DEMAND
GLOBAL PRODUCTION GROWTH
0.0%pa 2.0%
pa 2.0%pa
GLOBAL TRADE NUMBER GROWTH
GLOBAL TRADE PRICE GROWTH
GLOBAL TRADE VALUE GROWTH
1.4%pa
40YR CAGR

ATTRACTING GLOBAL INVESTMENT
FANDA AUSTRALIAN LIVE CATTLE INDUSTRIAL
SHANGHAI CRED
ZHOUSHAN FANDA AUSTRALIAN CATTLE
ZHEJIANG
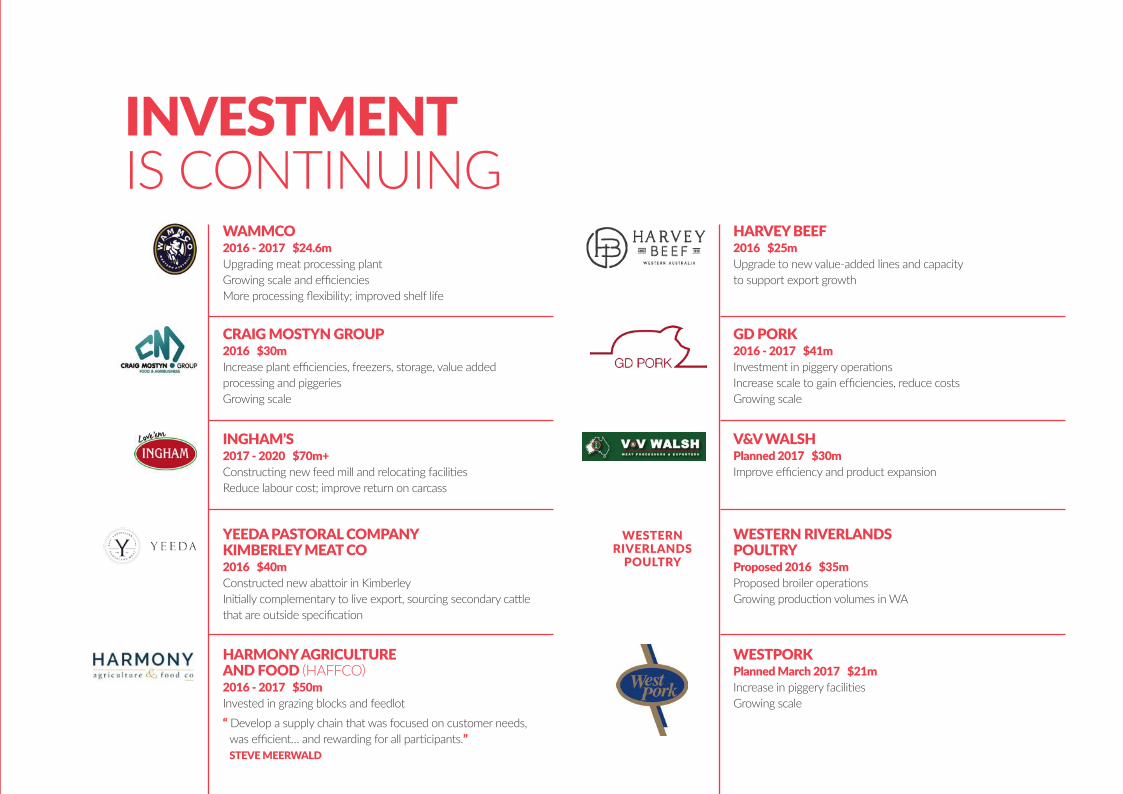
INVESTMENT IS CONTINUING
WAMMCO 2016 - 2017 $24.6m Upgrading meat processing plant Growing scale and efficiencies More processing flexibility; improved shelf life
GD PORK 2016 - 2017 $41m Investment in piggery operations Increase scale to gain efficiencies, reduce costs Growing scale
V&V WALSH Planned 2017 $30m Improve efficiency and product expansion
WESTPORK Planned March 2017 $21m Increase in piggery facilities Growing scale
INGHAM’S 2017 - 2020 $70m+ Constructing new feed mill and relocating facilities Reduce labour cost; improve return on carcass
YEEDA PASTORAL COMPANY KIMBERLEY MEAT CO 2016 $40m Constructed new abattoir in Kimberley Initially complementary to live export, sourcing secondary cattle that are outside specification
HARVEY BEEF 2016 $25m Upgrade to new value-added lines and capacity to support export growth
HARMONY AGRICULTURE AND FOOD (HAFFCO) 2016 - 2017 $50m Invested in grazing blocks and feedlot“ Develop a supply chain that was focused on customer needs, was efficient… and rewarding for all participants.” STEVE MEERWALD
WESTERN RIVERLANDS POULTRY Proposed 2016 $35m Proposed broiler operations Growing production volumes in WA
CRAIG MOSTYN GROUP 2016 $30m Increase plant efficiencies, freezers, storage, value added processing and piggeries Growing scale
WESTERN RIVERLANDS
POULTRY

WESTERN AUSTRALIA’S MEAT SECTOR HAS A STRONG GROUP OF THRIVING COMPANIES
Note: Many firms operate across multiple stages of the supply chain
FARMING OPERATIONS
LIVE EXPORTING
PRIMARY PROCESSING
SECONDARY PROCESSING

$124
$209 $210
$271$287
2011 2012 2013 2014 2015
$479 $488$504 $513
$547
2011 2012 2013 2014 20153%
2011
$300
2012
$369
2013
$354
2014
$420
2015
$403
LEADERS GROWING REVENUEFive year revenue growth: select firms with significant WA meat activities (A$; m; 2011-2015)
Note: both WAMMCO and Fletcher have an additional plant on the East Coast; Source: ASIC filings; firm annual reports; IBISWorld; Coriolis research and estimates
FLETCHER INTERNATIONAL WAMMCO
CRAIG MOSTYN GROUP
CAGR 23%CAGR
8%CAGR
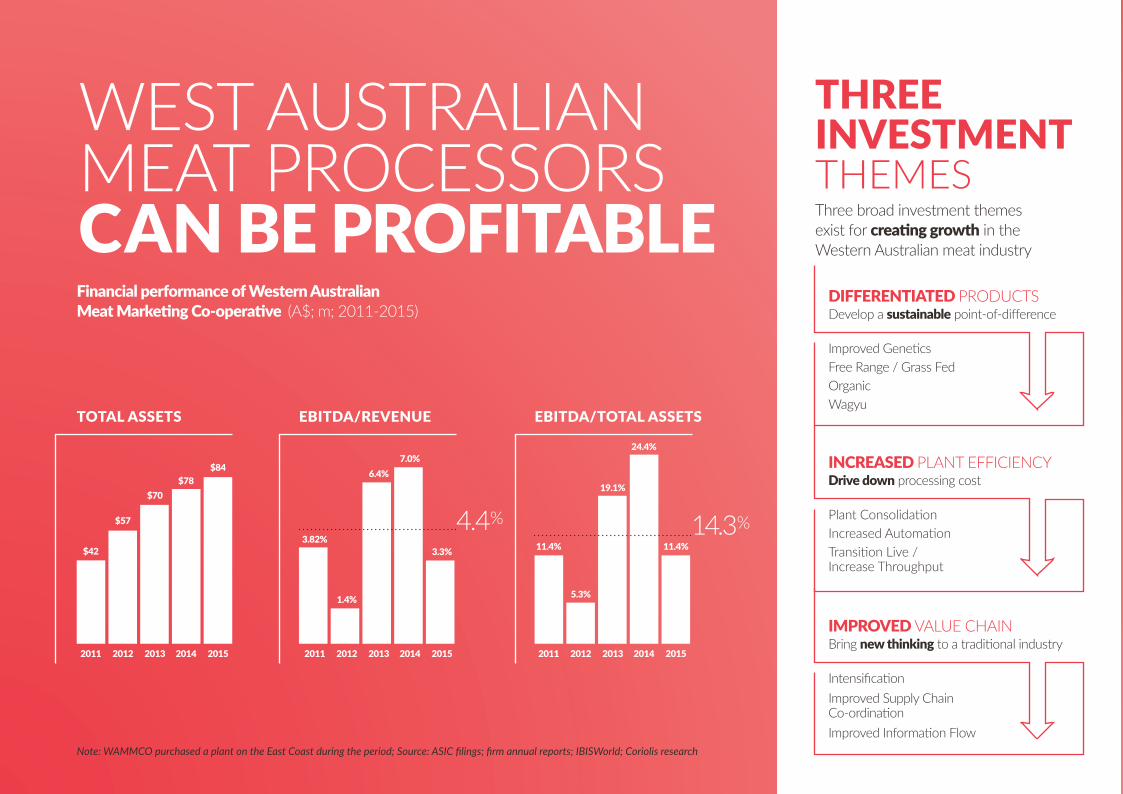
WEST AUSTRALIAN MEAT PROCESSORS CAN BE PROFITABLEFinancial performance of Western Australian Meat Marketing Co-operative (A$; m; 2011-2015)
Note: WAMMCO purchased a plant on the East Coast during the period; Source: ASIC filings; firm annual reports; IBISWorld; Coriolis research
TOTAL ASSETS
2011
$42
2012
$57
2013
$70
2014
$78
2015
$84
EBITDA/REVENUE
2011
3.82%
2012
1.4%
2013
6.4%
2014
7.0%
2015
3.3%
4.4%
EBITDA/TOTAL ASSETS
2011 2012 2013 2014 2015
11.4%
5.3%
19.1%
24.4%
11.4%14.3%
Three broad investment themes exist for creating growth in the Western Australian meat industry
THREE INVESTMENT THEMES
Improved GeneticsFree Range / Grass FedOrganicWagyu
DIFFERENTIATED PRODUCTSDevelop a sustainable point-of-difference
Plant ConsolidationIncreased AutomationTransition Live / Increase Throughput
INCREASED PLANT EFFICIENCYDrive down processing cost
IntensificationImproved Supply Chain Co-ordinationImproved Information Flow
IMPROVED VALUE CHAINBring new thinking to a traditional industry

RETURNS ACROSS THE SUPPLY CHAIN
Source: Coriolis analysis
WA SLAUGHTER LAMB FARM OPERATORS 2 POST FARM GATEWA LAND1
2.0%GROWTH
WA BEEF FARM OPERATORS 2
8.4%RATE OF RETURN
2016 WA
4.6%RETURN
2016 WA
15.5%RATE OF RETURN
2016 WA TOP 25%
10%RETURN
2016 WA TOP 25%
5% 20%RETURN RETURN
AVERAGE RETURNS 3
1. Planfarm Bankwest Benchmarks 2015-2106 – Broadacre farms – average 6yr land value change (2010-2015)2. ABARES/MLA Farm survey Rate of returns including capital appreciation, average 5yr; Top 25% by rate of return3. Annual reports; Interviews; industry averages EBITA/TA; includes manufacturing and live across species
Western Australian high performing farms are showing strong returns

The Chief Executive Officer of the Department of Primary Industries and Regional Development and the State of Western Australia and their employees and agents (collectively and individually referred to below as DPIRD) accept no liability whatsoever, by reason of negligence or otherwise, arising from any use or release of information in this report or any error, inaccuracy or omission in the information.DPIRD does not make any representations or warranties about its quality, accuracy, reliability, currency, completeness or suitability for any particular purpose. Before using the information, you should carefully evaluate these things.The information is general in nature, is not tailored to the circumstances of individuals or businesses, and does not constitute financial, taxation, legal, business or management advice. We recommend before making any significant financial or business decisions, you obtain such advice from appropriate professionals who have taken into account your individual circumstances and objectives.The information in this report should not be presumed to reflect or indicate any present or future policies or decisions by the Government of Western Australia.
Courtney Draper Director Trade and Industry Development Agriculture and Food Department of Primary Industries and Regional Development3 Baron-Hay Court, South Perth WA 6151T +61 (0)8 9363 4178 | M +61 (0)475 809 395 E [email protected] | W dpird.wa.gov.au
Nijaz (Neeaz) Brkich Business Development Manager Agribusiness & Food Investment Department of Primary Industries and Regional DevelopmentLevel 7, 140 William Street | Perth WA 6000T +61 (0)8 6552 2087 | M +61 (0)458 076 789E [email protected] | W dpird.wa.gov.au
For further information please contact: