were the projections of a physician surplus wrong? if so
TRANSCRIPT

Were the Projections of a Physician Surplus Wrong? If so, Why?andCan we Learn From our Mistakes?
Edward SalsbergAssociate Vice President Director, Center for Workforce StudiesAssociation of American Medical Colleges
Presentation to:
Health Care Workforce Issues for the 21st Century The 14th Princeton Conference
Princeton, New JerseyMay 23, 2007
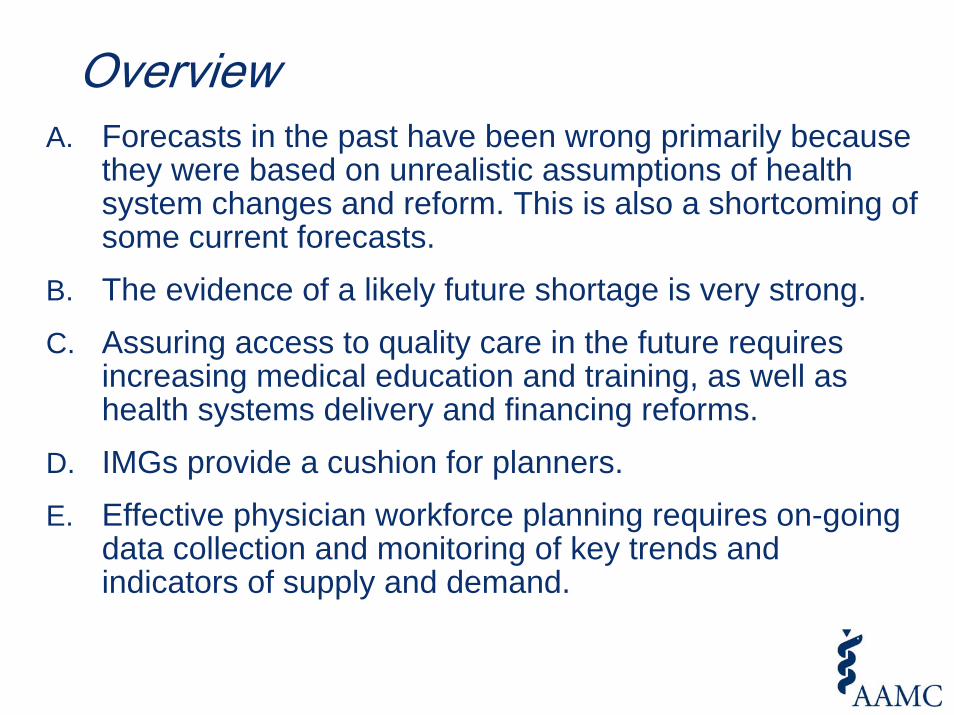
OverviewA. Forecasts in the past have been wrong primarily because
they were based on unrealistic assumptions of health system changes and reform. This is also a shortcoming of some current forecasts.
B. The evidence of a likely future shortage is very strong. C. Assuring access to quality care in the future requires
increasing medical education and training, as well as health systems delivery and financing reforms.
D. IMGs provide a cushion for planners.E. Effective physician workforce planning requires on-going
data collection and monitoring of key trends and indicators of supply and demand.

Effective Physician Workforce Forecasting: Some General Observations
Goal: inform decision makers of potential futures and the factors likely to influence the adequacy of the future supply to meet needsComponents of effective planning:
1. Data and analytical work2. Identification and modeling of possible futures3. Translating data and findings into policy
In our economy and political system, the market adjusts, making it unlikely that predictions of major surpluses or major shortages will be correct but that doesn’t mean forecasts are unimportant
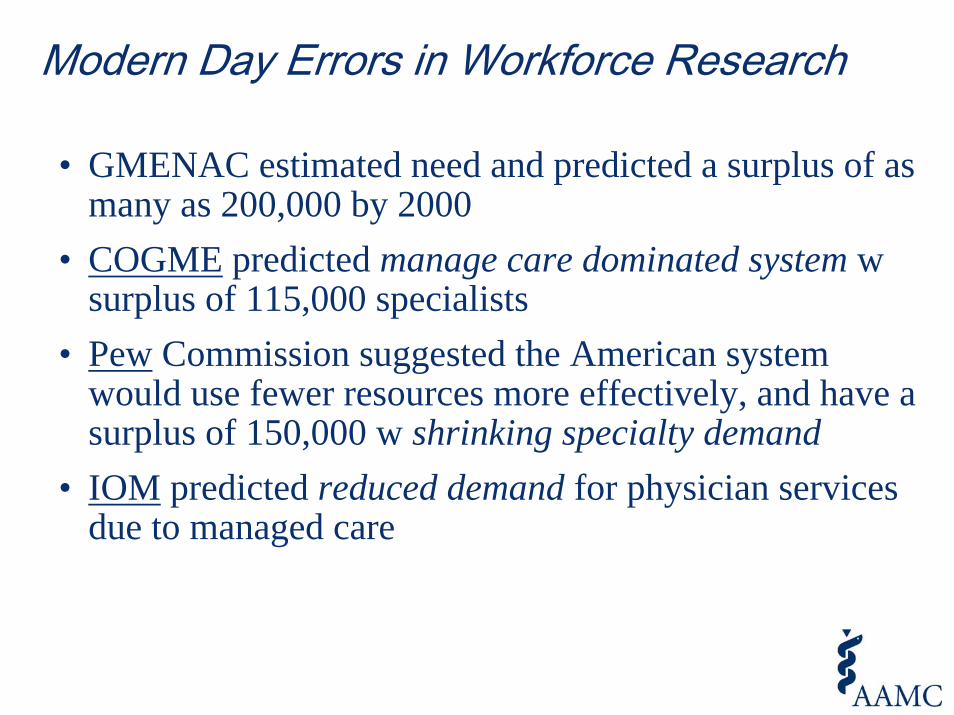
Modern Day Errors in Workforce Research
• GMENAC estimated need and predicted a surplus of as many as 200,000 by 2000
• COGME predicted manage care dominated system w surplus of 115,000 specialists
• Pew Commission suggested the American system would use fewer resources more effectively, and have a surplus of 150,000 w shrinking specialty demand
• IOM predicted reduced demand for physician services due to managed care

Errors Occurred When:1. “Needs” based projections were used, assuming
utilization rates which were not reflective of reality or which changed over time
2. Projections incorporated assumptions about how the US system would drastically change to control costs and utilization
3. Projections were based on someone’s vision of what the health care system should look like or best case scenario for the future
4. The goal was to use the physician workforce to force health systems changes
5. The inappropriate application of health services research findings to workforce planning

What the Data Tells Us Today
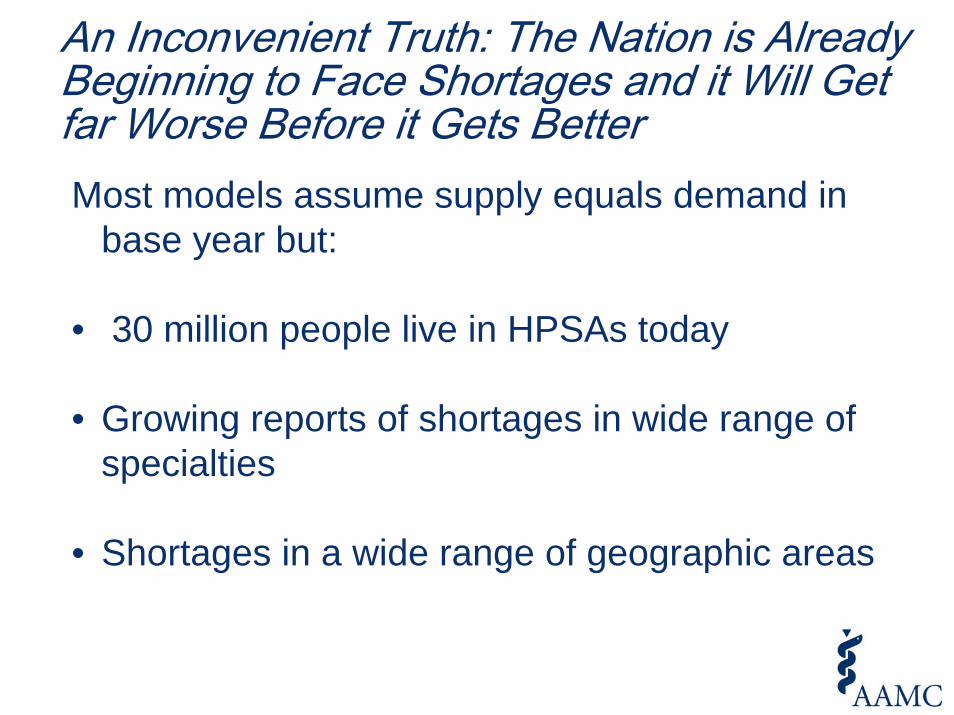
An Inconvenient Truth: The Nation is Already Beginning to Face Shortages and it Will Get far Worse Before it Gets BetterMost models assume supply equals demand in
base year but:
• 30 million people live in HPSAs today
• Growing reports of shortages in wide range of specialties
• Shortages in a wide range of geographic areas
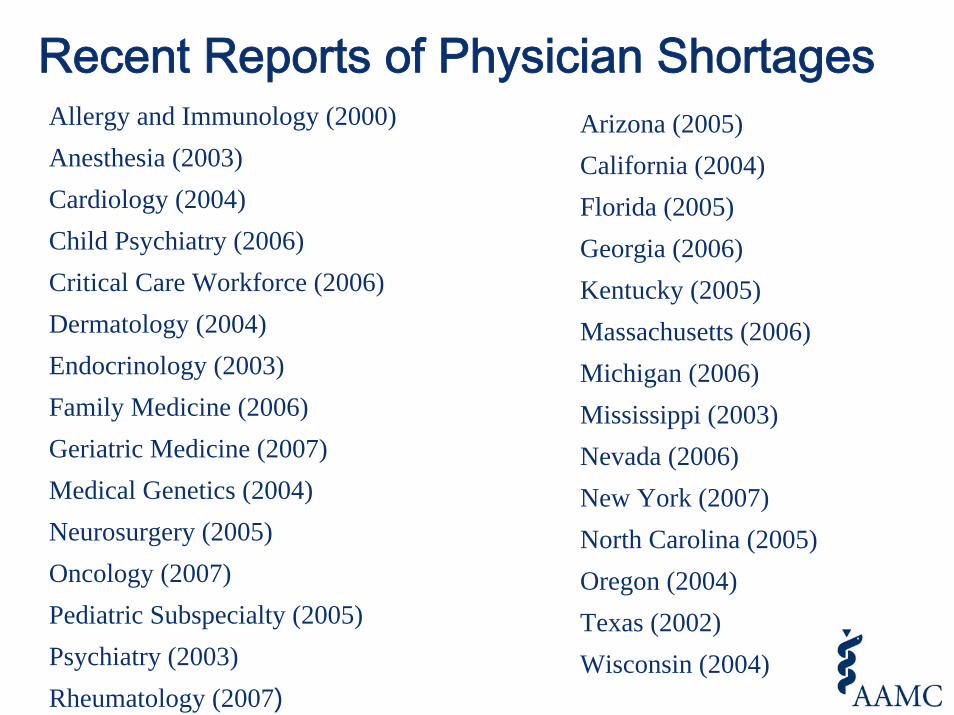
Recent Reports of Physician ShortagesAllergy and Immunology (2000)Anesthesia (2003)Cardiology (2004)Child Psychiatry (2006)Critical Care Workforce (2006)Dermatology (2004)Endocrinology (2003)Family Medicine (2006)Geriatric Medicine (2007)Medical Genetics (2004)Neurosurgery (2005)Oncology (2007) Pediatric Subspecialty (2005) Psychiatry (2003)Rheumatology (2007)
Arizona (2005)California (2004)Florida (2005)Georgia (2006)Kentucky (2005)Massachusetts (2006)Michigan (2006)Mississippi (2003)Nevada (2006)New York (2007)North Carolina (2005)Oregon (2004)Texas (2002)Wisconsin (2004)

Drivers of Future Demand for Physicians• Population growth
US Pop Growing by 25 million/decade
• Aging of the populationOver 65 will double 2000-2030Over 65 make twice as many physician visits as under 65Major illness/chronic illness far more prevalent among the elderly
• Public expectationsBaby boom generation: high resources and expectations
• Life Style factors Rates of obesity, diabetes, etc. rising rapidly
• Economic growth of the nation • Medical advances

Drivers of Future Supply• Doubling of medical school enrollment from 1960 to 1980 then flat for 25
years
• Aging of physician workforce & retirement 250,000 active physicians over 55Number retiring each year is rising rapidly
• Gender and generational differences Female physicians are more likely to have family responsibilities and to work fewer life time hours in medicineYounger physicians highly value personal life
• International migration and IMG policiesConcern with brain-drain/competing opportunitiesIncrease in US citizens attending schools outside US
• Residency training positions key factor in future supply

Without an Increase in Medical School Capacity, Continuation of IMGs, and an Expansion of GME the Nation’s Total Physician Supply Will Decrease
-
100,000
200,000
300,000
400,000
500,000
600,000
700,000
800,000
900,000
2006 2009 2012 2015 2018 2021 2024
Year
Tota
l Act
ive
Phys
icia
ns (e
xcl.
resi
dent
s)
New MDs (16,000/yr) and DOs (3,000/yr)
New IMGs (5,000/yr)
2006 Cohort
Expanded US capacity
…while per capita utilization will increase
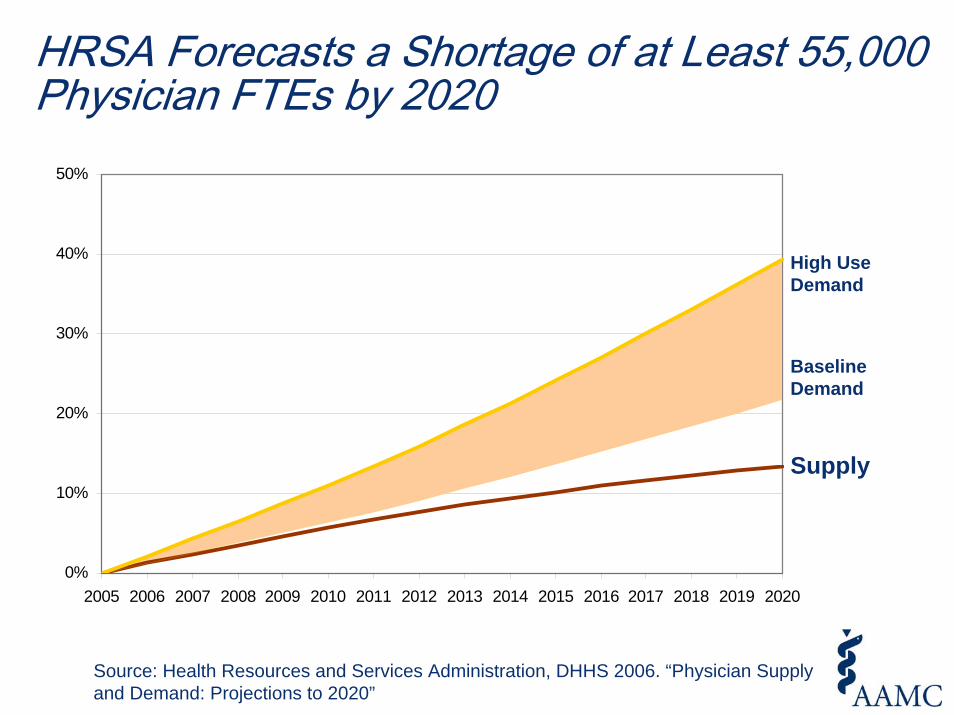
HRSA Forecasts a Shortage of at Least 55,000 Physician FTEs by 2020
Source: Health Resources and Services Administration, DHHS 2006. “Physician Supply and Demand: Projections to 2020”
13%
22%
39%
0%
10%
20%
30%
40%
50%
2005 2006 2007 2008 2009 2010 2011 2012 2013 2014 2015 2016 2017 2018 2019 2020
High Use Demand
Supply
Baseline Demand

Expansion of UME and GME Will Not Meet All of Future Demand: Still Need System Improvements and Changes
MD Expansion
DO Expansion
Remaining Shortfall
-
20,000
40,000
60,000
80,000
100,000
120,000
140,000
160,000
2005 2010 2015 2020 2025 2030
Year
FTE Ph
ysicians
(exc
l. reside
nts)

Common Challenges to our Findings: Right Directions…Wrong Conclusions
1. If we eliminate unnecessary and marginally beneficial services and/or improve efficiency we would not face a shortage
2. The total supply is adequate, the problem is mal-distribution by specialty and area; if we re-distribute physicians then we will not have a shortage
3. Life style and genetics contribute more to health and, therefore, physicians do not contribute significantly to improved health
4. If we focus more on prevention then we will not need more doctors
5. While not said, often implied: A major shortage will force improved efficiencies and will be good for the nation

Variation as Workforce Methodology?
0.2
1.0
4.0
HipHipFractureFracture
(13.8)(13.8)
KneeKneeReplacementReplacement
(55.0)(55.0)
HipHipReplacementReplacement
(67.2)(67.2)
BackBackSurgerySurgery
(93.6)(93.6)
Assumes that more is alwaysworse…
…and that less is
alwaysbetter
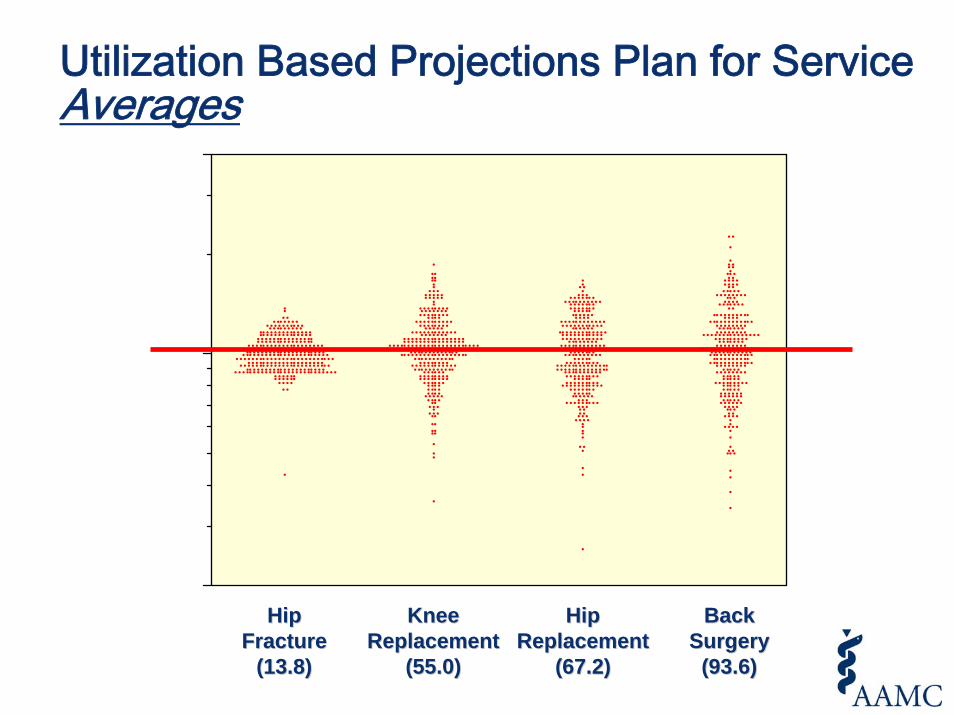
Utilization Based Projections Plan for Service Averages
0.2
1.0
4.0
HipHipFractureFracture
(13.8)(13.8)
KneeKneeReplacementReplacement
(55.0)(55.0)
HipHipReplacementReplacement
(67.2)(67.2)
BackBackSurgerySurgery
(93.6)(93.6)

An example of an appropriate workforce study: The Oncology Study - Baseline S/D based on existing patterns; scenarios explore alternate futures
DEMAND
ED
SUPPLY
35
40
45
50
55
60
2005 2010 2015 2020
Tota
l Ann
ual V
isits
(in m
illio
ns)
Baseline Estimates - assume current incidence/prevalence and utilization ratesSupply - visit capacity of projected supply of physiciansDemand - demand for visits based on projected number of cancer incidence and prevalent cases
Scenarios - Explore alternate care modelsD - Increase in use of Hospice for cancer patients that die of cancer Max (20% reduction ) E - Increase in use of PCPs to see prevalent cases Min (10% reduction in prevalent cases that see oncologists)
Translating the AAMC Analysis into Policy
• Increase medical school enrollment• Increase GME positions• Press for health system improvements, such as
improved IT, increased use of NPs and PAs

Meeting Future Needs Will Require GME Growth and Continued Participation of DOs and IMGs
What if we are wrong?• The IMG cushion
6,500 new IMGs enter GME and the health care system every yearIf demand does not rise as expected, reduce IMGs and/or require non-US IMGs to return to country of originFailure to increase US MDs and DOs will likely lead to a greater dependency on IMGs

Growth in UME Alone Without an Expansion of GME is Likely to Displace IMGs in Training but Will Not Expand the Physician Supply
Physician Workforce Planning in an Imperfect Health Care System• Monitoring of key trends and indicators with on-going
data collection• Periodic comprehensive assessments of supply and
demand using the most current data • Studies to better understand dynamics of supply,
demand and distribution• Studies assessing the relationship of workforce inputs
and health outcomes• Build models on the world that exists and scenarios on
what is desired and possible• Inform decision makers of alternative futures and
factors that may influence
