welcome to the sap business one on hana release 9.1 delta ...sapidp/012002523100014982292014…most...
TRANSCRIPT

Welcome to the SAP Business One on HANA release 9.1 delta training oncreating advanced dashboards. An advanced dashboard is a type ofsupplementary cockpit that is launched from the context menu of a pervasivedashboard or by clicking on a key performance indicator widget in a user’s maincockpit. It contains a set of pages with additional pervasive dashboards and keyperformance indicators. Advanced dashboards are an entirely new featureavailable in release 9.1.
1
In this course you will learn how to design an advanced dashboard, how to set up filtersfor an advanced dashboard and how to launch an advanced dashboard from adashboard widget or key performance indicator widget in a user’s cockpit.
Please note that only users with the premium analytics license can view advanceddashboards.

In release 9.1, you can create supplementary cockpits (called advanced dashboards) todisplay critical data grouped together in dedicated pages, for example to display datarelated to a pervasive dashboard or a key performance indicator (also known as a KPI).
When a user launches an advanced dashboard from a pervasive dashboard or KPIwidget in their Fiori-style cockpit, they gain quick access to extended business analyticsin multiple related charts and through KPIs related to the original widget.
In this way, advanced dashboards provide additional insight to the analytics associatedwith dashboards and KPIs.
3
The sales manager at OEC Computers needs detailed analysis to understandwhat is driving his performance metrics.
He would like to be able to open a supplementary cockpit to provide additionalinsight into the business figures behind the KPIs and dashboards in his cockpit.

In this course, we will see how to build an advanced dashboard for sales statisticslike the one shown here.This sales advanced dashboard will contain two pages of analytics, one forcustomer statistics and one for item statistics.
The advanced dashboard will be set up as an action for a key performanceindicator widget. The user can open the advanced dashboard by clicking on theKPI widget.
When the advanced dashboard opens, they will see a page for item statisticscontaining two pervasive dashboards, one for the top 5 best selling items and onedisplaying revenue versus gross profit for the last 6 months. The user can toggleto a customer statistics page which displays a pervasive dashboard on opportunitystatus and one ranking customers by the percentage of opportunities, a KPIshowing total sales, and a pervasive dashboard of top customers by salesamount.
5

In our business example, the sales manager has asked for an advanceddashboard that displays sales analytics for items and customers.
On a page associated with sales analytics for items, he would like to see two salespervasive dashboards that show the top 5 best selling items and an analysis of therevenue versus gross profit.
He also like a page with sales analytics for customers that shows the opportunitystatus by customer and the percentage of opportunities by customer, a keyperformance indicator showing the total sales amount and a pervasive dashboardwith the top 5 customers by sales amount.
Most of these widgets are ones that are shipped with SAP Business One. Thetwo pervasive dashboards displaying opportunity statistics are user-defined.These two pervasive dashboards are created in the business examples of thedelta topic Adding Actions to Dashboards.
6

You can use the Pervasive Analytics Designer to create or edit advanceddashboards that you have created.
When you open the Pervasive Analytics Designer, you will see a list of all existingadvanced dashboards in the My Advanced Dashboards section.
To create a new advanced dashboard, begin by choosing New AdvancedDashboard button.
Please note that only users with authorization for the Query Manager have accessto the Pervasive Analytics Designer.
7

After choosing New Advanced Dashboard, an area resembling a blank cockpitappears. This is an empty advanced dashboard.The first step is to give the advanced dashboard a name. In our example, we willcall it “Sales”.The second step is to name the first page. In our case, we call the page “Items”.Then we can begin adding widgets to the page.Three design icons are on the top right corner of the Advanced Dashboard page.These are:
The Add Widgets icon, which opens the Widget GalleryThe Save icon, andThe Filter Settings icon, which allows you to add filters to the widgets on theadvanced dashboard.
8

We choose widgets for an advanced dashboard in much the same way we choosethem for a cockpit. Open the Widgets Gallery to see the available widgets.
We can add two types of widgets to an advanced dashboard: PervasiveDashboards and Key Performance Indicators.
We can search for a widget by name in the Search field or use the dropdown tonarrow the selection of widgets by type.
Once we find a widget we want, we choose the plus icon below the widget. Afterchoosing widgets, we use the back arrow to return to the advanced dashboardpage.
9
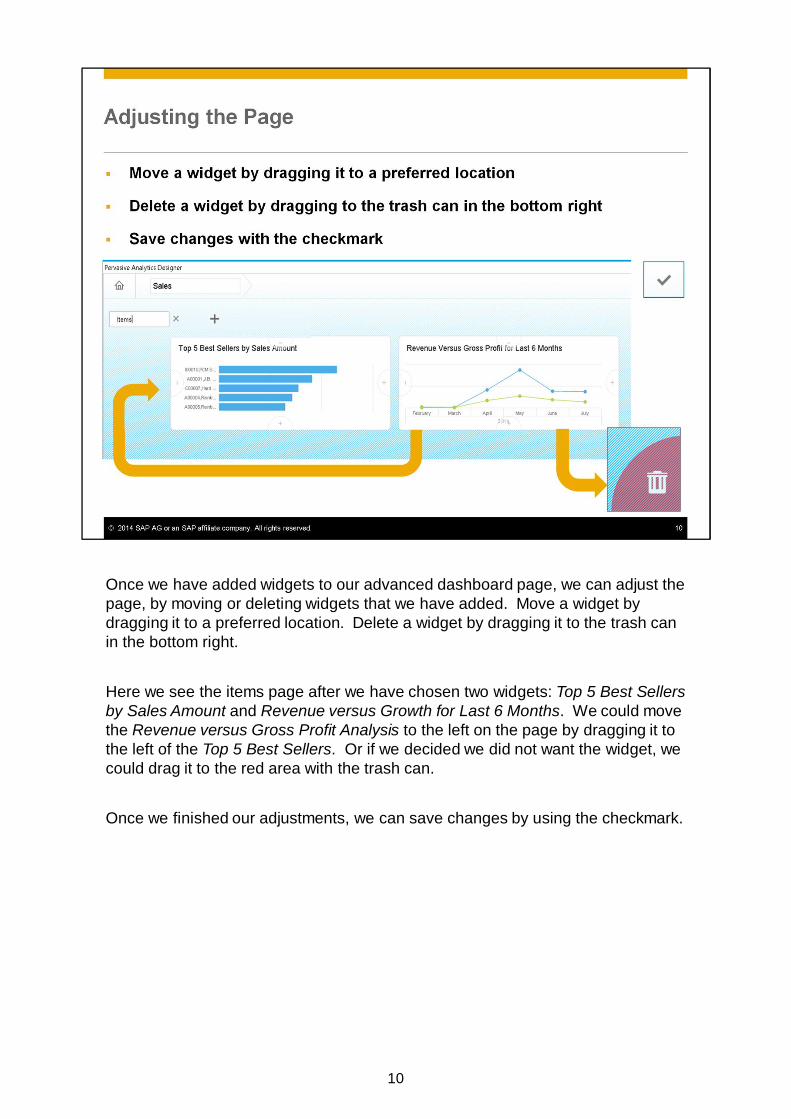
Once we have added widgets to our advanced dashboard page, we can adjust thepage, by moving or deleting widgets that we have added. Move a widget bydragging it to a preferred location. Delete a widget by dragging it to the trash canin the bottom right.
Here we see the items page after we have chosen two widgets: Top 5 Best Sellersby Sales Amount and Revenue versus Growth for Last 6 Months. We could movethe Revenue versus Gross Profit Analysis to the left on the page by dragging it tothe left of the Top 5 Best Sellers. Or if we decided we did not want the widget, wecould drag it to the red area with the trash can.
Once we finished our adjustments, we can save changes by using the checkmark.
10

You can also change the size of the pervasive dashboards widgets displayed inthe advanced dashboard by choosing the plus or minus symbols.
11

An advanced dashboard can contain multiple pages.When we choose the Add New Page icon, another blank page opens with a boxfor the page title.Give the new page a name and start adding widgets to the new page.In our example, we create a second page called “Customers”. We will addcustomer-related analytics to this page.At any point, we can rename the pages by typing a new title in the box or delete apage by clicking on the X to the right of the page name.
12

Now that we have created an advanced dashboard, we can set up how to launchthe dashboard. We can assign it as an action for a KPI or pervasive dashboardwidget.
In our business case, we would like to be able to open the advanced dashboardfrom the Net Sales Revenue KPI. We open the KPI in the Pervasive AnalyticsDesigner and choose the option to create a new action. We give the action aname and choose our advanced dashboard for sales as shown in the graphicabove.
More information on setting up actions is discussed in the delta topic Add Actionsto Dashboards.
13
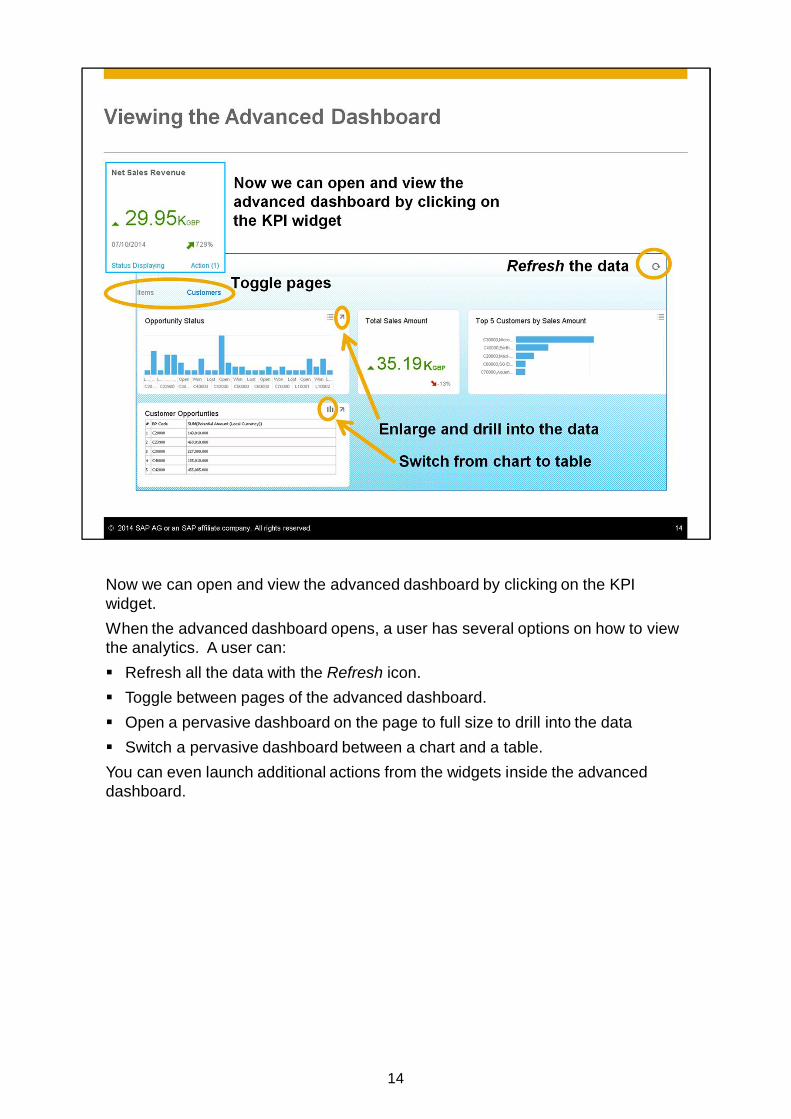
Now we can open and view the advanced dashboard by clicking on the KPIwidget.When the advanced dashboard opens, a user has several options on how to viewthe analytics. A user can:
Refresh all the data with the Refresh icon.Toggle between pages of the advanced dashboard.Open a pervasive dashboard on the page to full size to drill into the dataSwitch a pervasive dashboard between a chart and a table.
You can even launch additional actions from the widgets inside the advanceddashboard.
14

The advanced dashboard we created does not currently have any filters so alldata is displayed in each widget.
We also have the option to filter the data based on the context of the dashboard orKPI where we launch the advanced dashboard.
15

In our example, the manager would also like to launch our new advanceddashboard from a pervasive dashboard showing the top 5 customers by salesamount. Currently we only have our advanced dashboard set up to open from aKPI. To do this we will add an action to open our advanced dashboard from theTop 5 Customer by Sales Amount widget.
The manager would like the advanced dashboard to be filtered based on thecustomer whose results he is viewing.
When he right-clicks on a column representing a customer in , he would like tofilter the advanced dashboard widgets’ data for that customer.
Imagine that we have set up a filter based on the customer field. Here we see auser clicking on the bar showing sales for customer C30000. When they open theadvanced dashboard, the data is filtered to show only data for C30000.
16
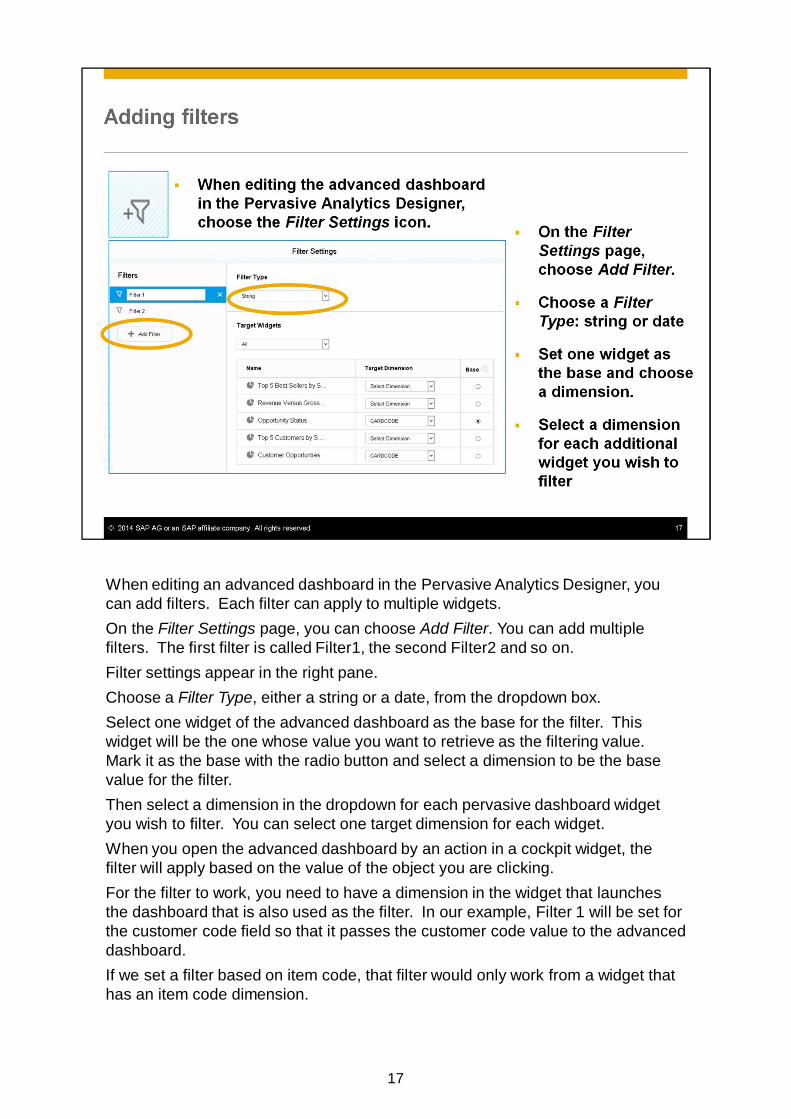
When editing an advanced dashboard in the Pervasive Analytics Designer, youcan add filters. Each filter can apply to multiple widgets.On the Filter Settings page, you can choose Add Filter. You can add multiplefilters. The first filter is called Filter1, the second Filter2 and so on.Filter settings appear in the right pane.Choose a Filter Type, either a string or a date, from the dropdown box.Select one widget of the advanced dashboard as the base for the filter. Thiswidget will be the one whose value you want to retrieve as the filtering value.Mark it as the base with the radio button and select a dimension to be the basevalue for the filter.Then select a dimension in the dropdown for each pervasive dashboard widgetyou wish to filter. You can select one target dimension for each widget.When you open the advanced dashboard by an action in a cockpit widget, thefilter will apply based on the value of the object you are clicking.For the filter to work, you need to have a dimension in the widget that launchesthe dashboard that is also used as the filter. In our example, Filter 1 will be set forthe customer code field so that it passes the customer code value to the advanceddashboard.If we set a filter based on item code, that filter would only work from a widget thathas an item code dimension.
17

When we open the advanced dashboard by right-clicking on a column for aparticular customer, we see data filtered for just that customer in the dashboardswhere we have applied the filter.
18
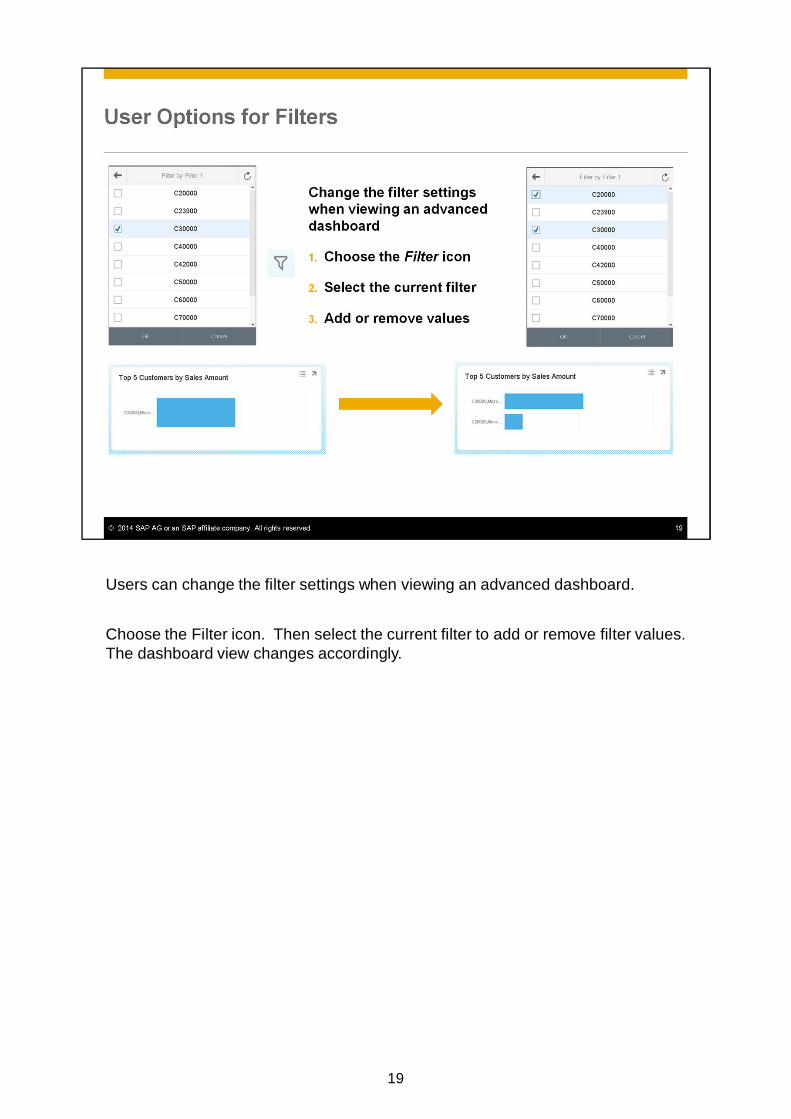
Users can change the filter settings when viewing an advanced dashboard.
Choose the Filter icon. Then select the current filter to add or remove filter values.The dashboard view changes accordingly.
19

You have seen how to create, edit and use advanced dashboards.Here are some key points to take away from this topic:
An advanced dashboard acts as a supplementary cockpit containing KPIs andpervasive dashboards.Users open advanced dashboards from an action in a KPI or dashboard widget.You can create advanced dashboards in the Pervasive Analysis Designer.You can set up filters for the advanced dashboard. The filtering value will be retrievedfrom the widget where you launch the advanced dashboard.Users can adjust the display of widgets and change the application of filters as theyview the widget. These changes are not permanent.

For more information on creating advanced dashboards, working with KPIs orPervasive Dashboards and setting up actions to launch from those widgets, seethe following references:
The Delta Course: Create Key Performance IndicatorsThe Delta Course: Add Actions to a Dashboard, and theHow-to-Guide: How to Work with Pervasive Analytics
For information using widgets in a cockpit, see:The Delta Course on the Role-Based Cockpit, and theHow to Guide: Working with the Fiori-style Cockpit

Thank you for your time.
22

23