welcome green manufacturing industrial consortium semi-annual meeting april 2, 2013 member...
TRANSCRIPT

WelcomeGreen Manufacturing Industrial Consortium
Semi-Annual MeetingApril 2, 2013
Member Companies:
Green Manufacturing Industrial Consortium Semi-Annual Member Update Meeting
WMU Parkview CampusApril 2, 2013
WelcomeAssociate Director’s Report
David Meade, Ph.D.

Welcome
• Thanks for attending• Visitors – potential members, and allies• Media – help us spread the word• Students – potential research team members• Members – engine behind the “consortium”

Our MissionThe Green Manufacturing Industrial Consortium (GMIC) has a three
part mission:1. To support advancement in manufacturing practice through
the creation of more energy efficient and environmentally benign processes and products while enhancing productivity and sustaining or increasing output.
2. To provide a forum for manufacturers to coordinate research and share results, while leveraging R & D funding, at the pre-competitive stage.
3. To engage engineering students in meaningful applied research activities aimed to enhance their value to future employers.
Pursuing Environmental, Energy, and Economic opportunities in partnership with Industry
Outline
• Membership Update• Current Status/Recruiting Efforts• Funding Update• Non-Member Projects
• Action Items• Updates from November• New Items

Membership Update
• Current Members: Fabri-Kal, Landscape Forms, Post, Steelcase and Polywood
• Recruiting/Marketing:– DENSO (Project underway)
– Continued correspondence with Haworth, Herman Miller, Cascade Engineering, Kellogg’s
– Continued Joint Marketing with the West Michigan E3 (MMTC)
– Participation in the Grand Rapids Manufacturers Council
– Participation in the GR based Zero Waste to Landfill User Group (ZWL)
– Invited Speaker at the Michigan Recycling Coalition Annual Meeting, May 7-9, 2013
– Invited Speaker at MiFood 2013-Food Processing & Agribusiness Summit May 16, 2013
– Continue to spread the word through media
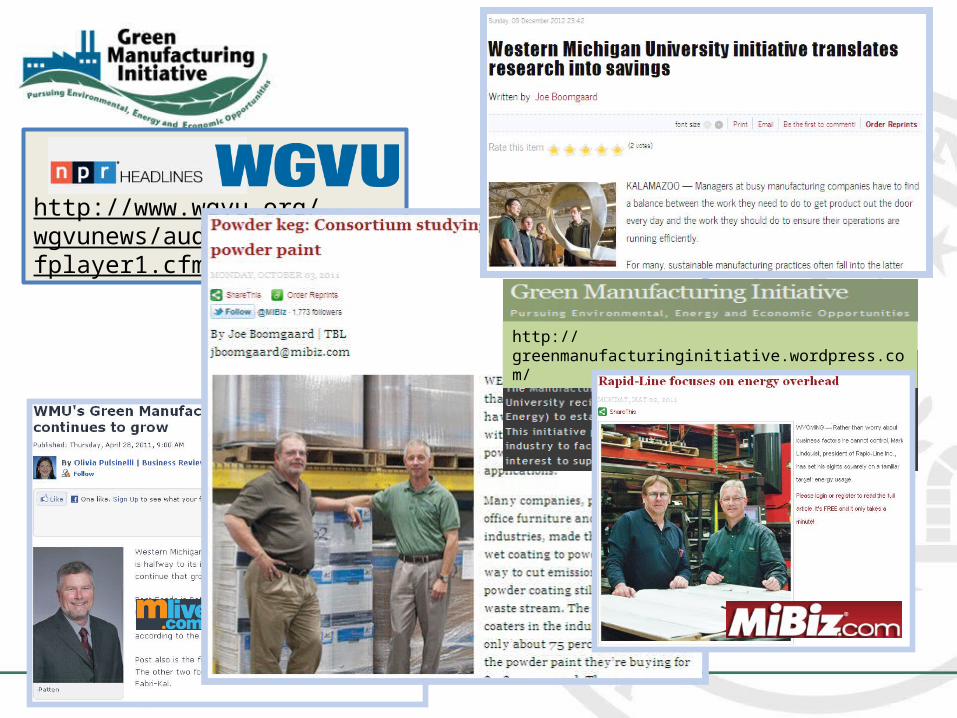
http://www.wgvu.org/wgvunews/audio/fplayer1.cfm?styid=14574
Media
http://greenmanufacturinginitiative.wordpress.com/

Partners
• Continue to joint market with the Manufacturing Technology Center (MMTC) EPA’s E3 Program (Economy, Energy, and Environment) in West Michigan (WM-E3)
• NEW - partnership with the Michigan Department of Environmental Quality (MDEQ) – Office of Environmental Assistance– Intern funding and technical resources from the
Retired Technical Assistance Program (RETAP)
8
$30,061.00
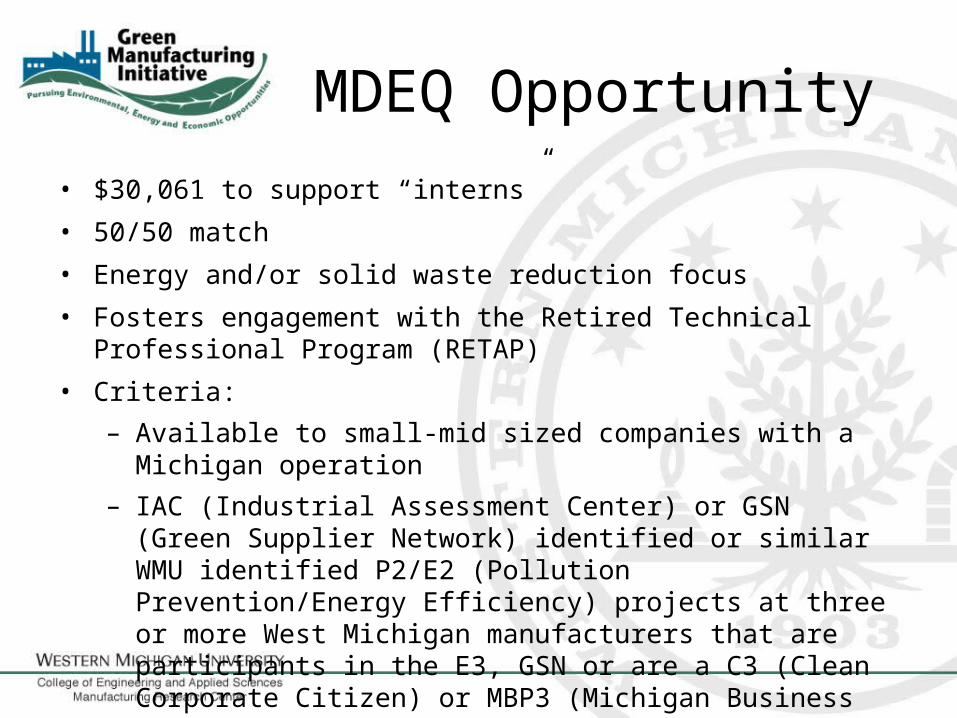
MDEQ Opportunity• $30,061 to support “interns”
• 50/50 match
• Energy and/or solid waste reduction focus
• Fosters engagement with the Retired Technical Professional Program (RETAP)
• Criteria:– Available to small-mid sized companies with a Michigan operation– IAC (Industrial Assessment Center) or GSN (Green Supplier Network)
identified or similar WMU identified P2/E2 (Pollution Prevention/Energy Efficiency) projects at three or more West Michigan manufacturers that are participants in the E3, GSN or are a C3 (Clean Corporate Citizen) or MBP3 (Michigan Business Pollution Prevention Partnership) program participant or supplier to such a company.
Action items from last update
• Continue to recruit members – need 1 additional to achieve critical mass financially but prefer 3+
• Complete Polywood Assessment Process and select first project
• Identify new projects for Fabri-Kal and Post• Continue progress on Steelcase and Landscape Forms
projects• GMIC Operational Planning in absence of DOE Funding• Continue to recruit team members and assemble
research teams to support new research projects

Questions?
Thank You

Agenda
Today’s Agenda
Polywood, Inc. Assessment Report
IntroductionColin Knue, Research Coordinator
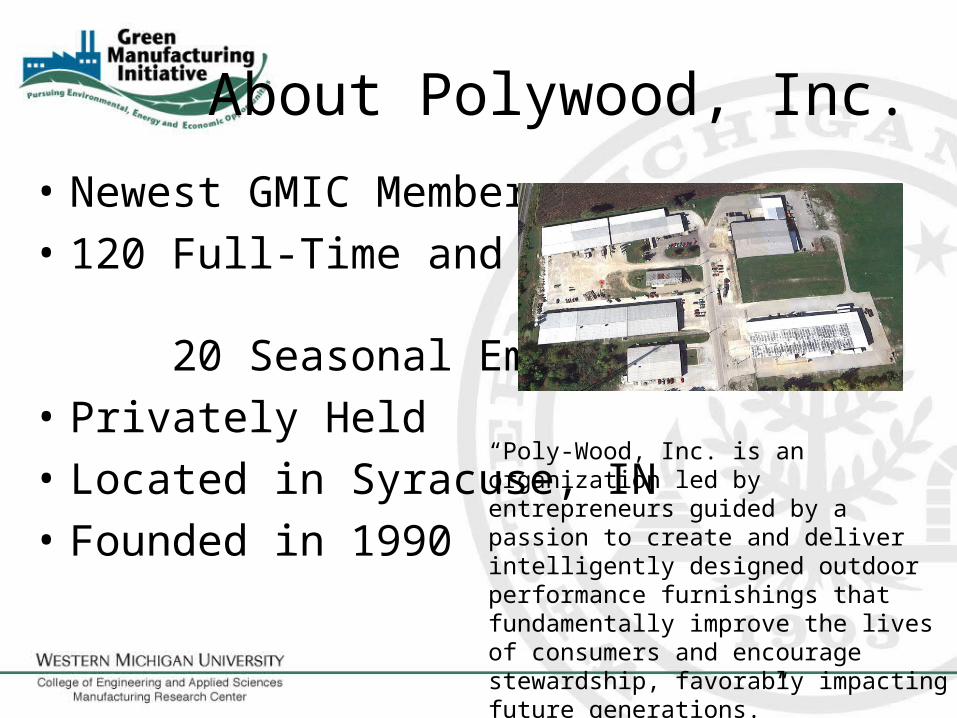
About Polywood, Inc.
• Newest GMIC Member• 120 Full-Time and
20 Seasonal Employees• Privately Held• Located in Syracuse, IN• Founded in 1990
“Poly-Wood, Inc. is an organization led by entrepreneurs guided by a passion to create and deliver intelligently designed outdoor performance furnishings that fundamentally improve the lives of consumers and encourage stewardship, favorably impacting future generations.” http://www.polywoodinc.com/our-company.html
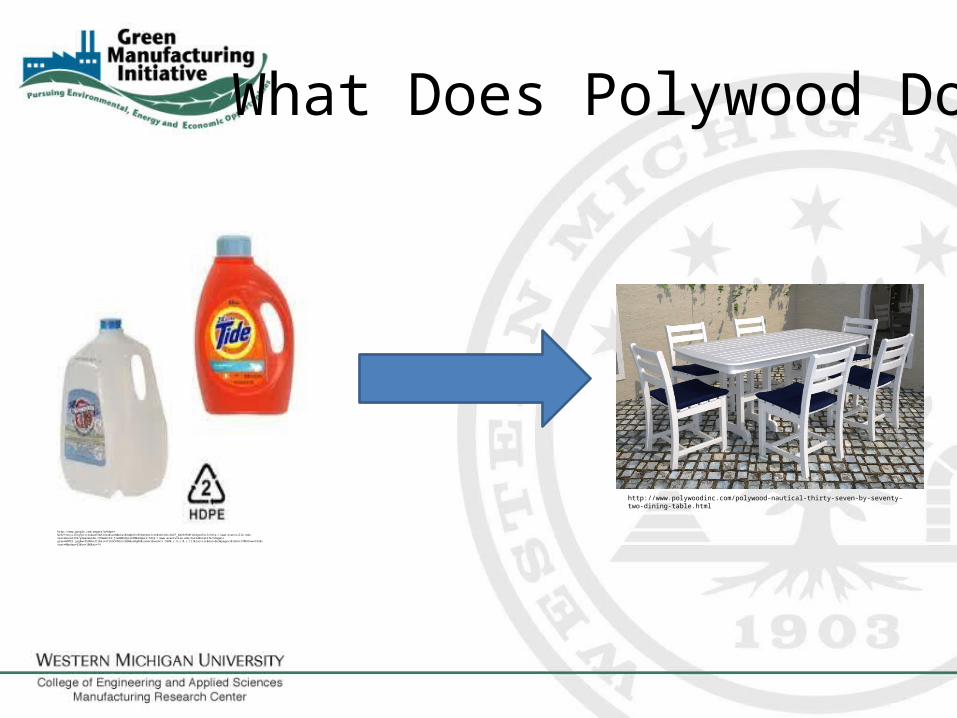
What Does Polywood Do?
http://www.polywoodinc.com/polywood-nautical-thirty-seven-by-seventy-two-dining-table.html
http://www.google.com/imgres?q=hdpe+%232+recycling+prices&um=1&hl=en&sa=N&biw=824&bih=921&tbm=isch&tbnid=zZwlF_XW2SXFeM:&imgrefurl=http://www.evansville.edu/residencelife/greenGuide.cfm&docid=j7edbNSHyLsP5M&imgurl=http://www.evansville.edu/residencelife/images/greenHDPE2.jpg&w=359&h=311&ei=vTJUUcPOGcn22QWAuoDgDA&zoom=1&ved=1t:3588,r:9,s:0,i:111&iact=rc&dur=563&page=1&tbnh=170&tbnw=192&start=0&ndsp=33&tx=106&ty=74

Polywood, Inc.Energy Assessment – Oven Heat Study
John Ihling, UnderErich Stuedemann
Ana Perez

Outline
• Current Operation• Energy Losses • Drying Oven• IR Oven• Curing Oven• Recommendations• Future Research
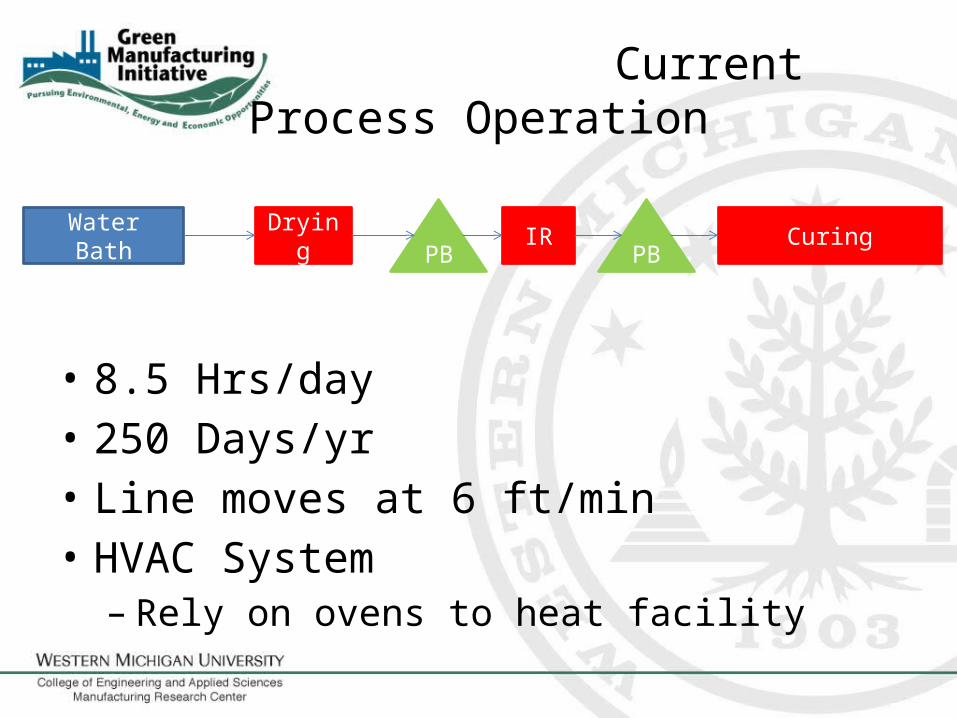
Current Process Operation
• 8.5 Hrs/day• 250 Days/yr• Line moves at 6 ft/min• HVAC System– Rely on ovens to heat facility
CuringIRDryingWater BathPB PB
Energy Losses
• Load Factor • Heating Air• Radiation Losses due to Opening• Radiation Losses through Walls• Convection/Conduction Losses• Future Calculations
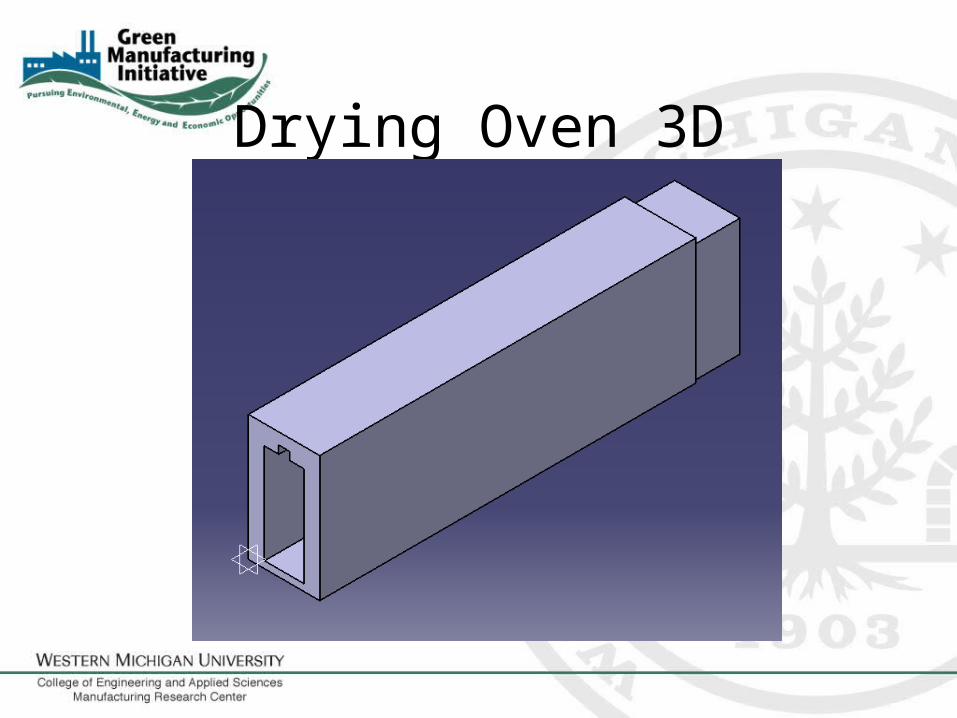
Drying Oven 3D

Drying Oven Operation
Section Side (°F) Top (°F) Internal Temp (°F)
1 82 84
220
2 91 983 133 1604 92 965 75 79
4 (ft) 4 (ft)15 (ft) 15 (ft)8 (ft)
1 2 3 4 5
Approx. Volume (ft3)
Air Flow Rate (lb/hr)
1550 350

Drying Oven Heat LossesHeat Loss Btu/hr CF/hr Cost ($/hr)
Heating Load n/a n/a n/a
Heating Air 15,480 15.0 $ 0.16Opening Radiation
Losses 4,030 3.9 $ 0.04
Wall Radiation Losses 7,030 6.8 $ 0.07
Convection/ Conduction 3,240 3.2 $ 0.03
Total 29,780 28.9 $ 0.30
Annual $ 637.50
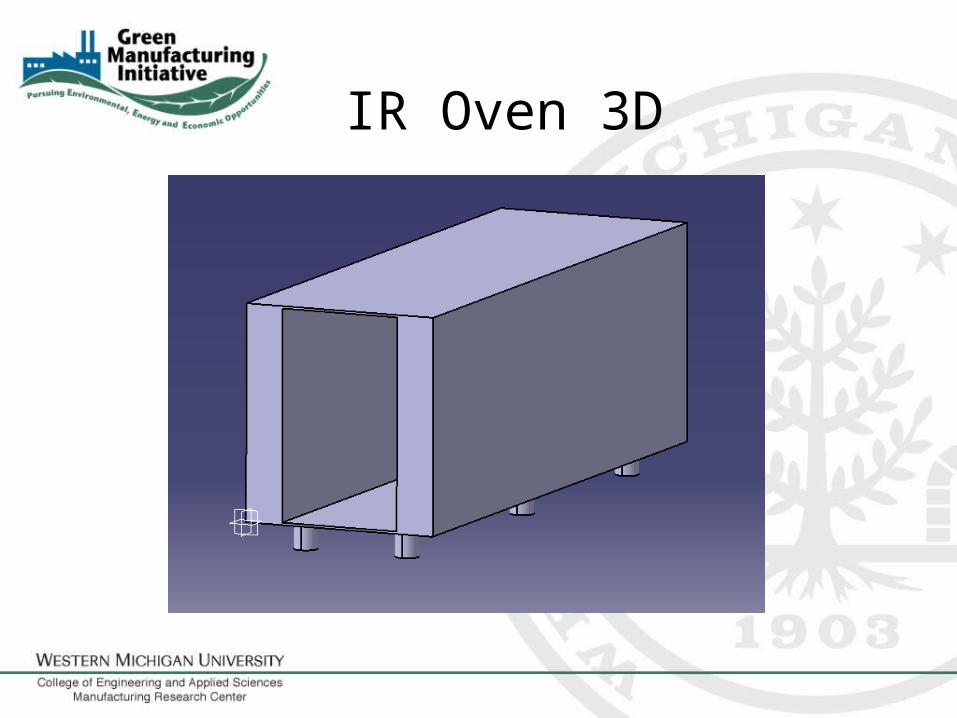
IR Oven 3D
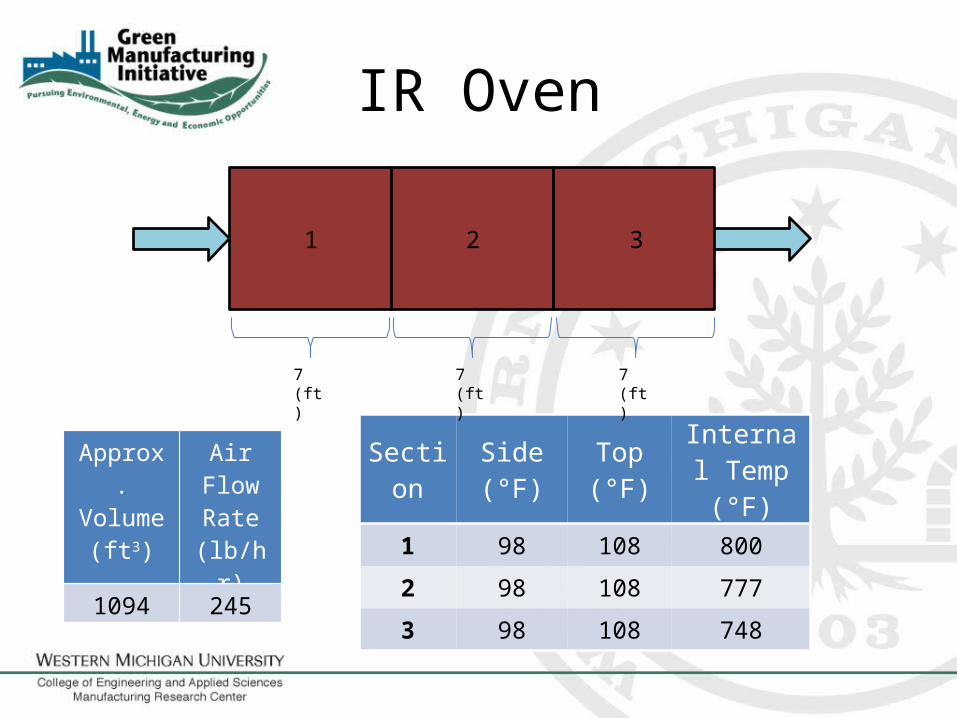
IR Oven
Section Side (°F) Top (°F) Internal Temp (°F)
1 98 108 800
2 98 108 777
3 98 108 748
7 (ft) 7 (ft) 7 (ft)
1 2 3
Approx. Volume
(ft3)
Air Flow Rate
(lb/hr)
1094 245

IR Oven Heat LossesHeat Loss Btu/hr kWh Cost ($/hr)
Heating Load n/a n/a n/a
Heating Air 41,640 12.20 $ 1.45
Opening Radiation Losses
179,750 52.68 $ 6.26
Wall Radiation Losses
4,450 1.30 $ 0.15
Convection/ Conduction
2,550 0.66 $ 0.08
Total 228,390 66.84 $ 7.94
Annual $ 16,900
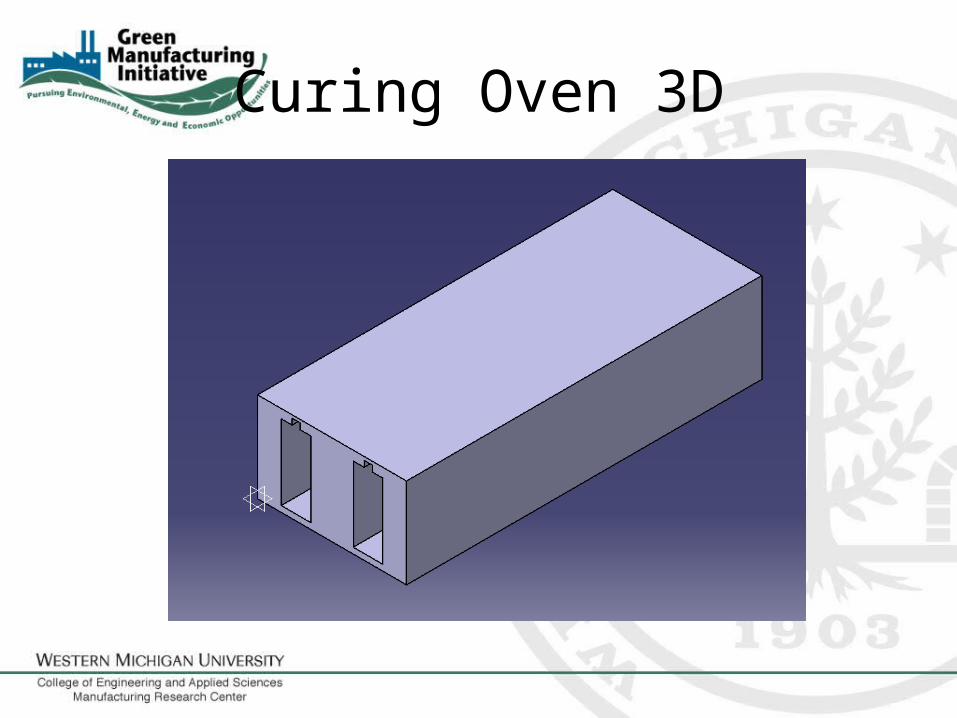
Curing Oven 3D
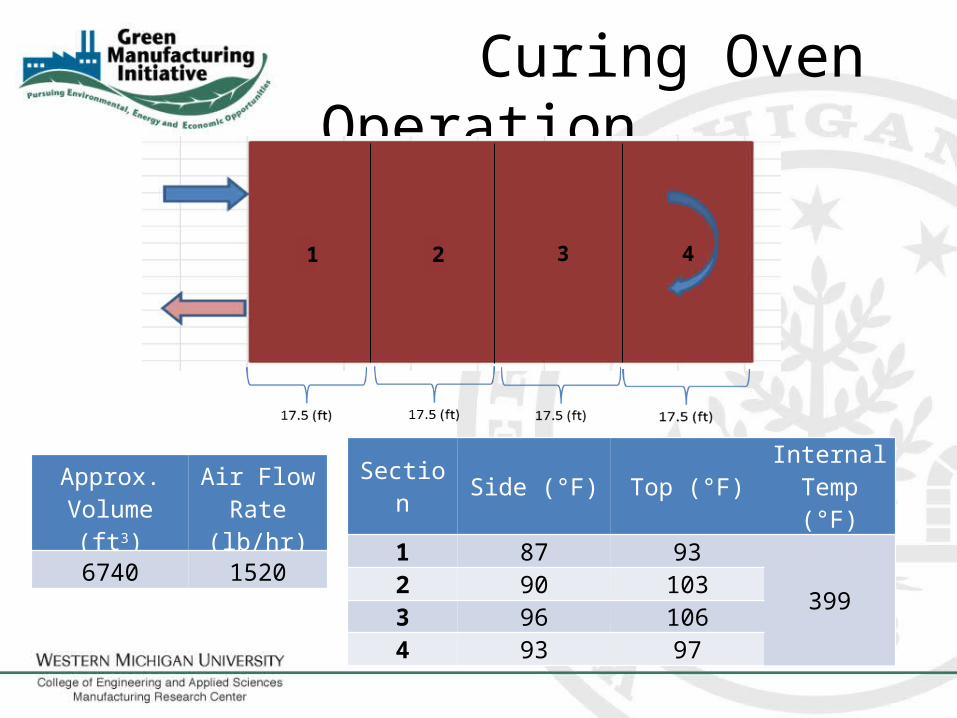
Curing Oven Operation
Section Side (°F) Top (°F) Internal Temp (°F)
1 87 93
3992 90 1033 96 1064 93 97
1 2 3 4
Approx. Volume (ft3)
Air Flow Rate (lb/hr)
6740 1520
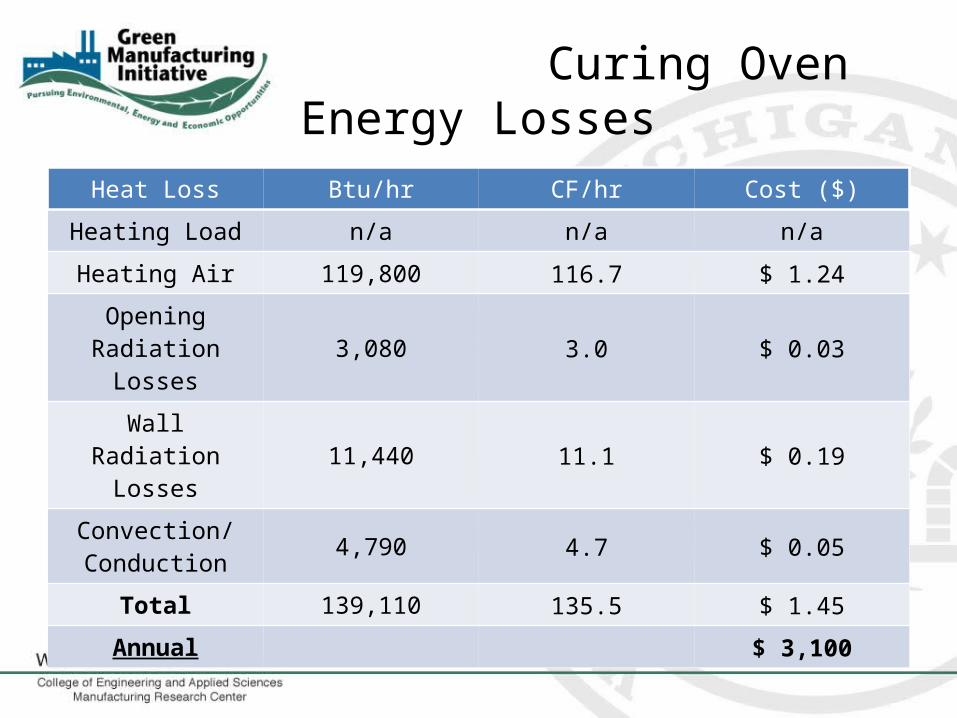
Curing Oven Energy Losses
Heat Loss Btu/hr CF/hr Cost ($)
Heating Load n/a n/a n/a
Heating Air 119,800 116.7 $ 1.24Opening Radiation
Losses 3,080 3.0 $ 0.03
Wall Radiation Losses 11,440 11.1 $ 0.19
Convection/ Conduction 4,790 4.7 $ 0.05
Total 139,110 135.5 $ 1.45
Annual $ 3,100
Recommendations
• Add silhouette to IR Oven– Reduces Radiation Losses through openings
• Install Gas flow meters– Will allow more accurate gas consumption
readings• Install Oven Temperature Controls– Provide accurate control of internal oven temps
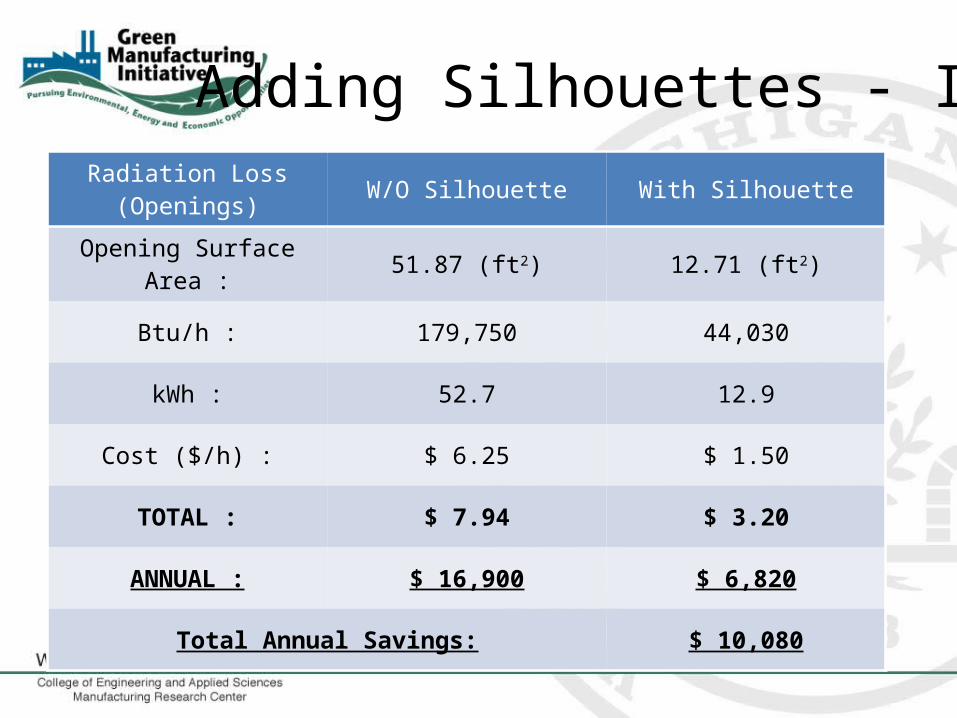
Adding Silhouettes - IRRadiation Loss (Openings) W/O Silhouette With Silhouette
Opening Surface Area : 51.87 (ft2) 12.71 (ft2)
Btu/h : 179,750 44,030
kWh : 52.7 12.9
Cost ($/h) : $ 6.25 $ 1.50
TOTAL : $ 7.94 $ 3.20
ANNUAL : $ 16,900 $ 6,820
Total Annual Savings: $ 10,080
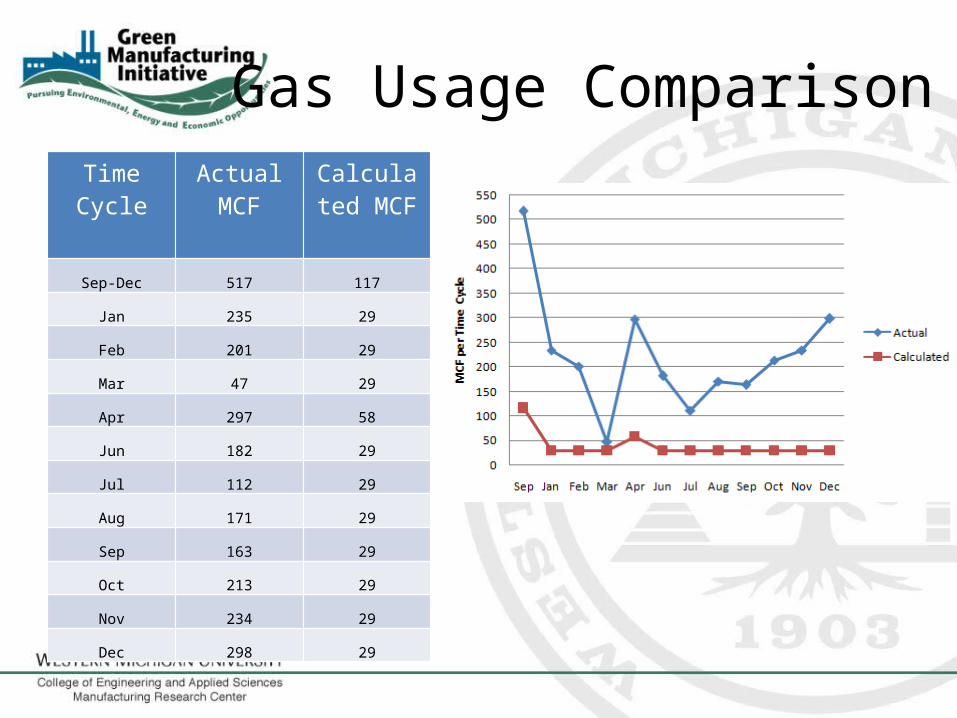
Gas Usage ComparisonTime Cycle Actual
MCFCalculated
MCF
Sep-Dec 517 117
Jan 235 29
Feb 201 29
Mar 47 29
Apr 297 58
Jun 182 29
Jul 112 29
Aug 171 29
Sep 163 29
Oct 213 29
Nov 234 29
Dec 298 29
Future Projects
• Insulation– Reduces Radiation, Conduction, and Convection
through the walls• Cost-Benefit Analysis of IR vs Gas Ovens• Cost-Benefit Analysis of Catalytic IR vs Electric
IR Ovens• Energy Losses Due to Load Factor and Oven
Seams• Thorough investigation of the Gas Ovens

COMMENTS AND QUESTIONS?
THANK YOU!

POLYWOOD, Inc.Waste Disposal and Regrind Assessment
Nathan Christensen, Graduate Assistant, Mfg.E.
Nathan Bowen, Undergraduate Assistant, M.E.
Overview
• Waste Disposal and Regrind– current state– recommendations and considerations– investment and return overview– Q & A
WASTE DISPOSAL Minimizing disposal fees by investing in waste collection equipment
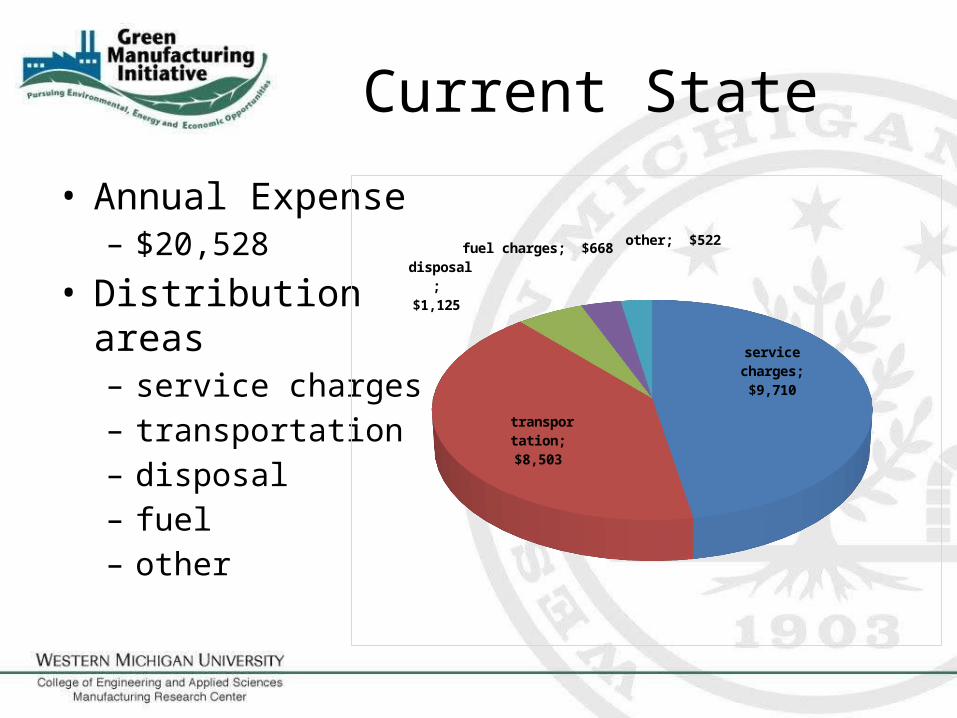
Current State
• Annual Expense– $20,528
• Distribution areas– service charges– transportation– disposal– fuel– other
service charges; $9,710
trans-portation;
$8,503
disposal; $1,125
fuel charges; $668 other; $522
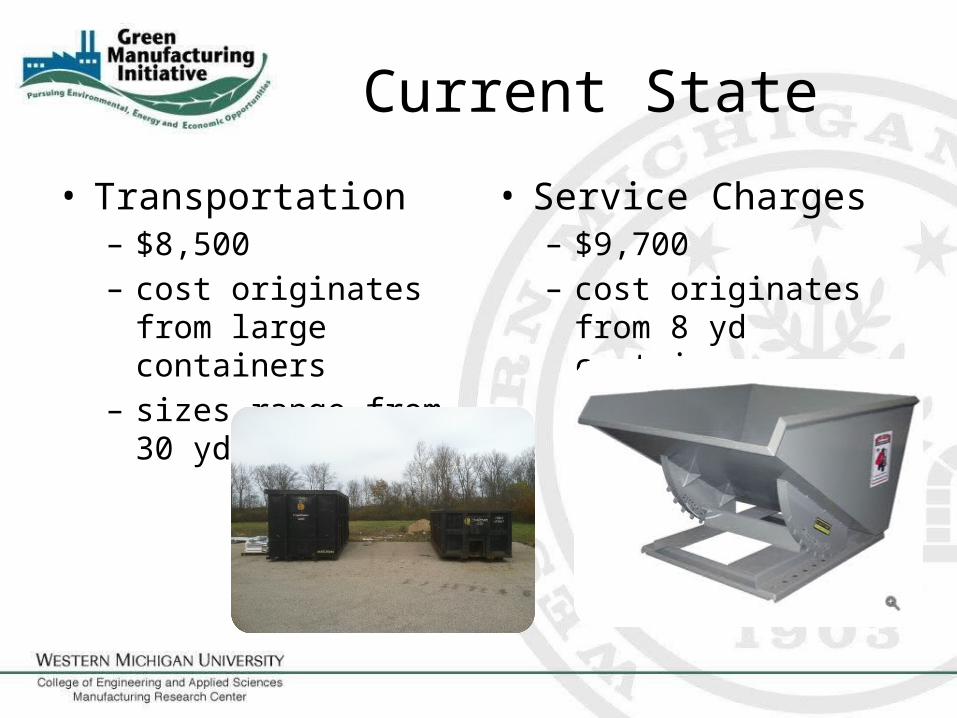
Current State
• Transportation– $8,500– cost originates from
large containers– sizes range from 30 yd to
50 yd
• Service Charges– $9,700– cost originates from 8 yd
container
Recommendations and Considerations
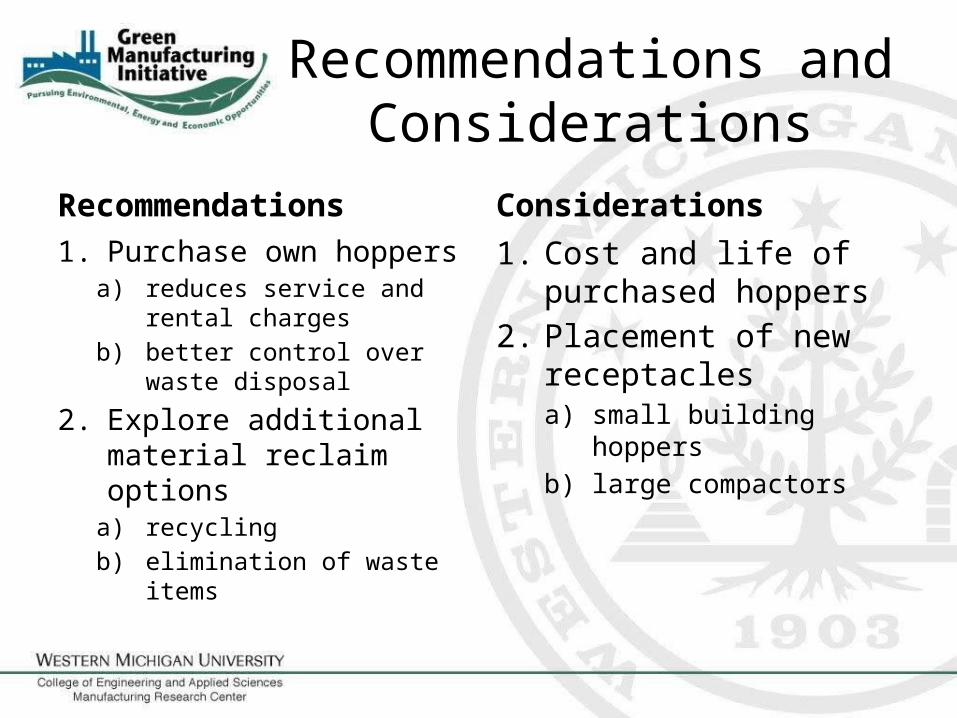
Recommendations
1. Purchase own hoppersa) reduces service and rental
charges
b) better control over waste disposal
2. Explore additional material reclaim options
a) recycling
b) elimination of waste items
Considerations
1. Cost and life of purchased hoppers
2. Placement of new receptaclesa) small building hoppers
b) large compactors

Container Cost Comparison
8-YD Dumpster (actual data)
# of pulls 43 annually
average cost $ 200 per pull
total cost $ 8,600 annually
50-YD Dumpster
# pulls 7 annually
average cost $ 600 per pull
total cost $ 4,200 annually
Difference $ 4,400 annually
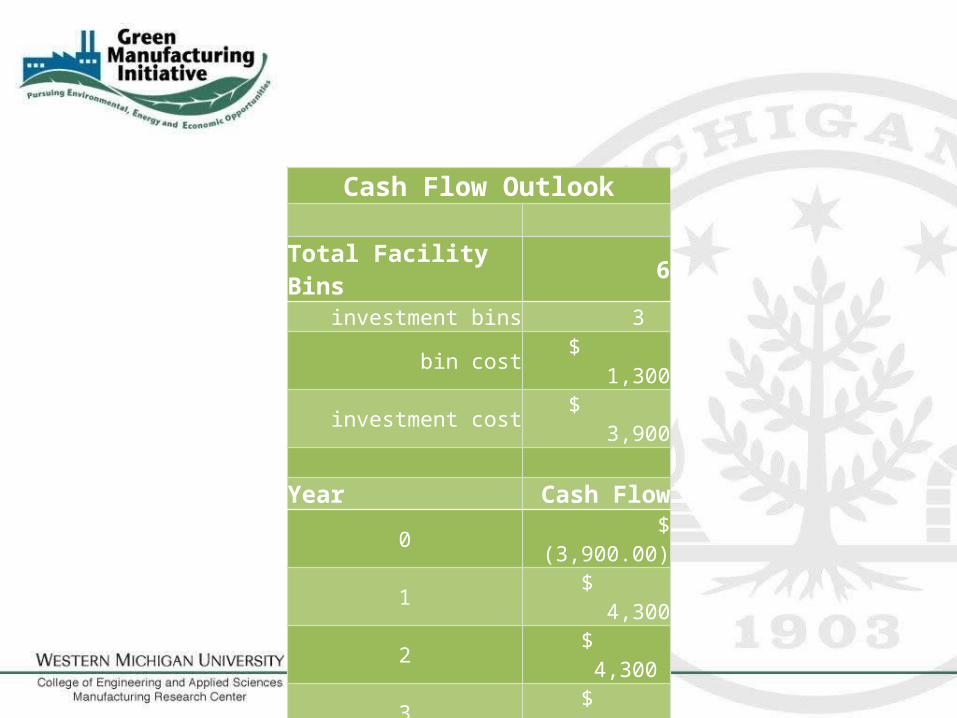
Cash Flow Outlook
Total Facility Bins 6 investment bins 3
bin cost $ 1,300
investment cost $ 3,900
Year Cash Flow0 $ (3,900.00)
1 $ 4,300
2 $ 4,300
3 $ 4,300
Current Bin Cost $ 8,600
Payback 11 (months)

SCRAP MATERIAL REGRINDShifting toward in-house regrind of scrap process material
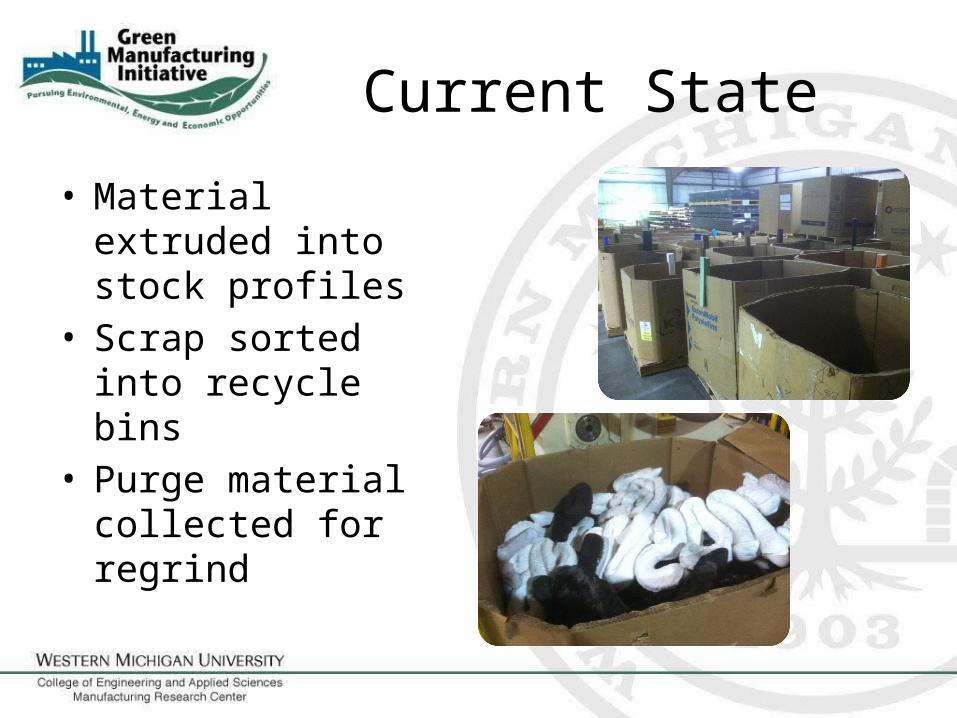
Current State
• Material extruded into stock profiles
• Scrap sorted into recycle bins
• Purge material collected for regrind
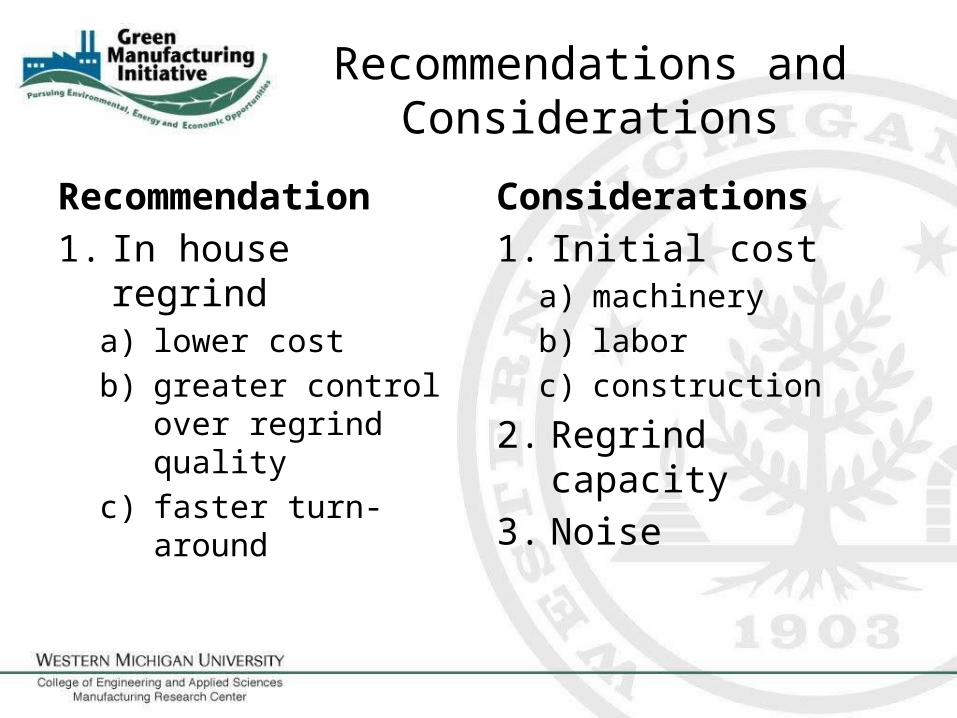
Recommendations and Considerations
Recommendation
1. In house regrinda) lower cost
b) greater control over regrind quality
c) faster turn-around
Considerations
1. Initial costa) machinery
b) labor
c) construction
2. Regrind capacity
3. Noise
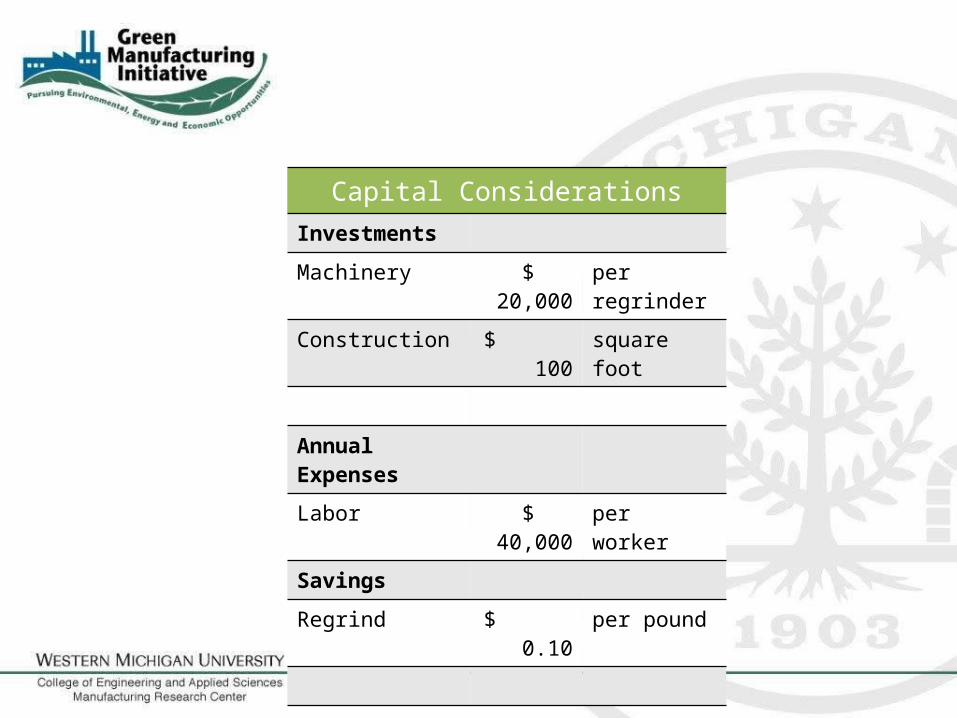
Capital ConsiderationsInvestments
Machinery $ 20,000 per regrinder
Construction $ 100 square foot
Annual Expenses
Labor $ 40,000 per worker
Savings
Regrind $ 0.10 per pound
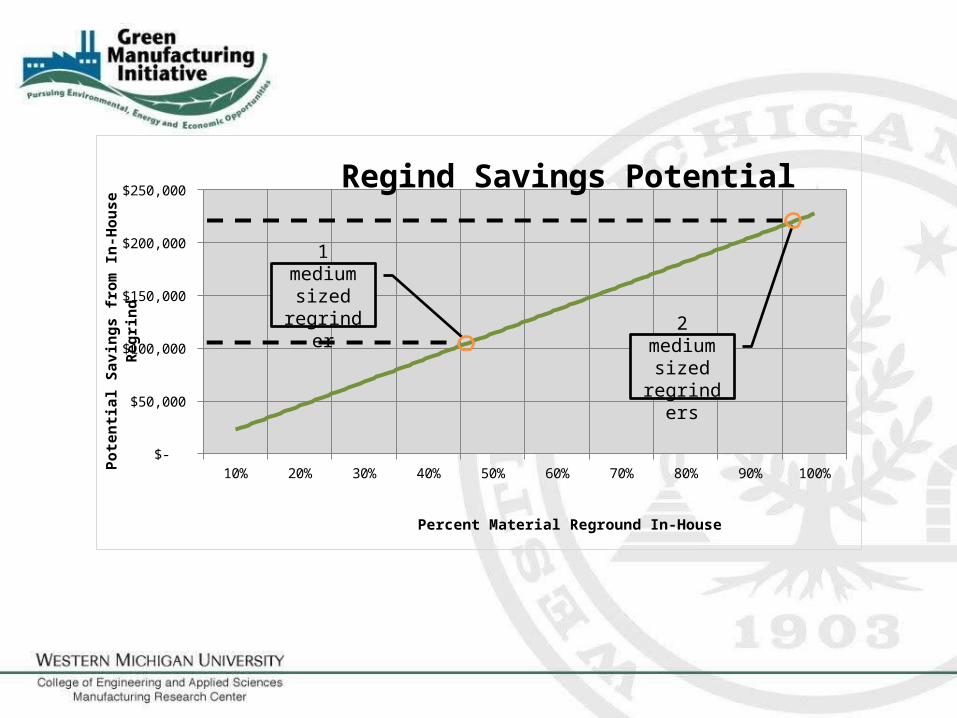
10% 20% 30% 40% 50% 60% 70% 80% 90% 100% $-
$50,000
$100,000
$150,000
$200,000
$250,000 Regind Savings Potential
Percent Material Reground In-House
Pot
enti
al S
avin
gs f
rom
In-
Hou
se R
egri
nd
1 medium sized
regrinder
2 medium sized
regrinders
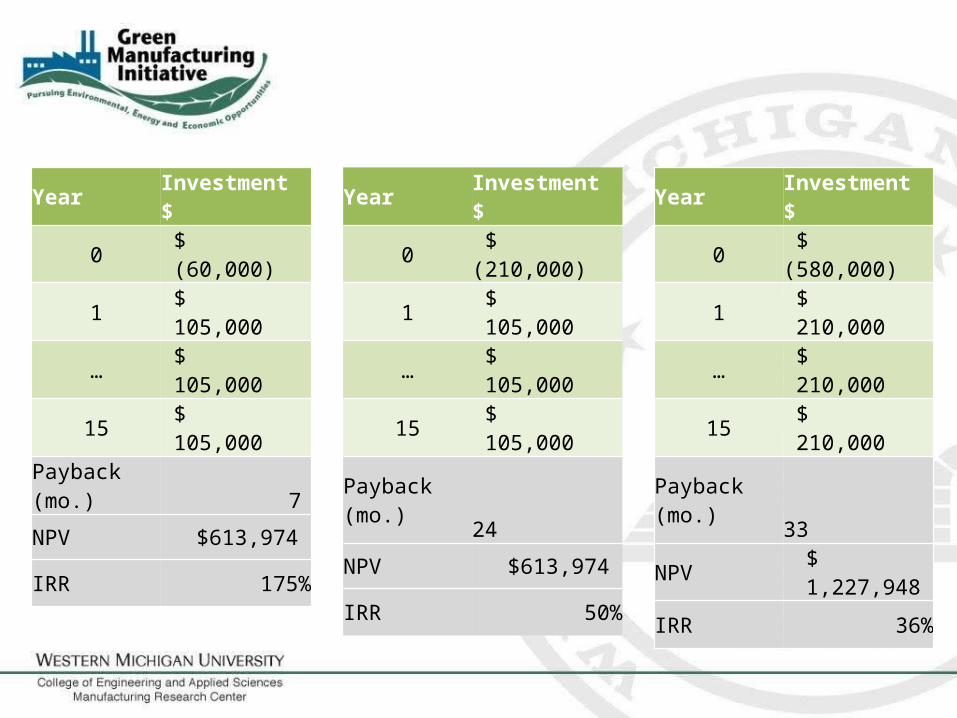
Year Investment $
0 $ (210,000)
1 $ 105,000
… $ 105,000
15 $ 105,000
Payback (mo.) 24
NPV $613,974
IRR 50%
Year Investment $
0 $ (60,000)
1 $ 105,000
… $ 105,000
15 $ 105,000
Payback (mo.) 7
NPV $613,974
IRR 175%
Year Investment $
0 $ (580,000)
1 $ 210,000
… $ 210,000
15 $ 210,000
Payback (mo.) 33
NPV $ 1,227,948
IRR 36%

COMMENTS AND QUESTIONS?
THANK YOU!
Lean AssessmentPolywood, Inc.
.
Josef Imesch, E.M., Graduate Research Assistant
Lorena Pena, I.E., Undergraduate Research Assistant
Natalia Matos, I.E., Undergraduate Research Assistant
Marylin Glass, I.E., E.M., Graduate Research Assistant
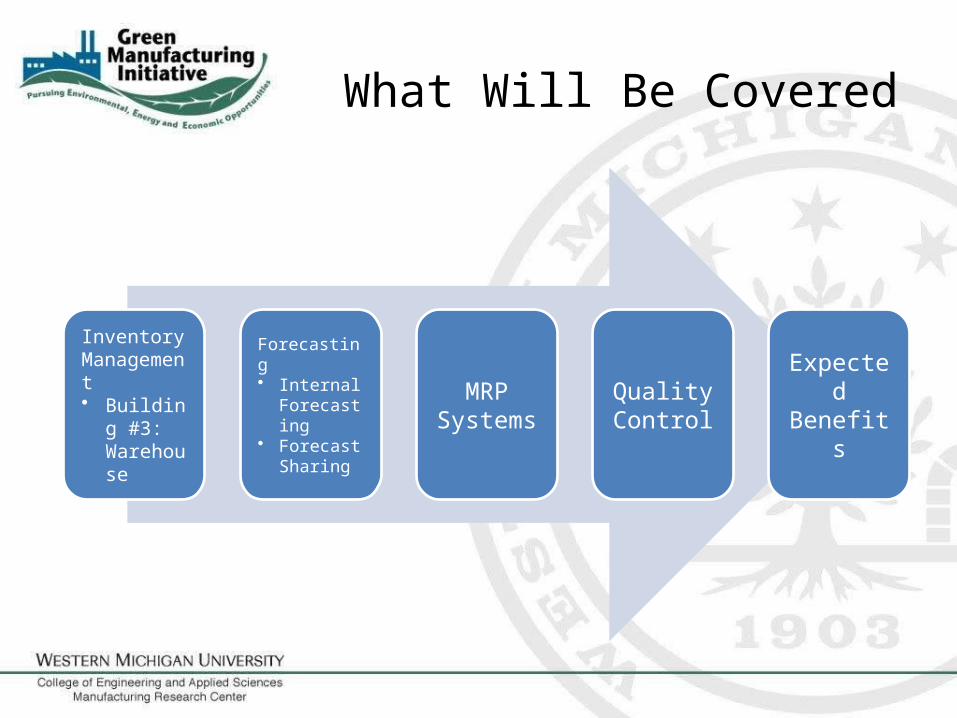
What Will Be Covered
Inventory Management• Building
#3: Warehouse
Forecasting• Internal
Forecasting
• Forecast Sharing
MRP Systems
Quality Control
ExpectedBenefits

Building No. 3: Warehouse
Areas for Improvement
Dedicated system of storage
Bar codes used to identify products
Capacity near 100%, under current layout
Recommendations
Replace dedicated system with a class system based on frequency of use
Evaluate option of using RFID chips instead of bar codes
Simulate new layouts using class based system
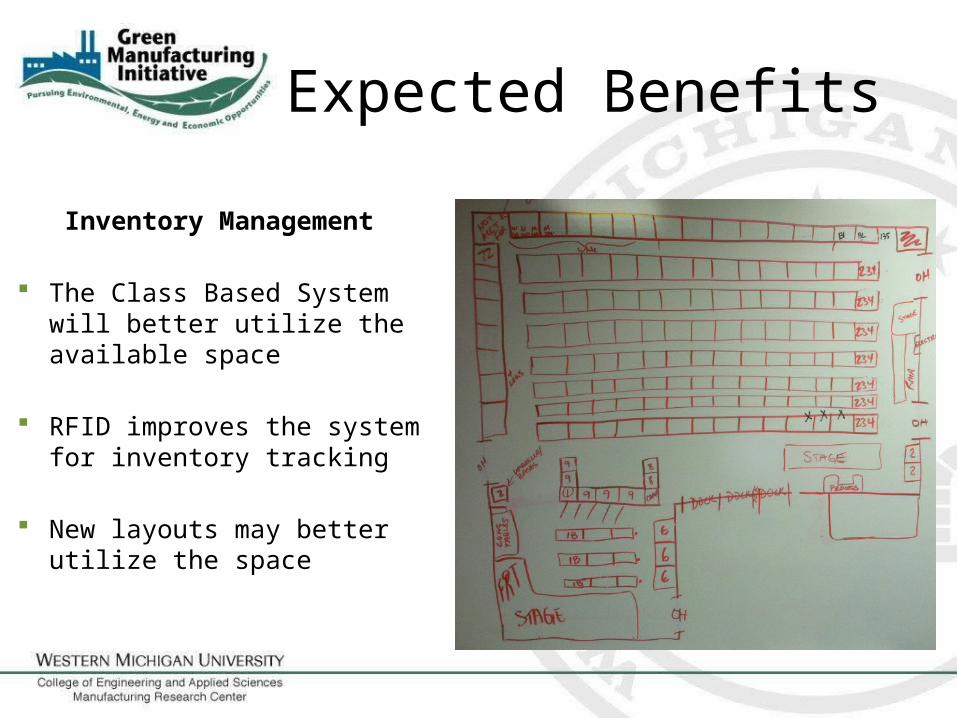
Expected Benefits
Inventory Management
The Class Based System will better utilize the available space
RFID improves the system for inventory tracking
New layouts may better utilize the space
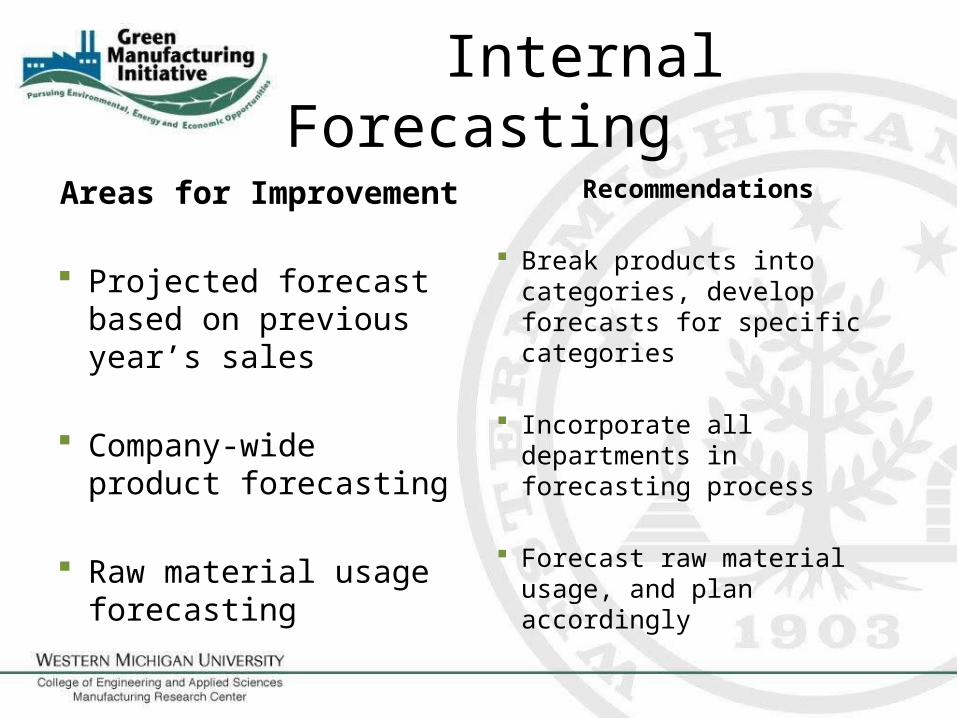
Internal Forecasting
Areas for Improvement
Projected forecast based on previous year’s sales
Company-wide product forecasting
Raw material usage forecasting
Recommendations
Break products into categories, develop forecasts for specific categories
Incorporate all departments in forecasting process
Forecast raw material usage, and plan accordingly

Forecast Sharing
Areas for Improvement
Forecasts sharing with the supply chain
Recommendations
Encourage retailers and suppliers to exchange forecasts
Form collaborative supplier relationships
http://organizations.weber.edu/sascm/supply_chain.bmp
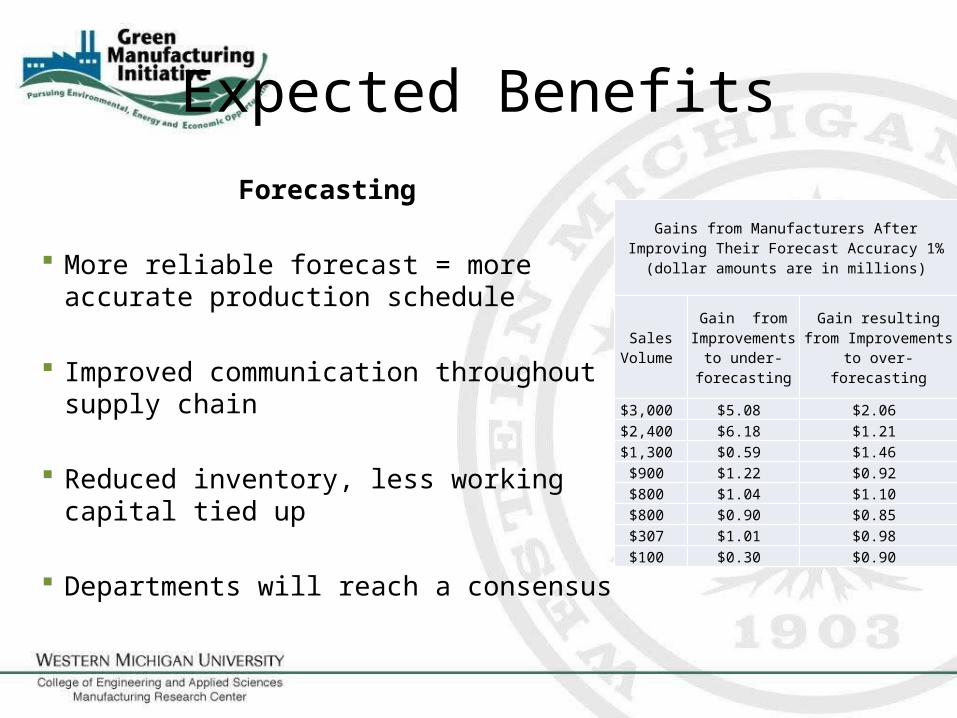
Expected Benefits
Forecasting
More reliable forecast = more accurate production schedule
Improved communication throughout supply chain
Reduced inventory, less working capital tied up
Departments will reach a consensus
Gains from Manufacturers After Improving Their Forecast Accuracy 1% (dollar amounts are in millions)
Sales Volume
Gain from Improvements to under-forecasting
Gain resulting from Improvements to over-
forecasting
$3,000 $5.08 $2.06 $2,400 $6.18 $1.21 $1,300 $0.59 $1.46 $900 $1.22 $0.92 $800 $1.04 $1.10 $800 $0.90 $0.85 $307 $1.01 $0.98 $100 $0.30 $0.90
MRP System
Areas for Improvement
Sabre software utilized to track order fulfillment and shipping status
Recommendations
Investigate company wide software implementation to track and monitor raw materials, WIP, and finished goods
Tie in BOM and MPS to software

Expected Benefits
MRP
Shorter lead times through better coordination among buildings
Meet delivery dates more often
Improved plant efficiency
More effective purchasing plan
Quality Control
Areas for Improvement
Quality standards vary between buildings and some are loosely defined
Preventative quality checks
Supplier quality records
Recommendations
Establish quality team to make company-wide preventative quality standards
Record defects and root cause
Monitor and record supplier quality
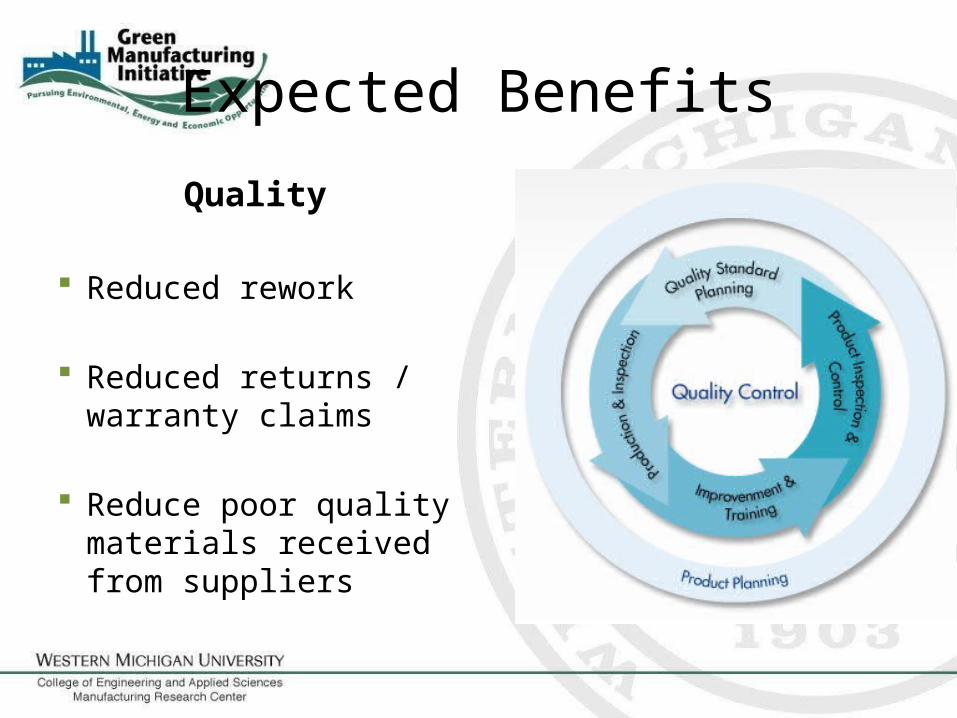
Expected Benefits
Quality
Reduced rework
Reduced returns / warranty claims
Reduce poor quality materials received from suppliers
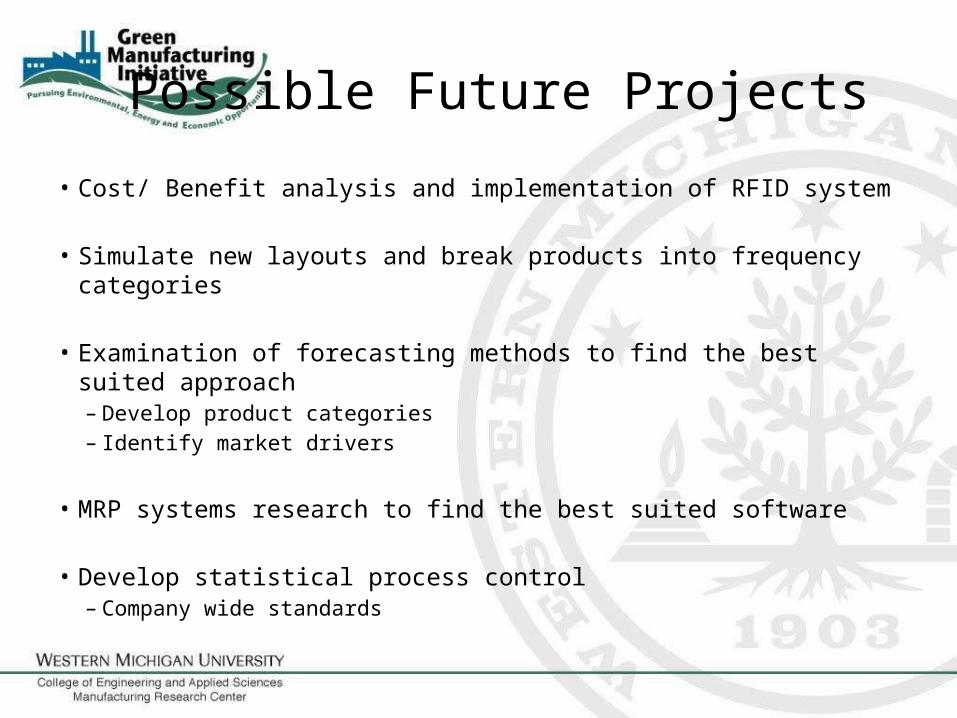
Possible Future Projects
• Cost/ Benefit analysis and implementation of RFID system
• Simulate new layouts and break products into frequency categories
• Examination of forecasting methods to find the best suited approach– Develop product categories– Identify market drivers
• MRP systems research to find the best suited software
• Develop statistical process control– Company wide standards

Thank You For Your Att enti on!
Ehardt, R., Matos, N., & Stephens, M. (2012). IE Analysis and Methods for Warehouse Optimization [Microsoft Word document]. Retrieved from Western Michigan University’s alumni after their Senior Design Presentation
Fodo, J., Recio, Y., & Fillmore, Z. (2012). Shipping and Receiving Cost Reduction [Power Point slides]. Retrieved from Western Michigan University’s alumni after their Senior Design Presentation
Fodo, J., Recio, Y., & Fillmore, Z. (2012). Shipping and Receiving Cost Reduction [Microsoft Word document]. Retrieved from Western Michigan University’s alumni after their Senior Design Presentation
Heragu, S. (2008). Facilities Design, Third Edition. Publisher: CRC Press Houshyar, A. (2001). Warehouse Operation. IME 6040 – Facilities Planning and Design [PDF document]. Retrieved from Personal Notes Online Web
site: https://homepages.wmich.edu/~houshyar/crsmtrl/IME6040/notes/Sec7.pdf Sheffi, Y. The Value of CPFR. RIRL Conference Proceedings. October, 2002. Web. 23 Jan. 2013. Institute of Business Forecasting and Planning. Why Forecasting? 2005. Web. 23 Jan. 2013. North Carolina University. Poole College of Management. The Supply Chain Resource Cooperative. Web. 23 Jan. 2013 Moustakis, V. Material Requirement Planning. Report for the EC Funded Project. Jan 2000. Primrose, P. Selecting and Evaluating Cost-effective MRP and MRPII. International Journal of Operations and Production Management.10.1. pg 51-66.
Feb. 1990. Schroeder, G. et al. A study of MRP Benefits and Cost. Journal of Operations Management. 2. 1. Oct. 1981.
References

ASSESSMENTS:
Changeovers, Material Handling, and Visual Factory
Lorena Pena, I.E., Undergraduate Research AssistantJosef Imesch, E.M., Undergraduate Research AssistantNatalia Matos, I.E., Undergraduate Research AssistantMarylin Glass, I.E., E.M., Graduate Research Assistant
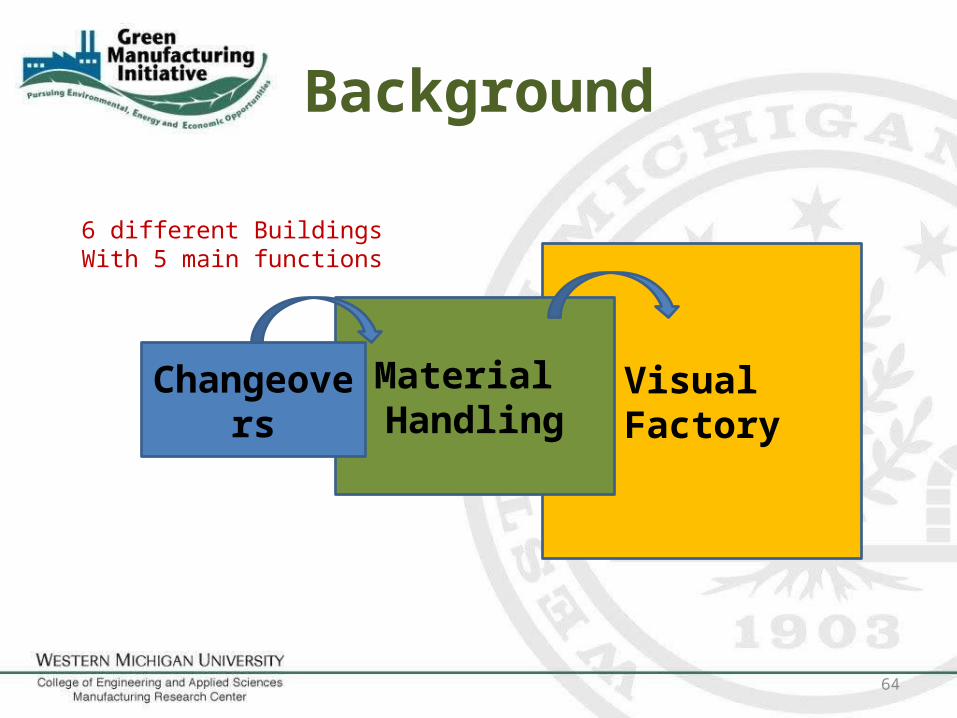
Background
64
Visual Factory
Material HandlingChangeovers
6 different BuildingsWith 5 main functions
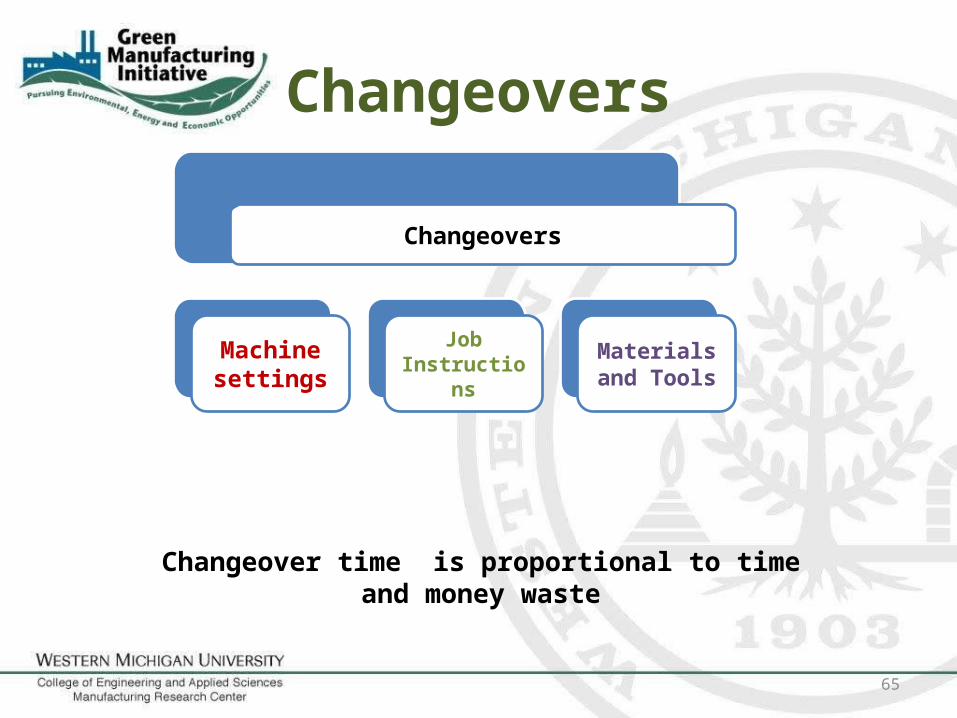
Changeovers
Changeovers
Machine settings
Job Instructions
Materials and Tools
65
Changeover time is proportional to time and money waste
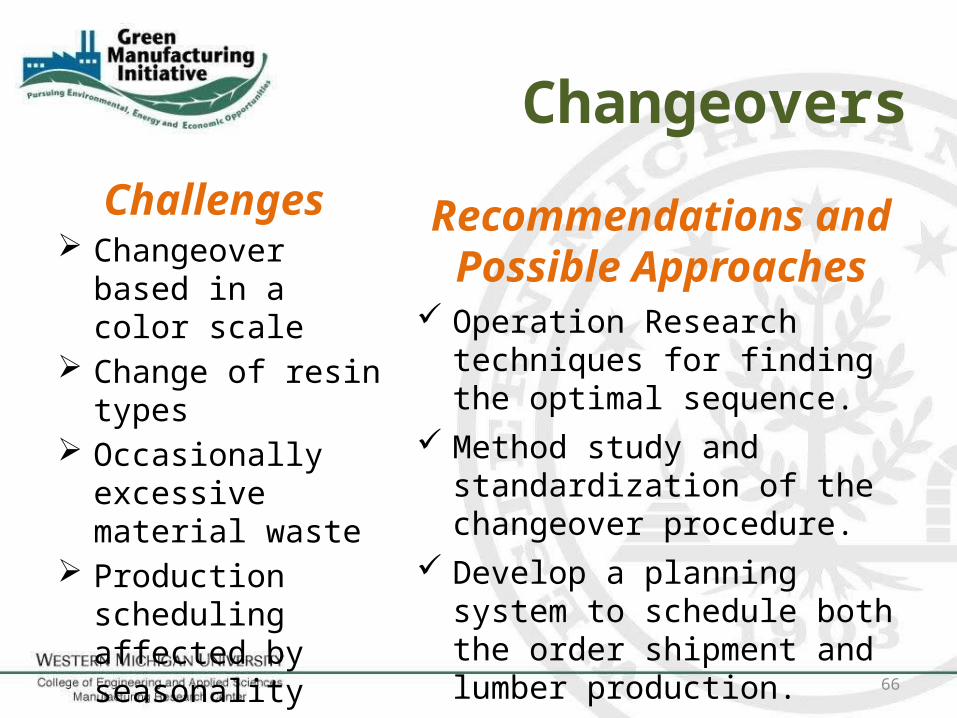
Changeovers
Challenges Changeover based in
a color scale Change of resin types Occasionally
excessive material waste
Production scheduling affected by seasonality
66
Recommendations and Possible Approaches
Operation Research techniques for finding the optimal sequence.
Method study and standardization of the changeover procedure.
Develop a planning system to schedule both the order shipment and lumber production.

Material Handling
• Hidden Costs:– Insurance and taxes covering
inventory– Loss and obsolescence– Storage space– Material handling equipment
Material handling cost normally represents 30% of
production expenses
67

Material HandlingChallenges
Six buildings with different processes
Inventory levels effected by seasonality
Several storage locations Long distances between
and within buildings
68
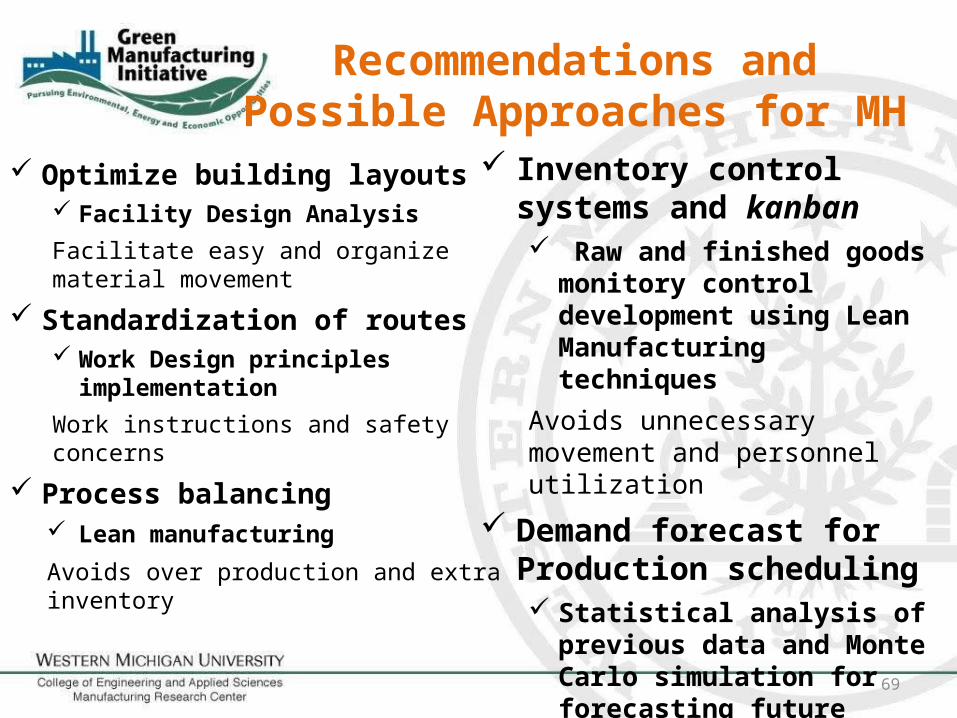
Recommendations and Possible Approaches for MH
69
Optimize building layouts Facility Design Analysis
Facilitate easy and organize material movement
Standardization of routes Work Design principles
implementation
Work instructions and safety concerns
Process balancing Lean manufacturing
Avoids over production and extra inventory
Inventory control systems and kanban Raw and finished goods
monitory control development using Lean Manufacturing techniques
Avoids unnecessary movement and personnel utilization
Demand forecast for Production scheduling Statistical analysis of previous
data and Monte Carlo simulation for forecasting future demand

Visual Factory
BenefitsReduce production cycleReduce downtimeSafer environmentIncrease available floor
space Reduce waste of motion
and overproduction Visual pleasing shopVisibility of potential
issues
70
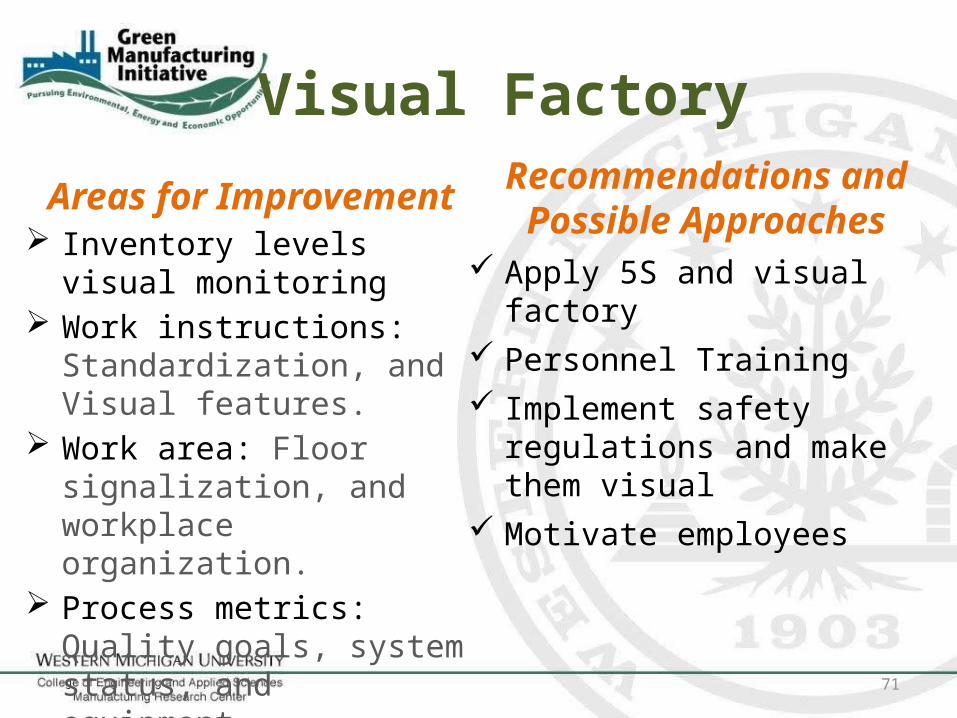
Visual Factory
Areas for Improvement Inventory levels visual
monitoring Work instructions:
Standardization, and Visual features.
Work area: Floor signalization, and workplace organization.
Process metrics: Quality goals, system status, and equipment.
71
Recommendations and Possible Approaches
Apply 5S and visual factory Personnel Training Implement safety regulations and
make them visual Motivate employees

Questions?Thank you for listening!
72
Post FoodsCleaning Water Reduction Project
Michael Biro, Research Assistant (EM)
Nathan Bowen, Research Assistant (ME)
Marylin Glass, Graduate Research Assistant (IE)
Colin Knue, Project Manager
73
74
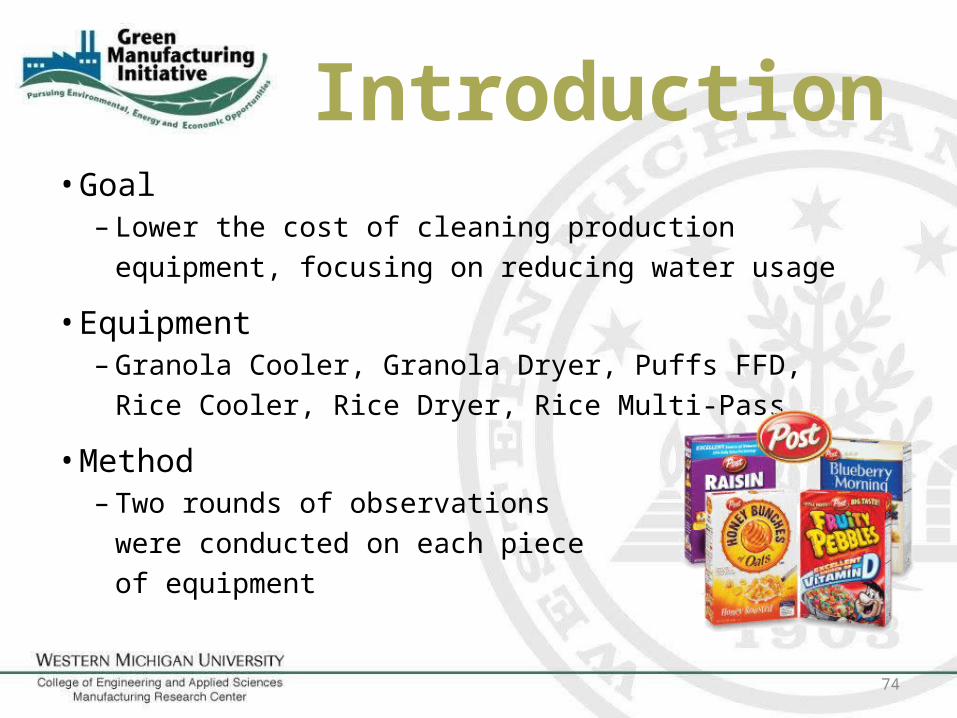
Introduction• Goal– Lower the cost of cleaning production equipment,
focusing on reducing water usage
• Equipment– Granola Cooler, Granola Dryer, Puffs FFD, Rice Cooler,
Rice Dryer, Rice Multi-Pass
• Method– Two rounds of observations
were conducted on each piece
of equipment
75
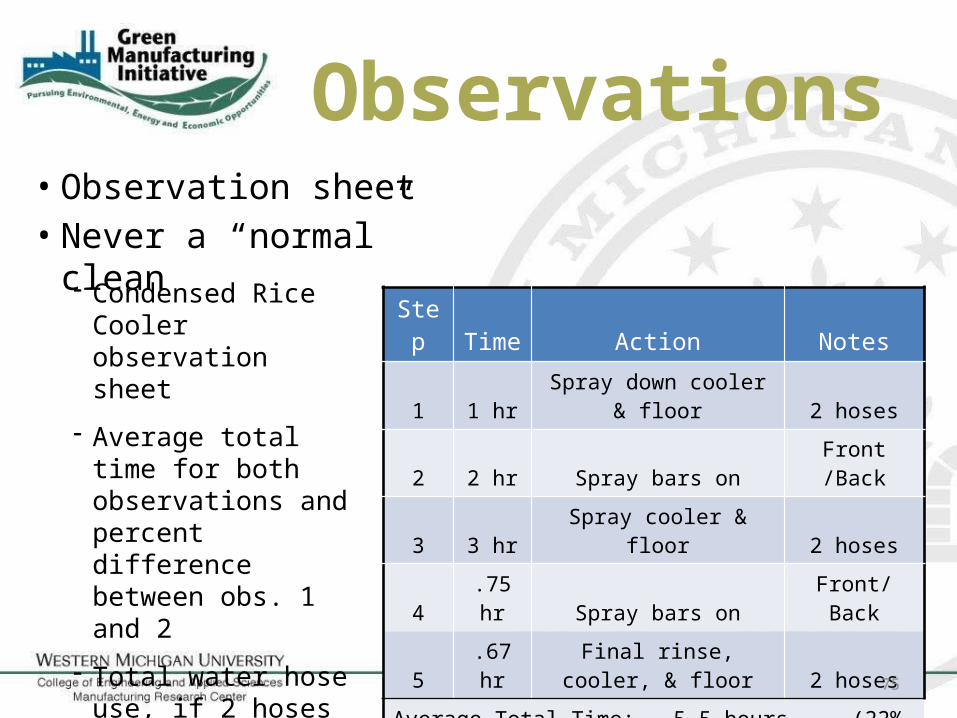
• Observation sheet• Never a “normal” clean
Observations
Step Time Action Notes
1 1 hr Spray down cooler & floor 2 hoses
2 2 hr Spray bars on Front /Back
3 3 hr Spray cooler & floor 2 hoses
4 .75 hr Spray bars on Front/Back
5 .67 hr Final rinse, cooler, & floor 2 hoses
Average Total Time: 5.5 hours (22% difference)
Obs. 1: 4.9 hours Water hose use: 4.7 gun hr
Obs. 2: 6.03 hours Water hose use: 4.8 gun hr
- Condensed Rice Cooler observation sheet
- Average total time for both observations and percent difference between obs. 1 and 2
- Total water hose use, if 2 hoses used at once time multiplied
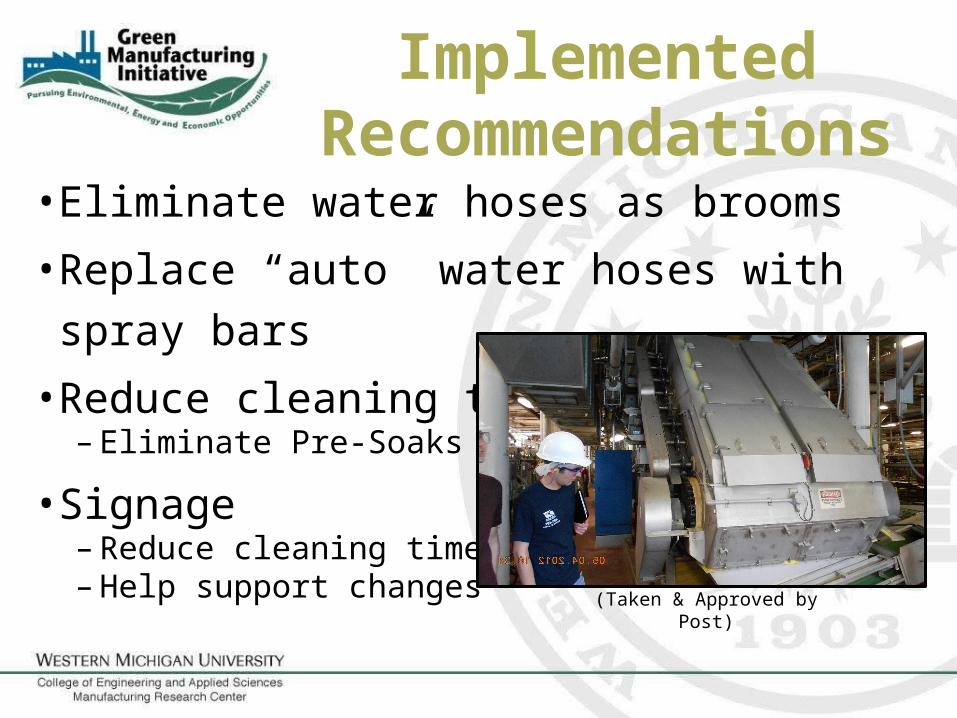
• Eliminate water hoses as brooms
• Replace “auto” water hoses with spray bars
• Reduce cleaning time– Eliminate Pre-Soaks
• Signage– Reduce cleaning times– Help support changes
ImplementedRecommendations
(Taken & Approved by Post)
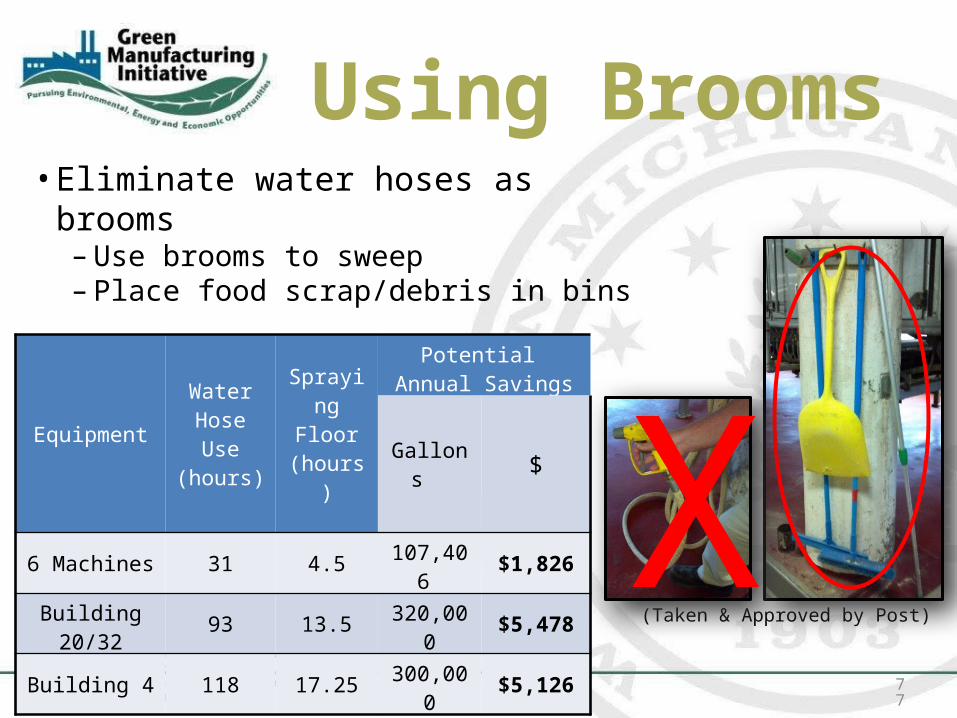
• Eliminate water hoses as brooms–Use brooms to sweep– Place food scrap/debris in bins
(Taken & Approved by Post)
77
XEquipment
Water Hose Use (hours)
Spraying Floor
(hours)
Potential Annual Savings
Gallons $
6 Machines 31 4.5 107,406 $1,826
Building 20/32 93 13.5 320,000 $5,478
Building 4 118 17.25 300,000 $5,126
Using Brooms
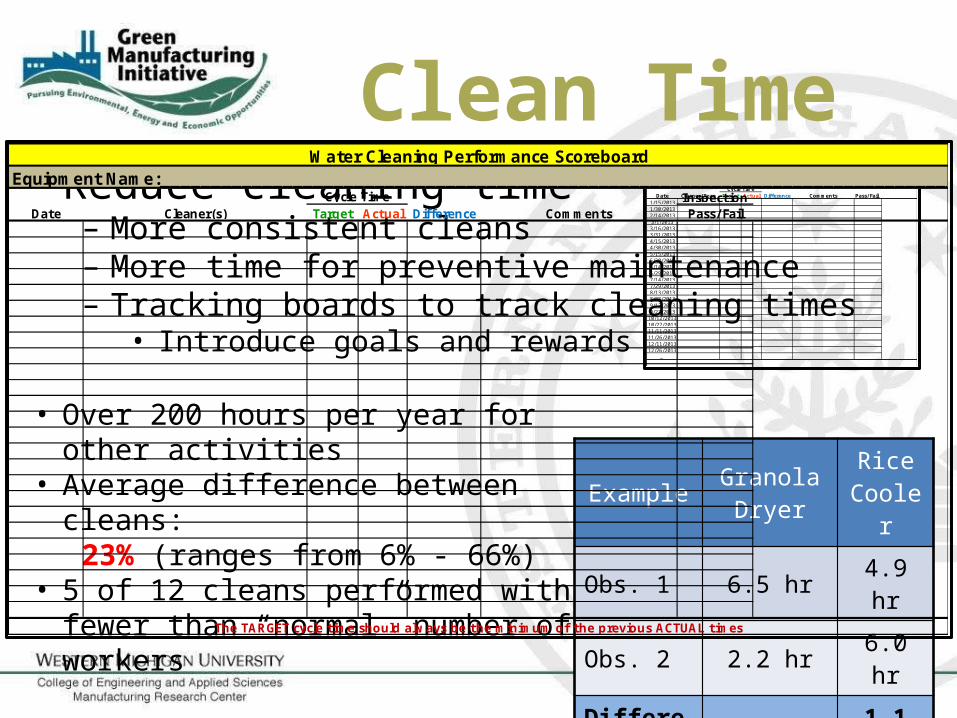
• Reduce cleaning time– More consistent cleans– More time for preventive maintenance– Tracking boards to track cleaning times
• Introduce goals and rewards
78
ExampleGranola Dryer
Rice Cooler
Obs. 1 6.5 hr 4.9 hr
Obs. 2 2.2 hr 6.0 hr
Difference 4.3 hr 1.1 hr
• Over 200 hours per year for other activities• Average difference between cleans:
23% (ranges from 6% - 66%)• 5 of 12 cleans performed with fewer than
“normal” number of workers
Date Cleaner/ Team Target Actual Difference1/15/20131/30/20132/14/20133/1/20133/16/20133/31/20134/15/20134/30/20135/15/20135/30/20136/14/20136/29/20137/14/20137/29/20138/13/20138/28/20139/12/20139/27/2013
10/12/201310/27/201311/11/201311/26/201312/11/201312/26/2013
…
Equipment Name:_________________________________________________Water Cleaning Performance Scoreboard
Cycle TimePass/ FailCommentsInspection
Date Target Actual Difference Pass/ Fail
Water Cleaning Performance ScoreboardEquipment Name:______________________________________________________________________________
Cycle TimeComments
The TARGET cycle time should always be the minimum of the previous ACTUAL times
Cleaner(s)
Clean Time
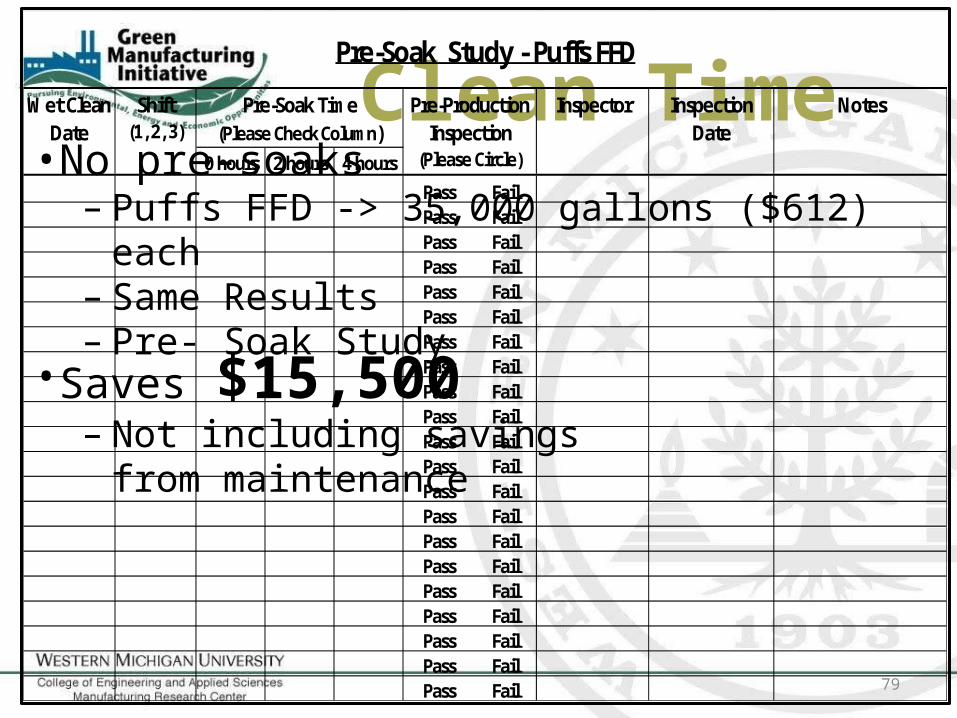
Clean Time•No pre-soaks– Puffs FFD -> 35,000 gallons ($612) each– Same Results– Pre- Soak Study
79
•Saves $15,500– Not including savings from
maintenance
0 hours 2 hours 4 hours Pass Fail Pass Fail Pass Fail Pass Fail Pass Fail Pass Fail Pass Fail Pass Fail Pass Fail Pass Fail Pass Fail Pass Fail Pass Fail Pass Fail Pass Fail Pass Fail Pass Fail Pass Fail Pass Fail Pass Fail Pass Fail
Inspector Inspection Date
Notes
Pre-Soak Study - Puffs FFD
Pre-Soak Time(Please Check Column)
Wet Clean Date
Shift(1, 2, 3)
Pre-Production Inspection
(Please Circle)
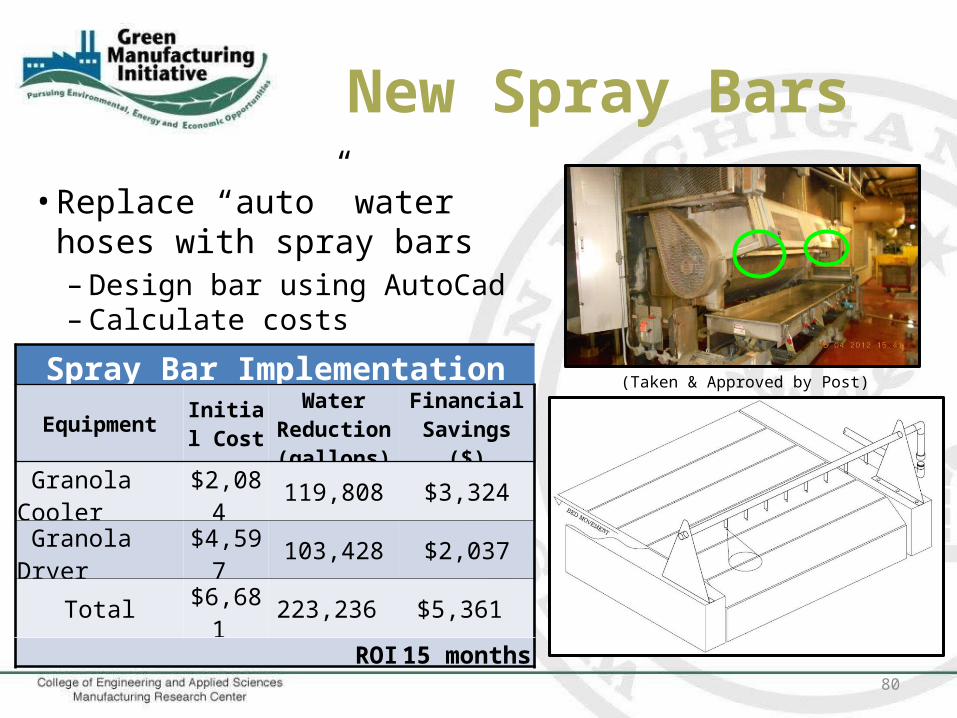
• Replace “auto” water hoses with spray bars– Design bar using AutoCad– Calculate costs
New Spray Bars
80
(Taken & Approved by Post)Spray Bar Implementation
EquipmentInitial Cost
Water Reduction (gallons)
Financial Savings ($)
Granola Cooler $2,084 119,808 $3,324 Granola Dryer $4,597 103,428 $2,037
Total $6,681 223,236 $5,361 ROI 15 months

• Signage– Reduce cleaning times–Help reinforce changes
New Signs
82
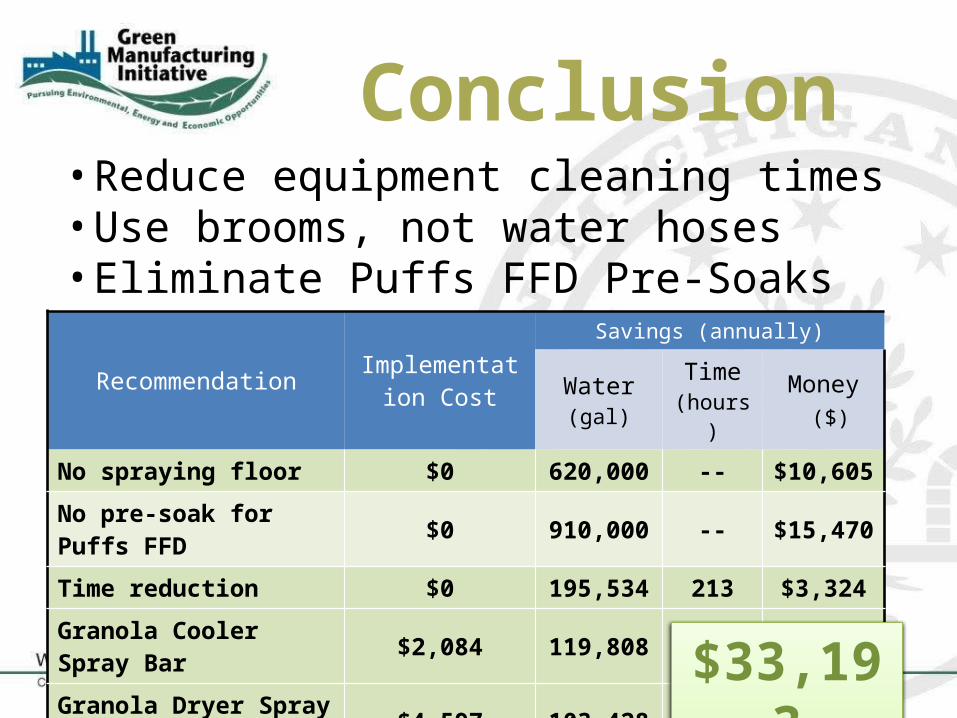
Conclusion• Reduce equipment cleaning times• Use brooms, not water hoses• Eliminate Puffs FFD Pre-Soaks
Recommendation Implementation Cost
Savings (annually)
Water (gal)Time
(hours)Money
($)
No spraying floor $0 620,000 -- $10,605
No pre-soak for Puffs FFD $0 910,000 -- $15,470
Time reduction $0 195,534 213 $3,324
Granola Cooler Spray Bar $2,084 119,808 -- $2,036
Granola Dryer Spray Bar $4,597 103,428 -- $1,758
$33,193

• Follow up with detailed engineering projects–New spray bars– Performance Scoreboard– Signage & Lean techniques–Hot/cold water options• Hot water regularly runs out during cleans• Use hot water for 1st hour of clean
– Research new technologies• Dry ice blasting, high pressure water jets
Next Steps
83

84
Questions?

Veneer Sand-ThroughsData Collection & Analysis
Nathan Bowen, ME, Undergraduate Research AssistantMarylin Glass-Angeles, IE, EM, Graduate Research Assistant
Josef Imesch, EM, Graduate Research AssistantZachary Miller, CE, Undergraduate Research Assistant
Nathan Christensen, Mfg.E., Graduate Research Assistant
• Wood and Composite Office Furniture• Lean Environment– 5S– Visual Factory
• Constant Improvement– GMIC Projects
Quick Points
The Problem
• Sand-throughs– Veneer damage from Heesemann sanding process– Particle-board under veneer face does not stain
Sandthrough Picture
End of Line
• Product ships – Customer dissatisfaction– Rarely Occurs
• Repair or Scrap– Steelcase dissatisfaction– “Hidden” costs
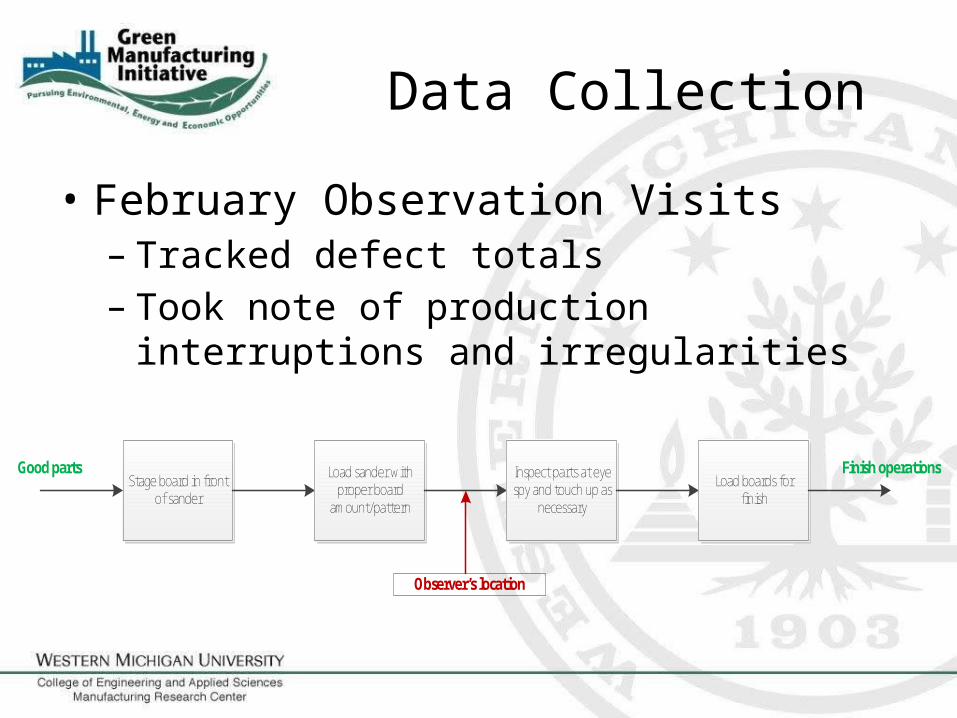
• February Observation Visits– Tracked defect totals – Took note of production interruptions and
irregularities
Data Collection
Stage board in front of sander
Load sander with proper board
amount/pattern
Inspect parts at eye spy and touch up as
necessary
Load boards for finish
Observer’s location
Good parts Finish operations
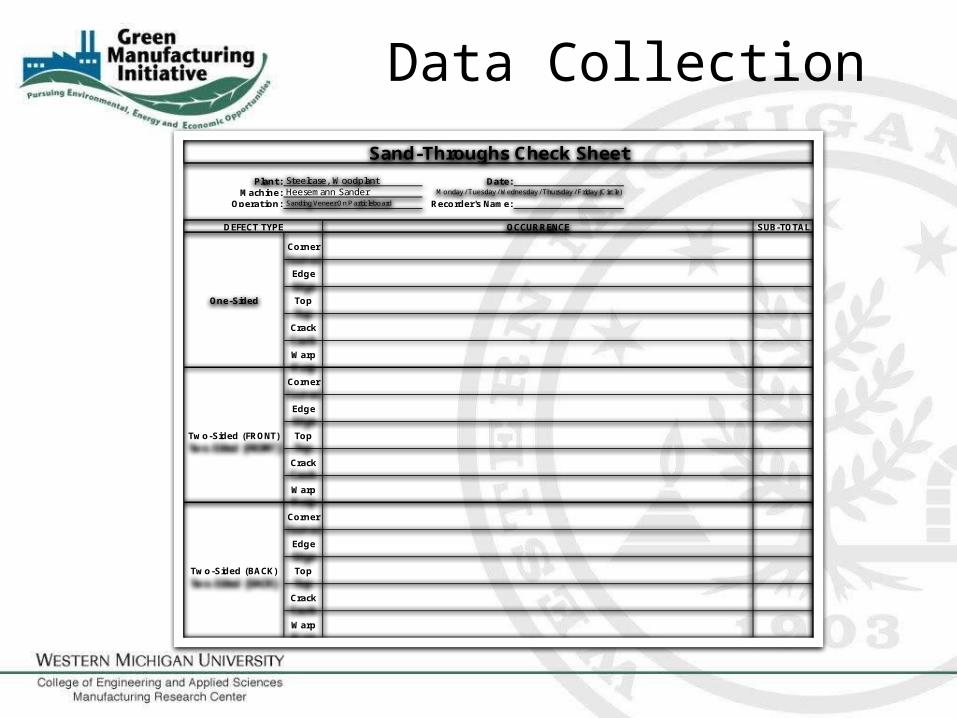
Data Collection
Plant: Date:Machine:
Operation: Recorder's Name:
SUB-TOTAL
Corner
Edge
Top
Crack
Warp
Corner
Edge
Top
Crack
Warp
Corner
Edge
Top
Crack
Warp
Sand-Throughs Check Sheet
One-Sided
Two-Sided (FRONT)
Two-Sided (BACK)
Steelcase, WoodplantHeesemann SanderSanding Veneer On P articleboard
OCCURRENCEDEFECT TYPE
Monday / Tuesday / Wednesday / Thursday / Friday (Circle)
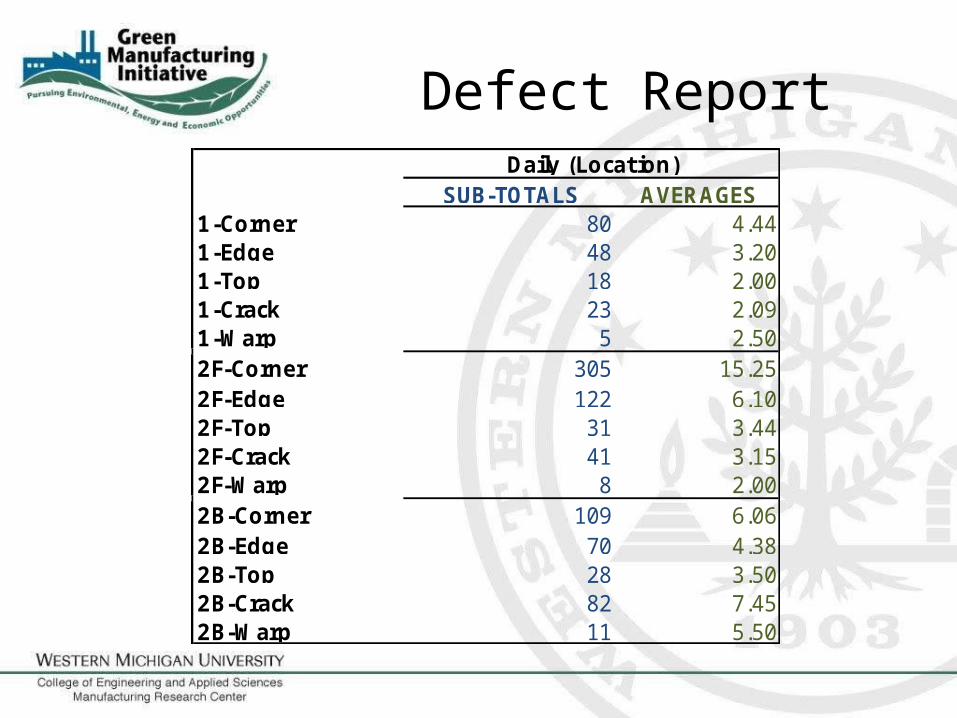
Defect Report
SUB-TOTALS AVERAGES1-Corner 80 4.441-Edge 48 3.201-Top 18 2.001-Crack 23 2.091-Warp 5 2.502F-Corner 305 15.252F-Edge 122 6.102F-Top 31 3.442F-Crack 41 3.152F-Warp 8 2.002B-Corner 109 6.062B-Edge 70 4.382B-Top 28 3.502B-Crack 82 7.452B-Warp 11 5.50
Daily (Location)
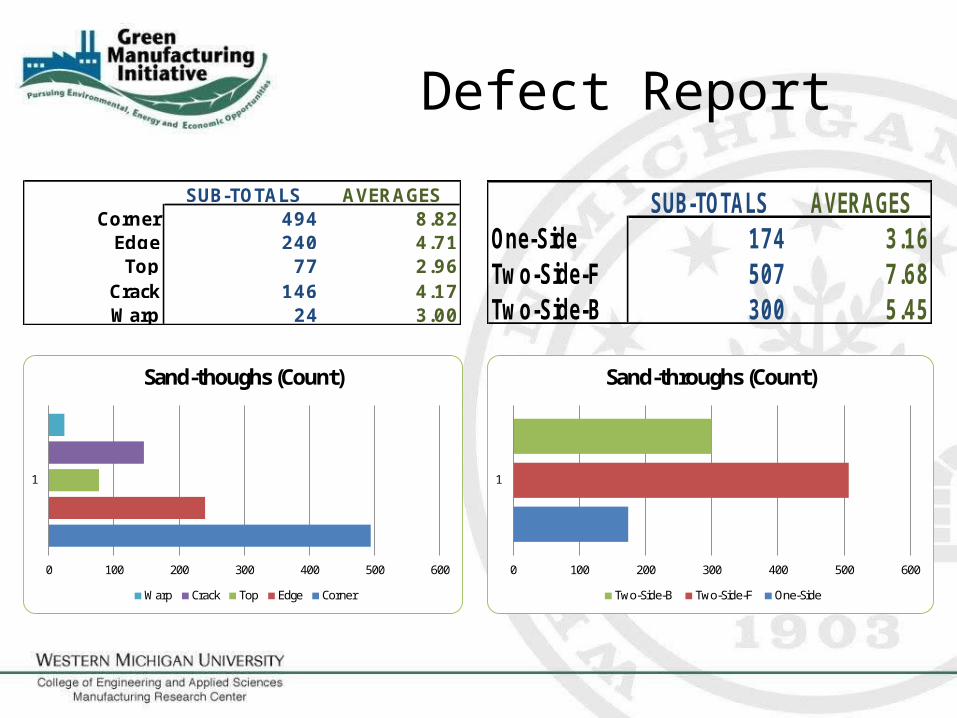
Defect Report
SUB-TOTALS AVERAGESCorner 494 8.82
Edge 240 4.71Top 77 2.96
Crack 146 4.17Warp 24 3.00
0 100 200 300 400 500 600
1
Sand-thoughs (Count)
Warp Crack Top Edge Corner
SUB-TOTALS AVERAGESOne-Side 174 3.16Two-Side-F 507 7.68Two-Side-B 300 5.45
0 100 200 300 400 500 600
1
Sand-throughs (Count)
Two-Side-B Two-Side-F One-Side
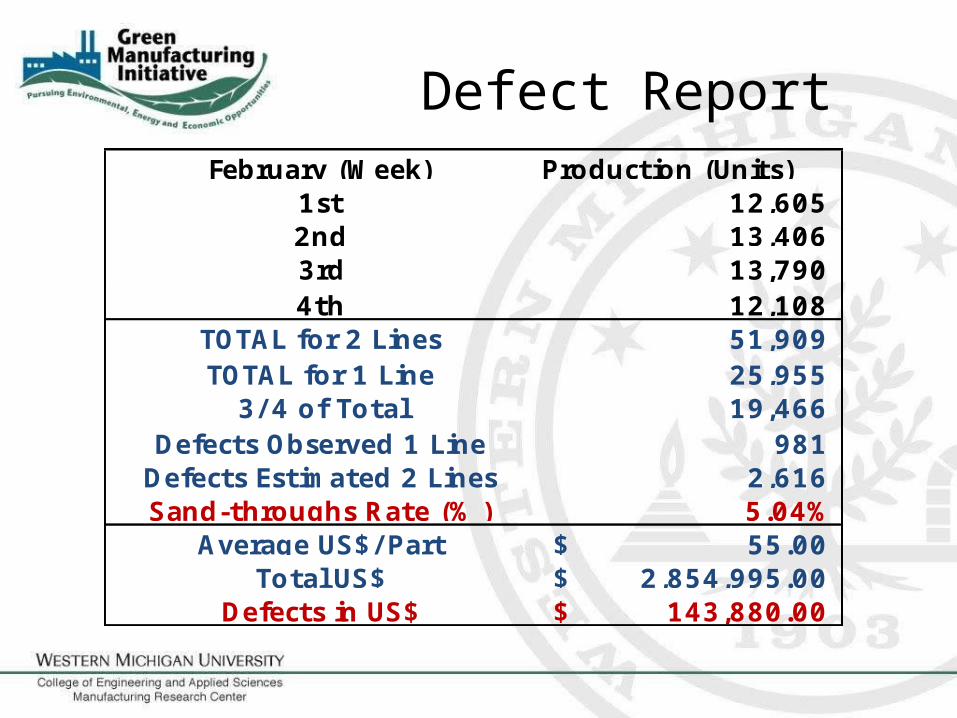
Defect ReportFebruary (Week) Production (Units)
1st 12,605 2nd 13,406 3rd 13,790 4th 12,108
TOTAL for 2 Lines 51,909 TOTAL for 1 Line 25,955
3/ 4 of Total 19,466 Defects Observed 1 Line 981
Defects Estimated 2 Lines 2,616 Sand-throughs Rate (%) 5.04%
Average US$/ Part 55.00$ Total US$ 2,854,995.00$
Defects in US$ 143,880.00$
• Operator Error– Incorrect adjustment to the programing
• Wood Species• Veneer reaction to weather (i.e. Humidity, Temp.)• Sanding Belt Condition– Fresh belt grit may over-sand– Worn belt may be irregular in sand quality
• Machine Sensor Failure• Incorrect Programing
Possible Causes
Next Steps
• Differentiate Apparent from Real Causes• Site Visits– Examine internal operation of Heeseman sander– Evaluate surface features of pre-sanded pieces
• Experimental Research– Close work with Steelcase engineers
• Execution of Findings– Implement improvement process

Thank You!
Any Questions?

Landscape FormsManufacturing Facility Waste to Landfill Assessment
Nathan Christensen, Mfg. E., Graduate Research Assistant
Marylin Glass, I.E., E.M., Graduate Research Assistant
Michael Biro, U.E.M., Undergraduate Research Assistant
John Ihling, U.E.M., Undergraduate Research Assistant
Natalia Matos, I.E., Undergraduate Research Assistant
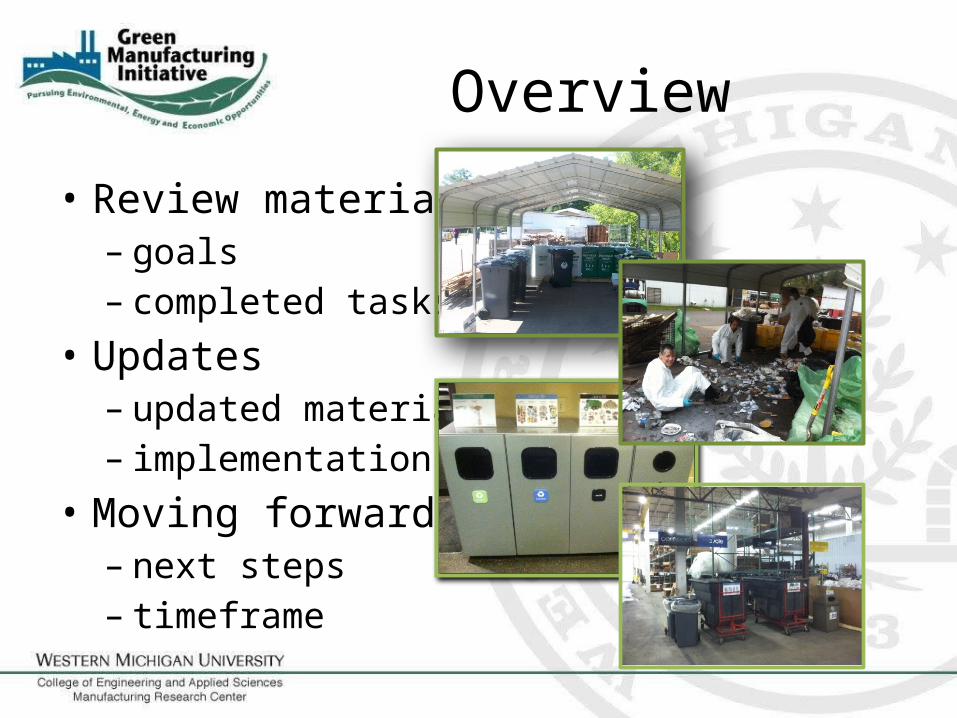
Overview
• Review material– goals– completed tasks
• Updates– updated material– implementation
• Moving forward– next steps– timeframe
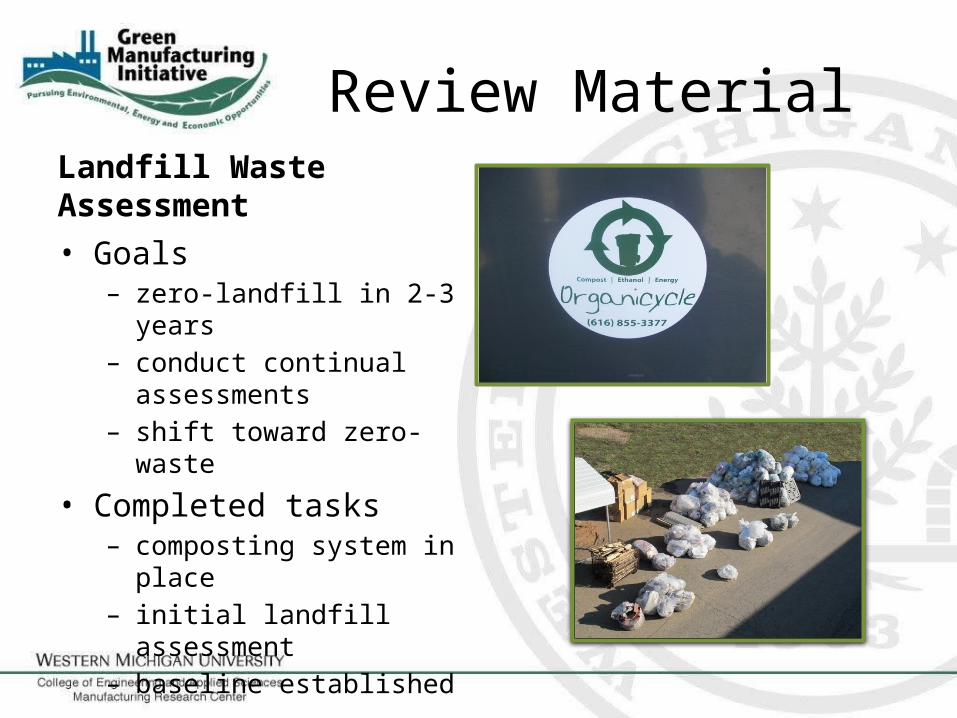
Review Material
Landfill Waste Assessment
• Goals– zero-landfill in 2-3 years– conduct continual assessments– shift toward zero-waste
• Completed tasks– composting system in place– initial landfill assessment– baseline established

Updates: Material Figures
plastic23%
metal3%
compost23%other
18%
re-turn-ables
0%
grinding pads7%
plastic foam3%
food wrappers
.5%
recycled paper
6%
glass.5%
machine filters
8%
wood6%
construction waste2%
NOTE: Figures distributed by weight.
NOTE: Approximately 4,000 lbs of material sorted
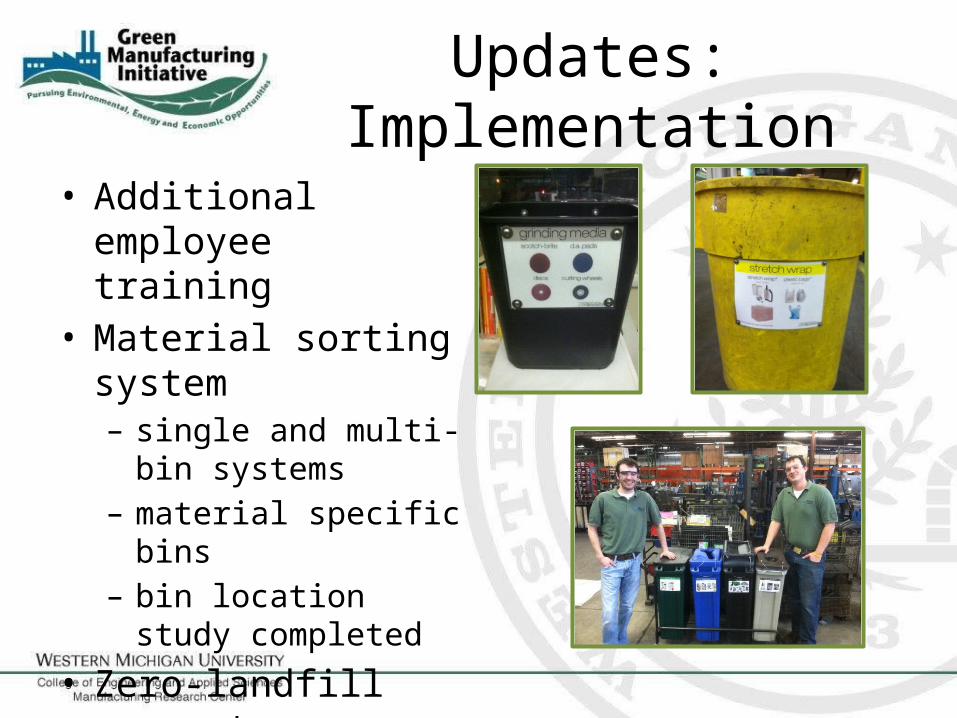
Updates: Implementation
• Additional employee training
• Material sorting system– single and multi-bin
systems– material specific bins– bin location study
completed
• Zero-landfill green team
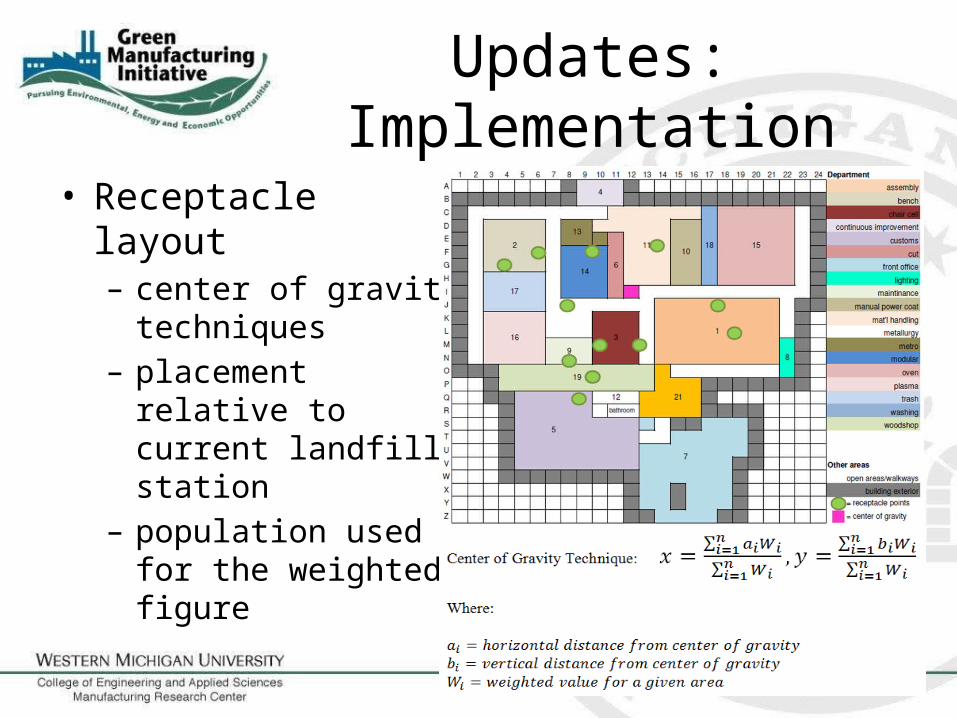
Updates: Implementation
• Receptacle layout– center of gravity
techniques – placement relative to
current landfill station– population used for the
weighted figure
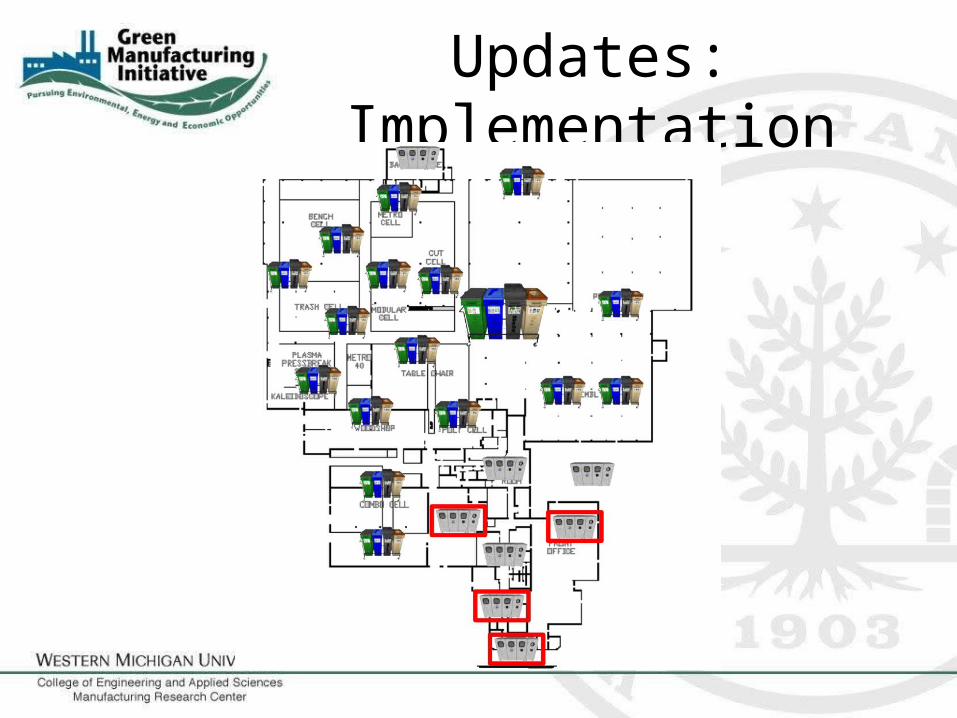
Updates: Implementation
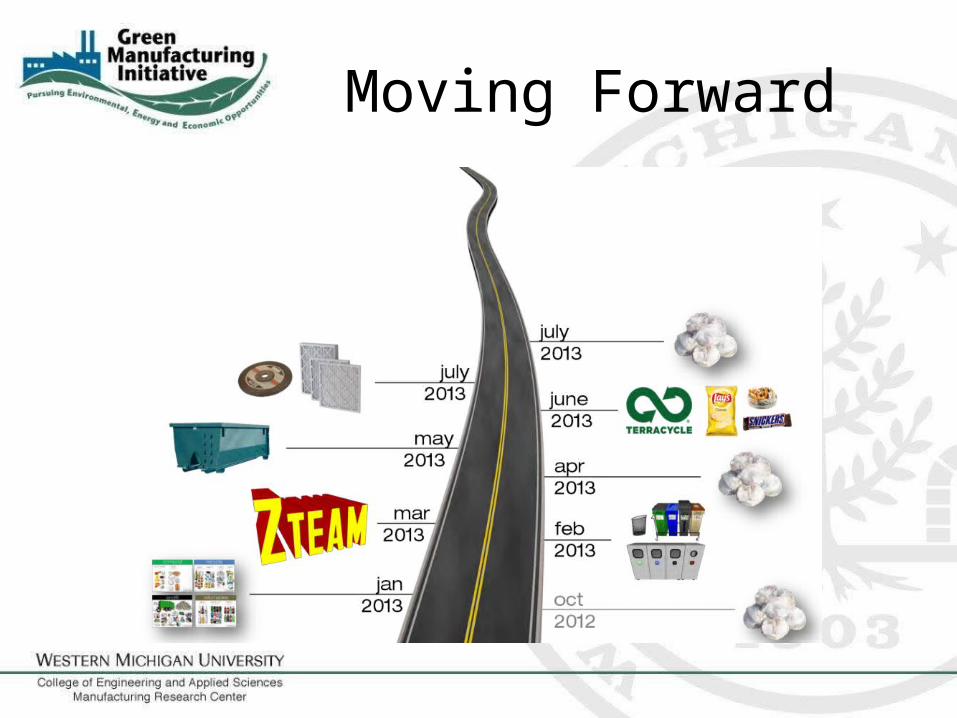
Moving Forward

THANK YOU!COMMENTS, QUESTIONS?
Special Thanks To:
Ryan Smith, Landscape Forms