weighing the costs and benefits of expanding the st ... · the st. lawrence seaway connects the...
TRANSCRIPT

Weighing the Costs and Benefits of Expanding the St. Lawrence Seaway:
An Economic, Environmental, and Policy Analysis
by
Sarita Hermant Muley
Environmental Studies Program
Public Policy Studies Program
University of Chicago
May 20, 2005
2
Abstract
In 2002, the U.S. Army Corps of Engineers published a report that suggested that the St. Lawrence Seaway is outdated for current waterway commerce conditions. Containerships have become an increasingly important fleet in transporting international commodities, and the Army Corps of Engineers suggests that the Seaway must be expanded to accommodate these 35 foot
draft, 110 foot width, and 1000 foot length vessels. In this paper, I argue that the Seaway should not be expanded for both economic and environmental reasons. My economic arguments against the expansion proposal is that the Seaway may not attract a large number of containerships and world fleet traffic; the foundation of the argument rests on such data as current Seaway trading
patterns, international commerce trends, and containership use. Another argument against expansion is the potential ecological impacts that containership and potentially greater vessel
traffic would inflict upon the Great Lakes region. Based on these arguments, I conclude that in current and future studies of the Seaway, the U.S. and Canadian governments should focus on
improvements to the current Seaway infrastructure rather than on expansion.

3
Table of Contents
Pg.
Abstract 1
Introduction/Problem Statement 2
Background Theory 3 Proposals to Expand Seaway 5 Criticisms of the U.S. Army Corps’s Economic Analysis Objectivity 9 Criticisms of Army Corps’s 2002 Seaway expansion proposal 12
Results 19 Basics about national waterway commerce 20 Containerships and St. Lawrence Seaway trading partners 23 Expansion and international commerce 30 Job benefits and potential economic losses 44 Environmental impacts of expansion: The expansion 48
process and containerships Environmental effects of expansion: Invasive species 56
Conclusion 63
Bibliography 65

4
Figures and Tables Pg.
Figure 1. Map of Great Lakes/St. Lawrence Seaway System 3
Figure 2. Actual and Corps’s Projected St. Lawrence Seaway 13
Navigation Traffic
Figure 3. Commodities Transported on the Great Lakes/St. Lawrence 25 Seaway, by volume
Figure 4. Great Lakes/St. Lawrence Seaway Traffic by Origin and 28
Destination, 1998
Figure 5. U.S. Waterborne Containerized Exports and Imports by 34 Coastal Port Region: 2001
Figure 6. Percentage of Containerized U.S. Maritime Imports from 37
China by Coast, 2000 versus 2003
Figure 7. Historical Food Web versus Modern Food Web (with 59 invasive species)
Table 1. Total Foreign Waterborne Trade 21
Table 2. Total Waterborne Trade 22
Table 3. U.S. Waterborne Containerized Trade by Major 24
Commodities: 2001
Table 4. Great Lakes versus Coastal Ports Commerce 31
Table 5. Top 10 U.S. Maritime Container Ports: 1995, 2000, 2001 33
Table 6. Total Production, Income, and Employment Annual Benefits 44
Table 7. Economic Impacts of Shift-of-Port Activity 46

5
Intro/Problem Statement
In May 2003, the United States and Canadian governments initiated the Great Lakes/ St.
Lawrence Seaway Study in order to assess the Seaway’s infrastructure and the economic,
environmental, and engineering factors that are relevant to its current and future needs. (Great
Lakes/St. Lawrence Seaway Study) The study is a follow-up to the 2002 Army Corps of
Engineers Reconnaissance Report that reviewed the Great Lakes Navigation System. In its
report, the U.S. Army Corps of Engineers recommended that the Seaway be expanded.
To aid in its study of the Seaway infrastructure, both the U.S. and Canadian governments
have held public meetings in the Great Lakes region and have received input from individuals
and organizations that have an environmental and economic stake in the Seaway. Through the
course of the public meetings, some interest groups and concerned citizens have made it clear
that expansion should not be considered a viable option. These opponents have included
environmental organizations, such as Great Lakes United and Save the River, and citizen groups
such as the Mohawk Council of Akwesasne.
In this paper, my assessment of the U.S. Army Corps of Engineers’ arguments for
expansion will demonstrate why the U.S. and Canadian governments should not consider
expansion as part of the current and future studies of Seaway infrastructure. I will also pit the
U.S. Army Corps of Engineers arguments for expansion against the arguments made by
opponents of expansion. In the following section, I will provide a brief history of the Seaway,
the details and criticisms of the original Army Corps of Engineers report, and introduce the
actors involved in the expansion debate.

6
Background/Theory
The Great Lakes/St. Lawrence Seaway System (GL/SLS; see Figure 1) extends a distance
of more than 3,700 km, or 2,340 miles (SchoonerVoyage). It has two components: the Great
Lakes Navigation System and the St. Lawrence Seaway. The Great Lakes Navigation System
consists of the upper four Great Lakes and their navigable channels: the St. Mary’s River, the
Straits of Mackinac, and the St. Clair/Detroit River System (U.S. Army Corps of Engineers).
The St. Lawrence Seaway connects the upper four Great Lakes with the deepwater channel of the
lower St. Lawrence River and from there on to the Atlantic Ocean (U.S. Army Corps of
Engineers 2002). Because the two components are geographically, ecologically, and
economically related, and the impacts on the Seaway affect the Great Lakes region, I will
henceforth refer to the two components as one entity (i.e., the Great Lakes/St. Lawrence
Seaway). I will use the term “Seaway” when discussing specific expansion plans.
Figure 1. Map of Great Lakes/St Lawrence Seaway System
(Transport Canada)

7
The Saint Lawrence River and Seaway is of vital geographic and economic importance to
the Great Lakes system, and the Seaway provides navigation to deep-draft ocean vessels. (Great
Lakes Information Network) As early as 1680, the Saint Lawrence River was recognized for its
economic value. The Saint Lawrence River, which forms a natural waterway connecting the
Great Lakes and other channels, served as a critical route for the movement of goods into and out
of America (Claudi and Willey 1999, 207). Starting in 1825, canals were built on the St.
Lawrence River to bypass natural obstacles that hindered navigation and restricted trade. At the
end of the nineteenth century, rapid industrial growth in North America’s interior combined with
the desire to harness the turbulent waters of the river for electric power prompted interest in the
construction of a deeper waterway on the Saint Lawrence River. (Mills, Chrisman, and Holeck
1999, 351) The waterway’s name became the Saint Lawrence Seaway and the Seaway officially
opened in 1959. Currently, vessels with the maximum dimensions of 740 foot length, 78-foot
beam, and 26 foot 3 inch draft can enter the Seaway. (Bureau of Transportation Statistics)
Due to the rising costs of maintaining the transportation infrastructure on which
commercial navigation depends, in 2003 the United States and Canadian governments initiated a
study of the current Seaway structure. According to the study’s website, the Canadian and
American governments believe that assessing the existing engineering infrastructure and current
economic and environmental conditions would prove invaluable in determining what actions
would be required to ensure no operational degradation in the System for the next 50 years.
(Great Lakes/St. Lawrence Seaway Study) The website makes clear that the study is not
considering expansion; the website states:
8
However, though Seaway expansion is supposedly not a part of the current study, Seaway
expansion has been suggested in the past, and may become a part of the future studies conducted
by the U.S. and Canadian governments. Because Seaway still might be expanded, and the U.S.
Army Corps of Engineers’ report on expansion is the most predominant and the most recent
suggestion for expansion, I will assess the arguments made in the U.S. Army Corps of Engineers
report to predict whether Seaway expansion is an economically and environmentally viable
option.
Proposals to Expand the Seaway
The U.S. Army Corps of Engineers made the most recent suggestion for expansion in a
2002 report on the Great Lakes/St. Lawrence Seaway, and the criticisms the report received led
to the present Seaway study. In the U.S. Army Corps of Engineers 2002 Reconnaissance Report
“Great Lakes Navigation System Review,” the purpose of the report was stated as determining
the best course of action for the aging Seaway infrastructure. Two options were presented:
continue with routine maintenance of the Seaway infrastructure or expand the locks and canals as
the maintenance is done (Pennsylvania Transportation Institute 2003). Another objective of the
Reconnaissance Report was to assess the level of U.S. federal interest in expansion of the Great
Lakes/St. Lawrence Seaway (Pennsylvania Transportation Institute 2003). The Army Corps
concluded that the United States and Canadian governments should consider expanding the St.
“The scope of the study is limited to the evaluation of the existing marine
transportation infrastructure. It is important to note that the focus of the study is on the optimization of the existing infrastructure based on the system’s
current configuration and that the evaluation of major infrastructure modifications, such as an expansion of the Seaway locks or an increase in
channel dimensions, is not part of the study.” (Great Lakes/St. Lawrence Seaway Study)

9
Lawrence Seaway system. The report outlined five options for physically widening and
deepening the navigation system’s connecting channels, locks and ports, cumulating in a 35-foot
deep navigation system from Montreal to Duluth (Schoonover and Muller 2002). The
justification of the Army Corps for expansion to 35 feet is that the expanded Seaway would
enable the newer, ultra-large containerships to enter the Seaway system, and because other
nations use these containerships to transport commodities to the United States and Canada, the
expansion would subsequently allow greater world containership fleet and other international
vessel traffic to enter the Seaway (U.S Army Corps of Engineers 2002).
The Army Corps was not the first to suggest Seaway expansion or construction of new
Seaway infrastructure. In 1987, the Connecting Channels and Harbors Study examined
deepening the Upper Great Lakes channels and selected harbors to 32 feet, but it was determined
that such deepening lacked economic justification (Schoonover and Muller 2002, 4). Instead, the
report recommended deepening the Upper St. Mary’s River and two ship channels in the
Duluth/Superior Harbor by only one foot. Even with this modest proposal, the states of
Michigan, Wisconsin, and Minnesota withheld support due to concerns with sediment disposal,
water quality, and habitat (Schoonover and Muller 2002, 4). That same year, the St. Lawrence
Seaway Additional Locks Study concluded that building either new locks at the existing size, or
larger locks designed to accommodate 1000-foot ships, were unjustified because the projections
indicated that the Welland Canal (located on the Seaway) would not reach capacity until 2030
(Schoonover and Muller 2002, 4). The study also noted that replacement of locks at the same
size would be the best alternative when considering the totality of factors: economics,
environment, engineering needs, and social acceptability (Schoonover and Muller 2002, 4).

10
Furthermore, communities along the U.S. side of the St. Lawrence River would receive little
benefit from this project (Schoonover and Muller 2002, 4).
Nonetheless, despite the past problems with expansion proposals, the Army Corps of
Engineers again suggested a Seaway expansion. In its report, the Army Corps of Engineers
proposed the following improvements to the Great Lakes/St. Lawrence Seaway System:
1) deepening of the Great Lakes connecting channels to improve vessel traffic
2) improvements to the St. Lawrence Seaway: replacing the existing locks with larger and deeper chambers and providing channels compatible with the larger
lock dimensions
3) deepening individual ports and improvements to ports and harbors within the Great Lakes System. These improvements would include modifications to
existing infrastructure and channels to accommodate deeper draft vessel traffic
(U.S. Army Corps of Engineers 2002, viii)
The Army Corps of Engineers rationalized the above improvements by stating that the current
maintenance methods are not adequate to support the aging Seaway infrastructure. The Army
Corps of Engineers writes:
“The aging Seaway locks are first maintained through normal operation and maintenance, then limited rehabilitation, and ultimately major rehabilitations… Each successively more
aggressive approach to maintenance is phased in as the condition of the Seaway locks deteriorates requiring longer closures… maintaining the locks will likely result in repairs that address immediate concerns … however, these repairs may not be sufficient in scope
to deal with underlying structural problems.” (U.S. Army Corps of Engineers 2002, viii)
To justify Seaway expansion, the U.S. Army Corps of Engineers argued that expansion
would allow bigger containerships to enter the Seaway; these, and other large ships that the
Corps wants to introduce to the Great Lakes region, would be part of the international fleet,
handling international trade (Lake Ontario Keeper 2002). Hence, accommodating containerships

11
would theoretically increase international commerce in the region. In the report, the Army Corps
writes:
“While 70% of the world’s fleet can transit the 80’ X 766’ locks and the 26’-3” Seaway, these vessels represent only 13% of world vessel capacity and 5% of the world container
vessel capacity.. Ever larger ships are being built, indicating that the percentage of the world fleet that is Seaway capable will continue to decline in the foreseeable future.
However, a deeper wider Seaway could accommodate 34% (in terms of capacity) of the world fleet and most importantly, 27% of the world container fleet in terms of gross ton
capacity.” (U.S. Army Corps of Engineers 2002, iii)
Thus, according to the ACE, in order for the St. Lawrence Seaway to remain internationally
competitive, the Seaway must be expanded to accommodate bigger containerships.
An analysis of the Army Corps assertions for expansion leads to the following questions:
the Seaway expansion may physically allow bigger containerships to enter, but with what
amount of certainty can the Army Corps claim that the expansion alone will be enough incentive
for the containerships to go to the Great Lake ports? In another words, will the Seaway
expansion be sufficient cause for containerships to prefer the Great Lakes ports over the Eastern
and Western Coast ports? These questions will be explored in detail later in the paper. For now,
the point that these questions raise is that expansion does not necessarily mean containership
traffic and international commerce will change their patterns to favor the Great Lakes region.
The Army Corps of Engineers answers the above questions by claiming that a
transportation cost analysis for an improved Seaway identified potential bulk Seaway traffic
(U.S. Army Corps of Engineers 2002). Furthermore, according to the Army Corps’s savings
analysis showed some potential for container traffic on the Great Lakes/St. Lawrence System.
The Army Corps’s container analysis also demonstrated some possibility for existing overland
East Coast/ Great Lakes container traffic to divert to the Seaway (U.S. Army Corps of Engineers
2002). These arguments will be evaluated more closely in the results section. However, per

12
Army Corps analysis, an expanded Seaway would attract more containerships in the Great Lakes
region and thus increase international commerce in the Great Lakes region.
Criticisms of the U.S. Army Corps’s Economic Analysis Objectivity
As mentioned earlier, the U.S. Army Corps of Engineers’ report came under heavy
scrutiny. One criticism of the report was its lack of objective analysis. The Corps’s alleged lack
of objectivity in the Reconnaissance Report is of no surprise because they have been similarly
biased in past projects. For example, the Army Corps of Engineers conducted a study of the
Upper Mississippi River and Illinois Waterway (UMRIV). The focus of the study was the entire
lock and dam system of the Upper Mississippi River and Illinois Waterway Navigation System
and the river ecology (Water Science and Technology Board 2004). The Army Corps was to
develop an integrated plan to be approved as a framework for modifications and operational
changes to the Upper Mississippi River and Illinois water system (Water Science and
Technology Board 2004). However, in an analysis of the U.S. ACE’s study, the U.S. National
Academy of Sciences made the following criticism:
“The near lack of any analysis of the viability of non-structural elements for managing waterway traffic represents a considerable analytical gap with the feasibility study
because it is not clear how the benefits of the lock extensions can be reliably estimated without first managing waterway traffic more effectively within the existing system.”
(Water Science and Technology Board 2004, 6)
As project managers, the U.S. Army Corps of Engineers would be responsible for
structural improvements to the UMRIV; therefore, it would be beneficial for the U.S. Army
Corps of Engineers to exclusively focus on structural components in their feasibility study. This
example puts into question the objectivity of the data and analysis used to justify expansion in
the 2002 Reconnaissance Report. Because there may be questionable data/analysis in its

13
Reconnaissance Report, then the U.S. Army Corps of Engineers may have provided uncertain
and insufficient arguments to favor a Seaway expansion in the near future.
Another criticism of the Army Corps of Engineers report is its faulty economic analysis. The
Army Corps has also been criticized for faulty analysis in past project proposals. The following
example of the U.S. Army Corps of Engineers’ past faulty analysis is especially significant to the
St. Lawrence Seaway expansion report because of the similarities between the two project
proposals. In a February 1992 report, the U.S. Army Corps of Engineers proposed deepening the
Delaware River Channel from 40 to 45 feet. As in the current Seaway expansion proposal, the
ACE suggested deepening as a means to accommodate larger vessels (U.S. Government
Accountability Office 2002). Much like the analysis for the St. Lawrence Seaway expansion,
the Army Corps projected (in an updated 1998 report) transportation cost savings related to
importing and exporting cargo in containerships; these savings were projected to be $40.1
million. However, the Government Accountability Office (GAO) evaluated the updated 1998
report and concluded that the U.S. Army Corps of Engineers’ economic analysis of the Delaware
River main ship channel contained a number of material errors (U.S. Government Accountability
Office 2002). The problems with the economic analysis included: miscalculations, invalid
assumptions, and use of significantly outdated information (U.S. Government Accountability
Office 2002). The GAO provided an example of the latter problem:
“The Corps misapplied commodity growth rate projections, miscalculated trade route distances, and continued to include benefits from some import and export traffic that has
declined dramatically over the last decade”
(U.S. Government Accountability Office 2002, 2)
Another U.S. Government Accountability Office criticism of the Army Corps Report was that it
neglected to consider a number of unresolved issues and uncertainties, all of which would affect

14
the outcome of the project (i.e. decrease or increase benefits and costs). (General Accountability
Office 2002, 2) These problems with its economic analysis led the U.S. Army Corps of
Engineers to overstate the benefits of Delaware River deepening project by about $4.7 million.
(U.S. Government Accountability Office 2002, 5)
Another criticism of the Delaware River Report is especially significant to the current St.
Lawrence Seaway expansion debate because it calls into question the benefits that would arise
from the channel deepening. In its critique, the U.S. Government Accountability Office writes:
“…it is uncertain whether all of the potential benefits of a 45 foot channel would contribute to national economic development because most of the ships coming into the Delaware River ports are foreign owned. The Corps’ analysis did not take into account
the distribution of the project benefits between U.S. and foreign interests; in essence, the Corps assumed that all transportation savings attributable to the project would accrue to
U.S. interests.”
(U.S. Government Accountability Office 2002, 7)
Due to the similarities between the St. Lawrence Seaway expansion proposal and the
Delaware River proposal, the above criticisms of the latter project raise doubt about the
economic analysis that the U.S. ACE used to justify expansion. Although some of the particular
circumstances between the Delaware River Channel project proposal may differ from the St.
Lawrence Seaway project proposal, the above U.S. Government Accountability Office criticism
questions the Army Corps of Engineers objectivity and economic analysis when projecting the
benefits of deepening navigation systems. This and the UMRIV examples thus show the
unreliability of the U.S. ACE claims, and as I will mention further in the results portion,
questionable analysis is indeed present in the Reconnaissance Report.

15
Criticisms of Army Corps’s 2002 Seaway expansion proposal
The past project criticisms detailed in above paragraphs served to support later arguments
that expansion benefits may be overstated. I will now turn my focus to criticisms of the 2002
Reconnaissance Report. First, the Army Corps of Engineers report projects an increase in
international traffic/commerce in the St. Lawrence Seaway, but this is inconsistent with recent
data on Seaway traffic. The vast majority of trade on the Great Lakes is domestic, and if the
growth is forecasted in domestic shipping, then the focus of the report should be on the domestic
fleet and not ocean-going vessels (Lake Ontario Keeper 2002). The current data on the Seaway’s
international commerce are important because they serve as an indicator of the potential to attract
future international commerce in the region. This problem will be discussed in more detail in the
Results section.
Second, the U.S. Army Corps of Engineers has had a history of over-projecting traffic in
the Seaway and this leads to the conclusion that its projections for the expanded Seaway may not
be accurate. The Lake Ontario Keeper and Transport Canada evaluated the Corps’s history and
found the following example:
“Between 1998 and 2000 the Corps forecasted an increase in tonnage for all commodities modeled [for the Great Lakes/St. Lawrence Seaway]…an overall increase of 2.49% for
shipping on the Great Lakes, and a tonnage increase of 6.36 % on the St. Lawrence. However, according to the St. Lawrence Seaway Development Corporation’s 2000
annual report between 1999 and 2000, overall cargo by tonnage on the Montréal-Lake Ontario Section (the only section for which data is provided) declined by 2.7%. There were also declines in the three largest commodities by tonnage, with grain declining
7.5%, iron ore declining by 4.4%.” (Lake Ontario Keeper 2002, 8)
This quote thus shows that the Army Corps’s forecasting is not always accurate. Great
Lakes United (GLU) pointed to errors in the Corps’s projection methodology that leads to its
flawed forecasts. In their report entitled “Rethinking the Economics of Navigation,” GLU states

16
that the Army Corps’s forecasts are extremely unreliable because small errors in certain
variables-such as grain yield, elasticity and export demand result in wildly different levels of
traffic. Figure 2 (taken from the GLU report) shows how these errors impact the U.S. Army
Corps of Engineers’ forecasts.
Figure 2. Actual and Corps’s Projected St. Lawrence Seaway Navigation Traffic
(Schoonover and Muller 2002, 17)
This graph demonstrates the discrepancies between Army Corps’s predictions and the actual
traffic on the Seaway. Thus, Great Lakes United’s graph and Lake Ontario Keeper’s analysis
illustrate that the Corps’s short term forecasting is not reliable; therefore, its long-term
predictions for the Seaway may not be either.
As mentioned earlier, these criticisms of the report led the U.S and Canadian governments to
initiate the present Great Lakes St. Lawrence Seaway Study. The ongoing study is conducted by
both Canadian and United States government agencies including Transport Canada, U.S. Army

17
Corps of Engineers, U.S. Department of Transportation, St. Lawrence Seaway Management
Corporation, St. Lawrence Seaway Development Corporation, Environment Canada, and the
U.S. Fish and Wildlife Service.
To complete its analysis of the St. Lawrence Seaway infrastructure and to acquire feedback
about the study, the United States and Canadian governments held stakeholder meetings in the
Great Lakes region. These meetings comprised of various interest groups and individuals who
held differing views about Seaway expansion. As stated earlier, the U.S. and Canadian
governments emphasized at these meetings that expansion would not be considered as an option
in their current study, but, as the interest groups stated, the possibility of expansion may be
raised in future studies.
Among those who oppose Seaway expansion are Great Lakes United, Save the River, and
the Mohawk Council of Akwesasne. Both Great Lakes United (GLU) and Save the River (STR)
are environmental organizations. Great Lakes United is an international coalition that consists of
member organizations representing environmentalists, conservationists, community groups, and
citizens of the United States, Canada, and First Nations and Tribes (Great Lakes United). Save
The River is a non-profit, member-based environmental organization whose mission is to
preserve and protect the ecological integrity of the Thousand Islands Region of the St. Lawrence
River through advocacy, education and research (Save the River). Both these organizations argue
against opposition mainly on environmental grounds, while the Mohawk Council of Akwesasne
(MCA) has both environmental and economic arguments against an expanded Seaway. The
Mohawk Council of Akwesasne represents First Nations citizen opposition against expansion.
Some of the above groups’ environmental concerns are presented below, but more
general environmental effects of expansion (not necessarily specified by these groups) are

18
presented below. A more extensive review of GLU, STR, and MCA arguments will be presented
in the results section.
Expanding the navigation system poses numerous threats to water quality, aquatic life,
and the economy. The channel construction will require the dredging of hundreds of millions of
cubic yards of soil (as stated by the Corps) and this dredging will destroy valuable fish habitat
and also bring contaminated sediments back into the water (Lake Ontario Keeper 2002, 22).
Dredging also has monetary impacts, which the Akwesasne have faced in the past. In their
testimony at the stakeholder meetings, the Akwesasne said, “Dredging spoils were placed on
prime river-valley farmland which severely affected the residents of Akwesasne for whom
agriculture was an important component of the economy. The lands uncovered by dredging
spoils have proved to be unproductive for farming purposes. Toxins from dredge spoils have
their affects on the health of community members generation after generation.” (Mohawk
Council of Akwesasne). The Akwesasne’s past experience with dredging is an indicator of the
effects dredging for the expanded Seaway may have on their community.
There are a number of other environmental arguments against expansion. One is that the
large containerships that will use the navigation system will produce large surge waves that will
increase shoreline erosion, water turbidity, and degrade wetlands (U.S. Environmental Protection
Agency). In addition to these effects, Great Lakes United has stated that if boat activity does
rise, more invasive species will likely be introduced to the Great Lakes and St. Lawrence River
ecosystems. Invasive species are non-native species whose introduction does or is likely to
cause economic or environmental harm or harm to human health (U.S. Environmental Protection
Agency). Invasive species have both negative economic and environmental impacts. Invasive
species have been responsible for approximately $137 billion dollars in yearly costs nationwide,
19
according to 2000 figures from the U.S. Fish and Wildlife Service (U.S. Environmental
Protection Agency). These costs include property loss, management and control costs, and
alteration of ecosystems supporting commercial and recreational activities (U.S. Environmental
Protection Agency). For example, zebra mussels are an invasive species of European origin.
They were introduced to the Great Lakes region in 1986 and have now firmly established
themselves in the ecosystem (U.S. Environmental Protection Agency). The zebra mussel has
caused economic damages in the Great Lakes Region by clogging up water filtration systems.
The zebra mussels will be discussed in more depth in the Results portion of this paper.
In terms of environmental impacts, invasive species represent the second leading cause of
species extinction and loss of biodiversity in aquatic environments worldwide (U.S.
Environmental Protection Agency). Invasive species cause a loss of biodiversity because they
compete with native species for food and habitat, and when the native species with which the
invasive species is competing dies off, this disrupts the complex web of ecological relationships
that were dependent on these native species.
The connection between boats and invasive species is that invasive species often arrive in
aquatic systems through the ballast water of boats. Ballast water is material that is used to
maintain a boat’s stability and assists in allowing the vessel to be steered when the ship has little
or no cargo on board (Claudi and Wiley 1999, 205). Ships carry the ballast water in internal
water tanks located in various regions of the ship (Claudi and Wiley 1999, 205). The tanks are
filled or emptied according to the amount of cargo the ship carries and this process provides
balance and buoyancy when required. The water that is taken from underwater intake ports
(usually located underneath the stern of the ship) is likely to be teaming with living organisms
(Claudi and Wiley 1999, 206). When this water is discharged at the final destination, all of the

20
organisms taken up are released into the receiving waters (Claudi and Wiley 1999). In this way,
invasive species are transported from one region to another and, as mentioned above, disrupt the
economy and environment of the area to which they are introduced.
While it is important to consider the environmental damages caused by the expansion, it
is just as crucial that we analyze the potential environmental benefits of the proposed expanded
Seaway. In the 2002 Reconnaissance Report, the Army Corps argues that a wider Seaway would
enable the existing overland East Coast, Great Lakes container traffic to divert to the Seaway,
i.e., there would be a shift from land transportation modes to water transportation for the
shipment of goods. With greater carrying capacities, cargo boats and containerships are more
energy efficient than land transportation systems and reduce the number of railway cars and
trucks on the highway and rail systems. A reduction in both railway cars and truck use would be
environmentally beneficial. A truck typically uses 1 gallon of diesel fuel to move a ton of freight
59 miles (59 ton miles/gallon), while rail efficiencies have been estimated at 202 to 316 ton
miles/gallon (Center for Neighborhood Technology, 5). This energy consumption is damaging
because trucks and trains frequently travel greater than 100 or 200 miles and therefore would be
using a great deal of diesel fuel, which contains several pollutants that are harmful to public
health alone or in combination with other substances (State of Massachusetts). If transportation
were shifted from land modes to water modes, then a decrease in rail and truck traffic would
likely result in a reduction in the number of diesel emissions per mile due to the fact that ships,
such as barges, typically use a gallon of diesel fuel for every 500 ton miles (Center for
Neighborhood Technology). Thus, lesser number of railway cars and trucks would potentially
result in lower environmental impacts from diesel fuel.
21
Furthermore, lesser number of railway cars and trucks would decrease the strain on
railway and highway systems, and thus diminish the need for maintenance or expansion of their
respective infrastructures to accommodate the railway/truck traffic. Railway construction and
maintenance activities can cause temporary environmental impacts such as air pollutant
emissions and erosion, or can have long term impacts such as habitat disruption and hydrologic
alterations (U.S. Environmental Protection Agency).
A reduction of truck activity would also be environmentally beneficial. Road
construction and trucks are a major source of runoff. Runoff from the road includes sediment,
bacteria, organic nutrients, hydrocarbons, construction chemicals, etc. The polluted runoff from
roads typically contaminates streams first, which then drain into larger streams, rivers, ponds,
lakes, wetlands, and estuaries. Additionally, paved roads increase impervious surface in the
watershed; impervious surfaces prevent water from seeping through into the water table, and
large amounts of runoff are redirected to streams, which eventually lead to downstream flooding
(U.S. Environmental Protection Agency). Thus, due to the negative environmental impacts of
rail and trucks, a shift to marine transportation might be environmentally advantageous. This will
be discussed further in the Results section.
The above paragraphs lead one to ask the following question: how probable is a shift in
domestic transportation from land modes to water modes? Although rail and truck shipping
modes are less energy efficient in carrying goods than cargo boats, they are more time efficient
and get goods to regions more quickly (Department of Geography). To justify the environmental
costs of boats and navigation system, further research will need to show whether significant
amount of domestic transportation will shift; only a significant shift will result in environmental

22
benefits. I will examine this issue more closely in the environmental portion of the results
section.
The remaining portion of this paper will asses the arguments that the Army Corps of
Engineers has made in favor of expansion and also detail the counter arguments made by the
Great Lakes United, Save the River, and Mohawk Council of Akwesasne.
Results
As mentioned earlier in the paper, the U.S. Army Corps of Engineers’ current proposal to expand
the St. Lawrence Seaway is not new; the United States government has explored deepening
possibilities in the past, but did not implement these proposals due to a few states’ objections or
to economic unfeasibility. Similar to past studies, the current expansion proposal is not
economically sound.
The Army Corps claims that if the Seaway were expanded to accommodate vessels with a
35 foot draft, 110 foot width, and 1000 foot length, then, as a result, the Seaway would attract
transport traffic currently moving overland and would attract more world fleet, containerships,
and boat traffic at large. In turn, the greater traffic in the Great Lakes/St. Lawrence Seaway
region would generate employment and income benefits for the region. However, in the
following sections, I will use national waterway commerce statistics, St. Lawrence Seaway
statistics, and global trading pattern statistics to demonstrate the uncertainty of the economic
benefits that the Army Corps predicts the St. Lawrence Seaway expansion will bring to the Great
Lakes region. Furthermore, I will look at those groups of people who will be economically
disadvantaged if an expansion were to occur. In addition to the economic components of the
Seaway expansion, I will also assess the environmental effects of Seaway expansion. Before a

23
final decision is made to expand the Seaway, government officials must first consider whether
the expanded Seaway will draw enough containership and world fleet traffic to justify the
economic and environmental costs of the expansion.
Basics about national waterway commerce
According to the U.S. Bureau of Transportation Statistics, in 2002, water’s share of all
commercial freight (domestic and international) was the following: value: 8.3%, weight: 14.8 %,
and ton-miles: 16.3 % (U.S. Bureau of Transportation Statistics). Domestic waterborne ton-miles
and tonnage have declined in the last two decades, but the opposite has been true of U.S
international trade, which has increased during the same period. The U.S. Bureau of
Transportation Statistics state:
1) maritime transportation carries nearly 80% of the tonnage of U.S. import and export freight
2) from 1993 to 2002 the value per ton of waterborne freight increased from $290 to $370, reflecting rising reliance on imports for manufactured goods.
3) the total tonnage of domestic and international trade traveling U.S. waters increased more
than 10 percent, from 2 billion tons in 1993 to 2.3 billion tons in 2002.
These statistics highlight the importance of waterway commerce to the U.S. economy.
Furthermore, given the fact that the Army Corps of Engineers would like to attract a greater
percentage of the world fleets, these statistics also suggest potentials for the St. Lawrence
Seaway to attract and increase waterway traffic in the Great Lakes Region.
The main argument for St. Lawrence Seaway expansion is that a wider Seaway would
increase vessel traffic by allowing more world fleet, such as containerships, to enter the Seaway
system. Containerships have a cargo carrying capacity of 2,812,000 tons, and with this large

24
carrying capacity, more diverse goods would potentially be able to come to the ports located on
the Seaway. Currently, the Seaway facilitates the trade of only bulk cargo such as grain, iron ore,
coal, and petroleum products (Great Lakes St. Lawrence Seaway System). From 2003-2004, the
total amount of cargo in the Seaway increased from 28,952 to 30,822 tons, or 6 % (Great Lakes
St. Lawrence Seaway System). The addition of containerships would theoretically allow for an
even greater increase in the amount of cargo passing through the system on a yearly basis.
However, it is not clear the exact degree to which waterborne traffic would increase if an
expansion were to occur. It was mentioned earlier that domestic and foreign waterborne trade has
increased since 1993; yet, in the past few years, both foreign waterborne trade and total
waterborne trade have fluctuated between decline and slow growth. Although the cargo passing
through U.S. seaports in 2003 accounted for the largest modal share (41 %) of the value of
overall U.S. merchandise trade, this share declined from 49 % in 1990 as land and air trade’s
share increased (U.S. Bureau of Transportation Statistics).
Because the Army Corps of Engineers wants to attract a larger percentage of world fleet
into the Great Lakes region, it is crucial to look at the total foreign waterborne freight in isolation
from the total waterborne trade. The U.S. Bureau of Transportation Statistics table below
illustrates the pattern of minimal change in foreign waterborne trade during the last three years;
while the foreign waterborne freight had a 4.4% increase from 1999 to 2002, 2002’s foreign
waterborne trade reflected a decline from 2000 and 2001.
Table 1. Total Foreign Waterborne Trade Year Tons 1999 1,136,970.53 2000 1,221,738.32 2001 1,218,131.18 2002 1,189,724.95
(U.S. Bureau of Transportation Statistics)

25
A look at the total waterborne trade would help to determine whether the expanded
Seaway would be able to attract waterborne traffic at large (i.e., both domestic and foreign). An
examination of total waterborne trade shows a similar pattern to that of total foreign waterborne
trade. According to U.S. Bureau of Transportation Statistics, the total waterborne trade in 2002
was 2,123,085 tons. The data for previous years are listed below:
Table 2. Total Waterborne Trade Year Tons 1999 2,094,485.84 2000 2,186,467.91 2001 2,171,165.86
(U.S Bureau of Transportation Statistics)
The table shows that from 1999 to 2002 there was only a 3.5 percent growth. These
minimal changes in national foreign waterborne trade and total waterborne trade point to the
uncertainty of whether an expanded St. Lawrence Seaway would increase world and domestic
fleet traffic in the Great Lakes region. A closer examination of trade on the St. Lawrence Seaway
also supports these doubts on the economic effects of expansion. For instance, a study done by
Lake Ontario Keeper and Transport Canada shows that traffic by tonnage has been relatively flat
in the St. Lawrence Seaway for the last 20 years. According to this report, the traffic on the St.
Lawrence Seaway peaked in 1979 at 82 million tons and has not been above 60 million tons in
the last 15 years (Lake Ontario Keeper 2002). Thus, with a current slow growth in traffic and
trade in waterway commerce generally, as well as in the St. Lawrence Seaway in particular,
actual world fleet traffic from Seaway expansion will likely fall short of the Army Corps’s
predictions.
As one of the Army Corps Engineers’ primary goals for the St. Lawrence Seaway
expansion is to accommodate containerships, in the next and following sections, I will take a

26
closer look at the types of commodities they transport and use this information, along with the
Great Lakes/St. Lawrence Seaway regional trading patterns, to determine whether the expanded
St. Lawrence Seaway would attract containership traffic. Though the Seaway expansion would
be able to physically allow containerships to come to the region, it is unclear whether a
significant number of containerships will, in actuality, pass through the St. Lawrence Seaway.
Containerships and St. Lawrence Seaway trading patterns
In its report, the Army Corps of Engineers stated that the Seaway can only handle 13% of
the world fleet by vessel capacity and 5% of the world container traffic by tonnage, and that
these numbers are declining as ever larger ships are being built (U.S Army Corps of Engineers
2002). The Corps used these numbers to justify an expansion so that a greater percentage of the
world’s fleet and world container traffic would come to the Seaway. However, particular
features of containerships and the St. Lawrence Seaway commerce may impede an expanded
Seaway’s ability to attract significant amount of containership traffic.
The U.S. Army Corps of Engineers would like to draw containerships into the Great
Lakes/ St. Lawrence Seaway region because of their increasing importance in maritime trade
worldwide. According to the U.S. Bureau of Transportation Statistics, U.S. foreign waterborne
container traffic more than doubled between 1990 and 2001 and is expected to continue similar
growth over the next 20 years (U.S. Bureau of Transportation Statistics). On the other hand,
containerships are used to transport only certain goods and this characteristic of containerships
may hinder the ability of the Seaway to attract significant amounts of containership traffic due to
the nature of commerce in the Great Lakes/ St. Lawrence Seaway region. As per the U.S Bureau
of Transportation Statistics, the type of goods transported in maritime imports/ exports varies,
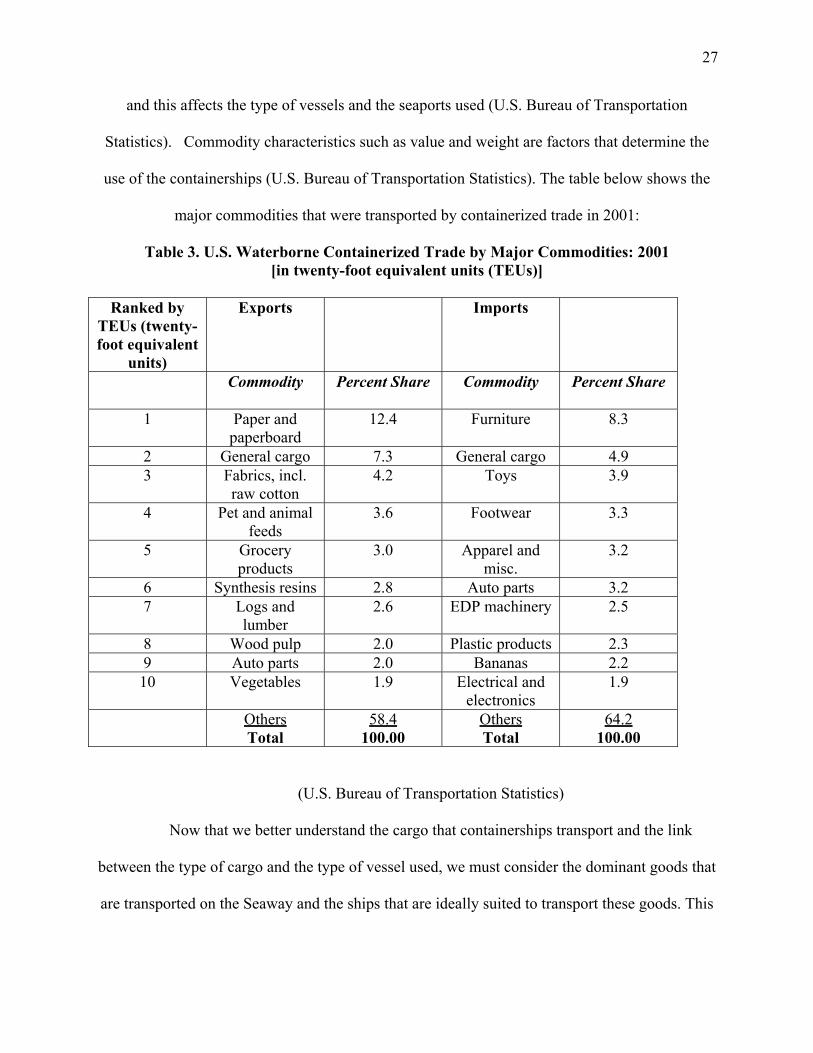
27
and this affects the type of vessels and the seaports used (U.S. Bureau of Transportation
Statistics). Commodity characteristics such as value and weight are factors that determine the
use of the containerships (U.S. Bureau of Transportation Statistics). The table below shows the
major commodities that were transported by containerized trade in 2001:
Table 3. U.S. Waterborne Containerized Trade by Major Commodities: 2001 [in twenty-foot equivalent units (TEUs)]
Ranked by
TEUs (twenty-foot equivalent
units)
Exports Imports
Commodity Percent Share Commodity Percent Share
1 Paper and paperboard
12.4 Furniture 8.3
2 General cargo 7.3 General cargo 4.9 3 Fabrics, incl.
raw cotton 4.2 Toys 3.9
4 Pet and animal feeds
3.6 Footwear 3.3
5 Grocery products
3.0 Apparel and misc.
3.2
6 Synthesis resins 2.8 Auto parts 3.2 7 Logs and
lumber 2.6 EDP machinery 2.5
8 Wood pulp 2.0 Plastic products 2.3 9 Auto parts 2.0 Bananas 2.2 10 Vegetables 1.9 Electrical and
electronics 1.9
Others Total
58.4 100.00
Others Total
64.2 100.00
(U.S. Bureau of Transportation Statistics)
Now that we better understand the cargo that containerships transport and the link
between the type of cargo and the type of vessel used, we must consider the dominant goods that
are transported on the Seaway and the ships that are ideally suited to transport these goods. This

28
analysis will be help to determine whether containerships will indeed be attracted into the
expanded Seaway.
The pie chart below illustrates the main commodities currently transported on the Great
Lakes/St. Lawrence Seaway region:
Figure 3. Commodities Transported on the Great Lakes/St. Lawrence Seaway, by volume
(Lake Ontario Keeper 2002)
According to the pie chart, mined goods, such as iron ore, coal, and stone, are the
predominant goods transported on the Seaway system. These four commodities support the steel
industry in part or in whole, though shipments of coal are primarily to electric utilities (U.S.
Army Corps of Engineers). The agricultural industry is also an important waterway user,
shipping grains from Lake Superior ports through the St. Lawrence Seaway to ports along the
lower St. Lawrence River (mostly for eventual shipment overseas) or directly to overseas
29
destinations(U.S. Army Corps of Engineers). The U.S. Army Corps of Engineers themselves
point to the fact that each fleet is compatible with the traffic and market that the fleet is designed
to serve; the three distinct fleets used in the Seaway system are the intra-laker fleet, a
laker/Seaway fleet, and a laker/Seaway oceangoing fleet of salties (U.S. Army Corps of
Engineers).These dominant fleet correspond with the main commodities transported on the
system. In the Reconnaissance Report, the Army Corps of Engineers described each fleet’s
operation:
1) intra-laker fleet shuttle ore and local docks on Lake Superior and power plants and steel mills on the upper lakes;
2) laker/Seaway fleet, primarily a Canadian fleet, moves grain from Lake Superior to grain elevators on the lower St. Lawrence and iron ore from the lower St.
Lawrence and iron ore from the lower St. Lawrence to grain elevators on the lower St. Lawrence and iron ore from the lower St. Lawrence to steel mills on
Lake Ontario and the upper lakes. 3) The oceangoing fleet of salties is dominated by tramp operators bringing commodities such as steel slab from overseas origins into the lakes, taking on-
light loads of grain in Lake Superior before moving back to the lower St. Lawrence where they are topped off with grain before continuing on to overseas
destinations. (U.S. Army Corps of Engineers 2002, Appendix: 5-1 ).
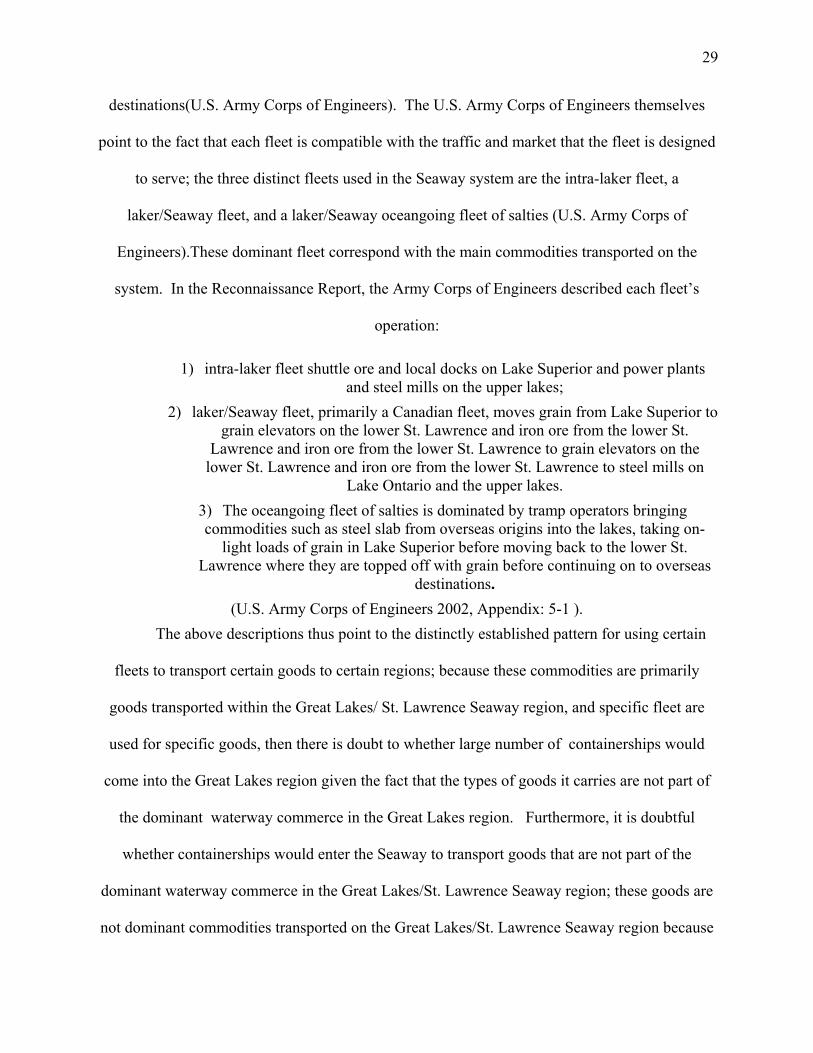
The above descriptions thus point to the distinctly established pattern for using certain
fleets to transport certain goods to certain regions; because these commodities are primarily
goods transported within the Great Lakes/ St. Lawrence Seaway region, and specific fleet are
used for specific goods, then there is doubt to whether large number of containerships would
come into the Great Lakes region given the fact that the types of goods it carries are not part of
the dominant waterway commerce in the Great Lakes region. Furthermore, it is doubtful
whether containerships would enter the Seaway to transport goods that are not part of the
dominant waterway commerce in the Great Lakes/St. Lawrence Seaway region; these goods are
not dominant commodities transported on the Great Lakes/St. Lawrence Seaway region because
30
it may be more economical for them to be transported into and out of the Great Lakes region via
other means, i.e., air or land. The addition of a greater percentage of containership and world
fleet may not easily change this trend in shipment. Thus, because the type of goods affects the
types of vessels being used, the currently used fleet on the Seaway may be most ideal for the
transport of abovementioned commodities. For this reason, it would not be economical for
foreign containerships to enter the Seaway; given the fact that monetary incentives primarily
drive international commerce trends, nations would probably have little incentive to send their
containerships to the expanded Seaway.
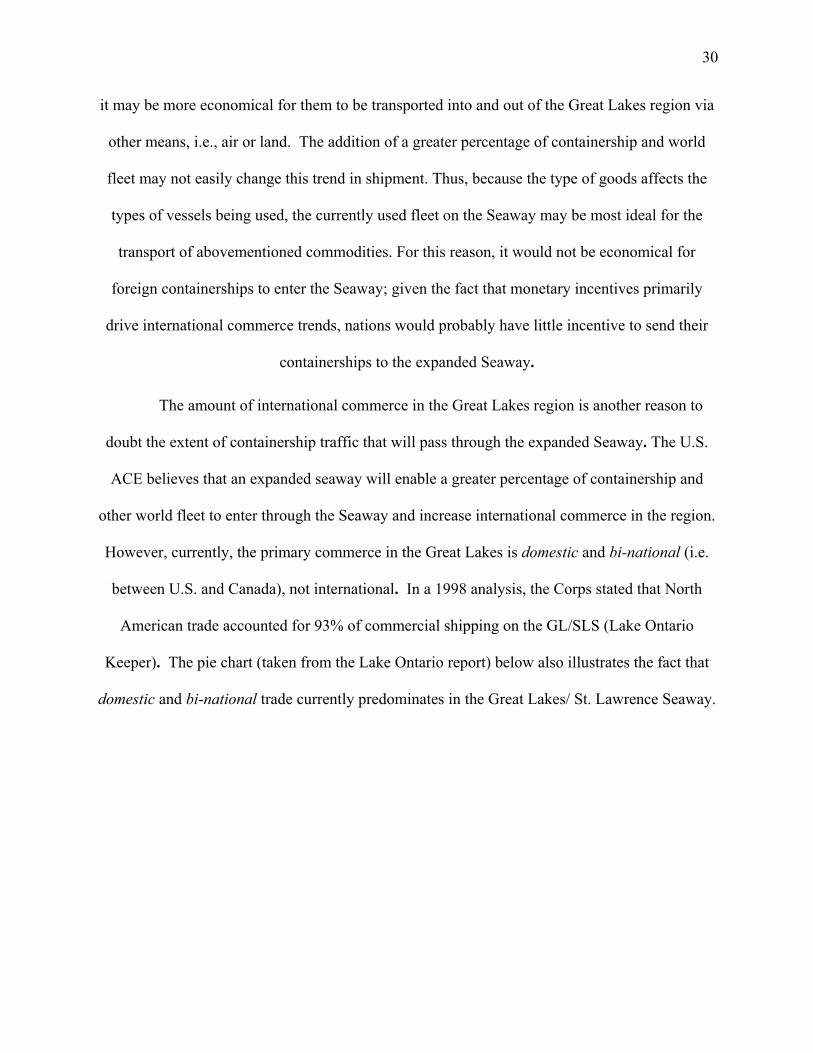
The amount of international commerce in the Great Lakes region is another reason to
doubt the extent of containership traffic that will pass through the expanded Seaway. The U.S.
ACE believes that an expanded seaway will enable a greater percentage of containership and
other world fleet to enter through the Seaway and increase international commerce in the region.
However, currently, the primary commerce in the Great Lakes is domestic and bi-national (i.e.
between U.S. and Canada), not international. In a 1998 analysis, the Corps stated that North
American trade accounted for 93% of commercial shipping on the GL/SLS (Lake Ontario
Keeper). The pie chart (taken from the Lake Ontario report) below also illustrates the fact that
domestic and bi-national trade currently predominates in the Great Lakes/ St. Lawrence Seaway.

31
Figure 4. Great Lakes/St Lawrence Seaway Traffic by Origin and Destination, 1998
(Lake Ontario Keeper 2002)
These statistics calls into question whether the expanded Seaway would attract a greater
percentage of world fleet given the fact that the market for the primary commodities transported
via the Great Lakes/St. Lawrence Seaway goods is domestic/bi-national and not international.
As mentioned above, containerships are part of the world fleet the U.S. ACE wants to attract but
containerships predominantly carry goods that are not part of the dominant commodities
transported in the Great Lakes region.
The argument could be made that expansion would potentially increase general waterway
traffic in the Seaway region and the increased traffic could increase profitability of transporting

32
via water mode the primary commodities that containerships carry. This change in commodity
profitability would, in turn, induce more containerships to enter the Seaway. However, two
things must be kept in mind. First, current market forces have not made water mode an
economical method of transporting these goods (that are carried by containerships) to and from
the Great Lakes/St. Lawrence region; given the fact that other factors have so far been
unfavorable, how likely will it be that increased waterway traffic will increase the possibility of
water transport for these goods? This question leads to the second point: a wide variety of
factors affect the transport of certain goods by water mode, and greater waterway traffic in the
St. Lawrence region may not change the impact that these factors have in making some goods
cheaper to transport via land or air modes. Thus, given the uncertainty of whether the primary
containerships’ commodities will shift from land/air transport to water transport, the potential for
containerships is limited in the Great Lakes and nations will be less inclined to send their
containerships to the Great Lakes/St. Lawrence Seaway region.
Furthermore, we need to take a closer look at why mining and agricultural products are
the primary commodities being transported in the Great Lakes/St. Lawrence Seaway region.
Mined products and grains may have high transporting volumes on the Seaway for the following
reasons:
1) water mode is the cheapest means of transport for these goods
2) the Great Lakes region probably has an abundance of these resources
3) these resources, as shown in the U.S. ACE analysis, also serve primary industries in the region
For the above reasons, these industries have become the most profitable to waterway
commerce in the Great Lakes/St. Lawrence Seaway region. Therefore, as these commodities
dominate waterway commerce, the waterway commerce in the Great Lakes region will probably

33
not shift its specialization to other goods which thus far have not been as profitable or
economical to transport via water mode. The possible economic losses that the Great Lakes/St.
Lawrence Seaway water commerce faces in shifting to transport of other commodities (e.g.,
primary containership commodities) makes it doubtful whether the region’s waterway commerce
will transition to a containership commodity based economy.
Hence, as this section has shown, the dominant commodities that are transported on the
Great Lakes/St. Lawrence Seaway region, the types of vessels used to transport these goods, the
types of goods that containerships transport, and the dominant domestic and bi-national
commerce are all reasons to doubt whether the expanded Seaway will induce an increase in
containership and other world fleet traffic. In the next section, I will further demonstrate the
uncertainty of the expanded Seaway attracting greater number of world fleet and containerships
and increasing international commerce in the region.
Expansion and international commerce
Because nearly all of the large ships that the Corps wants to introduce to the Great
Lakes/St. Lawrence Seaway system are part of the international fleet, the Army Corps of
Engineers believes that expansion will significantly increase international waterway commerce
in the Great Lakes region. However, the arguments below will show that the Seaway’s size
limitation is not the limiting factor for the region’s ability to attract international waterway
traffic; rather, world fleets, including containerships, prefer coastal ports. Other factors, such as
globalization, geography and time, also affect the decision of nations to send their fleets to
coastal and not Great Lakes ports.

34
For this section only, I will assume the fact the previous section’s arguments do not
apply, i.e., the fact that commodities did not determine the type of boats being used for transport
and that containerships would in fact ship the primary commodities that are transported on the
Great Lakes/ St. Lawrence Seaway System. This temporary suspension of the previous
section’s argument will help to facilitate a deeper understanding of the other factors, aside from
boat specialization and regional economy, which also contribute to limiting the international
traffic in the St. Lawrence Seaway. These factors, which will be discussed below, include
geography, globalization, and time.
Currently, world fleets share a preference for coastal ports over Great Lakes ports. The
following table (using 2001 data from the U.S. Bureau of Transportation Statistics) compares the
foreign waterway commerce that the Great Lakes/St. Lawrence Seaway region attracts with the
amount that coastal ports attract. All figures are in tons.
Table 4. Great Lakes versus Coastal Ports Commerce
(U.S. Bureau of Transportation Statistics)
An argument can be made that the Great Lakes Region is not attracting the same foreign
commerce as that of the coastal ports because the latter ports can accommodate container ships
and other bigger boats used in international commerce. Evidence supporting this claim can be
found in the U.S. Bureau of Transportation Statistics report, “America’s Freight Transportation
Great Lakes Coastal
Overseas 5,687,722 1,162,598,344
Canada 51,048,216 -
Total 56,735,938 1,162,598,344
35
Gateways” In this report, the U.S. of Bureau of Transportation Statistics states that one of the
reasons that the Port of Los Angeles is the top transportation gateway is that it “…reflects the
specialization among U.S. seaports. The Pacific and Atlantic coast ports are heavily involved in
container trade….” (U.S. Bureau of Transportation Statistics 2004) Because of the rising
importance of containerships in international waterway commerce, if the Seaway were expanded
to accommodate containerships, then the Seaway ports could potentially attract the same
proportion of international commerce as the Port of Los Angeles and other coastal ports.
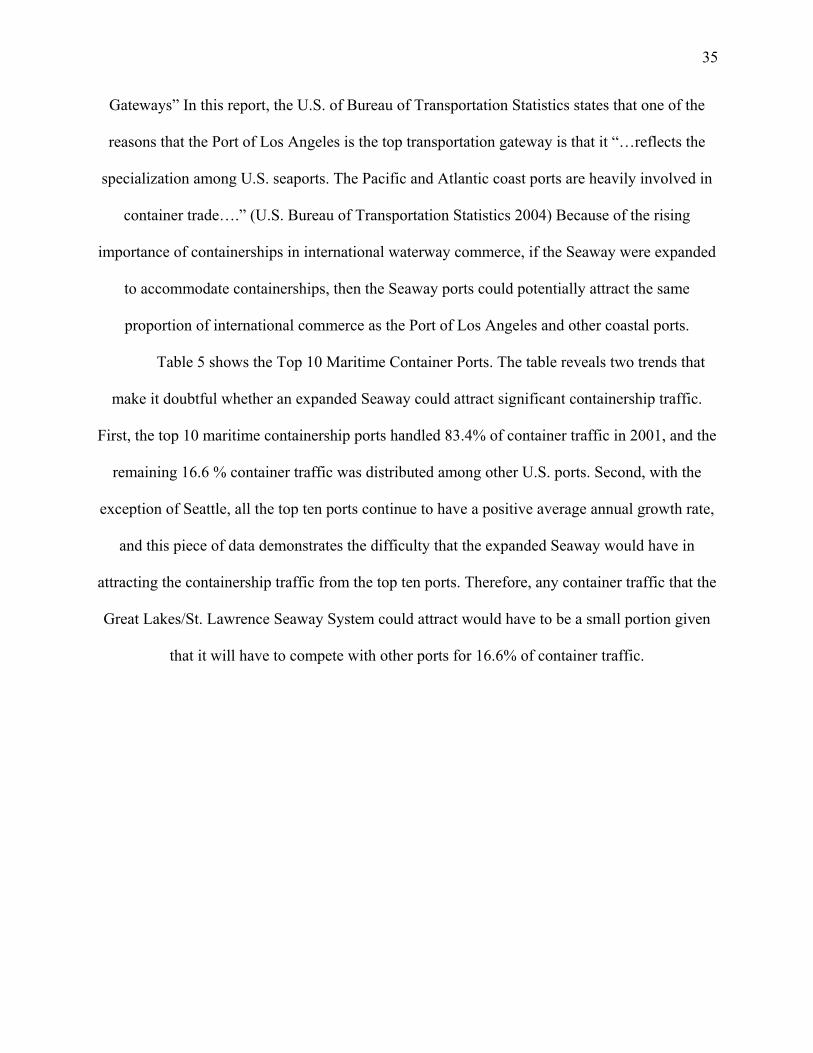
Table 5 shows the Top 10 Maritime Container Ports. The table reveals two trends that
make it doubtful whether an expanded Seaway could attract significant containership traffic.
First, the top 10 maritime containership ports handled 83.4% of container traffic in 2001, and the
remaining 16.6 % container traffic was distributed among other U.S. ports. Second, with the
exception of Seattle, all the top ten ports continue to have a positive average annual growth rate,
and this piece of data demonstrates the difficulty that the expanded Seaway would have in
attracting the containership traffic from the top ten ports. Therefore, any container traffic that the
Great Lakes/St. Lawrence Seaway System could attract would have to be a small portion given
that it will have to compete with other ports for 16.6% of container traffic.

36
Table 5. Top 10 U.S. Maritime Container Ports: 1995, 2000, 2001 [thousands of twenty equivalent unites (TEUs)]
Ports 1995 2000 2001 Average number of TEUs per day (2001)
Percent change
(1995-2000)
Average annual growth
rate (percent)
Los Angeles,
CA
1,849 3,228 3,425 9,384 85.2 10.8
Long Beach, CA
2,137 3,204 3,199 8,765 49.7 7.0
New York and New
Jersey
1,537 2,200 2,332 6,388 51.7 7.2
Charleston, SC
758 1,246 1,156 3,166 52.5 7.3
Oakland, CA
919 989 960 2,630 4.5 .7
Norfolk, VA 647 850 885 2,424 36.7 5.4 Seattle, WA 993 960 824 2,257 -17.0 -3.1 Savannah,
GA 445 720 813 2,226 82.6 10.6
Houston, TX
489 733 778 2,132 59.1 8.0
Miami, FL 497 684 717 1,964 44.2 6.3 Top 10,
percent of total
77.1 82.6 83.4
(U.S. Bureau of Transportation Statistics)
Furthermore, the trend for containership arrival is not merely towards these top 10 ports
but, specifically, West Coast ports. According to the Bureau of Transportation Statistics, during
the 1970s, when U.S. Asia-Pacific Rim trade was modest, East Coast ports handled the majority
of maritime international trade; however, with the rise in trade with Asia, the East Coast ports’
share of the value of trade declined while the West Coast ports’ share has increased (U.S. Bureau
of Transportation Statistics). Also, the Bureau of Transportation Statistics states that today,
West Coast ports serve more as the import gateways into the United States, while the East Coast
ports handle more exports than imports (U.S. Bureau of Transportation Statistics). This pattern is
reflected in the following Bureau of Transportation graph:

37
Figure 5. U.S. Waterborne Containerized Exports and Imports by Coastal Port Region:
2001
(U.S. Bureau of Transportation Statistics)
Thus, the Bureau of Transportation Statistics’ analysis and graph reveal that the West
Coast continues to dominate in attracting importing containership traffic. Also, given the fact
that coastal ports are favored over Great Lakes for international commerce, and that the East
Coast has the infrastructure for containership yet attracts less containership traffic (i.e., importing
containership traffic), then it remains uncertain whether the St. Lawrence Seaway can attract
significant amounts of container traffic to justify expansion. The Seaway expansion may not
induce containership traffic to divert from coastal ports because of other factors (aside from
Seaway size) such as time and geography.
The Bureau of Transportation Statistics’ analysis and graph also show that the West
Coast has been attracting greater containership traffic because of the rise in trade with Asian

38
countries and this demonstrates the significant contributions that Asian countries make to the
U.S. containership traffic. In fact, per Bureau of Transportation Statistics data, in 2001, the top
five overall U.S. containerized cargo trading partners were all Asian countries: China, Japan,
Hong Kong, Taiwan, and South Korea (U.S. Bureau of Transportation Statistics). Consequently,
the Seaway expansion debate concerning containerships must focus on attracting containership
trade from the above countries.
As mentioned above, the current importing container traffic preference is for the West
Coast, and below I will show how geography has played a role in influencing containership
imports to enter at this coast. I will analyze China’s trading pattern as an example and use this
information to show how geography, and not Seaway size, limits its trade via the St. Lawrence
Seaway.
China is a suitable example for two reasons. Of the top five overall U.S. containerized
cargo trading partners, China is the leading country, and therefore, if an expansion were to occur
to accommodate containerships, then the Seaway would have to focus on attracting China trade
into the region. Second, as discussed earlier, the grain industry dominates waterway commerce in
the Great Lakes/ St. Lawrence Seaway region. The grain industry in the Great Lakes region has
potential to attract Asian markets. The Great Lakes United commissioned the Institute for
Agriculture and Trade Policy to analyze the arguments the Army Corp used to justify expansion.
In this document, the Great Lakes United analyzed the market patterns for the grain industry.1
The Institute for Agriculture and Trade Policy states:
1 It must be noted here that the Great Lakes United report will be cited throughout the results section, and the organization’s analysis, like the Army Corps of Engineers, may appear biased as the Great Lakes United opposes expansion. However, their analysis will nonetheless serve the purpose of demonstrating that the potential for an expanded Seaway to increase international commerce and world fleet traffic is contingent upon various economic forces at play in the Seaway region, international commerce, and containership/world fleet traffic.
39
“Europe has reduced its consumption of U.S. and Canadian grains dramatically since 1980. The increasingly global nature of the world market makes it essential to examine where future demand for agricultural and mined products will occur. Demand for U.S.
grain has increasingly shifted toward Asian markets.” (Schoonover and Muller 2002, 5)
The above analysis would fit well with the Army Corps of Engineers argument for
expansion; the Great Lakes/St. Lawrence Seaway has potential to attract Asian markets for one
of its dominant waterway industries, and could possibly spur Asian commerce in other
industries. However, as the U.S. ACE would argue, the Great Lakes/St. Lawrence Seaway region
cannot attract significant commerce from Asian countries because Seaway size limits prevent the
entry of Asian countries’ primary mode of transporting international waterway commodities.
However, Michael Bomba, a researcher at the University of Texas, conducted an analysis
of China’s trading patterns, and his analysis revealed that the West Coast (i.e., Pacific Coast in
Bomba’s analysis) not only dominated in attracting Chinese imports, but also dominated in
exporting goods to China. In 2003, the Pacific Coast ports handled over $100 billion worth of
goods in the U.S./China trade, in comparison to around $24 billion at the Atlantic Coast (i.e.,
East Coast) ports, and around $5 billion at the Gulf Coast ports (Bomba 2004). Percentage wise,
this means that with respect to exports to China, Pacific Coast ports handled 54.2%, while
Atlantic coast handled 24.8%, and the Gulf Coast handled 20.9%; with respect to Chinese
imports, the Pacific Coast received 83.2%, in contrast to 16.0% and 0.8% handled at Atlantic and
Gulf Coast ports, respectively (Bomba 2004). Nor is preference for the West Coast merely a
matter of the West Coast having the infrastructure to manage Chinese containerships and the
Atlantic and Gulf Coasts lacking the adequate infrastructure. This point is illustrated in Figure 6
below. The graph shows that the Atlantic and Gulf Coasts were able to attract some Chinese
containerships, but the Pacific Coast dominated containership imports from China.

40
Figure 6. Percentage of Containerized U.S. Maritime Imports from China by Coast, 2000 versus 2003
(Bomba 2004, 11)
The bar graph and analysis of Chinese waterway statistics show that the limiting factor
for East Coast ports attracting Chinese commerce was not merely the infrastructure to handle
containerships, but some other reason must have played a role in making Pacific Coast more
attractive to the Chinese than the other coastal ports. This reason may be geography and the
proximity of the Pacific Coast to the Asian countries. As discussed in the previous paragraphs,
coastal ports typically attract more international commerce than the Great Lakes ports; given this
condition, if the Atlantic and Gulf Coast ports have a smaller share in attracting Chinese trade
and cannot attract more Chinese trade possibly because the geographical preference for West
Coast ports, then it remains uncertain whether expanded St. Lawrence Seaway ports could attract
a significant amount of Chinese trade. Seaway expansion may not overcome the impact that

41
geography has in attracting significant containership traffic. Because China and other Asian
countries are significant and dominant sources of foreign containership traffic in the United
States, the expanded Seaway would potentially attract lower levels of containership traffic than
the U.S. Army Corps of Engineers projected. Due to the fact that the Army Corp used its traffic
projections to justify expansion, if the containership traffic is lower than these projected
numbers, then the Army Corps’s economic argument for expansion (i.e., attracting a greater
number of containerships and thus greater commerce to the Great Lakes/St. Lawrence Seaway
region) loses its foundation. Hence, the above analysis of China demonstrates that the expanded
Seaway’s limitation is attracting sufficient containership traffic to make expansion economically
justifiable.
As demonstrated with the China example, geography may be a key component in the
attraction of international commerce and containership traffic to certain regions of the United
States. If one looks at international waterway commerce trends, then the geographic pattern will
become even more apparent. The U.S. Bureau of Transportation’s report “America’s Freight
Transportation Gateways” indicates that the Great Lakes ports are at a disadvantage in attracting
international commerce beyond Canada because of their geographic position. The U.S. Bureau
of Transportation’s report is based on 2003 statistics and listed the Top 25 International
Gateways from all modes (land, water, and air.) This report demonstrates that, although nations
such as Germany, Brazil, and Trinidad are among the top three countries importing to the top
eastern gateways for water commerce such as New York, Baltimore, and Norfolk, VA, the
number one source of imports for these ports was Canada. Among the top Western gateways for
water commerce such as Los Angeles, Long Beach, and Oakland, the top countries from which
they import are China (mainland), Japan, and Hong Kong (U.S. Bureau of Transportation

42
Statistics 2004). The West Coast is significantly closer to the Asian countries than to the Eastern
Coast. Hence, these statistics further demonstrate the role that geography plays in determining
the international traffic. In sum, the established preference for coastal ports and the geographic
location of the Great Lakes ports work to the disadvantage of the Seaway attracting international
commerce from outside Canada.
Aside from geography, globalization also plays a role in affecting international commerce
and world fleet traveling trends. An earlier analysis showed that the Great Lakes/ St. Lawrence
Seaway region would have difficulty attracting significant portions of containership traffic (i.e.,
international prospects) for one of its dominant industry for waterway commerce, agricultural
products. The argument could be made that if the Great Lakes/St. Lawrence Seaway region
cannot attract world fleet through its grain industry, then the region should focus on attracting
international commerce through its other main (waterway commerce) industry, mining.
However, globalization also limits any prospects of increasing world fleet in the Great Lakes/St.
Lawrence Seaway region. The mining products are mainly traded regionally, i.e. between
Canada and the United States; according to the Great Lakes United commissioned report, the
United States and Canada will likely never experience a dramatic increase in the international
export of iron ore, salt, and other mined products “no matter what expansion projects are
conducted on [the] ports.” (Schoonover and Miller 2002, 8) The Great Lakes United asserts that
the large number of lower-cost producers around the world will restrict the growth of the
industry, and that expansion of the Seaway could actually harm regional mining operations by
introducing substantial competition (Schoonover and Miller, 9). Thus, despite an expansion,
due to the availability and choice in a wide variety of lower-cost producers, i.e. globalization, the
mining industry would not necessarily generate increased international commerce and traffic.

43
There are other ways that globalization, and not necessarily Seaway size, affects
international commerce in the Seaway region. For example, the Seaway may expand to become
the largest navigation system in the world, but since globalization has opened countries to one
another, if country X can ship cheaper to country Y’s port, country X will take this opportunity
rather than shipping to the Seaway. Even without expansion, this scenario has already occurred
in the Great Lakes region and expansion may not be able to reverse this effect of globalization.
In the Great Lakes United commissioned report (referenced earlier in the section), the Institute
for Agriculture and Trade Policy made the following analysis of globalization and the other
factors that have affected the Great Lakes region:
“Globalization and the trend toward Third World manufacturing, less labor requirements in manufacturing, a sustained farm crisis, U.S. population migration toward Sun Belt and West Coast and many other issues have collectively affected the Great Lakes region to a greater degree than most other regions. There are no signs that these trends are abating
and expanded navigation can neither profit from nor reverse these developments.” (Schoonover and Muller, 7)
Though Great Lakes United opposes the Seaway expansion and therefore may have had
other intentions when making the above assertion, the analysis reiterates the ideas that there are a
wide variety of factors affecting the Great Lakes economy and raises the possibility that these
economic forces may diminish or negate the effect that expansion may have on the Great Lakes/
St. Lawrence Seaway economy and its ability to attract more containerships and other world fleet
traffic through expansion. If the above Great Lakes United claims are true, then expansion of the
Seaway may have limited effects in increasing international commerce in the Great Lakes region.
Thus, as the analysis of globalization and geography has shown, a mere focus on Seaway size as
the hindrance to attracting international commerce and containership traffic ignores the other
factors that are at play in determining containership and other world fleet traffic trends. These
44
factors may play a greater role in determining international commerce and fleet traveling trends
than Seaway size.
Aside from geography and globalization, there are other issues that affect a nation’s decision to
use a coastal port rather than a Great Lakes port; time, for instance, is one component of the
decision. Earlier it was mentioned that the primary containerized cargo, based on 2001 statistics,
was all from Asian countries. For these Asian countries, it may be quicker and cheaper to ship
directly to a West Coast port rather than circling around the United States to ship products to
Great Lakes ports.
Another component of a nation’s decision to use coastal ports may be the type of market
in the port region. Certain goods are marketable in one region than another region because
consumer preferences vary from region to region and city to city. Europe may ship only certain
goods via water transportation, and these goods may have a greater demand and profitability in
the coastal port region than in the Great Lakes region.
Two other possible components of the decision to use coastal ports are the ports’ distance
from the final destination of the goods and the established relationship between the port and the
country involved. A product’s final destination is not always at the port at which it arrives, but a
nation may choose the port that is closest to the product’s final destination. Hence, if a product’s
final destination is Las Vegas, then a nation would more likely ship it to the Los Angles port or
other Gulf Coast port than to a Great Lakes port; the Seaway expansion will not make it less
likely for the nation to ship to the Great Lakes port when a coastal port would be closer to the
product’s final destination.
In addition to a product’s final destination, a nation’s relationship with a port also
influences its decision to use a coastal port. If a nation has had an established practice of

45
shipping to the coastal port, then it is doubtful whether the company will suddenly change its
trading patterns as a result of expansion. The bottom line for international commerce decisions
is increasing profits and decreasing costs to the exporting and importing nations, and the nations
choose to export to U.S. coastal ports because it provides them with the most economic benefits.
A nation may not be willing to sacrifice established, known economic benefits of shipping at a
costal port to unknown and possibly limited benefits at the expanded St. Lawrence Seaway.
All the above mentioned factors may account for the reasons that the coastal ports are
more profitable and attract more world fleet/international commerce than the Great Lakes/St.
Lawrence Seaway ports. Seaway expansion may not change these trends right away. As stated
above, these factors are independent of Seaway size; Seaway size may play some role in a
nation’s decision making process, but other factors, such as time, product destination, and
regional market, contribute just as greatly, or even more, to a nation’s decision making process.
In the near future, the abovementioned factors or other variables that currently favor
coastal ports may alter to favor the Great Lakes ports. For example, traffic congestion is
becoming problematic at West coast ports, and the traffic congestion may lead some ships to go
to Great Lakes ports. It is important to note that the shift to the Great Lakes ports would be the
result of traffic level at the West Coast ports and not necessarily due to Seaway expansion.
When discussing the previous example and the other previously mentioned issues that influence
port traffic, the point to keep in mind is that the Seaway size is not the only factor in the decision
to use coastal ports, and thus it is difficult to say that the Seaway expansion will have enough
effect to counter the other factors at play.
In sum, this section used waterway commerce statistics and Seaway trading patterns to establish
the uncertainty of increased international commerce through Seaway expansion. I further

46
supported this doubt about greater international commerce by pointing to the roles that
geography and large scale economic factors (such as globalization) limit international commerce
in the Great Lakes region and by outlining the reasons that expansion may not be able to
alleviate the effects of these conditions.
However, now that the economic arguments against expansion have been presented in this and
the previous section, some readers may have the following unaddressed points:
1) Containerships don’t carry the goods that are dominant on the Seaway because they currently cannot enter the Seaway. An expansion would allow containerships to go through the Seaway and containerships could possibly carry the dominant Seaway
commodities.
2) The presented arguments assumed that transport traffic would shift from the current Great Lakes fleet to the containerships, but an expansion could possibly allow local fleet
to continue to transport local commodities as usual while adding containerships as additional traffic.
3) An expansion may make containerships a cheaper and quicker mode of transport of
goods moving from one U.S. region to the Midwest. For example, currently, China may ship goods via containerships to the West, and from there, the goods may go by rail or truck to the Midwest. However, if an expansion were to take place, then rather than lie
upon rail or truck modes to get the ship goods to the Midwest, China could possibly ship directly to the Midwest using containerships.
All of these points are valid, but, as I lacked the data, I could not construct the economic
models to determine whether, given the chance to enter the Seaway, containerships would indeed
be a cheaper mode of transport or carry dominant Seaway goods. Though my economic analysis
remains incomplete, the arguments I have made thus far serve to question the extent to which
containership and international trade patterns can be changed.
In addition to attracting more world fleet, the Army Corps’s other justification for
expansion is that jobs will be created in the Great Lakes region. In the next section, I will further
explore this claim. In addition, I will highlight some issues that may be overlooked when

47
discussing benefits of the St. Lawrence Seaway expansion- though the Great Lakes region may
reap economic benefits from the expansion, expansion may also result in economic and
environmental losses, and place a disproportionate burden on some groups of people. The
following two sections will explore to what extent these negative effects of expansion may
undermine the expansion policy.
Job benefits and potential economic losses
In its Reconnaissance Report, the U.S. Army Corps of Engineers projected increases in
employment if the Seaway were expanded to accommodate vessels with a 35 feet draft, 110 feet
width, and 100 feet length. In projecting the increases in employment, the U.S. ACE assumed
that the expansion would increase the container and bulk freight traffic at Great Lakes ports and
the larger traffic would result in direct and indirect job opportunities on the Seaway system. The
following table shows the US ACE’s projected total employment benefits from an improved
Seaway.
Table 6. Total Production, Income, and Employment Annual Benefits
(U.S. Army Corps of Engineers 2002, Appendix: 6-22)
48
The table does not specify the types of new job opportunities, but I will make a rough
analysis of the possible direct and indirect job opportunities that may arise from the St. Lawrence
Seaway expansion. If the expanded Seaway attracted more containerships and consequently
more international commerce, then direct job opportunities would include management of
containership and other world fleet traffic and unloading and transporting goods to land modes of
transportation. Possible indirect job opportunities would include those in the truck and rail
industry; with a theoretical increase in commodities transported on the expanded Seaway, there
would be a greater demand for land modes of transportation (i.e., rail and truck) to transport the
additional quantity of goods from the St. Lawrence Seaway region. Furthermore, if an expanded
Seaway increases commerce in the Great Lakes region, then this prosperity may boost the local
economies at the Seaway ports, and better economies may spur jobs opportunities in sectors not
directly related to the Seaway.
However, job projections are often difficult to make because there are a wide variety of social
and economic factors, (e.g., labor and production costs) that affect job creation and job
projections do not always reflect the conditions and the scale of the factors that will be
interacting when the policy is implemented. Seaway expansion would theoretically provide jobs
but if, when expansion is completed, labor costs are high or the national economy is down, then
the number of jobs created may be on the lower end. Thus, job projections may sometimes
overestimate the number of employment opportunities, and this makes the Army Corps of
Engineers’ job projections speculative at best.
It is therefore uncertain the amount of employment opportunities that expansion would
really create. Expansion may actually result in job losses. The Army Corps predicts an increase
in the number of jobs in the Great Lakes/St. Lawrence Seaway regions, but the increase in

49
employment opportunities may be only in that region and in particular business sectors, and may
come at the expense of other regions in the United States or other business sectors. In the
Reconnaissance Report, the Army Corps of Engineers addresses this problem. The Army Corps
states that the expansion would induce traffic to shift from such ports as New York/New Jersey,
Baltimore, and Philadelphia to Seaway ports (i.e., Buffalo, Chicago, and Detroit) but the overall
net national impact would be zero as the Great Lakes/St. Lawrence Seaway region would benefit
to the disadvantage of the other U.S. and Canadian ports (U.S Army Corps of Engineers). The
following table illustrates the potential loss to different regions of the United States if the
expansion were to induce a shift in port traffic. Thus, the expansion would not be adding any
economic value to the nation, but rather shifting the position and economic value of jobs from
one region to another.
Table 7. Economic Impacts of Shift-of-Port Activity
(U.S. Army Corps of Engineers, Appendix: 6-22)

50
In addition to the negative employment effects in non-Great Lakes regions, certain job
sectors and industries in Great Lakes would be adversely affected by the expansion. For
example, expansion would facilitate the increased entry of invasive species. Invasive species
would pose a threat to recreational and commercial industries by reducing the ability of the Great
Lakes food web to produce the same volume and type of fish and outright eliminating
economically important fish species (Schoonover and Muller 2002, 15). (The full economic and
environmental effects of invasive species to the Great Lakes region will be discussed in the
following section.) Because the recreational and commercial industries generate $4 billion per
year and support 81,000 jobs, the greater number of invasive species in the Great Lakes/St.
Lawrence Seaway region would likely result in economic losses to these industries. Therefore,
though the expansion would produce more employment opportunities at ports and also in
overland transportation, the expansion would result in a loss of jobs and revenue in other sectors
in Great Lakes region that are dependent upon the Great Lakes/St. Lawrence ecosystems
(Schoonover and Muller 2002, 15).
In addition to effects on job sectors and regions, specific groups of people might be
adversely affected by the expansion. One of these groups was mentioned in the
background/theory section: the Mohawk Council of Akwesasne. At the stakeholder meetings in
2004, the Mohawk Council of Akwesasne testified about the impacts that the current Seaway
system has had on their lifestyle; based on their past and current history with the Seaway, I can
project the impact an expanded Seaway may have on this group. For instance, in their
testimony, the Akwesasne state that the commercial traffic in the navigation channel of the
Seaway has resulted in shoreline erosion, and the erosion of shoreline property has resulted in
significant costs to the individual landholder and to the community at large (Mohawk Council of

51
Akwesasne). Therefore, after the Seaway was expanded, the potential increase in containership
and other world fleet traffic would potentially increase shoreline erosion and would impose
greater costs on individuals and the community at large. Furthermore, according to the Mohawk
Council of Akwesasne, the Seaway construction resulted in the degradation of the aquatic
environment and transformation of the St. Lawrence ecosystems and this has resulted in
significant disruption of the Mohawk fishery, a key component of the Mohawk economy
(Mohawk Council of Akwesasne). The Seaway construction also changed the water levels of
the St. Lawrence River, and the change in water levels has led to a reduction in waterfowl and
forage for cattle for the Akwesasne (Mohawk Council of Akwesasne). Thus, the current Seaway
has already had significant negative environmental and economic impacts on the Akwesasne,
and these impacts can lead one to conclude that the Seaway expansion may further degrade the
environmental and economic components that are pivotal to their lifestyles.
This section has shown that expansion may result in a negative impact to different
regions in the United States as well as to certain industries and people who depend upon the
Great Lakes for their survival. The mere fact that expansion would not add economic value to
the United States is enough proof to discredit the U.S. Army Corps of Engineers’ arguments for
expansion. However, the environmental costs can also show why the Seaway expansion would
not be beneficial. The next two sections will focus on the environmental impacts of expansion
and specifically delve into the economic and environmental effects of invasive species.
Environmental impacts of expansion: The expansion process and containerships.
Earlier, I stated that the organizations Great Lakes United and Save the River were opposed to
the expansion on an environmental basis. A few of their arguments will be presented in this

52
section, and their argument concerning invasive species will be considered separately in the
following section.
Analysis of environmental effects of expansion must begin with the expansion process
itself. The Army Corps of Engineers seeks expansion to accommodate Panamax size ships;
these ships are 1000 feet long, 110 feet wide, and have a 35 foot draft (U.S. Army Corps of
Engineers). According to Great Lakes United and Save the River, the following adjustments
would have to be made:
1. “[The] St. Lawrence River and dozens of harbors will need to be deepened as much as 9.5 feet.
2. In areas of soft bottom, the shipping channels (which include St. Lawrence,
Detroit, St. Clair and St. Mary’s Rivers) will need to be widened to as much as 60 feet to stabilize the deeper ditch.
3. Islands bordering the current ship channel will have to be blasted in order to
accommodate larger vessels. “ (Lake Ontario Keeper 2002, 23)
To execute the above adjustments to the Seaway, the Army Corps of Engineers states that
dredging would be required and could generate hundreds of millions of cubic yards of material
requiring placement (Lake Ontario Keeper 2002, 23). In one of their opposing arguments to the
expansion, Great Lakes United and Save the River state that dredging will have short and long
term adverse impacts on the environment. (Lake Ontario Keeper 2002, 23) According to the
organizations, the short-term impacts of dredging hundreds of millions of cubic yards of river
bottom would include destruction of valuable fish habitat and re-suspension of contaminated
sediments into the water column (Lake Ontario Keeper, 23). The long term effects would include
the necessity of maintaining the deeper channels on a regular basis and this maintenance would
limit the chance of regeneration of fish habitat and would repeatedly re-suspend contaminated
53
sediments (Lake Ontario Keeper, 23). The U.S. Environmental Protection Agency (EPA)
supports their claim about the negative environmental effects of dredging. In a 1999 report on the
environmental impacts of transportation, the EPA writes:
“Maintenance dredging… entails dredging a particular channel periodically to sustain a prescribed depth, can prohibit recovery. Dredging can also alter natural water circulation patterns, which can affect ecosystems in a variety of ways, such as through increased or
decreased salinity. Dredging (and other navigation improvements) results in the accumulation of extensive amounts of material from the bottoms of bodies of water.”
(U.S. Environmental Protection Agency 1999, 147)
As the above analysis shows, dredging for expansion would not be a one time activity
that would have short term environmental impacts, but rather, would be a repeated activity
because the deeper channels would require maintenance dredging. Because a one time dredging
activity negatively affects an ecosystem, repeated maintenance dredging would consistently alter
the ecosystems and thus have a long-term impact on the modified portions of the Seaway.
The EPA provides more detail on other environmental effects of dredging. The EPA
states that there are two main disposal methods for dredged material: land disposal or open water
disposal. Since the EPA provides a more in-depth analysis of the latter, only its impacts will be
presented below:
“Disposal of dredged material has the potential to cause far-reaching environmental impacts … Disposal in open water can alter bottom habitats, decrease water quality, and harm marine organisms. Repeated disposal at a site can form mounds in bottom habitats,
because most material sits where it is dumped. Disposal of dredged material in open waters can affect water quality by physical means, such as increasing turbidity, or
chemical means, such as raising pollutant concentrations. Open water disposal can harm marine organisms in a number of ways. Benthic organisms can be killed by physical
burial under dredged material. A more widespread effect of disposal on marine fauna is uptake of toxics. Contaminants may impact the benthic community even if dredged
material is capped, and larger animals may ingest contaminants either directly or indirectly through feeding on smaller animals.”
(U.S. Environmental Protection Agency 1999, 148)
54
The EPA’s analysis demonstrates that the dredging required for expansion will be harmful to the
environment and would likely have far-reaching short and long-term effects.
Great Lakes United and Save the River’s other environmental objection against expansion
involves the effects of deeper and wider channels on the Great Lakes/ St. Lawrence River
ecosystems. Great Lakes United and Save the River’s opposition to the deeper and wider
channels is that they would significantly modify the hydrologic system by increasing flows
through connecting channels and cause major modifications to lake levels throughout the system
(Lake Ontario Keeper 2002, 23). According to Great Lakes United and Save the River, the
modifications to the lake levels would result in lower levels of Great Lakes upstream of river
channels and the greater amount of water flow throughout the system would increase the risk of
flooding wetlands and low lying shorelines in downstream areas (Lake Ontario Keeper 2002,
23). To prevent flooding of the downstream areas, Great Lakes United and Save the River claim
that the government would need to build compensating works such as dams; however these
structures, in particular dams, would affect water temperature and dissolved oxygen
concentrations, two of the most important physical factors affecting all aspects of fish life stages
(Lake Ontario Keeper 2002, 23) Thus, the environmental impacts of the expansion process itself
raise serious doubts about whether a Seaway expansion would be beneficial to the Great Lakes
region.
The second aspect of the environmental assessment will focus on the traffic component
of the Seaway expansion. Expansion of the Seaway will theoretically result in drawing
containership traffic and increasing other types of vessel traffic. Indeed, this increased traffic is
main reason the Army Corps of Engineers is in favor expanding the Seaway. In the
background/theory section, I had pointed to the potential environmental benefits of the greater
55
vessel traffic; if, as the U.S. Army Corps of Engineers claim, an expanded Seaway would induce
traffic to shift from overland modes to the Great Lakes routing (i.e., train/rail shipment to
containership or other vessel shipment) then, as I had claimed, the shift would be
environmentally beneficial because containerships, in particular, would carry more cargo per
trip than trucks and rail and thus there would be less air pollution due to a lesser number of
trucks and trains on the highway and rail systems1. However, there are two problems with this
scenario. First, as discussed earlier, it is not clear if the shift from land modes to containership
shipment would occur and there needs to be more research on whether significant amount of
diversion and significant amount of diversion would be needed to greatly reduce air pollution. In
the Reconnaissance Report, the U.S. Army Corps of Engineers themselves acknowledged that a
complete shift form land mode to water mode would be highly unlikely. Thus, it is difficult to
state with certainty if the environmental benefits of a shift would be realized given the doubt on
how much traffic would divert from land to water mode.
The second problem is that containerships themselves are a bigger source of air pollution
than trucks and automobiles and are also a source of other environmental problems.
Containerships, and other cargo vessels, are a leading source of smog-forming nitrogen-oxides
(Welch). Their exhaust contains dozens of known carcinogens and is high in particulate matter
(fine particles of pollution that lodge in lungs), which leads to asthma, respiratory problems, and
death (Welch). The following numbers put into perspective the amount of pollution that
containerships produce: sixteen containerships produce as many smog forming emissions as one 1 Though the Army Corps of Engineers wants to attract a greater number of world fleet ships (which includes a wide variety), I will focus primarily on containerships as the main thrust of the Army Corps of Engineers argument for expansion is to accommodate containerships. However, some of the environmental effects of containerships can be attributable to marine vessels in general, and this will be noted in the results section. Furthermore, to understand the potential environmental effects of containerships, I will again have to suspend the argument made in the first section of the results portion about the types of commodities that containerships transport and the types of fleet used to transport the primary waterway commerce commodities in the Great Lakes region. Therefore, I will assume that containerships will transport a wide variety of goods.
56
million cars (Blue Water Network). Thus, the use of containerships in the Seaway region would
increase, not decrease, pollution in the Great Lakes region.
Los Angeles, CA is proof of the negative environmental impacts associated with
containerships. As mentioned earlier, Los Angeles is top containership port in the United States.
In 2004, the American Lung Association listed L.A. as the most polluted city by year round air
particle pollution, and some of this air pollution may be attributed to the containership and other
vessel traffic at the ports. Because Los Angeles attracts high amounts of containerships, the
high emissions stemming from the large number of containerships has been one of the
contributing factors of increasing the cancer risk among residents of Los Angeles ( as well as in
Long Beach, CA which also attracts high containership traffic), specifically those living near
the ports (Blue Water Network).
Another effect of containership emissions is climate change. Containerships and other
maritime vessels release greenhouse gasses such as carbon dioxide (CO2), methane (CH4), and
nitrous oxides (NOx) into the atmosphere, and as these gases are responsible for increasing
temperature on the earth; therefore, containerships and other maritime vessel emissions
contribute toward global climate change (U.S. Environmental Protection Agency). Global
climate change, in turn, increases the possibility of rising ocean levels and increased catastrophic
weather activity (U.S. Environmental Protection Agency).
Containership air emissions also indirectly increase water pollution; the fine particles
from the containership exhaust and other potentially toxic particulate matter air pollution may
deposit into drinking water soils or surface waters, where they are taken up by plants and
ingested by animals and are eventually magnified up through the food chain. (U.S.
Environmental Protection Agency) Thus, the air particulate from containerships emissions can
57
lead to water pollution, which consequently affects human health and leads to disruption of
ecological relationships.
A 1999 Environmental Protection Agency (EPA) report entitled “Indicators of the
Environmental Impacts of Transportation” fully delineates the negative environmental effects of
containership and other marine vessels. According to the EPA report, wakes from large (such as
containerships) or fast-moving vessels can cause erosion and vegetative in confined or shallow
waters (U.S. Environmental Protection Agency 1999, 166). Furthermore, wakes can cause
strong wave propagation that can stir up bottom sediments in shallow areas (U.S. Environmental
Protection Agency 1999, 166). Sedimentation is particularly problematic for vegetation because
it reduces the amount of sunlight available for photosynthetic processes (U.S. Environmental
Protection Agency 1999, 166). The EPA also states that the impacts of wakes are local in nature
and likely to be more pronounced in confined, high traffic areas (U.S. Environmental Protection
Agency 1999, 166). As the Army Corps of Engineers anticipates the Seaway expansion
attracting higher traffic, wakes from containership and other vessel traffic will therefore be
highly disruptive to the local port and regional (i.e., Great Lakes) ecosystems in the St. Lawrence
Seaway.
The addition of containership traffic and greater vessel traffic would also raise the
probability for oil and non-petroleum spills to occur in the Great Lakes/St. Lawrence Seaway
region. Releases of hazardous materials, especially petroleum products, from vessels are one of
the most publicized impacts of maritime transportation (U.S. Environmental Protection Agency
1999, 167). Oil spills have a detrimental impact on both the aquatic and human environment.
When an oil spill occurs, toxic hydrocarbons, such as benzene and toluene, are released into the
aquatic environment and cause immediate wildlife deaths (U.S. Environmental Protection

58
Agency 1999, 168). In the 1999 report, the EPA listed some of the environmental effects of oil
spills:
“Shellfish and non-migratory fish, especially those in the larval stage, are the most susceptible to these chemicals. Other chemicals form sticky, tar-like globs on the surface
that adhere to marine wildlife such as birds, otters, and seals, as well as to sand, rocks, and almost all other substances. Many animals that come into contact with such
chemicals die from drowning or loss of body heat. Heavy components of oil that sink to the bottom of bodies of water may have the most profound impacts on ecosystems. Such pollution can kill or damage benthic organisms and adversely affect food webs. Studies
of some oil spills have shown that it takes most species of marine life three years to recover from exposure to large quantities of crude oil. Recovery times may be much longer (10 or more years) for exposure to refined oil, especially in areas with weak
currents or cold waters.” (U.S. Environmental Protection Agency 1999, 168)
As per EPA analysis, the oil spills that result from vessel activity have a lasting ecological
impact that cannot be easily remedied. With the greater number of containership and other
vessel traffic in the Great Lakes /St. Lawrence Seaway region, there would be a greater risk of
severe oil spills, which could have drastic effects on the Great Lakes ecosystem.
The EPA also discusses the impact that oil spills and other non- petroleum spills would
have on human communities and on ecosystems:
“Oil pollution in the vicinity of shorelines can cause ecological harm in coastal
ecosystems. Humans also experience health effects from oil spills. Exposure is dependent on how much oil washes ashore and how much seafood is contaminated and eaten. Some
of the chemicals resulting from spills, such as benzene, are highly toxic to humans. Ecosystems and humans also experience impacts from maritime spills of non-petroleum
hazardous waste. Such spills can lead to wildlife kills, unswimmable and unfishable waters, shellfish bed closures, and human exposure through contact and food.”
(U.S. Environmental Protection Agency 1999, 168)
The above analysis would thus make clear that though there may be some environmental
benefits from a shift in the domestic mode of commodity transport to the water mode, these
environmental benefits from a modal shift would likely be outweighed by the negative

59
environmental effects of containership and increased traffic in the Great Lakes region. To sum
up this section, I have shown that the expansion process and the increased containership traffic
would likely inflict damages to the environment. These environmental costs must be weighed in
evaluating whether expansion is justifiable. In the following section, I will look more closely at
the biggest environmental threat that expansion poses: increase in invasive species.
Environmental effects of expansion: Invasive species
Opponents of expansion, including Great Lakes United and Save the River, use the
negative impacts of invasive species to support their case. In the analysis of the negative
economic impacts of expansion, I had discussed that expansion would result in increased
entrance of invasive species into the Great Lakes region and that invasive species would have
environmental and economic consequences, such as disruption of the food web and the
elimination of economically significant fish. Below, I will provide further information on how
invasive species arrive in the Great Lakes, establish that invasive species are already a problem
in the Great Lakes region, and prove that expansion would only compound the problem. I will
also use current policy problems to demonstrate that expansion will not be beneficial in aiding
the Great Lakes in their fight against invasive species.
To review, invasive species are non-native species whose introduction does or is likely to
cause economic or environmental harm or harm to human health (U.S. Environmental Protection
Agency). Once established, it is extremely difficult to control their spread (U.S. Environmental
Protection Agency).One of the primary sources of invasive species is the ballast water of boats.
About 30% of current non-indigenous introductions can be definitely attributed to a ship source,
and the majority of this percentage is considered to be ballast water introduction (Claudi and

60
Wiley 1999, 207). Again, in review, ballast water is internal water tanks located in various
locations in the ship. These tanks are filled or emptied according to amount of cargo that the ship
carries, providing balance and buoyancy when required. The water is taken in through
underwater intake ports, and discharged at final destination spot (Claudi and Wiley 1999, 205).
Throughout this process of water intake and discharge, invasive species are taken in from one
location and transported to another destination. Thus, because of the use of ballast water by
ships, boat activity has facilitated and continues to facilitate the introduction of invasive species
into the Great Lakes region. In turn, as will be illustrated through specific examples, some of
these invasive species that have entered via vessel activity have resulted in permanent alterations
in the Great Lakes ecosystem and have become some of the biggest environment and economic
problems to the Great Lakes region. It then follows that if invasive species are already a problem
in the Great Lakes region, and if the Army Corps’s claims are true that an expanded seaway
would draw more containerships and increase boat traffic, then, given the fact that ships are one
of the main sources for entrance of invasive species, the increased traffic will bring with it more
invasive species into the Great Lakes region.
The Great Lakes history of introduction of invasive species through marine vessel
activity demonstrates the potential problems of increased traffic in the region. The introduction
of invasive species into the Great Lakes is a result of the canals that were built in the early 1800s
as well as to the opening of the St. Lawrence Seaway. The advent of the canal building fever in
North America in the early 1800s resulted in Lake Erie being accessible from the Hudson River
by 1825 and Lake Ontario from the St. Lawrence by 1847 (Claudi and Wiley 1999, 204). The
opportunity was provided for organisms to be transported upstream on vessels using these canals
(Claudi and Wiley 1999, 204).

61
In their essay, “Freshwater Nonindigenous Species: Interactions with Other Global
Changes,” Cynthia Kolar and David Lodge (2000) provide a historical example of an invasive
species and the effects of its introduction into the Great Lakes. Kolar and Lodge write that the
sea lamprey was one of the first high impact species to enter the Great Lakes via canals and most
probably gained access through its attachment to the hull of ships. The sea lamprey is a parasitic
fish that attaches to a large fish and sucks its fluids. It was first discovered in Lake Erie in 1921
and Kolar and Lodge (2000) state that by 1946, the sea lamprey became established in all the
Great Lakes, and had contributed to dramatic declines in lake trout populations and localized
extinctions of lake trout in 415 lakes. They also preyed heavily on burbot fish and larger
whitefish species and this predation led to their extinction of these species (Kolar and Lodge
2000, 8). As a result of its predatory behavior, the sea lamprey distorted the historical food web.
Figure 7 shows the historical food web and the changes that the sea lamprey and other invasive
species have caused to this food web.

62
Figure 7. Historical Food Web versus Modern Food Web (with invasive species)
(Kolar and Lodge 2000, 8)
The figure above thus shows the effect that a relatively small number of invasive species
have had on the ecological relationships in the Great Lakes; the figure can be used as an
indicator of what might happen if containerships and other world fleet are coming from different
ecosystems that vary from the Great Lakes region and bringing along with them species that do
not fit into the ecosystem dynamics of the Great Lakes region. Furthermore, even though these
vessels may introduce a relatively small number of new species, the above figure shows that
even small number of species can have profound effects.

63
The effects after the St. Lawrence Seaway opening is further proof of the link between
greater vessel traffic and greater invasive species in the Great Lakes region. The opening of the
St. Lawrence Seaway in 1959 also helped to increase the rate of non-indigenous aquatic
introductions into the Great Lakes. The Seaway opening allowed transoceanic ships to enter and
also brought down the economic barriers to entry of ships carrying ballast (Claudi and Wiley
1999, 207). Because ballast water is one of the primary means of transporting invasive species,
the increase in ballast water carrying ships, along with the increase in the number of ships
entering the Great Lakes region, contributed towards increasing invasive species in the Great
Lakes region (Claudi and Wiley 1999, 207). For example, in the century and a half between
1810 and 1959 there were only 90 introductions of invasive species; however, upon the opening
of the Seaway and increased vessels with ballast, in the thirty years between 1960 and 1990,
there were 43 introductions (Claudi and Wiley 1999, 207). In another words, 90 introductions of
invasive species in 149 years is roughly .60 species/ year, while 43 introductions in 30 years is
roughly 1.43 species a year. These statistics demonstrate that the rate of invasive species
introductions from 1960 to 1990 is 2.4 times the rate of introductions from 1810 to 1959. Thus,
the above data demonstrate the significance that greater amounts of foreign vessel activity have
had on the introduction of invasive species into the Great Lakes region.
Invasive species bring not just ecological costs, but also economic ones, as we can see
from the case of the zebra mussel. The Seaway’s opening to transoceanic vessels enabled zebra
mussels to enter the Great Lakes region. The zebra mussel was first introduced into Lake St.
Clair in 1985 or 1986 via ballast water and spread to the Great Lakes region within just two years
(U.S. Environmental Protection Agency). Zebra mussels are currently one of the most
environmentally and economically detrimental species to the Great Lakes region. Its

64
environmental effects include nearly eliminating the clam population, reducing the available
food and oxygen for native fauna, and disrupting the food supply through its feeding processes
(U.S. Environmental Protection Agency). Zebra mussels are also responsible for clogging water
intake pipes, water filtration plants, and power generating plants, and as a result, municipalities
and larger industries in the Great Lakes each pay, on the average on average, $360,000 per year
to control zebra mussels, with documented cumulative basin-wide costs of $120 million from
1989 to 1994 (U.S. Environmental Protection Agency). Furthermore, the U.S. Fish and Wildlife
Service estimates the potential economic impact of zebra mussels at $5 billion over the next ten
years to U.S. and Canadian water users within the Great Lakes region alone (U.S. Geological
Survey).Given the economic and environmental costs the Great Lakes region faces from just one
species, zebra mussels, increased vessel traffic will likely add to these costs significantly because
they will bring dozens of new invasive species into the region.
The above paragraphs have thus shown why increased world vessel traffic will likely
contribute to the increase in invasive species in the Great Lakes region and subsequently a rise in
the region’s environmental and monetary costs. These costs will likely be exacerbated by the
lack of effective federal and regional policies to cope with invasive species.
For instance, in 2003, the U.S. Government Accountability Office (GAO) presented and
released a report entitled “Invasive Species: Federal Efforts and State Perspectives on Challenges
and National Leadership.” Highlights from the report are presented below:
1) “while national management plan calls for many actions that are likely to preventing and controlling invasive species in U.S., does not provide specific long-term goals towards
which the government should strive.”
2) “current federal efforts are not adequate to prevent the introduction of invasive species into the Great Lakes via the ballast water of ships. Although federal official believe that more should be done to protect the Great Lakes from ballast water charges, their plans

65
for doing so depend on the development of standards and technologies will take many years.”
3) “More recently, state officials who responded to the GAO’s survey identified a number of gaps in or problems with, existing legislation addressing invasive species and other
barriers to managing invasives. Many states identified the lack of legal requirements for controlling invasive species that are already established or widespread as key gap in
legislation addressing both aquatic and terrestrial invasive species. State officials also recognized ineffective standards for ballast water as a major problem in aquatics
legislation. Regarding barriers to managing invasive species, state officials identified a lack of federal funding for state invasive species efforts, public education and outreach,
and cost-effective control measures as major problems.”
(U.S. Government Accountability Office 2003, 2-5)
The current federal policy problems in the management of invasive species would make
it difficult to adequately address and combat the invasive species that would arrive if the Seaway
were expanded. The new invasive species in the Great Lakes region would increase the policy
problem of invasive species because targeted management programs would have to be developed
to address the specific environmental impacts of the new invasive species. Furthermore, while
these management programs are being constructed, the new invasive species would increase the
environmental and economic costs to the Great Lakes region.
The above paragraphs have demonstrated how greater containership and world fleet traffic in the
Great Lakes/St. Lawrence Seaway would increase the number of invasive species in the Great
Lakes region. Furthermore, I showed how invasive species already have negative environmental
and economic impacts on the Great Lakes region and that an increase in invasive species from
greater international fleet traffic would compound these effects. The current problems of
invasive species management would make it difficult to adequately prevent or address the threat
of any new invasive species. Therefore, the threat of greater invasive species into the Great
Lakes region demonstrates that Seaway expansion would not be beneficial.

66
Conclusion
The U.S. and Canadian governments are not now considering expansion in their current
studies of the Seaway, but they may consider expansion in the near future. Based on the
arguments I have presented above, my policy recommendation is that the U.S. and Canadian
governments not consider Seaway expansion in the near future. By assessing the U.S. Army
Corps of Engineers’ justifications for expansion, I was able to show that expansion is not sound
on either an economic or an environmental basis. The U.S. Army Corps of Engineers want to
expand the Seaway to accommodate containership traffic, but as I have shown, the Great Lakes
region would likely not attract significant containership traffic even if the Seaway were
expanded. A few of the reasons that the Great Lakes region would not attract large containership
traffic include the difference between the dominant commodities transported on the Great
Lakes/St. Lawrence Seaway System and those carried by containerships, the current
containership preference for coastal traffic, and the Great Lakes/St Lawrence Seaway System’s
geographic location.
Another reason that expansion is not justified is due to its potential economic and
environmental costs. The economic costs would include loss of employment of certain job
sectors, a reduction of employment opportunities in certain regions of the United States, and the
impact on the Great Lakes’ fishing industry. Some of the environmental costs of expansion
include habitat destruction, greater air and water pollution, and disruption of the ecological
relationships in the Great Lakes region. Thus, for economic and environmental reasons, the St.
Lawrence Seaway expansion is unjustifiable.
The arguments I presented here were based on current available data and are by no means
complete. To solidify a case against the Seaway expansion, an economic model will need to be

67
constructed to determine whether containerships will be the cheapest method of shipping goods
to and from the Midwest. Another economic model will have to focus on the likelihood that
dominant Seaway goods would change from transport on current fleet to containership transport
if expansion were to take place. Statistics about individual ports on the Seaway and the markets
at those ports would also be useful in a cost benefit analysis of the proposed expansion. Aside
from further research into the economics of expansion, more data must be collected on
containership air pollution and on how containership air pollution compares with pollution from
a diesel truck and train engine. These statistics would enable us to make a better assessment of
which mode of freight transport causes the least amount of environmental damage. Furthermore,
a model must be developed to determine whether there would be substantial diversion of land
traffic to water traffic, and if so, to what extent this diversion would offset any environmental
impacts of containership emissions.
In addition to further research into the economic and environmental effects of expansion,
the U.S. and Canadian governments should continue to focus on the improvements that can be
made to the current Seaway infrastructure and on ways the Seaway can increase commerce in the
region. In the paper, I mentioned that a great deal of commerce in the Seaway is domestic or bi-
national. Rather than trying to increase international commerce, perhaps the United States and
Canadian governments should focus on how to increase Seaway trade between the two nations
and to attract economic interest from different regions of both nations.

68
Bibliography
American Lung Association. “State of the Air: 2004.” www.lungusa.org Accessed 5 May 2005.
Bomba, Michael S. “Shifting U.S. China Maritime Logistical Patterns: The Potential Impacts on U.S. Gulf Coast Ports.” http://trb.org/Conferences/MTS/4C%20BombaPaper.pdf Accessed 20
March 2005
Center for Neighborhood Technology “Portal of Growth: a Preliminary Report on Sustainable Economic Development Opportunities Available by Developing the Illinois International Port
District (the Port of Chicago). 14 August 2002.
Claudi, Renata and Wiley, C.J. “The Role of Ships as a Vector of Introductions for Nonindigenous Freshwater Organisms, with Focus on the Great Lakes.” NonIndigenous
Freshwater Organisms: Vectors, Biology, and Impacts. Ed. Renata Claudi and Joseph H. Leach. New York: Lewis Publishers, 1999. 203-209.
Department of Geography, Concordia University. “The St. Lawrence Seaway.”
http://collections.ic.gc.ca/stlauren/econ/ec_consslseaway.htm Accessed 10 Nov 2004.
“Environmental toxins: Exotic species threaten health of Great Lakes.” Health and Medicine Week. 5 July 2004
“Exotics threaten Great Lakes food web, report says.” Detroit Free Press. 10 October 2004.
Great Lakes Directory. www.greatlakesdirectory.org Accessed 10 Nov 2004.
Great Lakes Information Network. “Great Lakes” www.great-lakes.net Accessed 12 October
2004.
Great Lakes St. Lawrence Seaway Study. http://www.glsls-study.com Accessed 12 October 2004.
Great Lakes St. Lawrence Seaway System. “Competitiveness.” http://www.grandslacs-
voiemaritime.com/en/aboutus/competitiveness.html Accessed 15 November 2004.
Great Lakes United. “Navigation Issues.” www.glu.org Accessed 20 December 2004.
Kolar, Cynthia S. and Lodge, David M. “Freshwater Nonindigenous Species: Interactions with Other Global Changes.” Invasive Species in a Changing World. Ed. Harold A. Mooney and
Richard J. Hobbs. Washington D.C.: Island Press, 2000. 4-5.
Lake Ontario Keeper. “Analysis: Great Lakes Navigation System Review.” http://www.glu.org/english/projects/biodiversity-habitat 15 July 2002.

69
McGran, Kevin. “Shoe-horning down the canal; the 175-year old Welland waterway is too narrow and shallow for the world’s larger freighters but rapid expansion could drain the Great
Lakes and damager ecosystem.” Toronto Star. 6 June 2004
McKenna, Barrie. “St. Lawrence Seaway Expansion May Have Devastating Ecological Impacts.” Toronto Globe. 13 June 2002.
Mills, Edward, Chrisman, Jana R., and Holeck, Jana. “The Role of Canals in the Spread of
Nonindigenous Species in the North America.” NonIndigenous Freshwater Organisms: Vectors, Biology, and Impacts. Ed. Renata Claudi and Joseph H. Leach. New York: Lewis Publishers,
1999. 351-355.
Mohawk Council of Akwesasne. “On the Economic Aspect of the Great Lakes St. Lawrence Seaway Study.” www.mohawknation.org/pages/presentationAngieBarnes.htm 20 March 2005.
Pennsylvania Transportation Institute. “Analysis of the Great Lakes/St. Lawrence River
Navigation System’s Role in U.S. Ocean Container Trade.” University Park: 2003.
Save the River. “News Articles” http://savetheriver.org/advocacy/seaway/news/nav_study_mtg.htm Accessed 20 Jan 2005.
Schoonover, Heather and Muller, Mark. “Rethinking the Economics of Navigation.” December
2002. www.glu.org Accessed April 2005.
“St. Lawrence Seaway.” www.schoonervoyage.com/v_stlawrence.html Accessed 15 April 2005.
State of Massachusetts. “Diesel background” http://vehicletest.state.ma.us/dieselbg.html Accessed 19 May 2005.
The Transportation Institute. “Present Status.” www.trans-inst.org/1.html Accessed 20 Jan 2005.
Water Science and Technology Board. “Restructured Upper Mississippi River-Illinois
Waterway.” 2004 http://www.nap.edu/ Accessed 13 February 2005.
Transport Canada. “List of Figures.” http://www.tc.gc.ca/pol/en/report/anre1996/tc96_list_of_figures.htm Accessed 5 May 2005.
U.S. Army Corps of Engineers. “Reconnaissance Report: Great Lakes Navigation System
Review.” June 2002. http://www.lre.usace.army.mil/greatlakes/greatlakes&st-lawrenceseawaystudy/approvedreconnaissancereport/ Accessed 10 April 2005
U.S. Bureau of Transportation Statistics. www.bts.gov Accessed 10 Oct. 2004.
U.S. Bureau of Transportation Statistics. “America’s Freight Transportation Gateways.” 2004.
www.bts.gov Accessed 12 November 2004.

70
U.S. Department of Transportation: Maritime Transportation. “U.S. Waterborne Foreign Trade Total: Top 25 Trading Partners Calendar Years 1997 through 2003.” 2004. www.marad.dot.gov
Accessed 15 April 2005.
U.S. Environmental Protection Agency. “Great Lakes.” http://www.epa.gov/glnpo/ Accessed 20 March 2005.
U.S. Environmental Protection Agency. “Indicators of the Environmental Impacts of
Transportation.” 19 October 1999. http://www.epa.gov/otaq/transp/99indict.pdf Accessed 30 April 2005.
U.S. Geological Survey. “Invasive invertebrates: zebra mussel.” http://www.glsc.usgs.gov 21
April 2005.
U.S. Government Accountability Office. “Delaware River Deepening Project: Comprehensive Reanalysis Needed.” June 2002. http://www.gao.gov/new.items/d02604.pdf Accessed 21
November 2004.
U.S. Government Accountability Office. “Invasive Species: Federal Efforts and State Perspectives on Challenges and National Leadership.” 17 June 2003. http://www.gao.gov/new.items/d03916t.pdf Accessed 30 April 2004.
Welch, Craig. “Bush cut some diesel pollution but let big ships keep spewing” 28 Sept 2004. The
Seattle Times. http://seattletimes.nwsource.com/html/politics/2002048167_bushship28m.html Accessed 28 April 2004.