wei2019 methodology annex - .net framework
TRANSCRIPT
World Energy Investment 2019: Methodology Annex & Glossary of Key Terms 1
World Energy Investment 2019: Methodology Annex & Glossary of Key Terms
World Energy Investment 2019: Methodology Annex ........................ 2
Measuring investment in energy efficiency ........................................................ 3
Measuring investment in oil, gas, and coal ......................................................... 5
IEA Upstream Investment Cost Index (UICI) ................................................ 5
IEA Upstream Shale Investment Cost Index (USICI) .................................... 6
Measuring investment in power ......................................................................... 6
Financing and funding trends .............................................................................. 8
By financing mechanism.............................................................................. 8
Green bonds ................................................................................................. 8
Research and Development ................................................................................ 9
References ......................................................................................................... 11
Abbreviations and acronyms .............................................................. 13
Glossary ............................................................................................... 15 IE
A. A
ll rig
hts
rese
rved
.
World Energy Investment 2019: Methodology Annex 2
World Energy Investment 2019: Methodology Annex
Comments and questions are welcome and should be addressed to: Energy Supply and Investment Outlook Devision, International Energy Agency 31-35 rue de la Fédération, 75739 Paris Cedex 15, FranceTelephone: (33-1) 40 57 65 12; Email: [email protected]
Introduction
The way investment is measured across the energy spectrum varies, largely because of differences in the availability of data and the nature of expenditures. This document explains in greater detail the methodology used to ensure that the estimates are consistent and comparable across sectors in World Energy Investment 2019 (WEI 2019). The definition of investment changed from the previous editions of WEI where investment was defined as overnight capital expenditure. In WEI 2019, investment is defined as ongoing capital spending on assets . For some sectors, such as power generation, this investment is spread out evenly from the year in which a new plant or upgrade of an existing one begins its construction to the year in which it becomes operational. For other sources, such as upstream oil and gas and liquefied natural gas (LNG) projects, investment reflects the capital spending incurred over time as production from a new source ramps up or to maintain output from an existing asset.
For energy efficiency, the measurement task is more complex and much of the expenditure is by consumers for whom purchases of more efficient goods are not investments per se. In WEI 2019, as in WEI 2018 and other recent IEA reports, investment in energy efficiency includes incremental spending by companies, governments and individuals to acquire equipment that consumes less energy than that which they would otherwise have bought. Due to the different possible methodologies available, this estimate of energy efficiency investment is not definitive but still included to provide a comparison with the scale of investment in energy supply. Fossil fuel and power sector investments are those that raise or replace energy supply, while energy efficiency investments are counted as those that reduce energy demand.
Investment estimates are derived from International Energy Agency (IEA) data for energy demand, supply and trade, and estimates of unit capacity costs, analysis of which benefits from extensive interaction with industry. By default, investment data are given in year 2018
IEA
. All
right
s re
serv
ed.
World Energy Investment 2019: Methodology Annex 3
US dollars, adjusted using country-level gross domestic product (GDP) deflators and 2018 exchange rates. Unless otherwise stated in WEI 2019, all time series and historical comparisons are presented in real dollar terms, adjusted for inflation.
Overall, this approach to investment represents an approximation of real-world practice and is aligned with the concept of capital expenditure in finance and accounting. In reality, varying time lags and spending patterns characterise the period between the final investment decision and the operation of an energy project. As such, where available, estimates of and financing activity are also provided to give a more complete picture of the turnover of the energy asset base as well as decisions to commit new capital. While other areas of spending – including operating and maintenance expenditures, research and development, financing costs, mergers and acquisitions or public markets transactions – remain important for energy sector development, and are analysed on a standalone basis, they are not included in the investment calculations of World Energy Investment 2019.
Measuring investment in energy efficiency
Defining and measuring investment in energy efficiency is far less straightforward than for investment in energy supply. The IEA defines an energy efficiency investment as the incremental spending to acquire equipment that consumes less energy than would otherwise have been used to provide the service, such as lighting, heating or mobility, had the consumer not bought a more efficient option (i.e. the baseline). The additional cost of a more efficient alternative can represent but a small share of the total spending on a particular energy-related good or service. Furthermore, investment and spending is carried out by many millions of households and firms, often without external financing. As much as possible, a bottom-up analysis using sales and investment data on sales of efficient goods is used.
In the buildings sector, the incremental investment for new or renovated buildings is the change in cost for services (design, delivery, installation) and products (lighting, appliances, equipment and materials) that achieve increased energy efficiency performance beyond the investment required for the minimum performance legally allowed. Thus, in principle, the full cost of a renovation that is associated with energy efficiency improvements is included. For building types and products that have legal requirements on the performance of buildings, buildings services or building products, this cost is the incremental spending beyond that needed to achieve the minimum energy performance standards, energy efficiency regulations or building energy codes. For building types and products that do not have energy requirements, this cost is the incremental spending on energy-efficient services and products beyond what would have otherwise been spent, which in some cases is no spending. For the incremental investment in buildings achieved due to the improvement in energy efficiency policies, this cost is the incremental spending required to achieve the new energy performance requirements beyond the previous level to which the market had already adapted. Building sector spending for residential and commercial
IEA
. All
right
s re
serv
ed.
World Energy Investment 2019: Methodology Annex 4
buildings is compiled from published national reports, for example spending reports of various public institutions. If not counted elsewhere in the buildings sector estimate, energy efficiency obligations, loans and funds established by policy are considered to be incremental spending. It also draws upon industry sources, in particular Navigant Research Energy Efficient Buildings and construction-sector indices.
For the industry sector and freight transport sectors, the incremental investment is calculated based on the average technology efficiency in a recent base year. The result is modelled on a regional basis and based on the realised level of energy savings in a sector and energy saving cost curves in the World Energy Model (IEA, 2018a). Added to this is published data on investment in industrial energy management systems that improve system-wide efficiencies in manufacturing and heavy industry.
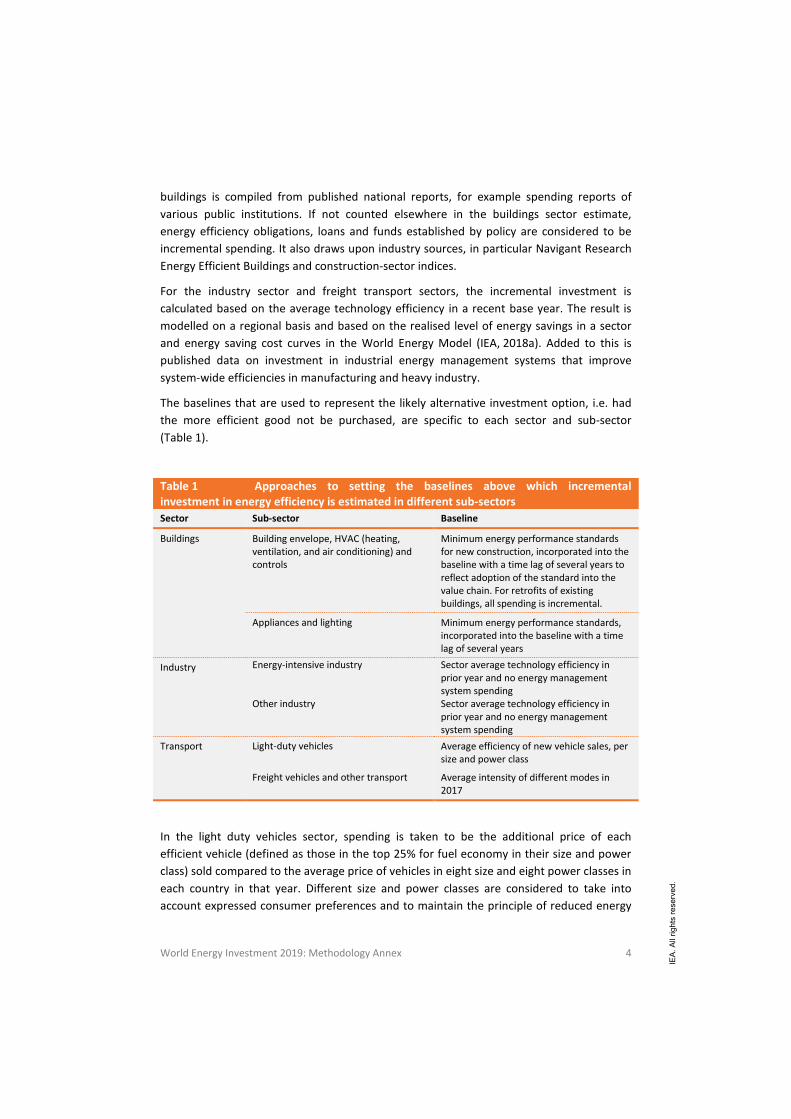
The baselines that are used to represent the likely alternative investment option, i.e. had the more efficient good not be purchased, are specific to each sector and sub-sector (Table 1).
Table 1 Approaches to setting the baselines above which incremental investment in energy efficiency is estimated in different sub-sectors Sector Sub-sector Baseline
Buildings Building envelope, HVAC (heating, ventilation, and air conditioning) and controls
Minimum energy performance standards for new construction, incorporated into the baseline with a time lag of several years to reflect adoption of the standard into the value chain. For retrofits of existing buildings, all spending is incremental.
Appliances and lighting Minimum energy performance standards, incorporated into the baseline with a time lag of several years
Industry Energy-intensive industry Sector average technology efficiency in prior year and no energy management system spending
Other industry Sector average technology efficiency in prior year and no energy management system spending
Transport Light-duty vehicles Average efficiency of new vehicle sales, per size and power class
Freight vehicles and other transport Average intensity of different modes in 2017
In the light duty vehicles sector, spending is taken to be the additional price of each efficient vehicle (defined as those in the top 25% for fuel economy in their size and power class) sold compared to the average price of vehicles in eight size and eight power classes in each country in that year. Different size and power classes are considered to take into account expressed consumer preferences and to maintain the principle of reduced energy
IEA
. All
right
s re
serv
ed.
World Energy Investment 2019: Methodology Annex 5
demand for the same level of energy service provided. Underlying data is derived from IHS Markit (2018) and supplemented with public data sources, according to the general methodology of the Global Fuel Economy Initiative (GFEI, 2019) as well as Marklines (2019). Improved data quality for the analysis for WEI 2019 led to a downward revision of the historical data series for light duty vehicle energy efficiency spending without a change to the methodology employed. This price-based approach differs from cost-based approaches that estimate the total cost of the improving efficiency of the car fleet rather than the incremental consumer spending only. Cost-based approaches are commonly used in modelling exercises and aim to quantify the additional costs associated with improved fuel economy in future years, such as those incurred by manufacturers.
Measuring investment in oil, gas, and coal
In line with capital spending in the other energy sectors, the investment estimates for oil, gas and coal represent spending, i.e. the total amount of investment costs incurred in any given year. They are derived from IEA data for demand, supply and trade, plus industry data on investment costs, where available. In the case of upstream oil and gas investment, global spending estimates are based on the announced spending of over 70 leading oil and gas companies representing 75% of global oil and gas production has been surveyed and adjusted to represent the global spending. For the oil refining sector, spending estimates are calculated based on project-level information on new refineries, and upgrading projects. The investment estimates for the downstream sectors such as oil and gas pipelines and shipping transport were made to correspond to the IEA data for demand, supply and trade for oil and gas products. This follows the new methodology of the World Energy Model, used to produce the projections in the IEA’s annual World Energy Outlook.
The investment in LNG liquefaction terminals is based on reported or estimated annual spending for over 50 projects that reached final investment decision between 2000 and 2018. Analyses rely on a wide range of publicly available sources. IEA estimates have been made where detailed information is not available, such as disaggregated spending by type of activity and capital spending plans by unlisted companies.
IEA Upstream Investment Cost Index (UICI)
The IEA Upstream Investment Cost Index or UICI is an indicator that the IEA developed to monitor cost trends in the upstream sector. The index measures the annual change of capital costs for exploration and development experienced by operating companies for the entire upstream sector, averaged across all regions and assets. The index is a composite indicator that reflects prices for cement, steel and other construction materials and equipment, as well as the cost of sector specific labour, drilling rigs and oilfield services. The UICI is calculated by weighting the average capital spending of two separate exploration and production indices on the basis of disaggregated historical data for the different key components within these two activities. The index captures the yearly
IEA
. All
right
s re
serv
ed.

World Energy Investment 2019: Methodology Annex 6
evolution of costs related to the acquisition of seismic data, project management, drilling services and the construction of production facilities, as well as the costs of labour, materials and equipment that are incorporated into charges for drilling, related services and facilities.
IEA Upstream Shale Investment Cost Index (USICI)
The IEA Upstream Shale Investment Cost Index or USICI aims to assess trends in underlying costs incurred directly by operating companies. This index tracks the inflation rate of capital costs associated with the drilling and completion of wells, as well as the construction of required facilities for production across the US shale industry. USICI is built as the weighted average of representative components for each of these key activities, including drilling, completion and field facilities. IEA USICI is therefore a blended indicator that takes into account time evolution of rig rates, cost of fuel, steel and other raw materials, fracking equipment rates, chemicals as well as changes to costs related to a specialised workforce required for the different services.
Measuring investment in power
The estimates of electricity investment presented in WEI 2019 correspond to annual capital spending on new power plants and network assets, or the replacement of old assets; i.e., investment outlays are spread evenly from the year that an asset begins its construction until the year it becomes operational. Thus, the investment for 2018 actually reflects spending carried out in assets that will become operational in the future, too. The historical construction period is estimated from reported primary financing data, sanctioning dates, and operational dates at project-level by technology and by region in a given year.
Investment estimates reflect IEA analysis on annual capacity additions and unit investment costs, derived in part from surveys with industry, IEA (2018a), Platts (2019), BNEF (2019a), IEA Technology Collaboration Programmes,1 IRENA (2019) and other organisations; and a new investment modelling tool that allocates evenly the annual capital spending that correspond to each asset during its construction phase. The estimates are shown in 2018 US dollar prices, adjusted using GDP deflators and 2018 exchange rates. Investment does not include operating and maintenance expenditures, financing costs, research and development spending, mergers and acquisitions or debt and equity market transactions.
1 See https://www.iea.org/tcp/ for further details.
IEA
. All
right
s re
serv
ed.
World Energy Investment 2019: Methodology Annex 7
The new methodology is the same as the one that will be employed in forward-looking IEA analysis. It represents an approximation of real-world practice. In reality, capital outlays on new plants will be also spread over the years preceding installation.
Nuclear power presents particular challenges given the long lead times and spending patterns associated with plant development. For new nuclear power plants, spending also corresponds to the evenly allocation from the year in which the unit takes final investment decision, to the year in which the unit is connected to the grid. WEI 2019 includes estimates for upgrades to existing nuclear plants to extend lifetime operation. Investment in existing plants is estimated by reviewing plants reaching a 40-year lifetime in a given year and assessing their reported operational plans going forward. In the absence of specific information about the timing of upgrades, investments are also calculated on a capital spending basis at the 40-year mark with cost assumptions from OECD/NEA (2012) and assume a construction time of approximately two years.
Investment in electricity networks includes transmission, distribution and EV charging stations. The data corresponds to the capital spending methodology and reflects three key drivers: investment in new infrastructure to accommodate new demand, investment to replace ageing infrastructure and the investment required to integrate renewables in the power system. Networks investment to accommodate new demand is calculated based on the commissioning of new transmission and distribution lines and on the analysis of data provided by the NRG Expert Transmission and Distribution Database (NRG, 2018). The applied unit investment costs are based on past capital expenditures and data from industry surveys. Investment in asset replacement assumes an average lifetime of 40 years for assets already in operation. Unit replacement costs are derived from costs of new infrastructure. Investment costs of transmission and distribution networks required for renewables integration are derived from renewable integration costs based on literature reviews. The analysis of investments in the digitalisation of the electricity grid is based on analysis of NRG (2018), BNEF (2019b). EV charging stations investment is based on combining estimates of public and private charger installations with prevailing cost information, based on IEA (2019a).
Additionally, investment in grid-scale battery storage and behind-the-meter storage is based on the capacity deployment reflected in the US Department of Energy Global Energy Storage Database (US DOE, 2019), the Clean Horizon Project Database (Clean Horizon, 2019), the analysis of data from the China Energy Storage Alliance Global Energy Storage Market Analysis (CNESA, 2019), and data provided by governments. Investment in pumped-hydro storage, the largest component of global storage investment, is included in the hydropower data of WEI 2019. Behind-the-meter storage is derived from BNEF (2019c) and data provided by governments.
Finally, data on financing flows and information about investment decisions, where available, are also shown to give a more complete picture of the turnover of the capital stock. WEI 2019 has undertaken an analysis of final investment decisions for power generation, based on awarded equipment contracts from data provided by McCoy Power
IEA
. All
right
s re
serv
ed.
World Energy Investment 2019: Methodology Annex 8
Reports (2019) (including coal power, gas power and hydropower) and reported construction starts (nuclear) based on data from the International Atomic Energy Agency, Power Reactor Information Systems (PRIS) (2019). These data may not capture smaller projects below 5 MW (below 10 MW for hydropower). However, WEI 2019 has made estimates for investments and final investment decisions (treated as the same) in small-scale generator sets, based on Global Data (2018a, 2018b).
Financing and funding trends
WEI 2019 features analysis on trends in the sources of finance – the structure of financing arrangements used to directly finance assets and their geographic location – for the power sector investments presented in the report.
By financing mechanism
WEI 2019 broadly categorises the sources of finance for new energy assets into balance-sheet financing and project financing. To estimate project-financed investment on a spending basis, reported primary financing data, financial close date as proxy of the sanctioned date as well as actual or estimated operational date at project-level are combined in a given year. Only new financing is included, i.e. project finance for refinancing and merger and acquisition are excluded from our analysis. In some but not many cases where a project is confirmed ongoing but a reported operational date is unavailable, assumptions about construction times are used by technology and by region. For example, an onshore wind-power project in North Africa, for which a primary financing transaction occurred in 2015 but the commissioning date is unknown, is counted as investment spreading from 2015 for two years based on the assumption. The main data sources are IJGlobal (2019), WindEurope (2019), and US DOE (2018). Balance sheet financing is estimated as the residual of the total investment less the contribution from project finance. Given the difficulties in synthesising complex data, which are not always complete or transparent, the results should be seen as providing a broad indication of trends.
Green bonds
In WEI 2019, as in WEI2018, green bonds cover corporate bonds; ABS; supranational, sub-sovereign and agency bonds; municipal bonds; project bonds; sovereign bonds; and financial sector bonds. In this report, only green bonds labelled to provide transparency to investors are discussed and unlabelled climate-aligned bonds are excluded. Additionally, some regions have or are developing their own standards. For example, China has a separate standard that does not always align with international green bond standards.
While it can be difficult to assess the percentage of a green bond’s proceeds that will be dedicated to energy efficiency, our analysis follows the Climate Bonds Initiative conventions for allocation by energy end use. Green bonds for which the use of proceeds is allocated to energy
IEA
. All
right
s re
serv
ed.
World Energy Investment 2019: Methodology Annex 9
efficiency include those that specifically target energy efficiency applications in accordance with the Climate Bonds Standard, as well as green bonds for all Property Assessed Clean Energy (PACE) ABS, rooftop solar PV ABS (which reduce energy imports to a building), and issuances from corporate and public entities in the utilities, property and transport infrastructure sectors.
Research and Development
The approach taken is a bottom-up tracking exercise based on publicly reported data. While it is acknowledged that definitions can vary, especially between the public and private sectors in terms of how capitalised assets are included, the numbers are generally taken at face value. No attempts have been made to extrapolate from this dataset to fill known gaps in particular sectors or countries.
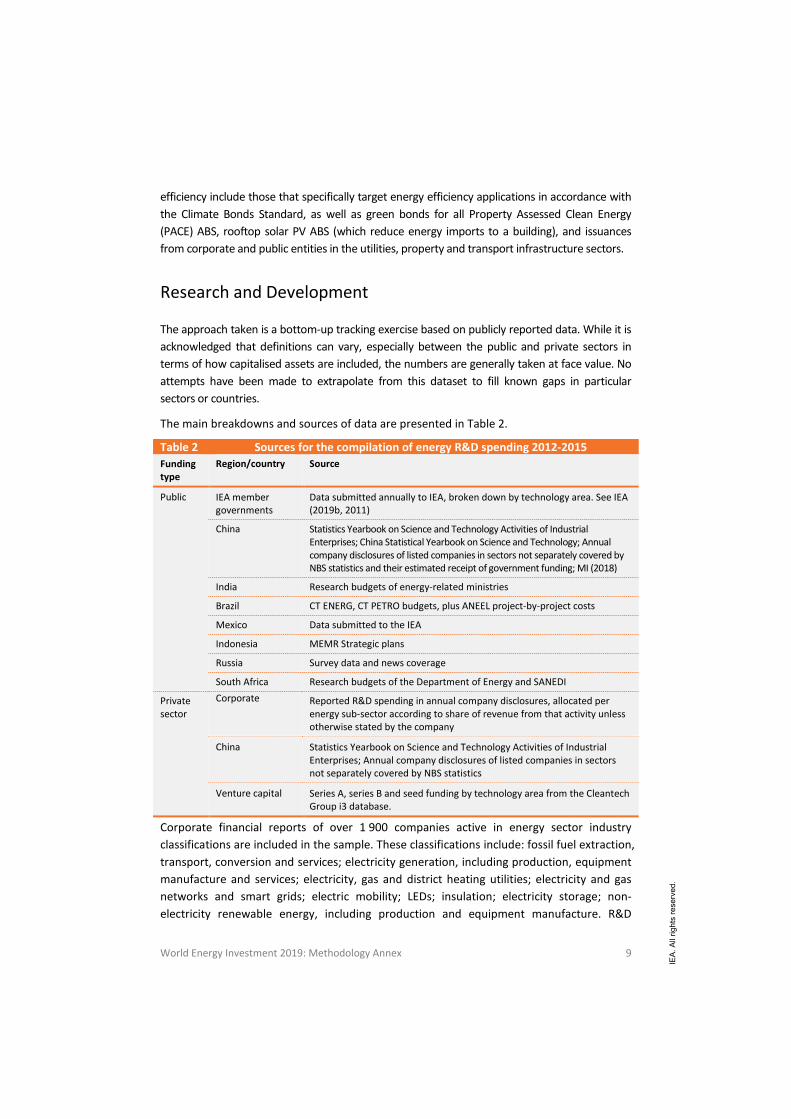
The main breakdowns and sources of data are presented in Table 2.
Table 2 Sources for the compilation of energy R&D spending 2012-2015 Funding type
Region/country Source
Public IEA member governments
Data submitted annually to IEA, broken down by technology area. See IEA (2019b, 2011)
China Statistics Yearbook on Science and Technology Activities of Industrial Enterprises; China Statistical Yearbook on Science and Technology; Annual company disclosures of listed companies in sectors not separately covered by NBS statistics and their estimated receipt of government funding; MI (2018)
India Research budgets of energy-related ministries
Brazil CT ENERG, CT PETRO budgets, plus ANEEL project-by-project costs
Mexico Data submitted to the IEA
Indonesia MEMR Strategic plans
Russia Survey data and news coverage
South Africa Research budgets of the Department of Energy and SANEDI
Private sector
Corporate Reported R&D spending in annual company disclosures, allocated per energy sub-sector according to share of revenue from that activity unless otherwise stated by the company
China Statistics Yearbook on Science and Technology Activities of Industrial Enterprises; Annual company disclosures of listed companies in sectors not separately covered by NBS statistics
Venture capital Series A, series B and seed funding by technology area from the Cleantech Group i3 database.
Corporate financial reports of over 1 900 companies active in energy sector industry classifications are included in the sample. These classifications include: fossil fuel extraction, transport, conversion and services; electricity generation, including production, equipment manufacture and services; electricity, gas and district heating utilities; electricity and gas networks and smart grids; electric mobility; LEDs; insulation; electricity storage; non-electricity renewable energy, including production and equipment manufacture. R&D
IEA
. All
right
s re
serv
ed.
World Energy Investment 2019: Methodology Annex 10
budgets of companies that are active in multiple sub-sectors are allocated on the basis of interviews with major companies or split in line with the share of revenue in these sectors (including non-energy sectors). For automotive companies, a share of R&D that is relevant to improving fuel efficiency, alternative fuels and alternative drivetrains is allocated based on interviews. These attempts to capture only energy-relevant R&D budgets are particularly important in the case of companies whose primary sectoral classification is not well-aligned with the full extent of their market and innovation activities.
One notable caveat is that this methodology makes it challenging to capture corporate research into efficient buildings, appliances and industry. Such R&D is undertaken within the R&D activities of these other sectors for which energy efficiency cannot be separated from their other research activities. We know that energy research in other sectors is substantial (IEA, 2018b). Furthermore, non-listed companies comprise a non-trivial component of total energy R&D spending and these are not captured by our methodology.
Low-carbon energy technology spending is separated wherever possible to include all technologies (for the public sector and venture capital) and all industry sub-sectors (for the corporate sector) related to: renewables; nuclear; CCUS; smart grids; electric mobility; LEDs; electricity storage, insulation.
IEA
. All
right
s re
serv
ed.
World Energy Investment 2019: Methodology Annex 11
References
BNEF (Bloomberg New Energy Finance) (2018a), Renewable Energy Projects, www.bnef.com/. (Accessed April 2019)
BNEF (2019b), Smart Meter Market Size database, www.bnef.com/. (Accessed April 2019)
BNEF (2019c), Behind-the-meter Energy Storage, www.bnef.com/. (Accessed April 2019)
Clean Horizon (2019), Clean Horizon Project Database, www.cleanhorizon.com/projects/
GFEI (Global Fuel Economy Initiative) (2019), Fuel Economy in Major Car Markets: Technology and Policy Drivers 2005-2017, OECD/IEA, Paris.
CNESA (China Energy Storage Alliance) (2019), Global Energy Storage Market Analysis, CNESA, Beijing, China, http://en.cnesa.org/
Global Data (2018a), Diesel Generators, Update 2018 - Global Market Size, Competitive Landscape, Key Country Analysis, and Forecast to 2022, Global Data, London.
Global Data (2018b), Gas Generators, Update 2018 - Global Market Size, Competitive Landscape, Key Country Analysis, and Forecast to 2022, Global Data, London.
IAEA (International Atomic Energy Agency) (2019), Power Reactor Information System (PRIS), IAEA, Vienna, Austria, https://www.iaea.org/pris/.
IEA (2019a, forthcoming), Global EV Outlook 2019, OECD/IEA, Paris.
IEA (2019b), Energy Technology RD&D Budget Database, OECD/IEA, Paris, www.iea.org/statistics/rdd/ (Accessed 3 May 2019).
IEA (2018a), World Energy Model documentation, www.iea.org/weo/weomodel/
IEA (2018b), Tracking Clean Energy Progress, OECD/IEA, Paris.www.iea.org/tcep/
IEA (2011), IEA Guide to Reporting Energy RD&D Budget/Expenditure Statistics, OECD/IEA, Paris.
IJGlobal (2019), IJ Global Transaction Database, www.ijglobal.com/
IHS Markit (2018), Vehicle Registrations and Other Characteristics at Model Level (database), IHS Markit, London
IRENA (International Renewable Energy Agency) (2019), IRENA Renewable Costing Alliance, dataset, http://costing.irena.org/irena-renewable-costing-alliance.aspx.
MarkLines (2019), Automotive Industry Platform Vehicle Sales Data, MarkLines Co., Ltd., Tokyo.
McCoy Power Reports (2019), dataset, McCoy Power Reports, Richmond.
MI (Mission Innovation) (2018), “Mission Innovation country highlights”, 3rd MI Ministerial 2018, http://mission-innovation.net/wp-content/uploads/2018/03/MI-Country-Highlights-2018-FINAL-Update- 050618.pdf (Accessed 18 June 2018).
NRG (NRG Expert Energy Intelligence) (2018), Electricity Transmission and Distribution Report and Database, www.nrgexpert.com/energy-market-research/electricity-transmission-and-distribution-report-and-database/.
OECD/NEA (2012), The Economics of Long-term Operation of Nuclear Power Plants, Nuclear Development, OECD Publishing, Paris, https://doi.org/10.1787/9789264992054-en.
IEA
. All
right
s re
serv
ed.

World Energy Investment 2019: Methodology Annex 12
Platts (2019), World Electric Power Plants Database, Platts, Washington D.C.
US DOE (US Department of Energy) (2019), Global Energy Storage Database, www.energystorageexchange.org/.
US DOE (2018), 2017 Wind Technologies Market Report, US Department of Energy, Washington D.C
WindEurope (2019), Financing and investment trends: The European wind industry in 2018, WIndEurope, windeurope.org/wp-content/uploads/files/about-wind/reports/Financing-and-Investment-Trends-2018.pdf.
IEA
. All
right
s re
serv
ed.
World Energy Investment 2019: Methodology Annex 13
Abbreviations and acronyms
ABS asset-backed security
AT&C aggregate technical and commercial losses
BEV battery-electric vehicle
Capex capital expenditure
CCGT combined-cycle gas turbine
CCUS carbon capture, utilisation and storage
CfD contract-for-difference
CO2 carbon dioxide
CO2-EOR enhanced oil recovery
CSP concentrating solar power
CVC corporate venture capital
DER distributed energy resource
DUC drilled but uncompleted well
EBITDA earnings before interest, taxes, depreciation and amortisation
ECA export credit agency
EPC energy performance contract
ESCO energy service company
ESI energy savings insurance
EV electric vehicle
FCEV fuel-cell electric vehicle
FID final investment decision
FiT feed-in tariff
FLNG floating liquefied natural gas
FSRU floating storage regasification unit
GDP gross domestic product
GHG greenhouse gas
HVAC heating, ventilation and cooling, or
HVAC high-voltage alternating current
HVDC high-voltage direct current
ICT information and communication technology
IMO International Maritime
Organization
IOU investor-owned utility
IPO initial public offering
IPP independent power producer
IRR internal rate of return
LCOE levelised cost of energy
LDV light-duty vehicle
LED light-emitting diode
LFP lithium iron phosphate
Li-ion lithium-ion
LMO lithium manganese oxide
LNG liquefied natural gas
LPG liquefied petroleum gas
M&A mergers and acquisitions
MDB multilateral development bank
NCA nickel cobalt aluminium
NGL natural gas liquids
NMC nickel manganese cobalt
NOC national oil company
NPA non-performing asset
NPS New Policies Scenario
NPV net present value
OCGT open-cycle gas turbine
OCTG oil country tubular goods
PACE property-assessed clean energy
PCI project of common interest
PEM proton-exchange membrane (also called polymer electrolyte membrane)
PFI public financial institution
PHEV plug-in hybrid
PPA power purchase agreement
IEA
. All
right
s re
serv
ed.
World Energy Investment 2019: Methodology Annnex 14
PSM payment security mechanism
PSP pump-hydro storage power
PV photovoltaic
R&D research and development
RD&D research, development and demonstration
ROE return on equity
RoI return on investment
ROIC return on invested capital
RT&H renewable transport and heat
SDS Sustainable Development
Scenario
SOE state-owned enterprise
SOEC solid oxide electrolyser cell
T&D transmission and distribution
TSOs transmission system operators
UHVDC ultra-high-voltage direct current
UICI Upstream Investment Cost Index
USICI Upstream Shale Investment Cost Index
VC venture capital
VIU vertically integrated utility
VRE variable renewable energy
WACC weighted average cost of capital
WLTP Worldwide Harmonised Light Vehicles Test Procedure
WTI West Texas Intermediate
YTD year to date
YoY year-on-year
Units of measurement Energy
boe barrels of oil equivalent
kboe/d thousand barrels of oil equivalent per day
MBtu million British thermal units
GJ gigajoules
toe tonne of oil equivalent
ktoe thousand tonnes of oil equivalent
Mtoe million tonnes of oil equivalent
kWh kilowatt hours
MWh megawatt hour
GWh gigawatt hour
TWh terawatt hour
Power
MW megawatt
GW gigawatt
Electricity
kV kilovolt
Energy density
kWh/kg kilowatt hours per kilogramme
Gas
bcm billion cubic metres
Oil
kb/d thousand barrels per day
mb/d million barrels per day
Mass
kg kilogramme
Mt million tonnes
Bt billion tonnes
Distance
km kilometre
IEA
. All
right
s re
serv
ed.
World Energy Investment 2019: Methodology Annex 15
Glossary
Advanced biofuels: Sustainable fuels produced from non-food crop feedstocks that are capable of significantly reducing lifecycle greenhouse gas emissions compared with fossil fuel alternatives, and that do not directly compete with food and feed crops for agricultural land or cause adverse sustainability impacts.
Balance sheet finance: Involves the explicit financing of assets on a company’s balance sheet using retained earnings from business activities, including those with regulated revenues, as well as corporate debt and equity issuance in capital markets. To some extent, it measures the degree to which a company self-finances its assets, though balance sheets also serve as intermediaries for raising capital from external sources.
Capital costs: Costs to develop and construct a fixed asset such as a power plant and grid infrastructure or execute a project, excluding financing costs. For power generation assets, capital costs include refurbishment and decommissioning costs.
Dispatchable power generation: Refers to technologies whose power output can be readily controlled – increased to maximum rated capacity or decreased to zero – in order to match supply with demand.
Energy Research and development (R&D): Covers research and development related to the production, storage, transportation, distribution and rational use of all forms of energy. WEI 2019 estimates corporate R&D spending in energy-related sectors based on publicly reported information R&D expenses.
Energy Research, development and demonstration (RD&D): Covers research, development and demonstration related to the production, storage, transportation, distribution and rational use of all forms of energy. WEI 2019 assesses energy RD&D spending by governments that includes basic research clearly oriented towards the development of energy-related technologies, applied research, experimental development and demonstration.
Free cash flow: The cash flow available to the company’s investors (e.g. shareholders and bondholders) after all operation expenses are paid and investments are made. It is calculated by subtracting capital expenditure from operating cash flow.
Internal rate of return (IRR): The discount rate that makes the present value of investment cost (cash outflow) equal to that of benefits (cash inflow), whereby making the net present value of the project equal to 0.
Investment: In WEI 2019, all investment data and projections reflect actual spending across the life cycle of a project, i.e. the capital spent is assigned to the year when it is incurred. Investments for oil, gas and coal include production, transformation and transportation; those for the power sector include refurbishments, uprates, new builds and replacements for all fuels and technologies for on-grid, mini-grid and off-grid generation, as well as investment in transmission and distribution, and battery storage. Investment data are presented in real terms in year 2018 US dollars unless otherwise stated.
Note that the definition is new and our methodology to assess investment changed from the previous versions of WEI. Previously, the investment data reflected “overnight investment”, i.e. the capital spent is generally assigned to the year production (or trade) is started, rather than the year when it is incurred.
Lead times: The amount of time from the start of a project to its commissioning. In WEI 2019, lead times refer to the time between the final investment decision and the start-up for oil and gas projects and construction time for power generation assets.
Mission Innovation (MI): A global initiative of over 20 countries to accelerate clean energy innovation. Initiative members aim to double their government and/or state-directed clean energy RD&D investment over five years from 2015 to 2020, among other goals. See the MI website for details.
New Policy Scenario: An IEA scenario that provides a measured assessment of where today’s policy frameworks and ambitions, together with the continued evolution of known technologies, might take the energy sector in the coming decades. The policy ambitions include those that have been announced and incorporate the commitments made in
IEA
. All
right
s re
serv
ed.
World Energy Investment 2019: Methodology Annex 16
the Nationally Determined Contributions under the Paris Agreement, but do not speculate as to further evolution of these positons.
Paris Agreement: An agreement with the United Nations Framework Convention on Climate Change ratified by almost 190 countries to tackle climate change. It aims to strengthen the global response to keep a global temperature rise this century well below 2 °C above pre-industrial levels. All Parties to the Agreement are required to put forward their best efforts through Nationally Determined Contributions and to strengthen the efforts in the years ahead.
Payback period: Refers to the period of time required to recover the amount invested in a project from its benefits (cash inflows).
Project finance: Involves external lenders – including commercial banks, development banks and infrastructure funds – sharing risks with the sponsor of the project. It can also involve fundraising from the debt capital markets with asset-backed project bonds. They often involve non-recourse or limited-recourse loans where lenders provide funding on a project’s future cash flow and have no or limited recourse to liability of the project parent companies.
Return on Invested Capital (ROIC): A profitability ratio expressed as operating income adjusted for taxes divided by invested capital. The ratio measures the ability of a company’s core business investments to generate profits. For the ROIC/WACC analysis in WEI 2019, invested capital is calculated by subtracting cash and cash equivalent, other long-term assets than property/plant/equipment, good will and intangibles, and current liabilities from total assets.
Seed, series A and series B: generally the first three venture capital fundraising rounds involving external investors in a start-up. The values generally increase from up to USD 2 million for a seed round, to USD 10 million or more for a series B round, but can be smaller or much larger.
Sustainable Development Scenario: An IEA scenario that shows how the energy sector can achieve the objectives of the UN Sustainable Development Goals (SDGs) most closely related to energy, namely, those goals related to energy access, air pollution emissions and climate change (SDGs 3, 6, 7, and 13). It is aligned with the Paris Agreement’s goal holding the increase in the global average temperature to well below 2 °C.
Weighted-average cost of capital (WACC): The weighted average cost of capital is expressed in nominal terms and measures the company’s required return on equity and the after-tax cost of debt issuance, weighted according to its capital structure.
White certificate: A tradable asset which proves that a certain percentage of energy savings has been achieved relative to an established baseline. In most applications, white certificates are combined with energy company obligation schemes that are designed to achieve a certain target of energy savings, thereby creating a market for energy efficiency.
IEA
. All
right
s re
serv
ed.