world economic situation and prospects 2018: annex · country classifications data sources, country...
TRANSCRIPT

Statistical annex

Country classifications
Data sources, country classifications and aggregation methodology
Data sourcesThe annex was prepared by the Development Policy and Analysis Division (DPAD) of the Department of Economic and Social Affairs of the United Nations Secretariat (UN/DESA). It is based on information obtained from the Statistics Division and the Population Division of UN/DESA, as well as from the five United Nations regional commissions, the United Nations Conference on Trade and Development (UNCTAD), the United Nations World Tourism Organisation (UNWTO), the International Monetary Fund (IMF), the World Bank, the Organisation for Economic Co-operation and Development (OECD), and national and private sources. Estimates for the most recent years were made by DPAD in consultation with the regional commissions, UNCTAD, UNWTO and participants in Project LINK, an international collaborative research group for econometric modelling coordinated jointly by DPAD and the University of Toronto. Forecasts for 2018 and 2019 are primarily based on the World Economic Forecasting Model of DPAD, with support from Project LINK.
Data presented in WESP may differ from those published by other organizations for a series of reasons, including differences in timing, sample composition and aggregation methods. Historical data may differ from those in previous editions of WESP because of updating and changes in the availability of data for individual countries.
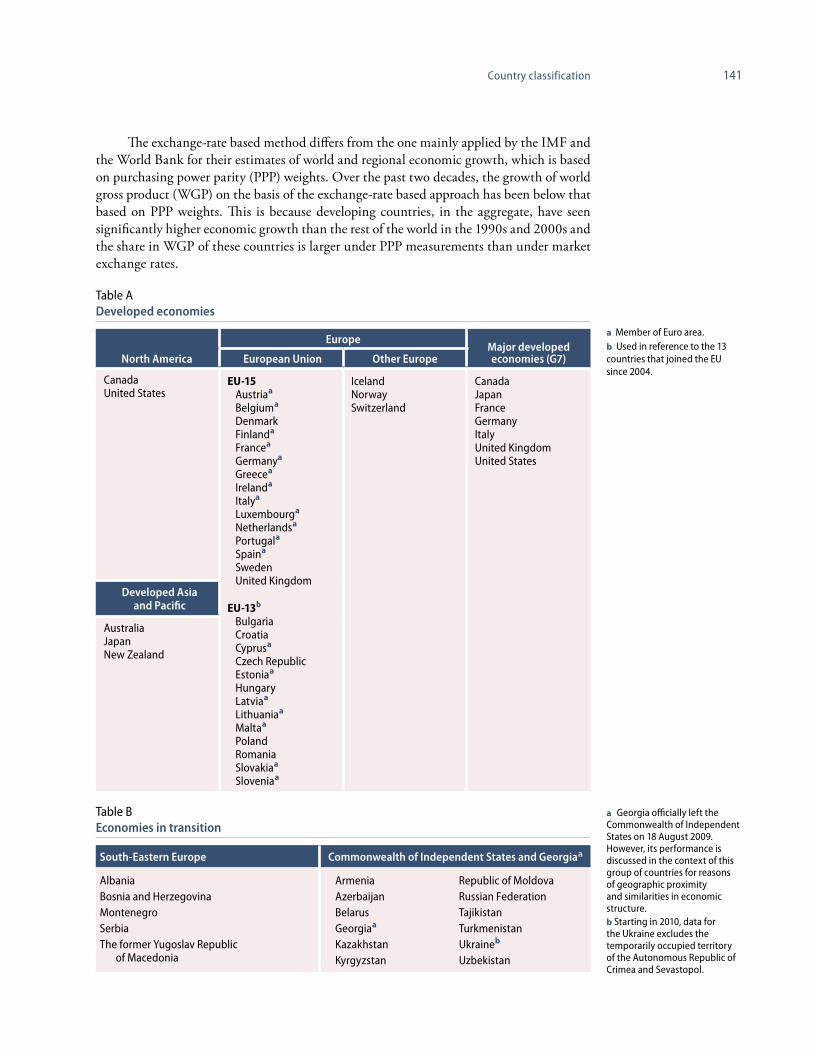
Country classificationsFor analytical purposes, WESP classifies all countries of the world into one of three broad categories: developed economies, economies in transition and developing economies. The composition of these groupings, specified in tables A, B and C, is intended to reflect basic economic country conditions. Several countries (in particular the economies in transition) have characteristics that could place them in more than one category; however, for purposes of analysis, the groupings have been made mutually exclusive. Within each broad category, some subgroups are defined based either on geographical location or on ad hoc criteria, such as the subgroup of “major developed economies”, which is based on the membership of the Group of Seven. Geographical regions for developing economies are as follows: Africa, East Asia, South Asia, Western Asia, and Latin America and the Caribbean.1
The term ‘emerging economies’ used throughout the Report is not a formal defi-nition, but refers to mainly middle-income developing and transition countries that are integrated into the global financial system.
1 Names and composition of geographical areas follow those specified in the statistical paper entitled “Standard country or area codes for statistical use” (ST/ESA/STAT/SER.M/49/Rev), available from https://unstats.un.org/unsd/publication/SeriesM/Series_M49_Rev4(1999)_en.pdf.

140 World Economic Situation and Prospects 2018
In parts of the analysis, a distinction is made between fuel exporters and fuel import-ers from among the economies in transition and the developing countries. An economy is classified as a fuel exporter if the share of fuel exports in its total merchandise exports is greater than 20 per cent and the level of fuel exports is at least 20 per cent higher than that of the country’s fuel imports. This criterion is drawn from the share of fuel exports in the total value of world merchandise trade. Fuels include coal, oil and natural gas (table D).
For other parts of the analysis, countries have been classified by their level of develop-ment as measured by per capita gross national income (GNI). Accordingly, countries have been grouped as high-income, upper middle income, lower middle income and low-income (table E). To maintain compatibility with similar classifications used elsewhere, the thresh-old levels of GNI per capita are those established by the World Bank. Countries with less than $1,005 GNI per capita are classified as middle-income countries, those with between $1,006 and $3,955 as lower middle-income countries, those with between $3,956 and $12,235 as upper middle-income countries, and those with incomes of more than $12,235 as high-income countries. GNI per capita in dollar terms is estimated using the World Bank Atlas method,2 and the classification in table E is based on data for 2016.
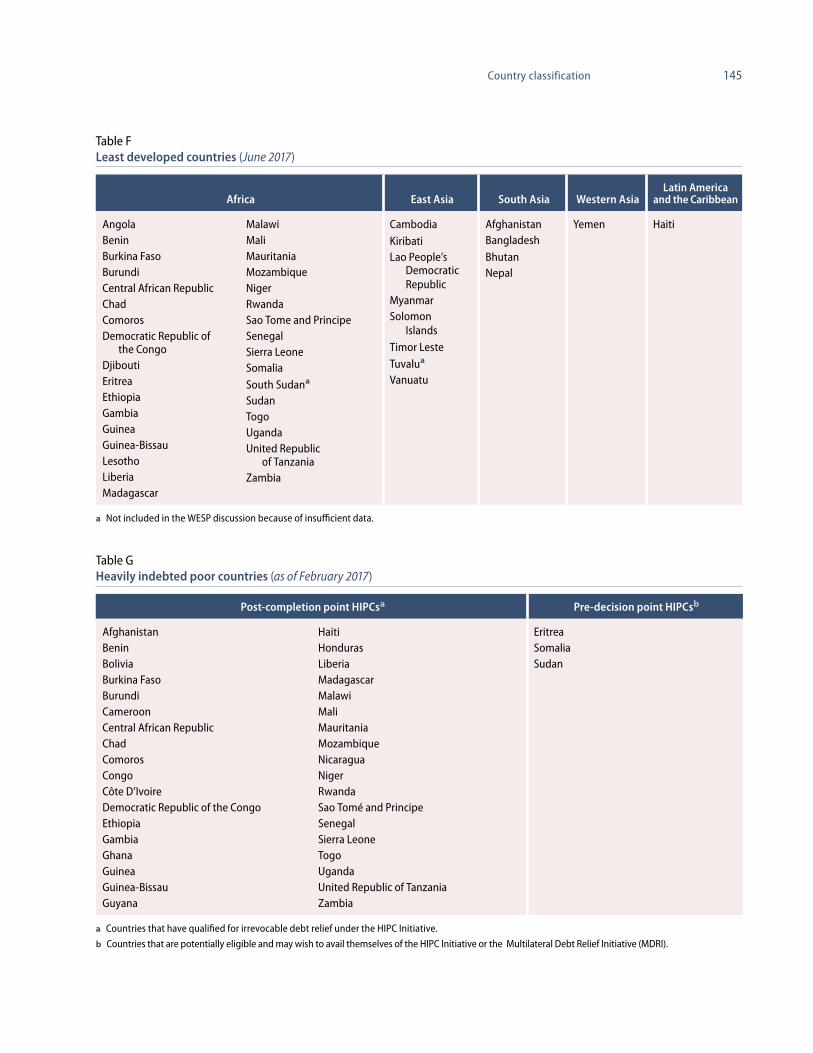
The list of the least developed countries (LDCs) is decided upon by the United Nations Economic and Social Council and, ultimately, by the General Assembly, on the basis of recommendations made by the Committee for Development Policy. The basic cri-teria for inclusion require that certain thresholds be met with regard to per capita GNI, a human assets index and an economic vulnerability index.3 As of June 2017, there were 47 LDCs (table F).
WESP also makes reference to the group of heavily indebted poor countries (HIPCs), which are considered by the World Bank and IMF as part of their debt-relief initiative (the Enhanced HIPC Initiative).4 In February 2017, there were 39 HIPCs (see table G).
Aggregation methodologyAggregate data are either sums or weighted averages of individual country data. Unless otherwise indicated, multi-year averages of growth rates are expressed as compound annual percentage rates of change. The convention followed is to omit the base year in a multi-year growth rate. For example, the 10-year average growth rate for the decade of the 2000s would be identified as the average annual growth rate for the period from 2001 to 2010.
WESP utilizes exchange-rate conversions of national data in order to aggregate out-put of individual countries into regional and global totals. The growth of output in each group of countries is calculated from the sum of gross domestic product (GDP) of individu-al countries measured at 2010 prices and exchange rates. Data for GDP in 2010 in national currencies were converted into dollars (with selected adjustments) and extended forwards and backwards in time using changes in real GDP for each country. This method supplies a reasonable set of aggregate growth rates for a period of about 15 years, centred on 2010.
2 See http://data.worldbank.org/about/country-classifications.3 Handbook on the Least Developed Country Category: Inclusion, Graduation and Special Support Measures
(United Nations publication, Sales No. E.07.II.A.9), available from http://www.un.org/en/develop-ment/desa/policy/cdp/cdp_publications/2008cdphandbook.pdf.
4 IMF, Debt relief under the Heavily Indebted Poor Countries (HIPC) Initiative, available from http://www.imf.org/About/Factsheets/Sheets/2016/08/01/16/11/Debt-Relief-Under-the-Heavily-Indebt-ed-Poor-Countries-Initiative?pdf=1
141Country classification
Table ADeveloped economies
North America
EuropeMajor developed economies (G7)European Union Other Europe
CanadaUnited States
EU-15Austriaa
Belgiuma
DenmarkFinlanda
Francea
Germanya
Greecea
Irelanda
Italya
Luxembourga
Netherlandsa
Portugala
Spaina
SwedenUnited Kingdom
EU-13b
BulgariaCroatiaCyprusa
Czech RepublicEstoniaa
HungaryLatviaa
Lithuaniaa
Maltaa
PolandRomaniaSlovakiaa
Sloveniaa
IcelandNorwaySwitzerland
CanadaJapanFranceGermanyItalyUnited Kingdom United States
Developed Asia and Pacific
AustraliaJapanNew Zealand
The exchange-rate based method differs from the one mainly applied by the IMF and the World Bank for their estimates of world and regional economic growth, which is based on purchasing power parity (PPP) weights. Over the past two decades, the growth of world gross product (WGP) on the basis of the exchange-rate based approach has been below that based on PPP weights. This is because developing countries, in the aggregate, have seen significantly higher economic growth than the rest of the world in the 1990s and 2000s and the share in WGP of these countries is larger under PPP measurements than under market exchange rates.
a Member of Euro area.b Used in reference to the 13 countries that joined the EU since 2004.
Table BEconomies in transition
South-Eastern Europe Commonwealth of Independent States and Georgiaa
AlbaniaBosnia and HerzegovinaMontenegroSerbia The former Yugoslav Republic
of Macedonia
ArmeniaAzerbaijanBelarusGeorgiaa
KazakhstanKyrgyzstan
Republic of MoldovaRussian FederationTajikistanTurkmenistanUkraineb
Uzbekistan
a Georgia officially left the Commonwealth of Independent States on 18 August 2009. However, its performance is discussed in the context of this group of countries for reasons of geographic proximity and similarities in economic structure.b Starting in 2010, data for the Ukraine excludes the temporarily occupied territory of the Autonomous Republic of Crimea and Sevastopol.

142 World Economic Situation and Prospects 2018
a Economies systematically monitored by the Global
Economic Monitoring Unit of DPAD.
b Throughout the report the term ‘East Asia’ is used
in reference to this set of developing countries, and
excludes Japan.
c Special Administrative Region of China.
Table CDeveloping economies by regiona
Africa AsiaLatin America
and the Caribbean
North Africa
AlgeriaEgyptLibyaMauritaniaMoroccoSudanTunisia
Central Africa
CameroonCentral African
RepublicChadCongoEquatorial GuineaGabonSao Tome and
Prinicipe
East Africa
BurundiComorosDemocratic Republic
of the CongoDjiboutiEritreaEthiopiaKenyaMadagascarRwandaSomaliaUgandaUnited Republic
of Tanzania
Southern Africa
AngolaBotswanaLesothoMalawiMauritiusMozambiqueNamibiaSouth AfricaSwazilandZambiaZimbabwe
West Africa
BeninBurkina FasoCabo VerdeCôte d’IvoireGambia (Islamic
Republic of the)GhanaGuineaGuinea-BissauLiberiaMaliNigerNigeriaSenegalSierra LeoneTogo
East Asiab
Brunei DarussalamCambodiaChinaFijiHong Kong SARc
IndonesiaKiribatiLao People’s Democratic
RepublicMalaysiaMongoliaMyanmarPapua New GuineaPhilippinesRepublic of KoreaSamoaSingaporeSolomon IslandsTaiwan Province of ChinaThailandTimor-LesteVanuatuViet Nam
South Asia
AfghanistanBangladeshBhutanIndiaIran (Islamic Republic of)MaldivesNepalPakistanSri Lanka
Western Asia
BahrainIraqIsraelJordanKuwaitLebanonOmanQatarSaudi ArabiaSyrian Arab RepublicTurkeyUnited Arab EmiratesYemen
Caribbean
BahamasBarbadosBelizeDominican RepublicGuyanaJamaicaSurinameTrinidad and Tobago
Mexico and Central America
Costa RicaCubaDominican RepublicEl SalvadorGuatemalaHaitiHondurasMexicoNicaraguaPanama
South America
ArgentinaBolivia (Plurinational
State of)BrazilChileColombiaEcuadorParaguayPeruUruguayVenezuela (Bolivarian
Republic of)

143Country classification
Table DFuel-exporting countries
Economies in transition
Developing countries
Latin America and the
Caribbean Africa East Asia South Asia Western Asia
Azerbaijan
Kazakhstan
Russian Federation
Turkmenistan
Uzbekistan
Bolivia (Plurinational State of)
Colombia
Ecuador
Trinidad and Tobago
Venezuela (Bolivarian Republic of)
Algeria
Angola
Cameroon
Chad
Congo
Côte d’Ivoire
Egypt
Equatorial Guinea
Gabon
Libya
Nigeria
Sudan
Brunei Darussalam
Indonesia
Viet Nam
Iran (Islamic Republic of)
Bahrain
Iraq
Kuwait
Oman
Qatar
Saudi Arabia
United Arab Emirates
Yemen

144 World Economic Situation and Prospects 2018
Table EEconomies by per capita GNI in June 2017
a
High-income Upper middle income Lower middle income
AustraliaAustriaBahamasBahrainBarbadosBelgiumBrunei
DarussalamCanadaChileCyprusCzech RepublicDenmarkEstoniaFinlandFranceGermanyGreeceHong Kong SARd
HungaryIcelandIrelandIsraelItalyJapanKuwaitLatvia
LithuaniaLuxembourgMaltaNetherlandsNew ZealandNorwayOmanPolandPortugalQatarRepublic of KoreaSaudi ArabiaSingaporeSlovak RepublicSloveniaSpainSwedenSwitzerlandTaiwan Province of
ChinaTrinidad and TobagoUnited Arab EmiratesUnited KingdomUnited StatesUruguay
AlbaniaAlgeriaArgentinaAzerbaijanBelarusBelizeBosnia and
HerzegovinaBotswanaBrazilBulgariaChinaColombiaCosta RicaCroatiab
CubaDominican RepublicEcuadorEquatorial GuineaFijiGabonGuyanaIran (Islamic Republic
of)IraqJamaica
KazakhstanLebanonLibyaMalaysiaMaldivesMauritiusMexicoMontenegroNamibiaPanamaParaguayPeruRomaniaRussian FederationSamoac
SerbiaSouth AfricaSurinameThailandThe former Yugoslav
Republic of Macedonia
TurkeyTurkmenistanVenezuela (Bolivarian
Republic of)
Angolab
ArmeniaBangladeshBhutanBolivia (Plurinational
State of)CambodiaCameroonCabo VerdeCongoCôte d’IvoireDjiboutiEgyptEl SalvadorGhanaGeorgiab
GuatemalaHondurasIndiaIndonesiaJordanb
KenyaKiribatiKyrgyz Republic Lao People’s
Democratic Republic
LesothoMauritania
MongoliaMoroccoMyanmarNicaraguaNigeriaPakistanPapua New GuineaPhilippinesRepublic of MoldovaSão Tomé and
PrincipeSolomon IslandsSri LankaSudanSwazilandSyrian Arab RepublicTajikistanTimor-LesteTunisiaUkraineUzbekistanVanuatuViet NamYemen Zambia
Low-income
AfghanistanBeninBurkina FasoBurundiCentral African
RepublicChadComorosDemocratic Republic
of the CongoEritreaEthiopiaGambiaGuineaGuinea-BissauHaiti
Liberia MadagascarMalawiMaliMozambiqueNepalNigerRwandaSenegalSierra LeoneSomaliaTogoUgandaUnited Republic of
TanzaniaZimbabwe
a Economies systematically monitored for the World Economic Situation and Prospects report and included in the United Nations’ global economic forecast.
b Indicates the country has been shifted downward by one category from previous year’s classification.
c Indicates the country has been shifted upward by one category from previous year’s classification.
d Special Administrative Region of China.
145Country classification
Table FLeast developed countries (June 2017)
Africa East Asia South Asia Western AsiaLatin America
and the Caribbean
AngolaBeninBurkina FasoBurundiCentral African RepublicChadComorosDemocratic Republic of
the CongoDjiboutiEritreaEthiopiaGambiaGuineaGuinea-BissauLesothoLiberiaMadagascar
MalawiMaliMauritaniaMozambiqueNigerRwandaSao Tome and PrincipeSenegalSierra LeoneSomaliaSouth Sudana
SudanTogoUgandaUnited Republic
of TanzaniaZambia
CambodiaKiribatiLao People’s
Democratic Republic
MyanmarSolomon
IslandsTimor LesteTuvalua
Vanuatu
AfghanistanBangladeshBhutanNepal
Yemen Haiti
a Not included in the WESP discussion because of insufficient data.
Table GHeavily indebted poor countries (as of February 2017)
Post-completion point HIPCsa Pre-decision point HIPCsb
AfghanistanBeninBoliviaBurkina FasoBurundiCameroonCentral African RepublicChadComorosCongoCôte D’IvoireDemocratic Republic of the CongoEthiopiaGambiaGhanaGuineaGuinea-BissauGuyana
Haiti HondurasLiberiaMadagascarMalawiMaliMauritaniaMozambiqueNicaraguaNigerRwandaSao Tomé and PrincipeSenegalSierra LeoneTogoUgandaUnited Republic of TanzaniaZambia
EritreaSomaliaSudan
a Countries that have qualified for irrevocable debt relief under the HIPC Initiative.
b Countries that are potentially eligible and may wish to avail themselves of the HIPC Initiative or the Multilateral Debt Relief Initiative (MDRI).
146 World Economic Situation and Prospects 2018
Table HSmall island developing States
United Nations membersNon-UN members/Associate members
of the Regional Commissions
Antigua and Barbuda
Bahamas
Bahrain
Barbados
Belize
Cabo Verde
Comoros
Cuba
Dominica
Dominican Republic
Federated States of Micronesia
Fiji
Grenada
Guinea-Bissau
Guyana
Haiti
Jamaica
Kiribati
Maldives
Marshall Islands
Mauritius
Nauru
Palau
Papua New Guinea
Saint Kitts and Nevis
Saint Lucia
Saint Vincent and the Grenadines
Samoa
São Tomé and Príncipe
Seychelles
Singapore
Solomon Islands
Suriname
Timor-Leste
Tonga
Trinidad and Tobago
Tuvalu
Vanuatu
American Samoa
Anguilla
Aruba
Bermuda
British Virgin Islands
Cayman Islands
Commonwealth of Northern Marianas
Cook Islands
Curaçao
French Polynesia
Guadeloupe
Guam
Martinique
Montserrat
New Caledonia
Niue
Puerto Rico
Turks and Caicos Islands
U.S. Virgin Islands
Table ILandlocked developing countries
Landlocked developing countries
Afghanistan
Armenia
Azerbaijan
Bhutan
Bolivia (Plurinational State of)
Botswana
Burkina Faso
Burundi
Central African Republic
Chad
Ethiopia
Kazakhstan
Kyrgystan
Lao People’s Democratic Republic
Lesotho
Malawi
Mali
Mongolia
Nepal
Niger
Paraguay
Republic of Moldova
Rwanda
South Sudan
Swaziland
Tajikistan
The former Yugoslav Republic of Macedonia
Turkmenistan
Uganda
Uzbekistan
Zambia
Zimbabwe
147Country classification
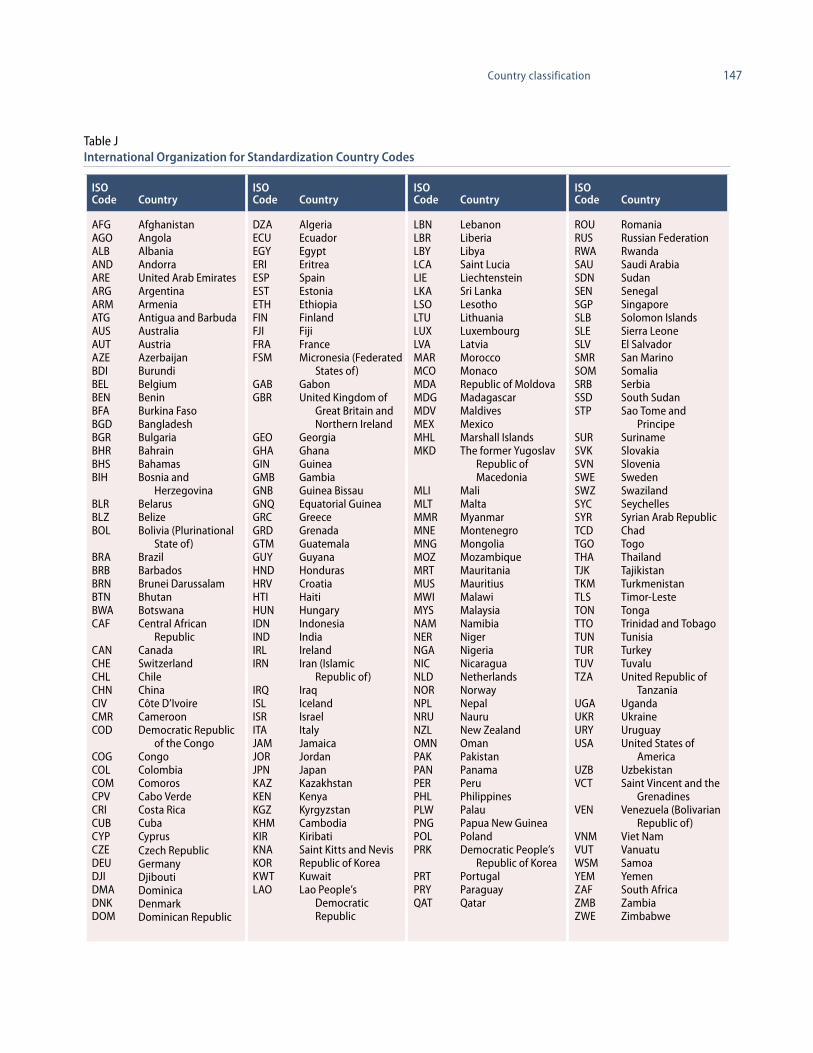
Table JInternational Organization for Standardization Country Codes
ISO Code Country
ISO Code Country
ISO Code Country
ISO Code Country
AFGAGOALBANDAREARGARMATGAUSAUTAZEBDIBELBENBFABGDBGRBHRBHSBIH
BLRBLZBOL
BRABRBBRNBTNBWACAF
CANCHECHLCHNCIVCMRCOD
COGCOLCOMCPVCRICUBCYPCZEDEUDJIDMADNKDOM
AfghanistanAngolaAlbaniaAndorraUnited Arab EmiratesArgentinaArmeniaAntigua and BarbudaAustraliaAustriaAzerbaijanBurundiBelgiumBeninBurkina FasoBangladeshBulgariaBahrainBahamasBosnia and
HerzegovinaBelarusBelizeBolivia (Plurinational
State of)BrazilBarbadosBrunei DarussalamBhutanBotswanaCentral African
RepublicCanadaSwitzerlandChileChinaCôte D’IvoireCameroonDemocratic Republic
of the CongoCongoColombiaComorosCabo VerdeCosta RicaCubaCyprusCzech RepublicGermanyDjiboutiDominicaDenmarkDominican Republic
DZAECUEGYERIESPESTETH FINFJIFRAFSM
GABGBR
GEOGHAGINGMBGNBGNQGRCGRDGTMGUYHNDHRVHTIHUNIDNINDIRLIRN
IRQISLISRITAJAMJORJPNKAZKENKGZKHMKIRKNAKORKWTLAO
AlgeriaEcuador EgyptEritreaSpainEstoniaEthiopiaFinlandFijiFranceMicronesia (Federated
States of)GabonUnited Kingdom of
Great Britain and Northern Ireland
GeorgiaGhanaGuineaGambiaGuinea BissauEquatorial GuineaGreeceGrenadaGuatemalaGuyanaHondurasCroatiaHaitiHungaryIndonesiaIndiaIrelandIran (Islamic
Republic of)IraqIcelandIsraelItalyJamaicaJordanJapanKazakhstanKenyaKyrgyzstanCambodiaKiribatiSaint Kitts and NevisRepublic of KoreaKuwaitLao People’s
Democratic Republic
LBNLBRLBYLCA LIE LKALSOLTULUXLVAMARMCOMDAMDGMDVMEX MHLMKD
MLIMLT MMRMNEMNGMOZMRTMUSMWIMYSNAMNERNGANICNLDNORNPLNRUNZLOMNPAKPANPERPHLPLWPNGPOLPRK
PRTPRYQAT
LebanonLiberiaLibyaSaint Lucia Liechtenstein Sri LankaLesothoLithuaniaLuxembourgLatviaMoroccoMonacoRepublic of MoldovaMadagascarMaldivesMexicoMarshall IslandsThe former Yugoslav
Republic of Macedonia
MaliMaltaMyanmarMontenegroMongoliaMozambiqueMauritaniaMauritiusMalawiMalaysiaNamibiaNigerNigeriaNicaraguaNetherlandsNorwayNepalNauruNew ZealandOmanPakistanPanamaPeruPhilippinesPalauPapua New GuineaPolandDemocratic People’s
Republic of KoreaPortugalParaguayQatar
ROURUSRWASAUSDNSENSGPSLB SLE SLVSMRSOMSRBSSDSTP
SURSVKSVNSWESWZSYCSYRTCD TGOTHATJKTKMTLSTONTTOTUNTURTUVTZA
UGAUKRURYUSA
UZBVCT
VEN
VNMVUTWSMYEMZAFZMBZWE
RomaniaRussian FederationRwandaSaudi ArabiaSudanSenegalSingapore Solomon Islands Sierra Leone El SalvadorSan MarinoSomaliaSerbiaSouth SudanSao Tome and
PrincipeSurinameSlovakiaSloveniaSwedenSwazilandSeychellesSyrian Arab RepublicChadTogoThailandTajikistanTurkmenistanTimor-LesteTongaTrinidad and TobagoTunisiaTurkeyTuvaluUnited Republic of
TanzaniaUgandaUkraineUruguayUnited States of
AmericaUzbekistanSaint Vincent and the
GrenadinesVenezuela (Bolivarian
Republic of)Viet NamVanuatuSamoaYemenSouth AfricaZambiaZimbabwe

Annex tables

151Annex tables
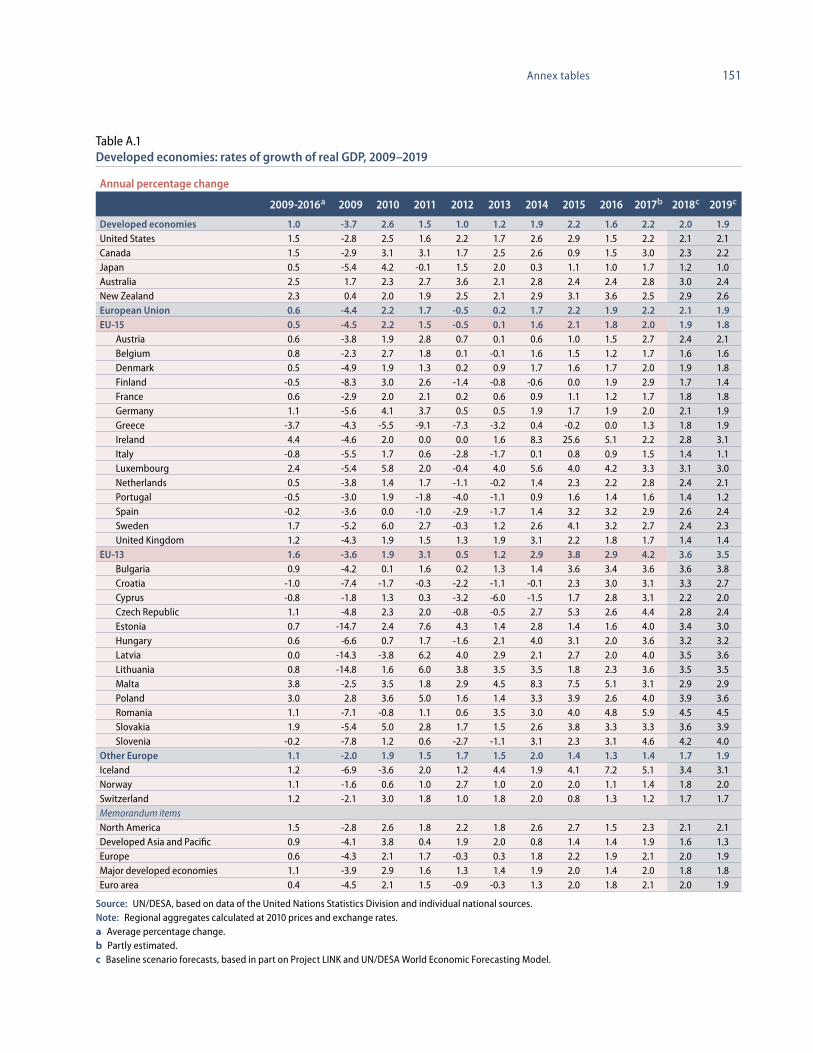
Table A.1Developed economies: rates of growth of real GDP, 2009–2019
Annual percentage change
2009-2016a 2009 2010 2011 2012 2013 2014 2015 2016 2017b 2018c 2019c
Developed economies 1.0 -3.7 2.6 1.5 1.0 1.2 1.9 2.2 1.6 2.2 2.0 1.9 United States 1.5 -2.8 2.5 1.6 2.2 1.7 2.6 2.9 1.5 2.2 2.1 2.1 Canada 1.5 -2.9 3.1 3.1 1.7 2.5 2.6 0.9 1.5 3.0 2.3 2.2 Japan 0.5 -5.4 4.2 -0.1 1.5 2.0 0.3 1.1 1.0 1.7 1.2 1.0 Australia 2.5 1.7 2.3 2.7 3.6 2.1 2.8 2.4 2.4 2.8 3.0 2.4 New Zealand 2.3 0.4 2.0 1.9 2.5 2.1 2.9 3.1 3.6 2.5 2.9 2.6 European Union 0.6 -4.4 2.2 1.7 -0.5 0.2 1.7 2.2 1.9 2.2 2.1 1.9 EU-15 0.5 -4.5 2.2 1.5 -0.5 0.1 1.6 2.1 1.8 2.0 1.9 1.8
Austria 0.6 -3.8 1.9 2.8 0.7 0.1 0.6 1.0 1.5 2.7 2.4 2.1 Belgium 0.8 -2.3 2.7 1.8 0.1 -0.1 1.6 1.5 1.2 1.7 1.6 1.6 Denmark 0.5 -4.9 1.9 1.3 0.2 0.9 1.7 1.6 1.7 2.0 1.9 1.8 Finland -0.5 -8.3 3.0 2.6 -1.4 -0.8 -0.6 0.0 1.9 2.9 1.7 1.4 France 0.6 -2.9 2.0 2.1 0.2 0.6 0.9 1.1 1.2 1.7 1.8 1.8 Germany 1.1 -5.6 4.1 3.7 0.5 0.5 1.9 1.7 1.9 2.0 2.1 1.9 Greece -3.7 -4.3 -5.5 -9.1 -7.3 -3.2 0.4 -0.2 0.0 1.3 1.8 1.9 Ireland 4.4 -4.6 2.0 0.0 0.0 1.6 8.3 25.6 5.1 2.2 2.8 3.1 Italy -0.8 -5.5 1.7 0.6 -2.8 -1.7 0.1 0.8 0.9 1.5 1.4 1.1 Luxembourg 2.4 -5.4 5.8 2.0 -0.4 4.0 5.6 4.0 4.2 3.3 3.1 3.0 Netherlands 0.5 -3.8 1.4 1.7 -1.1 -0.2 1.4 2.3 2.2 2.8 2.4 2.1 Portugal -0.5 -3.0 1.9 -1.8 -4.0 -1.1 0.9 1.6 1.4 1.6 1.4 1.2 Spain -0.2 -3.6 0.0 -1.0 -2.9 -1.7 1.4 3.2 3.2 2.9 2.6 2.4 Sweden 1.7 -5.2 6.0 2.7 -0.3 1.2 2.6 4.1 3.2 2.7 2.4 2.3 United Kingdom 1.2 -4.3 1.9 1.5 1.3 1.9 3.1 2.2 1.8 1.7 1.4 1.4
EU-13 1.6 -3.6 1.9 3.1 0.5 1.2 2.9 3.8 2.9 4.2 3.6 3.5 Bulgaria 0.9 -4.2 0.1 1.6 0.2 1.3 1.4 3.6 3.4 3.6 3.6 3.8 Croatia -1.0 -7.4 -1.7 -0.3 -2.2 -1.1 -0.1 2.3 3.0 3.1 3.3 2.7 Cyprus -0.8 -1.8 1.3 0.3 -3.2 -6.0 -1.5 1.7 2.8 3.1 2.2 2.0 Czech Republic 1.1 -4.8 2.3 2.0 -0.8 -0.5 2.7 5.3 2.6 4.4 2.8 2.4 Estonia 0.7 -14.7 2.4 7.6 4.3 1.4 2.8 1.4 1.6 4.0 3.4 3.0 Hungary 0.6 -6.6 0.7 1.7 -1.6 2.1 4.0 3.1 2.0 3.6 3.2 3.2 Latvia 0.0 -14.3 -3.8 6.2 4.0 2.9 2.1 2.7 2.0 4.0 3.5 3.6 Lithuania 0.8 -14.8 1.6 6.0 3.8 3.5 3.5 1.8 2.3 3.6 3.5 3.5 Malta 3.8 -2.5 3.5 1.8 2.9 4.5 8.3 7.5 5.1 3.1 2.9 2.9 Poland 3.0 2.8 3.6 5.0 1.6 1.4 3.3 3.9 2.6 4.0 3.9 3.6 Romania 1.1 -7.1 -0.8 1.1 0.6 3.5 3.0 4.0 4.8 5.9 4.5 4.5 Slovakia 1.9 -5.4 5.0 2.8 1.7 1.5 2.6 3.8 3.3 3.3 3.6 3.9 Slovenia -0.2 -7.8 1.2 0.6 -2.7 -1.1 3.1 2.3 3.1 4.6 4.2 4.0
Other Europe 1.1 -2.0 1.9 1.5 1.7 1.5 2.0 1.4 1.3 1.4 1.7 1.9 Iceland 1.2 -6.9 -3.6 2.0 1.2 4.4 1.9 4.1 7.2 5.1 3.4 3.1 Norway 1.1 -1.6 0.6 1.0 2.7 1.0 2.0 2.0 1.1 1.4 1.8 2.0 Switzerland 1.2 -2.1 3.0 1.8 1.0 1.8 2.0 0.8 1.3 1.2 1.7 1.7 Memorandum itemsNorth America 1.5 -2.8 2.6 1.8 2.2 1.8 2.6 2.7 1.5 2.3 2.1 2.1 Developed Asia and Pacific 0.9 -4.1 3.8 0.4 1.9 2.0 0.8 1.4 1.4 1.9 1.6 1.3 Europe 0.6 -4.3 2.1 1.7 -0.3 0.3 1.8 2.2 1.9 2.1 2.0 1.9 Major developed economies 1.1 -3.9 2.9 1.6 1.3 1.4 1.9 2.0 1.4 2.0 1.8 1.8 Euro area 0.4 -4.5 2.1 1.5 -0.9 -0.3 1.3 2.0 1.8 2.1 2.0 1.9
Source: UN/DESA, based on data of the United Nations Statistics Division and individual national sources.Note: Regional aggregates calculated at 2010 prices and exchange rates.a Average percentage change.b Partly estimated.c Baseline scenario forecasts, based in part on Project LINK and UN/DESA World Economic Forecasting Model.
152 World Economic Situation and Prospects 2018
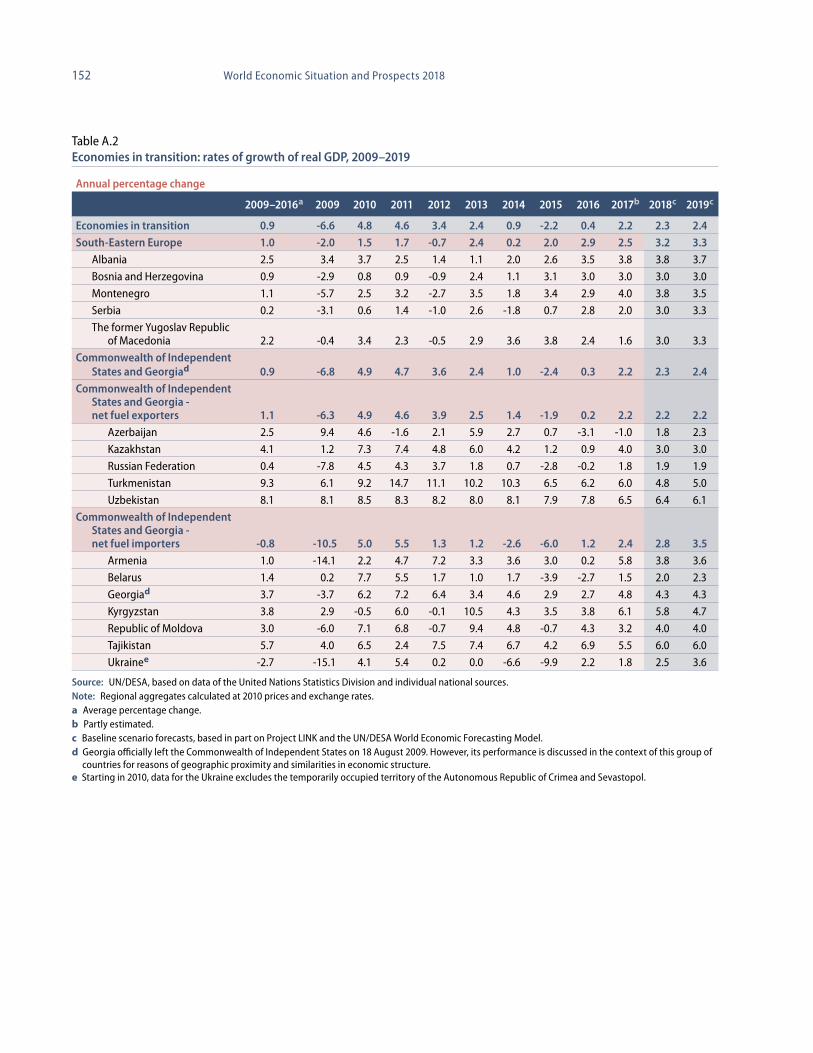
Table A.2Economies in transition: rates of growth of real GDP, 2009–2019
Annual percentage change
2009–2016a 2009 2010 2011 2012 2013 2014 2015 2016 2017b 2018c 2019c
Economies in transition 0.9 -6.6 4.8 4.6 3.4 2.4 0.9 -2.2 0.4 2.2 2.3 2.4 South-Eastern Europe 1.0 -2.0 1.5 1.7 -0.7 2.4 0.2 2.0 2.9 2.5 3.2 3.3
Albania 2.5 3.4 3.7 2.5 1.4 1.1 2.0 2.6 3.5 3.8 3.8 3.7
Bosnia and Herzegovina 0.9 -2.9 0.8 0.9 -0.9 2.4 1.1 3.1 3.0 3.0 3.0 3.0
Montenegro 1.1 -5.7 2.5 3.2 -2.7 3.5 1.8 3.4 2.9 4.0 3.8 3.5
Serbia 0.2 -3.1 0.6 1.4 -1.0 2.6 -1.8 0.7 2.8 2.0 3.0 3.3
The former Yugoslav Republic of Macedonia 2.2 -0.4 3.4 2.3 -0.5 2.9 3.6 3.8 2.4 1.6 3.0 3.3
Commonwealth of Independent States and Georgiad 0.9 -6.8 4.9 4.7 3.6 2.4 1.0 -2.4 0.3 2.2 2.3 2.4
Commonwealth of Independent States and Georgia - net fuel exporters 1.1 -6.3 4.9 4.6 3.9 2.5 1.4 -1.9 0.2 2.2 2.2 2.2
Azerbaijan 2.5 9.4 4.6 -1.6 2.1 5.9 2.7 0.7 -3.1 -1.0 1.8 2.3
Kazakhstan 4.1 1.2 7.3 7.4 4.8 6.0 4.2 1.2 0.9 4.0 3.0 3.0
Russian Federation 0.4 -7.8 4.5 4.3 3.7 1.8 0.7 -2.8 -0.2 1.8 1.9 1.9
Turkmenistan 9.3 6.1 9.2 14.7 11.1 10.2 10.3 6.5 6.2 6.0 4.8 5.0
Uzbekistan 8.1 8.1 8.5 8.3 8.2 8.0 8.1 7.9 7.8 6.5 6.4 6.1
Commonwealth of Independent States and Georgia - net fuel importers -0.8 -10.5 5.0 5.5 1.3 1.2 -2.6 -6.0 1.2 2.4 2.8 3.5
Armenia 1.0 -14.1 2.2 4.7 7.2 3.3 3.6 3.0 0.2 5.8 3.8 3.6
Belarus 1.4 0.2 7.7 5.5 1.7 1.0 1.7 -3.9 -2.7 1.5 2.0 2.3
Georgiad 3.7 -3.7 6.2 7.2 6.4 3.4 4.6 2.9 2.7 4.8 4.3 4.3
Kyrgyzstan 3.8 2.9 -0.5 6.0 -0.1 10.5 4.3 3.5 3.8 6.1 5.8 4.7
Republic of Moldova 3.0 -6.0 7.1 6.8 -0.7 9.4 4.8 -0.7 4.3 3.2 4.0 4.0
Tajikistan 5.7 4.0 6.5 2.4 7.5 7.4 6.7 4.2 6.9 5.5 6.0 6.0
Ukrainee -2.7 -15.1 4.1 5.4 0.2 0.0 -6.6 -9.9 2.2 1.8 2.5 3.6
Source: UN/DESA, based on data of the United Nations Statistics Division and individual national sources.Note: Regional aggregates calculated at 2010 prices and exchange rates.a Average percentage change.b Partly estimated.c Baseline scenario forecasts, based in part on Project LINK and the UN/DESA World Economic Forecasting Model.d Georgia officially left the Commonwealth of Independent States on 18 August 2009. However, its performance is discussed in the context of this group of countries for reasons of geographic proximity and similarities in economic structure. e Starting in 2010, data for the Ukraine excludes the temporarily occupied territory of the Autonomous Republic of Crimea and Sevastopol.
153Annex tables
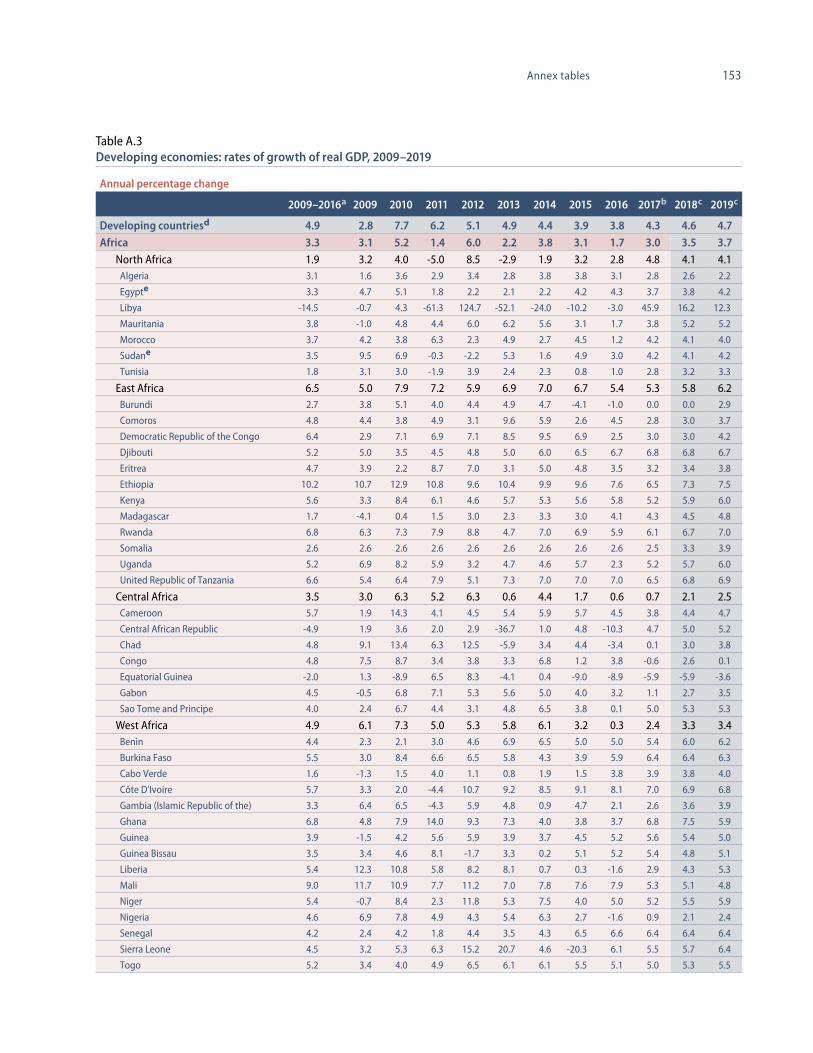
Table A.3Developing economies: rates of growth of real GDP, 2009–2019
Annual percentage change
2009–2016a 2009 2010 2011 2012 2013 2014 2015 2016 2017b 2018c 2019c
Developing countriesd 4.9 2.8 7.7 6.2 5.1 4.9 4.4 3.9 3.8 4.3 4.6 4.7Africa 3.3 3.1 5.2 1.4 6.0 2.2 3.8 3.1 1.7 3.0 3.5 3.7
North Africa 1.9 3.2 4.0 -5.0 8.5 -2.9 1.9 3.2 2.8 4.8 4.1 4.1 Algeria 3.1 1.6 3.6 2.9 3.4 2.8 3.8 3.8 3.1 2.8 2.6 2.2
Egypte 3.3 4.7 5.1 1.8 2.2 2.1 2.2 4.2 4.3 3.7 3.8 4.2
Libya -14.5 -0.7 4.3 -61.3 124.7 -52.1 -24.0 -10.2 -3.0 45.9 16.2 12.3
Mauritania 3.8 -1.0 4.8 4.4 6.0 6.2 5.6 3.1 1.7 3.8 5.2 5.2
Morocco 3.7 4.2 3.8 6.3 2.3 4.9 2.7 4.5 1.2 4.2 4.1 4.0
Sudane 3.5 9.5 6.9 -0.3 -2.2 5.3 1.6 4.9 3.0 4.2 4.1 4.2
Tunisia 1.8 3.1 3.0 -1.9 3.9 2.4 2.3 0.8 1.0 2.8 3.2 3.3
East Africa 6.5 5.0 7.9 7.2 5.9 6.9 7.0 6.7 5.4 5.3 5.8 6.2 Burundi 2.7 3.8 5.1 4.0 4.4 4.9 4.7 -4.1 -1.0 0.0 0.0 2.9
Comoros 4.8 4.4 3.8 4.9 3.1 9.6 5.9 2.6 4.5 2.8 3.0 3.7
Democratic Republic of the Congo 6.4 2.9 7.1 6.9 7.1 8.5 9.5 6.9 2.5 3.0 3.0 4.2
Djibouti 5.2 5.0 3.5 4.5 4.8 5.0 6.0 6.5 6.7 6.8 6.8 6.7
Eritrea 4.7 3.9 2.2 8.7 7.0 3.1 5.0 4.8 3.5 3.2 3.4 3.8
Ethiopia 10.2 10.7 12.9 10.8 9.6 10.4 9.9 9.6 7.6 6.5 7.3 7.5
Kenya 5.6 3.3 8.4 6.1 4.6 5.7 5.3 5.6 5.8 5.2 5.9 6.0
Madagascar 1.7 -4.1 0.4 1.5 3.0 2.3 3.3 3.0 4.1 4.3 4.5 4.8
Rwanda 6.8 6.3 7.3 7.9 8.8 4.7 7.0 6.9 5.9 6.1 6.7 7.0
Somalia 2.6 2.6 2.6 2.6 2.6 2.6 2.6 2.6 2.6 2.5 3.3 3.9
Uganda 5.2 6.9 8.2 5.9 3.2 4.7 4.6 5.7 2.3 5.2 5.7 6.0
United Republic of Tanzania 6.6 5.4 6.4 7.9 5.1 7.3 7.0 7.0 7.0 6.5 6.8 6.9
Central Africa 3.5 3.0 6.3 5.2 6.3 0.6 4.4 1.7 0.6 0.7 2.1 2.5 Cameroon 5.7 1.9 14.3 4.1 4.5 5.4 5.9 5.7 4.5 3.8 4.4 4.7
Central African Republic -4.9 1.9 3.6 2.0 2.9 -36.7 1.0 4.8 -10.3 4.7 5.0 5.2
Chad 4.8 9.1 13.4 6.3 12.5 -5.9 3.4 4.4 -3.4 0.1 3.0 3.8
Congo 4.8 7.5 8.7 3.4 3.8 3.3 6.8 1.2 3.8 -0.6 2.6 0.1
Equatorial Guinea -2.0 1.3 -8.9 6.5 8.3 -4.1 0.4 -9.0 -8.9 -5.9 -5.9 -3.6
Gabon 4.5 -0.5 6.8 7.1 5.3 5.6 5.0 4.0 3.2 1.1 2.7 3.5
Sao Tome and Principe 4.0 2.4 6.7 4.4 3.1 4.8 6.5 3.8 0.1 5.0 5.3 5.3
West Africa 4.9 6.1 7.3 5.0 5.3 5.8 6.1 3.2 0.3 2.4 3.3 3.4 Benin 4.4 2.3 2.1 3.0 4.6 6.9 6.5 5.0 5.0 5.4 6.0 6.2
Burkina Faso 5.5 3.0 8.4 6.6 6.5 5.8 4.3 3.9 5.9 6.4 6.4 6.3
Cabo Verde 1.6 -1.3 1.5 4.0 1.1 0.8 1.9 1.5 3.8 3.9 3.8 4.0
Côte D’Ivoire 5.7 3.3 2.0 -4.4 10.7 9.2 8.5 9.1 8.1 7.0 6.9 6.8
Gambia (Islamic Republic of the) 3.3 6.4 6.5 -4.3 5.9 4.8 0.9 4.7 2.1 2.6 3.6 3.9
Ghana 6.8 4.8 7.9 14.0 9.3 7.3 4.0 3.8 3.7 6.8 7.5 5.9
Guinea 3.9 -1.5 4.2 5.6 5.9 3.9 3.7 4.5 5.2 5.6 5.4 5.0
Guinea Bissau 3.5 3.4 4.6 8.1 -1.7 3.3 0.2 5.1 5.2 5.4 4.8 5.1
Liberia 5.4 12.3 10.8 5.8 8.2 8.1 0.7 0.3 -1.6 2.9 4.3 5.3
Mali 9.0 11.7 10.9 7.7 11.2 7.0 7.8 7.6 7.9 5.3 5.1 4.8
Niger 5.4 -0.7 8.4 2.3 11.8 5.3 7.5 4.0 5.0 5.2 5.5 5.9
Nigeria 4.6 6.9 7.8 4.9 4.3 5.4 6.3 2.7 -1.6 0.9 2.1 2.4
Senegal 4.2 2.4 4.2 1.8 4.4 3.5 4.3 6.5 6.6 6.4 6.4 6.4
Sierra Leone 4.5 3.2 5.3 6.3 15.2 20.7 4.6 -20.3 6.1 5.5 5.7 6.4
Togo 5.2 3.4 4.0 4.9 6.5 6.1 6.1 5.5 5.1 5.0 5.3 5.5
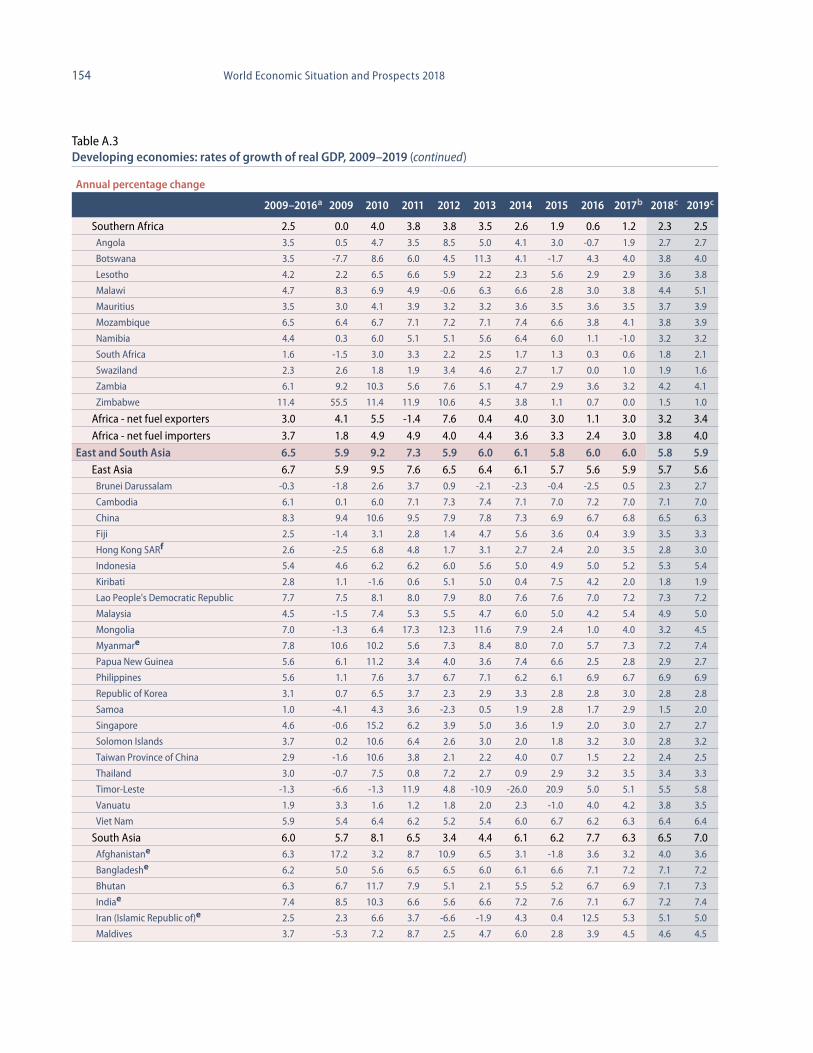
154 World Economic Situation and Prospects 2018
Annual percentage change
2009–2016a 2009 2010 2011 2012 2013 2014 2015 2016 2017b 2018c 2019c
Southern Africa 2.5 0.0 4.0 3.8 3.8 3.5 2.6 1.9 0.6 1.2 2.3 2.5 Angola 3.5 0.5 4.7 3.5 8.5 5.0 4.1 3.0 -0.7 1.9 2.7 2.7
Botswana 3.5 -7.7 8.6 6.0 4.5 11.3 4.1 -1.7 4.3 4.0 3.8 4.0
Lesotho 4.2 2.2 6.5 6.6 5.9 2.2 2.3 5.6 2.9 2.9 3.6 3.8
Malawi 4.7 8.3 6.9 4.9 -0.6 6.3 6.6 2.8 3.0 3.8 4.4 5.1
Mauritius 3.5 3.0 4.1 3.9 3.2 3.2 3.6 3.5 3.6 3.5 3.7 3.9
Mozambique 6.5 6.4 6.7 7.1 7.2 7.1 7.4 6.6 3.8 4.1 3.8 3.9
Namibia 4.4 0.3 6.0 5.1 5.1 5.6 6.4 6.0 1.1 -1.0 3.2 3.2
South Africa 1.6 -1.5 3.0 3.3 2.2 2.5 1.7 1.3 0.3 0.6 1.8 2.1
Swaziland 2.3 2.6 1.8 1.9 3.4 4.6 2.7 1.7 0.0 1.0 1.9 1.6
Zambia 6.1 9.2 10.3 5.6 7.6 5.1 4.7 2.9 3.6 3.2 4.2 4.1
Zimbabwe 11.4 55.5 11.4 11.9 10.6 4.5 3.8 1.1 0.7 0.0 1.5 1.0
Africa - net fuel exporters 3.0 4.1 5.5 -1.4 7.6 0.4 4.0 3.0 1.1 3.0 3.2 3.4
Africa - net fuel importers 3.7 1.8 4.9 4.9 4.0 4.4 3.6 3.3 2.4 3.0 3.8 4.0
East and South Asia 6.5 5.9 9.2 7.3 5.9 6.0 6.1 5.8 6.0 6.0 5.8 5.9East Asia 6.7 5.9 9.5 7.6 6.5 6.4 6.1 5.7 5.6 5.9 5.7 5.6 Brunei Darussalam -0.3 -1.8 2.6 3.7 0.9 -2.1 -2.3 -0.4 -2.5 0.5 2.3 2.7
Cambodia 6.1 0.1 6.0 7.1 7.3 7.4 7.1 7.0 7.2 7.0 7.1 7.0
China 8.3 9.4 10.6 9.5 7.9 7.8 7.3 6.9 6.7 6.8 6.5 6.3
Fiji 2.5 -1.4 3.1 2.8 1.4 4.7 5.6 3.6 0.4 3.9 3.5 3.3
Hong Kong SARf 2.6 -2.5 6.8 4.8 1.7 3.1 2.7 2.4 2.0 3.5 2.8 3.0
Indonesia 5.4 4.6 6.2 6.2 6.0 5.6 5.0 4.9 5.0 5.2 5.3 5.4
Kiribati 2.8 1.1 -1.6 0.6 5.1 5.0 0.4 7.5 4.2 2.0 1.8 1.9
Lao People's Democratic Republic 7.7 7.5 8.1 8.0 7.9 8.0 7.6 7.6 7.0 7.2 7.3 7.2
Malaysia 4.5 -1.5 7.4 5.3 5.5 4.7 6.0 5.0 4.2 5.4 4.9 5.0
Mongolia 7.0 -1.3 6.4 17.3 12.3 11.6 7.9 2.4 1.0 4.0 3.2 4.5
Myanmare 7.8 10.6 10.2 5.6 7.3 8.4 8.0 7.0 5.7 7.3 7.2 7.4
Papua New Guinea 5.6 6.1 11.2 3.4 4.0 3.6 7.4 6.6 2.5 2.8 2.9 2.7
Philippines 5.6 1.1 7.6 3.7 6.7 7.1 6.2 6.1 6.9 6.7 6.9 6.9
Republic of Korea 3.1 0.7 6.5 3.7 2.3 2.9 3.3 2.8 2.8 3.0 2.8 2.8
Samoa 1.0 -4.1 4.3 3.6 -2.3 0.5 1.9 2.8 1.7 2.9 1.5 2.0
Singapore 4.6 -0.6 15.2 6.2 3.9 5.0 3.6 1.9 2.0 3.0 2.7 2.7
Solomon Islands 3.7 0.2 10.6 6.4 2.6 3.0 2.0 1.8 3.2 3.0 2.8 3.2
Taiwan Province of China 2.9 -1.6 10.6 3.8 2.1 2.2 4.0 0.7 1.5 2.2 2.4 2.5
Thailand 3.0 -0.7 7.5 0.8 7.2 2.7 0.9 2.9 3.2 3.5 3.4 3.3
Timor-Leste -1.3 -6.6 -1.3 11.9 4.8 -10.9 -26.0 20.9 5.0 5.1 5.5 5.8
Vanuatu 1.9 3.3 1.6 1.2 1.8 2.0 2.3 -1.0 4.0 4.2 3.8 3.5
Viet Nam 5.9 5.4 6.4 6.2 5.2 5.4 6.0 6.7 6.2 6.3 6.4 6.4
South Asia 6.0 5.7 8.1 6.5 3.4 4.4 6.1 6.2 7.7 6.3 6.5 7.0 Afghanistane 6.3 17.2 3.2 8.7 10.9 6.5 3.1 -1.8 3.6 3.2 4.0 3.6
Bangladeshe 6.2 5.0 5.6 6.5 6.5 6.0 6.1 6.6 7.1 7.2 7.1 7.2
Bhutan 6.3 6.7 11.7 7.9 5.1 2.1 5.5 5.2 6.7 6.9 7.1 7.3
Indiae 7.4 8.5 10.3 6.6 5.6 6.6 7.2 7.6 7.1 6.7 7.2 7.4
Iran (Islamic Republic of)e 2.5 2.3 6.6 3.7 -6.6 -1.9 4.3 0.4 12.5 5.3 5.1 5.0
Maldives 3.7 -5.3 7.2 8.7 2.5 4.7 6.0 2.8 3.9 4.5 4.6 4.5
Table A.3Developing economies: rates of growth of real GDP, 2009–2019 (continued)

155Annex tables
Table A.3Developing economies: rates of growth of real GDP, 2009–2019 (continued)
Annual percentage change
2009–2016a 2009 2010 2011 2012 2013 2014 2015 2016 2017b 2018c 2019c
Nepale 3.9 4.5 4.8 3.4 4.8 4.1 6.0 2.7 0.6 7.5 4.6 4.9
Pakistane 3.8 2.8 1.6 2.7 3.5 4.4 4.7 4.7 5.7 5.3 5.5 5.2
Sri Lanka 5.8 3.5 8.0 8.4 9.1 3.4 4.9 4.8 4.4 4.5 5.0 4.7
East and South Asia - net fuel exporters 4.5 3.7 6.0 5.5 2.4 2.8 4.4 3.9 7.5 5.3 5.3 5.4
East and South Asia - net fuel importers 6.8 6.1 9.6 7.6 6.3 6.4 6.3 6.0 5.9 6.0 5.9 5.9
Western Asia 4.0 -1.6 6.1 7.5 4.6 5.9 3.3 3.6 3.0 1.9 2.3 2.7Net fuel exporters 3.9 -1.0 4.6 8.3 6.1 5.7 2.6 2.6 3.0 1.0 2.5 2.6 Bahrain 3.5 2.5 4.3 2.0 3.7 5.4 4.4 2.9 3.0 1.8 1.9 2.1
Iraq 8.2 5.8 5.5 10.2 12.6 26.0 -0.6 -2.4 11.0 1.8 3.7 3.1
Kuwait 1.5 -7.1 -2.4 9.6 6.6 1.1 0.5 1.8 2.5 0.8 2.5 2.9
Oman 4.3 6.1 4.8 -1.1 9.3 4.4 2.5 5.7 3.1 1.2 2.7 2.1
Qatar 7.4 12.0 16.7 13.0 4.7 4.4 4.0 3.6 2.2 1.3 3.3 2.9
Saudi Arabia 3.7 -2.1 5.0 10.0 5.4 2.7 3.7 4.1 1.4 0.4 1.8 2.1
United Arab Emirates 2.9 -5.2 1.6 6.4 5.1 5.8 3.3 3.8 3.0 2.1 2.8 3.1
Yemen -6.9 4.1 5.7 -12.8 2.0 -1.6 -9.6 -28.1 -9.8 -7.5 -4.3 0.2
Net fuel importers 4.1 -2.2 7.8 6.7 2.8 6.1 4.2 4.8 3.1 3.0 2.2 2.9 Israel 3.6 1.4 5.7 5.1 2.4 4.4 3.2 2.5 4.0 2.9 3.1 3.2
Jordan 2.9 5.5 2.3 2.6 2.7 2.8 3.1 2.4 2.0 2.5 2.8 2.9
Lebanon 3.6 10.1 8.0 0.9 2.8 3.0 1.8 1.5 1.0 2.0 2.5 2.5
Syrian Arab Republic -9.3 5.9 3.4 -6.3 -22.4 -24.8 -11.6 -8.0 -5.8 -3.9 -2.3 0.4
Turkey 5.0 -4.8 9.2 8.8 4.8 8.5 5.2 6.1 3.2 3.3 2.1 3.0
Latin America and the Caribbean 1.7 -1.7 6.0 4.5 2.9 2.8 0.9 -0.6 -1.3 1.0 2.0 2.5South America 1.4 -1.0 6.4 4.7 2.6 3.2 0.3 -1.9 -2.7 0.4 1.8 2.4 Argentina 1.1 -6.0 10.4 6.1 -1.0 2.4 -2.5 2.6 -2.2 2.4 2.7 3.1
Bolivia (Plurinational State of) 4.9 3.4 4.1 5.2 5.1 6.8 5.5 4.9 4.3 4.0 4.0 3.8
Brazil 1.1 -0.1 7.5 3.9 1.9 3.0 0.5 -3.8 -3.6 0.7 2.0 2.5
Chile 3.2 -1.0 5.8 5.8 5.3 4.0 1.9 2.3 1.6 1.5 2.8 3.0
Colombia 3.8 1.7 4.0 6.6 4.0 4.9 4.4 3.1 2.0 1.8 2.6 3.0
Ecuador 3.0 0.6 3.5 7.9 5.6 4.9 3.7 0.1 -1.6 0.7 1.0 1.5
Paraguay 4.6 -4.0 13.1 4.3 -1.2 14.0 4.7 3.0 4.0 4.0 4.0 3.8
Peru 4.6 1.1 8.3 6.3 6.1 5.9 2.3 3.3 3.9 2.5 3.5 3.8
Uruguay 3.8 4.2 7.8 5.2 3.5 4.6 3.2 0.4 1.5 3.0 3.2 2.9
Venezuela (Bolivarian Republic of) -1.8 -3.2 -1.5 4.2 5.6 1.3 -3.9 -6.2 -9.7 -8.0 -4.0 -1.0
Mexico and Central America 2.4 -3.8 5.0 4.0 4.0 1.8 2.6 3.1 2.5 2.5 2.6 2.6 Costa Rica 3.5 -1.0 5.0 4.3 4.8 2.0 3.7 4.7 4.3 3.9 4.0 4.0
Cuba 2.1 1.5 2.4 2.8 3.0 2.7 1.0 4.4 -0.9 0.5 0.5 1.9
Dominican Republic 5.0 0.9 8.3 2.8 2.6 4.8 7.3 7.0 6.6 4.9 5.1 4.7
El Salvador 1.3 -3.1 1.4 2.2 1.9 1.8 1.4 2.5 2.4 2.4 2.4 2.2
Guatemala 3.2 0.5 2.9 4.2 3.0 3.7 4.3 4.1 3.1 3.4 3.5 3.5
Haitie 1.9 3.1 -5.5 5.5 2.9 4.2 2.8 1.2 1.4 1.3 1.3 2.1
Honduras 2.8 -2.4 3.7 3.8 4.1 2.8 3.1 3.6 3.6 3.7 3.7 3.3
Mexico 2.1 -4.7 5.2 3.9 4.0 1.4 2.3 2.6 2.3 2.2 2.4 2.3
Nicaragua 3.9 -2.8 3.2 6.2 5.9 5.0 4.6 4.9 4.7 4.5 4.5 4.1
Panama 6.4 1.6 5.8 11.8 9.2 6.6 6.1 5.8 4.9 5.5 5.4 5.0
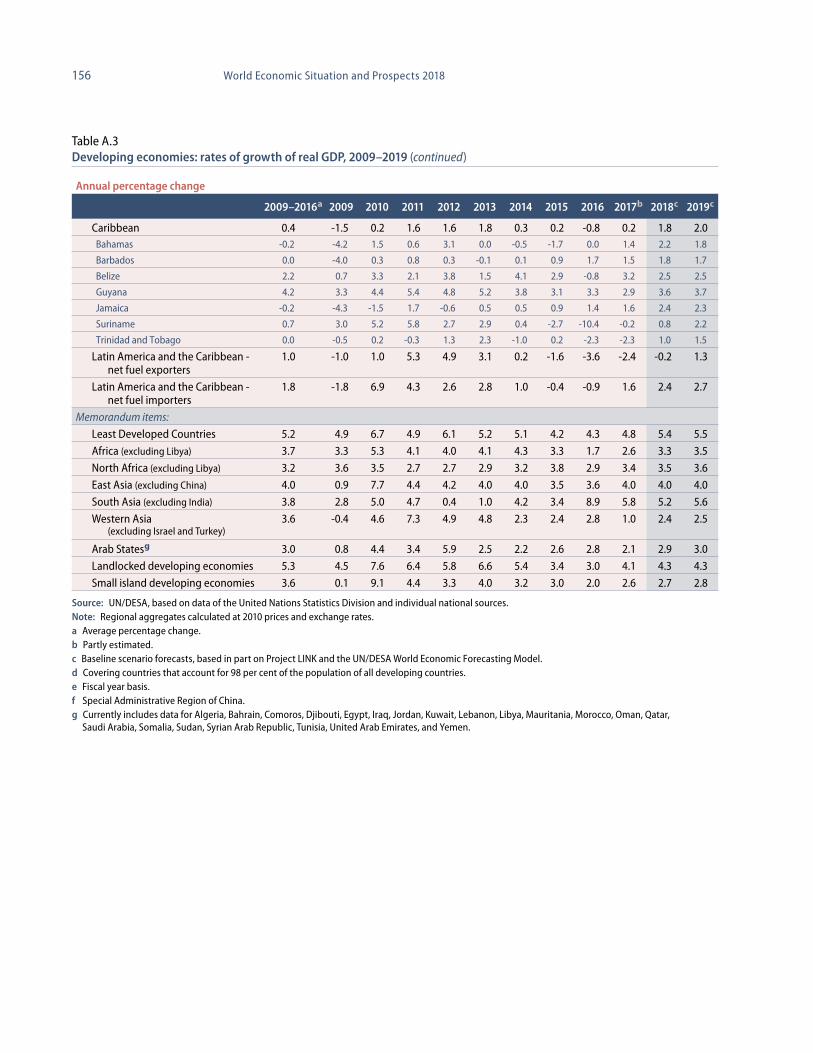
156 World Economic Situation and Prospects 2018
Annual percentage change
2009–2016a 2009 2010 2011 2012 2013 2014 2015 2016 2017b 2018c 2019c
Caribbean 0.4 -1.5 0.2 1.6 1.6 1.8 0.3 0.2 -0.8 0.2 1.8 2.0 Bahamas -0.2 -4.2 1.5 0.6 3.1 0.0 -0.5 -1.7 0.0 1.4 2.2 1.8
Barbados 0.0 -4.0 0.3 0.8 0.3 -0.1 0.1 0.9 1.7 1.5 1.8 1.7
Belize 2.2 0.7 3.3 2.1 3.8 1.5 4.1 2.9 -0.8 3.2 2.5 2.5
Guyana 4.2 3.3 4.4 5.4 4.8 5.2 3.8 3.1 3.3 2.9 3.6 3.7
Jamaica -0.2 -4.3 -1.5 1.7 -0.6 0.5 0.5 0.9 1.4 1.6 2.4 2.3
Suriname 0.7 3.0 5.2 5.8 2.7 2.9 0.4 -2.7 -10.4 -0.2 0.8 2.2
Trinidad and Tobago 0.0 -0.5 0.2 -0.3 1.3 2.3 -1.0 0.2 -2.3 -2.3 1.0 1.5
Latin America and the Caribbean - net fuel exporters
1.0 -1.0 1.0 5.3 4.9 3.1 0.2 -1.6 -3.6 -2.4 -0.2 1.3
Latin America and the Caribbean - net fuel importers
1.8 -1.8 6.9 4.3 2.6 2.8 1.0 -0.4 -0.9 1.6 2.4 2.7
Memorandum items:
Least Developed Countries 5.2 4.9 6.7 4.9 6.1 5.2 5.1 4.2 4.3 4.8 5.4 5.5
Africa (excluding Libya) 3.7 3.3 5.3 4.1 4.0 4.1 4.3 3.3 1.7 2.6 3.3 3.5
North Africa (excluding Libya) 3.2 3.6 3.5 2.7 2.7 2.9 3.2 3.8 2.9 3.4 3.5 3.6
East Asia (excluding China) 4.0 0.9 7.7 4.4 4.2 4.0 4.0 3.5 3.6 4.0 4.0 4.0
South Asia (excluding India) 3.8 2.8 5.0 4.7 0.4 1.0 4.2 3.4 8.9 5.8 5.2 5.6
Western Asia (excluding Israel and Turkey)
3.6 -0.4 4.6 7.3 4.9 4.8 2.3 2.4 2.8 1.0 2.4 2.5
Arab Statesg 3.0 0.8 4.4 3.4 5.9 2.5 2.2 2.6 2.8 2.1 2.9 3.0
Landlocked developing economies 5.3 4.5 7.6 6.4 5.8 6.6 5.4 3.4 3.0 4.1 4.3 4.3
Small island developing economies 3.6 0.1 9.1 4.4 3.3 4.0 3.2 3.0 2.0 2.6 2.7 2.8
Source: UN/DESA, based on data of the United Nations Statistics Division and individual national sources.Note: Regional aggregates calculated at 2010 prices and exchange rates.a Average percentage change.b Partly estimated.c Baseline scenario forecasts, based in part on Project LINK and the UN/DESA World Economic Forecasting Model.d Covering countries that account for 98 per cent of the population of all developing countries.e Fiscal year basis.f Special Administrative Region of China.g Currently includes data for Algeria, Bahrain, Comoros, Djibouti, Egypt, Iraq, Jordan, Kuwait, Lebanon, Libya, Mauritania, Morocco, Oman, Qatar, Saudi Arabia, Somalia, Sudan, Syrian Arab Republic, Tunisia, United Arab Emirates, and Yemen.
Table A.3Developing economies: rates of growth of real GDP, 2009–2019 (continued)

157Annex tables
Table A.4Developed economies: consumer price inflation, 2009–2019
Annual percentage changea
2009 2010 2011 2012 2013 2014 2015 2016 2017b 2018c 2019c
Developed economies 0.1 1.5 2.6 1.9 1.3 1.4 0.2 0.7 1.5 1.9 2.1 United States -0.3 1.6 3.2 2.0 1.4 1.7 0.1 1.3 1.7 2.1 2.1 Canada 0.3 1.8 2.9 1.5 0.9 1.9 1.1 1.4 1.5 2.1 2.0 Japan -1.4 -0.7 -0.3 -0.1 0.4 2.8 0.8 -0.1 0.3 1.4 1.8 Australia 1.8 2.9 3.3 1.8 2.5 2.5 1.5 1.3 1.7 2.3 2.0 New Zealand 2.1 2.3 4.0 1.1 1.1 1.2 0.3 0.6 1.8 2.0 2.5 European Union 0.9 1.9 3.0 2.6 1.5 0.6 0.0 0.3 1.6 1.8 2.1 EU-15 0.7 1.9 2.9 2.5 1.5 0.6 0.1 0.3 1.6 1.8 2.1
Austria 0.5 1.8 3.3 2.5 2.0 1.6 0.9 0.9 2.1 1.8 2.2 Belgium 0.0 2.3 3.4 2.6 1.2 0.5 0.6 1.8 2.1 2.2 2.3 Denmark 1.0 2.2 2.7 2.4 0.5 0.4 0.2 0.0 1.1 2.0 2.3 Finland 1.6 1.7 3.3 3.2 2.2 1.2 -0.2 0.4 0.8 1.9 2.3 France 0.1 1.7 2.3 2.2 1.0 0.6 0.1 0.3 1.0 1.5 2.0 Germany 0.2 1.2 2.5 2.1 1.6 0.8 0.1 0.4 1.6 1.8 2.2 Greece 1.3 4.7 3.1 1.0 -0.9 -1.4 -1.1 0.0 1.3 1.4 2.3 Ireland -1.7 -1.6 1.2 1.8 0.5 0.3 0.0 -0.2 0.3 1.8 2.2 Italy 0.8 1.6 2.9 3.2 1.3 0.2 0.1 -0.1 1.4 1.2 1.4 Luxembourg 0.0 2.8 3.7 2.9 1.7 0.7 0.1 0.0 1.7 1.8 2.7 Netherlands 1.0 0.9 2.5 2.8 2.6 0.3 0.2 0.1 1.4 1.7 2.0 Portugal -0.9 1.4 3.6 2.8 0.4 -0.1 0.5 0.6 1.3 1.9 2.2 Spain -0.2 2.1 3.0 2.4 1.5 -0.2 -0.6 -0.3 1.6 1.6 1.8 Sweden 1.9 1.9 1.4 0.9 0.4 0.2 0.7 1.1 1.6 2.0 2.2 United Kingdom 2.2 3.2 4.5 2.9 2.5 1.5 0.0 0.7 2.8 2.7 2.9
EU-13 3.1 2.7 3.8 3.7 1.5 0.2 -0.4 -0.2 1.9 2.2 2.4 Bulgaria 2.8 2.4 4.2 3.0 0.9 -1.4 -0.1 -0.8 2.0 2.5 2.3 Croatia 2.4 1.0 2.3 3.4 2.2 -0.2 -0.5 -1.1 1.0 1.5 2.3 Cyprus 0.4 2.4 3.3 2.4 -0.4 -1.4 -2.1 -1.4 0.8 1.6 2.0 Czech Republic 0.5 1.2 2.2 3.6 1.3 0.5 0.2 0.7 2.3 2.1 2.1 Estonia 0.2 2.7 5.1 4.2 3.2 0.5 0.1 0.8 3.1 2.8 2.6 Hungary 4.0 4.7 3.9 5.7 1.7 0.0 0.1 0.4 2.7 2.7 2.8 Latvia 3.5 -1.1 4.4 2.3 0.0 0.6 0.2 0.1 3.0 2.4 2.8 Lithuania 4.5 1.3 4.1 3.1 1.0 0.1 -0.9 0.9 3.2 2.6 2.9 Malta 2.1 1.5 2.7 2.4 1.4 0.3 1.1 0.6 1.7 2.9 2.8 Poland 4.0 2.7 3.9 3.6 0.8 0.1 -0.7 -0.2 2.0 2.3 2.7 Romania 5.6 6.1 5.8 3.3 4.0 1.1 -0.6 -1.5 1.0 1.7 2.1 Slovakia 0.9 0.7 4.1 3.7 1.5 -0.1 -0.3 -0.5 1.3 1.9 2.1 Slovenia 0.9 2.1 2.1 2.8 1.9 0.4 -0.8 -0.2 2.0 2.5 2.1
Other European countries 0.7 1.4 0.6 -0.2 0.9 0.8 0.4 1.3 1.2 1.4 1.4 Iceland 16.3 7.5 4.2 6.0 4.1 1.0 0.3 0.8 1.8 3.2 3.2 Norway 2.3 2.3 1.3 0.3 2.0 1.9 2.0 3.9 2.1 2.1 1.5 Switzerland -0.7 0.6 0.1 -0.7 0.1 0.0 -0.8 -0.5 0.4 0.8 1.3 Memorandum items:North America -0.2 1.6 3.2 2.0 1.4 1.7 0.2 1.3 1.7 2.1 2.1 Developed Asia and Pacific -0.7 0.0 0.4 0.3 0.7 2.7 0.9 0.1 0.6 1.6 1.9 Europe 0.8 1.9 2.8 2.4 1.5 0.6 0.0 0.4 1.6 1.8 2.1 Major developed economies -0.1 1.3 2.5 1.8 1.3 1.6 0.3 0.7 1.4 1.9 2.1 Euro area 0.3 1.6 2.7 2.5 1.4 0.4 0.0 0.2 1.4 1.6 2.0
Sources: UN/DESA, based on OECD Main Economic Indicators; Eurostat; and individual national sources.a Data for country groups are weighted averages, where weights for each year are based on 2010 GDP in United States dollars.b Partly estimated.c Baseline scenario forecasts, based in part on Project LINK and the UN/DESA World Economic Forecasting Model.
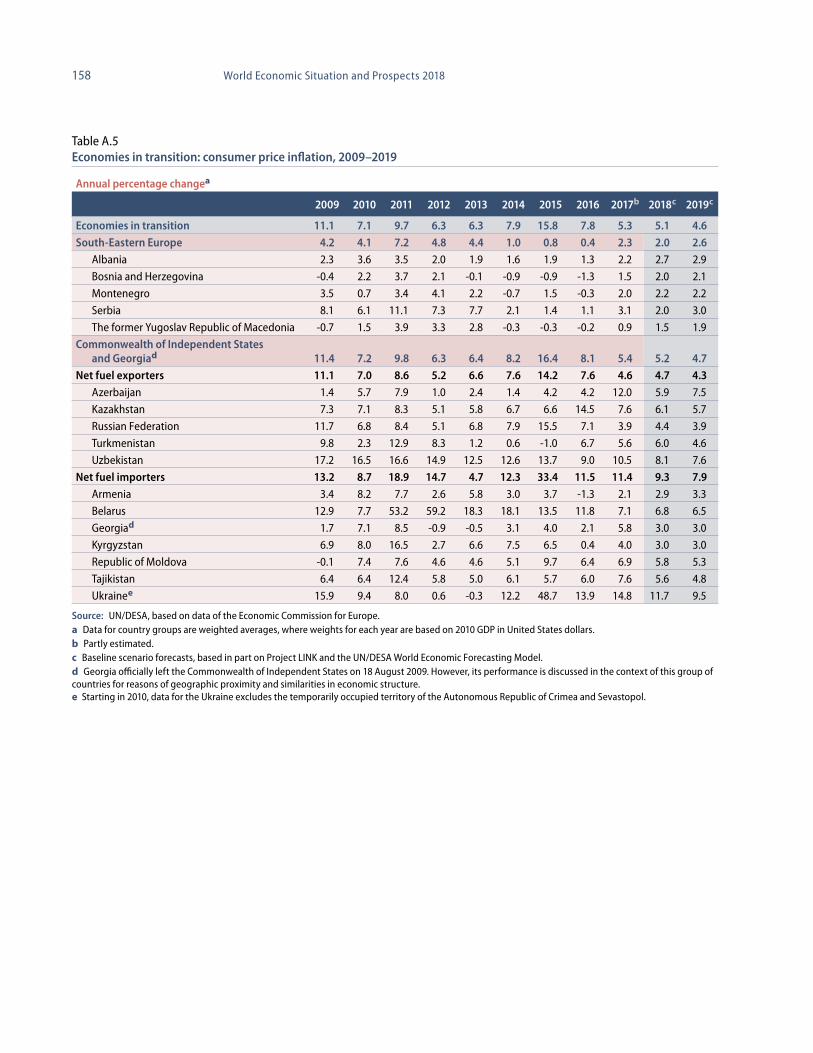
158 World Economic Situation and Prospects 2018
Table A.5Economies in transition: consumer price inflation, 2009–2019
Annual percentage changea
2009 2010 2011 2012 2013 2014 2015 2016 2017b 2018c 2019c
Economies in transition 11.1 7.1 9.7 6.3 6.3 7.9 15.8 7.8 5.3 5.1 4.6 South-Eastern Europe 4.2 4.1 7.2 4.8 4.4 1.0 0.8 0.4 2.3 2.0 2.6
Albania 2.3 3.6 3.5 2.0 1.9 1.6 1.9 1.3 2.2 2.7 2.9
Bosnia and Herzegovina -0.4 2.2 3.7 2.1 -0.1 -0.9 -0.9 -1.3 1.5 2.0 2.1
Montenegro 3.5 0.7 3.4 4.1 2.2 -0.7 1.5 -0.3 2.0 2.2 2.2
Serbia 8.1 6.1 11.1 7.3 7.7 2.1 1.4 1.1 3.1 2.0 3.0
The former Yugoslav Republic of Macedonia -0.7 1.5 3.9 3.3 2.8 -0.3 -0.3 -0.2 0.9 1.5 1.9
Commonwealth of Independent States and Georgiad 11.4 7.2 9.8 6.3 6.4 8.2 16.4 8.1 5.4 5.2 4.7
Net fuel exporters 11.1 7.0 8.6 5.2 6.6 7.6 14.2 7.6 4.6 4.7 4.3 Azerbaijan 1.4 5.7 7.9 1.0 2.4 1.4 4.2 4.2 12.0 5.9 7.5
Kazakhstan 7.3 7.1 8.3 5.1 5.8 6.7 6.6 14.5 7.6 6.1 5.7
Russian Federation 11.7 6.8 8.4 5.1 6.8 7.9 15.5 7.1 3.9 4.4 3.9
Turkmenistan 9.8 2.3 12.9 8.3 1.2 0.6 -1.0 6.7 5.6 6.0 4.6
Uzbekistan 17.2 16.5 16.6 14.9 12.5 12.6 13.7 9.0 10.5 8.1 7.6
Net fuel importers 13.2 8.7 18.9 14.7 4.7 12.3 33.4 11.5 11.4 9.3 7.9 Armenia 3.4 8.2 7.7 2.6 5.8 3.0 3.7 -1.3 2.1 2.9 3.3
Belarus 12.9 7.7 53.2 59.2 18.3 18.1 13.5 11.8 7.1 6.8 6.5
Georgiad 1.7 7.1 8.5 -0.9 -0.5 3.1 4.0 2.1 5.8 3.0 3.0
Kyrgyzstan 6.9 8.0 16.5 2.7 6.6 7.5 6.5 0.4 4.0 3.0 3.0
Republic of Moldova -0.1 7.4 7.6 4.6 4.6 5.1 9.7 6.4 6.9 5.8 5.3
Tajikistan 6.4 6.4 12.4 5.8 5.0 6.1 5.7 6.0 7.6 5.6 4.8
Ukrainee 15.9 9.4 8.0 0.6 -0.3 12.2 48.7 13.9 14.8 11.7 9.5
Source: UN/DESA, based on data of the Economic Commission for Europe.a Data for country groups are weighted averages, where weights for each year are based on 2010 GDP in United States dollars.b Partly estimated.c Baseline scenario forecasts, based in part on Project LINK and the UN/DESA World Economic Forecasting Model.d Georgia officially left the Commonwealth of Independent States on 18 August 2009. However, its performance is discussed in the context of this group of countries for reasons of geographic proximity and similarities in economic structure. e Starting in 2010, data for the Ukraine excludes the temporarily occupied territory of the Autonomous Republic of Crimea and Sevastopol.
159Annex tables
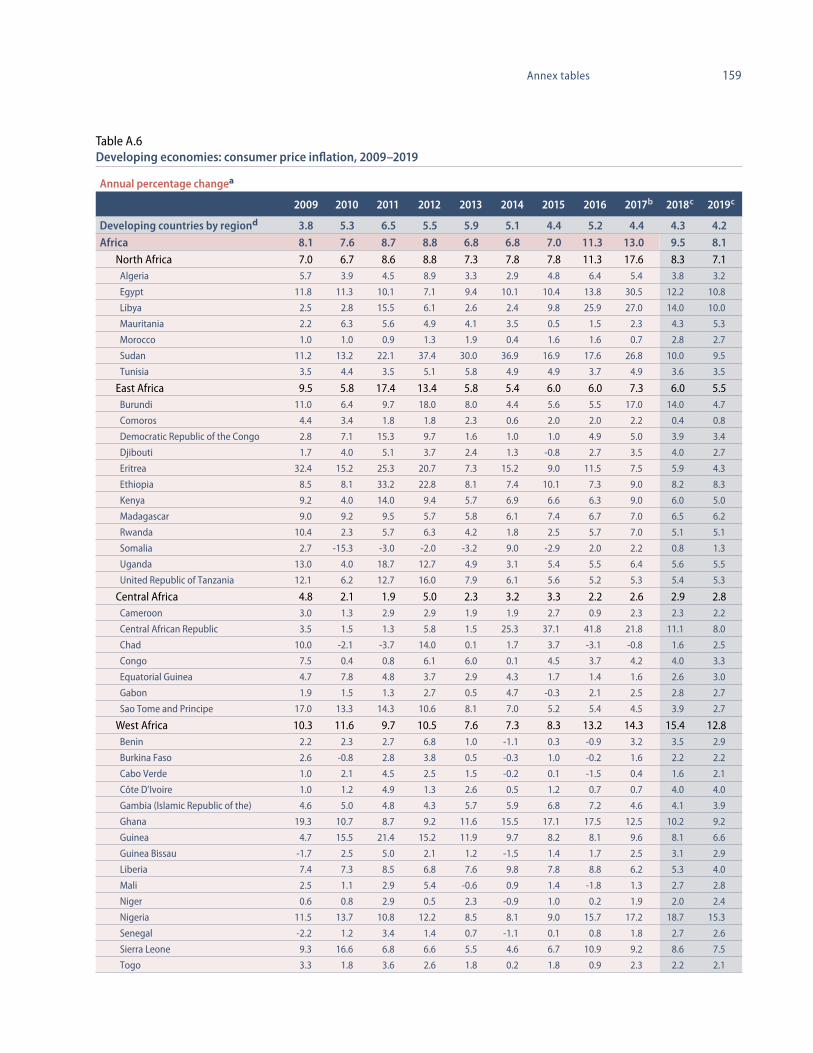
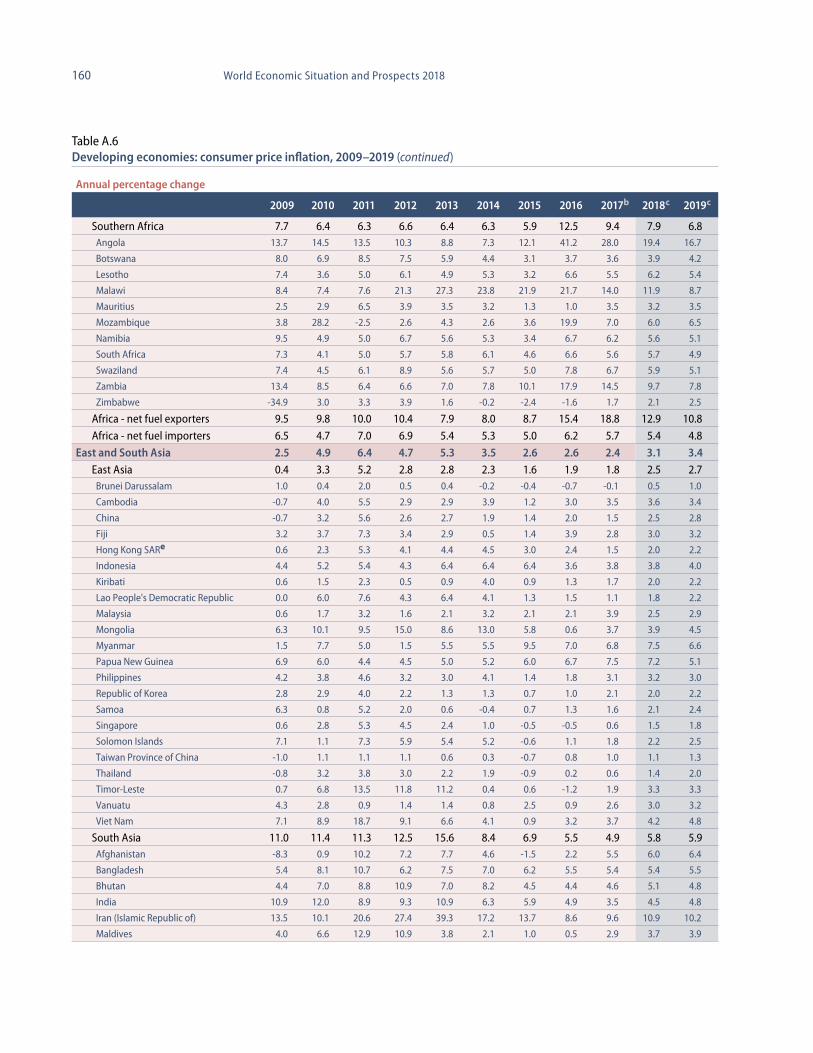
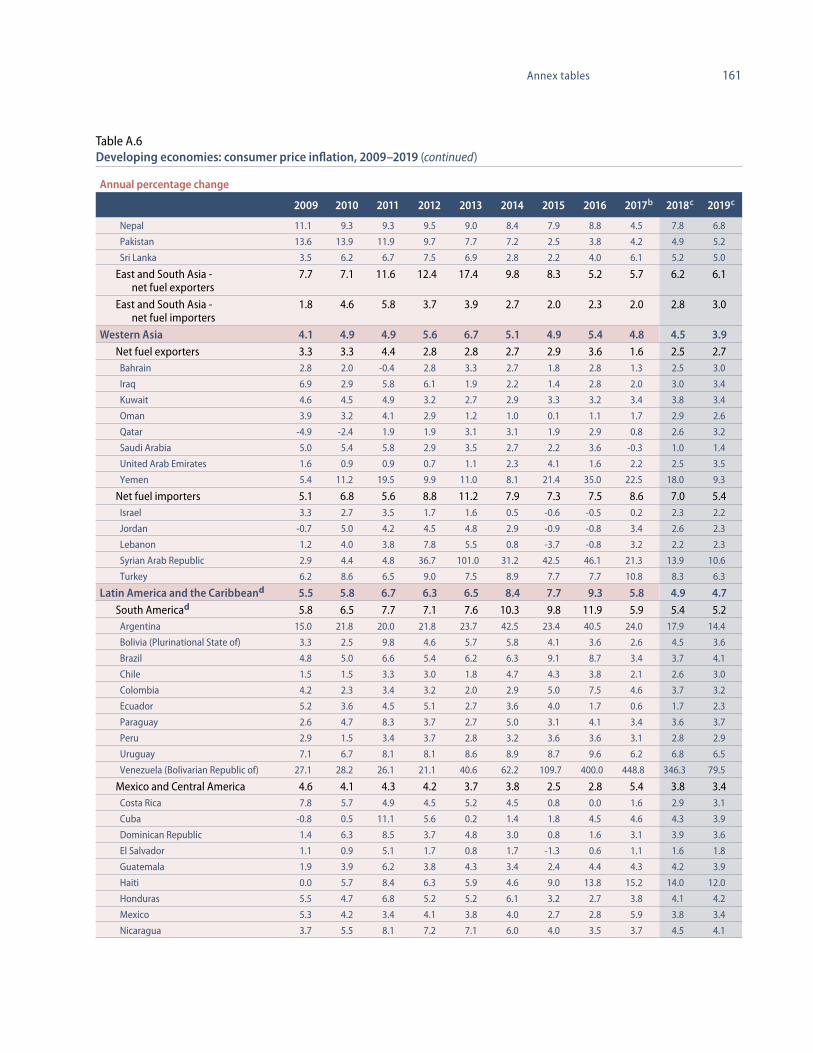
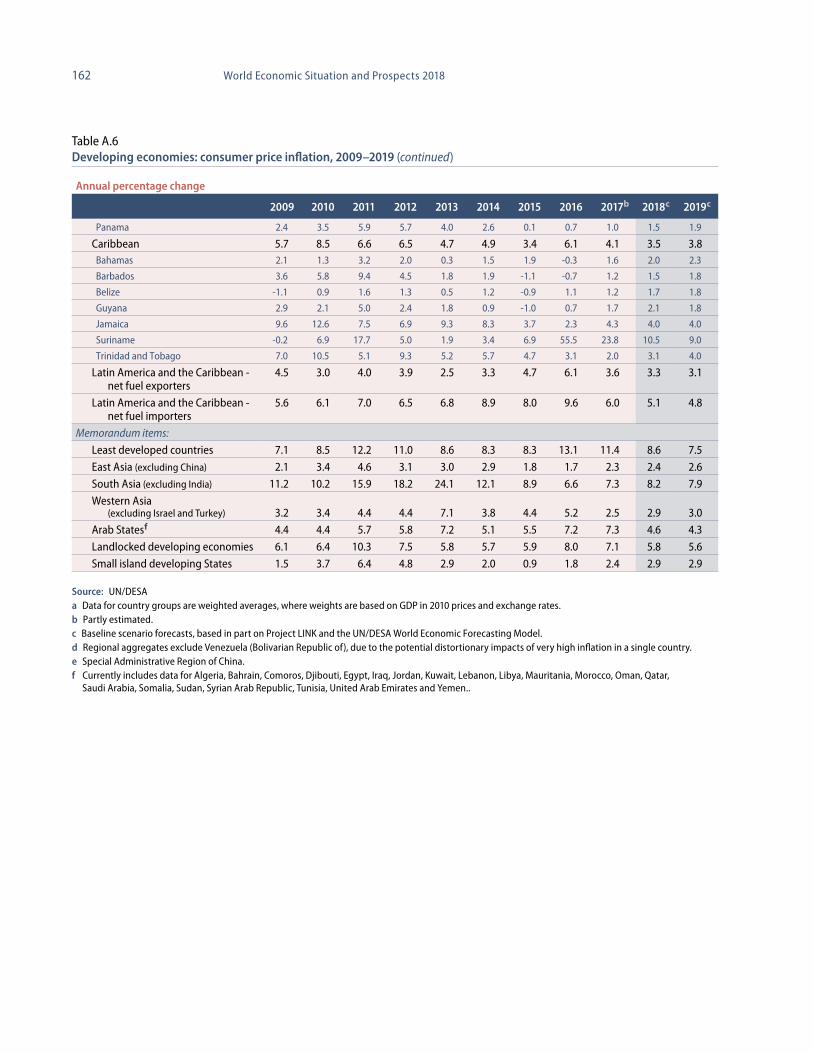
Table A.6Developing economies: consumer price inflation, 2009–2019
Annual percentage changea
2009 2010 2011 2012 2013 2014 2015 2016 2017b 2018c 2019c
Developing countries by regiond 3.8 5.3 6.5 5.5 5.9 5.1 4.4 5.2 4.4 4.3 4.2Africa 8.1 7.6 8.7 8.8 6.8 6.8 7.0 11.3 13.0 9.5 8.1
North Africa 7.0 6.7 8.6 8.8 7.3 7.8 7.8 11.3 17.6 8.3 7.1 Algeria 5.7 3.9 4.5 8.9 3.3 2.9 4.8 6.4 5.4 3.8 3.2
Egypt 11.8 11.3 10.1 7.1 9.4 10.1 10.4 13.8 30.5 12.2 10.8
Libya 2.5 2.8 15.5 6.1 2.6 2.4 9.8 25.9 27.0 14.0 10.0
Mauritania 2.2 6.3 5.6 4.9 4.1 3.5 0.5 1.5 2.3 4.3 5.3
Morocco 1.0 1.0 0.9 1.3 1.9 0.4 1.6 1.6 0.7 2.8 2.7
Sudan 11.2 13.2 22.1 37.4 30.0 36.9 16.9 17.6 26.8 10.0 9.5
Tunisia 3.5 4.4 3.5 5.1 5.8 4.9 4.9 3.7 4.9 3.6 3.5
East Africa 9.5 5.8 17.4 13.4 5.8 5.4 6.0 6.0 7.3 6.0 5.5 Burundi 11.0 6.4 9.7 18.0 8.0 4.4 5.6 5.5 17.0 14.0 4.7
Comoros 4.4 3.4 1.8 1.8 2.3 0.6 2.0 2.0 2.2 0.4 0.8
Democratic Republic of the Congo 2.8 7.1 15.3 9.7 1.6 1.0 1.0 4.9 5.0 3.9 3.4
Djibouti 1.7 4.0 5.1 3.7 2.4 1.3 -0.8 2.7 3.5 4.0 2.7
Eritrea 32.4 15.2 25.3 20.7 7.3 15.2 9.0 11.5 7.5 5.9 4.3
Ethiopia 8.5 8.1 33.2 22.8 8.1 7.4 10.1 7.3 9.0 8.2 8.3
Kenya 9.2 4.0 14.0 9.4 5.7 6.9 6.6 6.3 9.0 6.0 5.0
Madagascar 9.0 9.2 9.5 5.7 5.8 6.1 7.4 6.7 7.0 6.5 6.2
Rwanda 10.4 2.3 5.7 6.3 4.2 1.8 2.5 5.7 7.0 5.1 5.1
Somalia 2.7 -15.3 -3.0 -2.0 -3.2 9.0 -2.9 2.0 2.2 0.8 1.3
Uganda 13.0 4.0 18.7 12.7 4.9 3.1 5.4 5.5 6.4 5.6 5.5
United Republic of Tanzania 12.1 6.2 12.7 16.0 7.9 6.1 5.6 5.2 5.3 5.4 5.3
Central Africa 4.8 2.1 1.9 5.0 2.3 3.2 3.3 2.2 2.6 2.9 2.8 Cameroon 3.0 1.3 2.9 2.9 1.9 1.9 2.7 0.9 2.3 2.3 2.2
Central African Republic 3.5 1.5 1.3 5.8 1.5 25.3 37.1 41.8 21.8 11.1 8.0
Chad 10.0 -2.1 -3.7 14.0 0.1 1.7 3.7 -3.1 -0.8 1.6 2.5
Congo 7.5 0.4 0.8 6.1 6.0 0.1 4.5 3.7 4.2 4.0 3.3
Equatorial Guinea 4.7 7.8 4.8 3.7 2.9 4.3 1.7 1.4 1.6 2.6 3.0
Gabon 1.9 1.5 1.3 2.7 0.5 4.7 -0.3 2.1 2.5 2.8 2.7
Sao Tome and Principe 17.0 13.3 14.3 10.6 8.1 7.0 5.2 5.4 4.5 3.9 2.7
West Africa 10.3 11.6 9.7 10.5 7.6 7.3 8.3 13.2 14.3 15.4 12.8 Benin 2.2 2.3 2.7 6.8 1.0 -1.1 0.3 -0.9 3.2 3.5 2.9
Burkina Faso 2.6 -0.8 2.8 3.8 0.5 -0.3 1.0 -0.2 1.6 2.2 2.2
Cabo Verde 1.0 2.1 4.5 2.5 1.5 -0.2 0.1 -1.5 0.4 1.6 2.1
Côte D’Ivoire 1.0 1.2 4.9 1.3 2.6 0.5 1.2 0.7 0.7 4.0 4.0
Gambia (Islamic Republic of the) 4.6 5.0 4.8 4.3 5.7 5.9 6.8 7.2 4.6 4.1 3.9
Ghana 19.3 10.7 8.7 9.2 11.6 15.5 17.1 17.5 12.5 10.2 9.2
Guinea 4.7 15.5 21.4 15.2 11.9 9.7 8.2 8.1 9.6 8.1 6.6
Guinea Bissau -1.7 2.5 5.0 2.1 1.2 -1.5 1.4 1.7 2.5 3.1 2.9
Liberia 7.4 7.3 8.5 6.8 7.6 9.8 7.8 8.8 6.2 5.3 4.0
Mali 2.5 1.1 2.9 5.4 -0.6 0.9 1.4 -1.8 1.3 2.7 2.8
Niger 0.6 0.8 2.9 0.5 2.3 -0.9 1.0 0.2 1.9 2.0 2.4
Nigeria 11.5 13.7 10.8 12.2 8.5 8.1 9.0 15.7 17.2 18.7 15.3
Senegal -2.2 1.2 3.4 1.4 0.7 -1.1 0.1 0.8 1.8 2.7 2.6
Sierra Leone 9.3 16.6 6.8 6.6 5.5 4.6 6.7 10.9 9.2 8.6 7.5
Togo 3.3 1.8 3.6 2.6 1.8 0.2 1.8 0.9 2.3 2.2 2.1
160 World Economic Situation and Prospects 2018
Annual percentage change
2009 2010 2011 2012 2013 2014 2015 2016 2017b 2018c 2019c
Southern Africa 7.7 6.4 6.3 6.6 6.4 6.3 5.9 12.5 9.4 7.9 6.8 Angola 13.7 14.5 13.5 10.3 8.8 7.3 12.1 41.2 28.0 19.4 16.7
Botswana 8.0 6.9 8.5 7.5 5.9 4.4 3.1 3.7 3.6 3.9 4.2
Lesotho 7.4 3.6 5.0 6.1 4.9 5.3 3.2 6.6 5.5 6.2 5.4
Malawi 8.4 7.4 7.6 21.3 27.3 23.8 21.9 21.7 14.0 11.9 8.7
Mauritius 2.5 2.9 6.5 3.9 3.5 3.2 1.3 1.0 3.5 3.2 3.5
Mozambique 3.8 28.2 -2.5 2.6 4.3 2.6 3.6 19.9 7.0 6.0 6.5
Namibia 9.5 4.9 5.0 6.7 5.6 5.3 3.4 6.7 6.2 5.6 5.1
South Africa 7.3 4.1 5.0 5.7 5.8 6.1 4.6 6.6 5.6 5.7 4.9
Swaziland 7.4 4.5 6.1 8.9 5.6 5.7 5.0 7.8 6.7 5.9 5.1
Zambia 13.4 8.5 6.4 6.6 7.0 7.8 10.1 17.9 14.5 9.7 7.8
Zimbabwe -34.9 3.0 3.3 3.9 1.6 -0.2 -2.4 -1.6 1.7 2.1 2.5
Africa - net fuel exporters 9.5 9.8 10.0 10.4 7.9 8.0 8.7 15.4 18.8 12.9 10.8
Africa - net fuel importers 6.5 4.7 7.0 6.9 5.4 5.3 5.0 6.2 5.7 5.4 4.8
East and South Asia 2.5 4.9 6.4 4.7 5.3 3.5 2.6 2.6 2.4 3.1 3.4East Asia 0.4 3.3 5.2 2.8 2.8 2.3 1.6 1.9 1.8 2.5 2.7 Brunei Darussalam 1.0 0.4 2.0 0.5 0.4 -0.2 -0.4 -0.7 -0.1 0.5 1.0
Cambodia -0.7 4.0 5.5 2.9 2.9 3.9 1.2 3.0 3.5 3.6 3.4
China -0.7 3.2 5.6 2.6 2.7 1.9 1.4 2.0 1.5 2.5 2.8
Fiji 3.2 3.7 7.3 3.4 2.9 0.5 1.4 3.9 2.8 3.0 3.2
Hong Kong SARe 0.6 2.3 5.3 4.1 4.4 4.5 3.0 2.4 1.5 2.0 2.2
Indonesia 4.4 5.2 5.4 4.3 6.4 6.4 6.4 3.6 3.8 3.8 4.0
Kiribati 0.6 1.5 2.3 0.5 0.9 4.0 0.9 1.3 1.7 2.0 2.2
Lao People's Democratic Republic 0.0 6.0 7.6 4.3 6.4 4.1 1.3 1.5 1.1 1.8 2.2
Malaysia 0.6 1.7 3.2 1.6 2.1 3.2 2.1 2.1 3.9 2.5 2.9
Mongolia 6.3 10.1 9.5 15.0 8.6 13.0 5.8 0.6 3.7 3.9 4.5
Myanmar 1.5 7.7 5.0 1.5 5.5 5.5 9.5 7.0 6.8 7.5 6.6
Papua New Guinea 6.9 6.0 4.4 4.5 5.0 5.2 6.0 6.7 7.5 7.2 5.1
Philippines 4.2 3.8 4.6 3.2 3.0 4.1 1.4 1.8 3.1 3.2 3.0
Republic of Korea 2.8 2.9 4.0 2.2 1.3 1.3 0.7 1.0 2.1 2.0 2.2
Samoa 6.3 0.8 5.2 2.0 0.6 -0.4 0.7 1.3 1.6 2.1 2.4
Singapore 0.6 2.8 5.3 4.5 2.4 1.0 -0.5 -0.5 0.6 1.5 1.8
Solomon Islands 7.1 1.1 7.3 5.9 5.4 5.2 -0.6 1.1 1.8 2.2 2.5
Taiwan Province of China -1.0 1.1 1.1 1.1 0.6 0.3 -0.7 0.8 1.0 1.1 1.3
Thailand -0.8 3.2 3.8 3.0 2.2 1.9 -0.9 0.2 0.6 1.4 2.0
Timor-Leste 0.7 6.8 13.5 11.8 11.2 0.4 0.6 -1.2 1.9 3.3 3.3
Vanuatu 4.3 2.8 0.9 1.4 1.4 0.8 2.5 0.9 2.6 3.0 3.2
Viet Nam 7.1 8.9 18.7 9.1 6.6 4.1 0.9 3.2 3.7 4.2 4.8
South Asia 11.0 11.4 11.3 12.5 15.6 8.4 6.9 5.5 4.9 5.8 5.9 Afghanistan -8.3 0.9 10.2 7.2 7.7 4.6 -1.5 2.2 5.5 6.0 6.4
Bangladesh 5.4 8.1 10.7 6.2 7.5 7.0 6.2 5.5 5.4 5.4 5.5
Bhutan 4.4 7.0 8.8 10.9 7.0 8.2 4.5 4.4 4.6 5.1 4.8
India 10.9 12.0 8.9 9.3 10.9 6.3 5.9 4.9 3.5 4.5 4.8
Iran (Islamic Republic of) 13.5 10.1 20.6 27.4 39.3 17.2 13.7 8.6 9.6 10.9 10.2
Maldives 4.0 6.6 12.9 10.9 3.8 2.1 1.0 0.5 2.9 3.7 3.9
Table A.6Developing economies: consumer price inflation, 2009–2019 (continued)
161Annex tables
Table A.6Developing economies: consumer price inflation, 2009–2019 (continued)
Annual percentage change
2009 2010 2011 2012 2013 2014 2015 2016 2017b 2018c 2019c
Nepal 11.1 9.3 9.3 9.5 9.0 8.4 7.9 8.8 4.5 7.8 6.8
Pakistan 13.6 13.9 11.9 9.7 7.7 7.2 2.5 3.8 4.2 4.9 5.2
Sri Lanka 3.5 6.2 6.7 7.5 6.9 2.8 2.2 4.0 6.1 5.2 5.0
East and South Asia - net fuel exporters
7.7 7.1 11.6 12.4 17.4 9.8 8.3 5.2 5.7 6.2 6.1
East and South Asia - net fuel importers
1.8 4.6 5.8 3.7 3.9 2.7 2.0 2.3 2.0 2.8 3.0
Western Asia 4.1 4.9 4.9 5.6 6.7 5.1 4.9 5.4 4.8 4.5 3.9Net fuel exporters 3.3 3.3 4.4 2.8 2.8 2.7 2.9 3.6 1.6 2.5 2.7 Bahrain 2.8 2.0 -0.4 2.8 3.3 2.7 1.8 2.8 1.3 2.5 3.0
Iraq 6.9 2.9 5.8 6.1 1.9 2.2 1.4 2.8 2.0 3.0 3.4
Kuwait 4.6 4.5 4.9 3.2 2.7 2.9 3.3 3.2 3.4 3.8 3.4
Oman 3.9 3.2 4.1 2.9 1.2 1.0 0.1 1.1 1.7 2.9 2.6
Qatar -4.9 -2.4 1.9 1.9 3.1 3.1 1.9 2.9 0.8 2.6 3.2
Saudi Arabia 5.0 5.4 5.8 2.9 3.5 2.7 2.2 3.6 -0.3 1.0 1.4
United Arab Emirates 1.6 0.9 0.9 0.7 1.1 2.3 4.1 1.6 2.2 2.5 3.5
Yemen 5.4 11.2 19.5 9.9 11.0 8.1 21.4 35.0 22.5 18.0 9.3
Net fuel importers 5.1 6.8 5.6 8.8 11.2 7.9 7.3 7.5 8.6 7.0 5.4 Israel 3.3 2.7 3.5 1.7 1.6 0.5 -0.6 -0.5 0.2 2.3 2.2
Jordan -0.7 5.0 4.2 4.5 4.8 2.9 -0.9 -0.8 3.4 2.6 2.3
Lebanon 1.2 4.0 3.8 7.8 5.5 0.8 -3.7 -0.8 3.2 2.2 2.3
Syrian Arab Republic 2.9 4.4 4.8 36.7 101.0 31.2 42.5 46.1 21.3 13.9 10.6
Turkey 6.2 8.6 6.5 9.0 7.5 8.9 7.7 7.7 10.8 8.3 6.3
Latin America and the Caribbeand 5.5 5.8 6.7 6.3 6.5 8.4 7.7 9.3 5.8 4.9 4.7South Americad 5.8 6.5 7.7 7.1 7.6 10.3 9.8 11.9 5.9 5.4 5.2 Argentina 15.0 21.8 20.0 21.8 23.7 42.5 23.4 40.5 24.0 17.9 14.4
Bolivia (Plurinational State of) 3.3 2.5 9.8 4.6 5.7 5.8 4.1 3.6 2.6 4.5 3.6
Brazil 4.8 5.0 6.6 5.4 6.2 6.3 9.1 8.7 3.4 3.7 4.1
Chile 1.5 1.5 3.3 3.0 1.8 4.7 4.3 3.8 2.1 2.6 3.0
Colombia 4.2 2.3 3.4 3.2 2.0 2.9 5.0 7.5 4.6 3.7 3.2
Ecuador 5.2 3.6 4.5 5.1 2.7 3.6 4.0 1.7 0.6 1.7 2.3
Paraguay 2.6 4.7 8.3 3.7 2.7 5.0 3.1 4.1 3.4 3.6 3.7
Peru 2.9 1.5 3.4 3.7 2.8 3.2 3.6 3.6 3.1 2.8 2.9
Uruguay 7.1 6.7 8.1 8.1 8.6 8.9 8.7 9.6 6.2 6.8 6.5
Venezuela (Bolivarian Republic of) 27.1 28.2 26.1 21.1 40.6 62.2 109.7 400.0 448.8 346.3 79.5
Mexico and Central America 4.6 4.1 4.3 4.2 3.7 3.8 2.5 2.8 5.4 3.8 3.4 Costa Rica 7.8 5.7 4.9 4.5 5.2 4.5 0.8 0.0 1.6 2.9 3.1
Cuba -0.8 0.5 11.1 5.6 0.2 1.4 1.8 4.5 4.6 4.3 3.9
Dominican Republic 1.4 6.3 8.5 3.7 4.8 3.0 0.8 1.6 3.1 3.9 3.6
El Salvador 1.1 0.9 5.1 1.7 0.8 1.7 -1.3 0.6 1.1 1.6 1.8
Guatemala 1.9 3.9 6.2 3.8 4.3 3.4 2.4 4.4 4.3 4.2 3.9
Haiti 0.0 5.7 8.4 6.3 5.9 4.6 9.0 13.8 15.2 14.0 12.0
Honduras 5.5 4.7 6.8 5.2 5.2 6.1 3.2 2.7 3.8 4.1 4.2
Mexico 5.3 4.2 3.4 4.1 3.8 4.0 2.7 2.8 5.9 3.8 3.4
Nicaragua 3.7 5.5 8.1 7.2 7.1 6.0 4.0 3.5 3.7 4.5 4.1
162 World Economic Situation and Prospects 2018
Annual percentage change
2009 2010 2011 2012 2013 2014 2015 2016 2017b 2018c 2019c
Panama 2.4 3.5 5.9 5.7 4.0 2.6 0.1 0.7 1.0 1.5 1.9
Caribbean 5.7 8.5 6.6 6.5 4.7 4.9 3.4 6.1 4.1 3.5 3.8 Bahamas 2.1 1.3 3.2 2.0 0.3 1.5 1.9 -0.3 1.6 2.0 2.3
Barbados 3.6 5.8 9.4 4.5 1.8 1.9 -1.1 -0.7 1.2 1.5 1.8
Belize -1.1 0.9 1.6 1.3 0.5 1.2 -0.9 1.1 1.2 1.7 1.8
Guyana 2.9 2.1 5.0 2.4 1.8 0.9 -1.0 0.7 1.7 2.1 1.8
Jamaica 9.6 12.6 7.5 6.9 9.3 8.3 3.7 2.3 4.3 4.0 4.0
Suriname -0.2 6.9 17.7 5.0 1.9 3.4 6.9 55.5 23.8 10.5 9.0
Trinidad and Tobago 7.0 10.5 5.1 9.3 5.2 5.7 4.7 3.1 2.0 3.1 4.0
Latin America and the Caribbean - net fuel exporters
4.5 3.0 4.0 3.9 2.5 3.3 4.7 6.1 3.6 3.3 3.1
Latin America and the Caribbean - net fuel importers
5.6 6.1 7.0 6.5 6.8 8.9 8.0 9.6 6.0 5.1 4.8
Memorandum items:
Least developed countries 7.1 8.5 12.2 11.0 8.6 8.3 8.3 13.1 11.4 8.6 7.5
East Asia (excluding China) 2.1 3.4 4.6 3.1 3.0 2.9 1.8 1.7 2.3 2.4 2.6
South Asia (excluding India) 11.2 10.2 15.9 18.2 24.1 12.1 8.9 6.6 7.3 8.2 7.9
Western Asia (excluding Israel and Turkey) 3.2 3.4 4.4 4.4 7.1 3.8 4.4 5.2 2.5 2.9 3.0
Arab Statesf 4.4 4.4 5.7 5.8 7.2 5.1 5.5 7.2 7.3 4.6 4.3
Landlocked developing economies 6.1 6.4 10.3 7.5 5.8 5.7 5.9 8.0 7.1 5.8 5.6
Small island developing States 1.5 3.7 6.4 4.8 2.9 2.0 0.9 1.8 2.4 2.9 2.9
Source: UN/DESAa Data for country groups are weighted averages, where weights are based on GDP in 2010 prices and exchange rates.b Partly estimated.c Baseline scenario forecasts, based in part on Project LINK and the UN/DESA World Economic Forecasting Model.d Regional aggregates exclude Venezuela (Bolivarian Republic of), due to the potential distortionary impacts of very high inflation in a single country.e Special Administrative Region of China.f Currently includes data for Algeria, Bahrain, Comoros, Djibouti, Egypt, Iraq, Jordan, Kuwait, Lebanon, Libya, Mauritania, Morocco, Oman, Qatar, Saudi Arabia, Somalia, Sudan, Syrian Arab Republic, Tunisia, United Arab Emirates and Yemen..
Table A.6Developing economies: consumer price inflation, 2009–2019 (continued)

163Annex tables
Table A.7Developed economies: unemployment rates,a,b 2009–2019
Percentage of labour force
2009 2010 2011 2012 2013 2014 2015 2016 2017b 2018c 2019c
Developed economies 8.4 8.8 8.5 8.6 8.5 7.8 7.1 6.5 5.9 5.6 5.4United States 9.3 9.6 8.9 8.1 7.4 6.2 5.3 4.9 4.4 4.0 3.7Canada 8.4 8.0 7.5 7.3 7.1 6.9 6.9 7.0 6.4 6.0 5.8Japan 5.1 5.1 4.6 4.3 4.0 3.6 3.4 3.1 2.8 3.0 3.0Australia 5.6 5.2 5.1 5.2 5.7 6.1 6.1 5.7 5.7 5.4 5.2New Zealand 5.8 6.1 6.0 6.4 5.8 5.4 5.4 5.1 4.7 4.9 5.0European Union 9.0 9.6 9.7 10.5 10.9 10.2 9.4 8.6 7.7 7.4 7.2EU-15 9.1 9.5 9.6 10.6 11.1 10.5 9.8 9.0 8.2 8.0 7.7
Austria 5.3 4.8 4.6 4.9 5.4 5.6 5.7 6.0 5.6 5.6 5.6Belgium 7.9 8.3 7.1 7.5 8.5 8.5 8.5 7.9 7.3 7.2 7.1Denmark 6.0 7.5 7.6 7.5 7.0 6.5 6.2 6.2 5.8 5.4 5.0Finland 8.1 8.3 7.8 7.8 8.2 8.7 9.3 8.9 8.7 8.6 8.3France 9.1 9.3 9.2 9.8 10.3 10.3 10.4 10.0 9.6 9.5 9.2Germany 7.7 6.9 5.9 5.4 5.2 5.0 4.6 4.2 3.7 3.5 3.2Greece 9.6 12.7 17.9 24.5 27.5 26.6 25.0 23.6 21.4 20.9 20.5Ireland 12.1 13.9 14.7 14.7 13.1 11.3 9.5 7.9 6.3 6.9 6.9Italy 7.7 8.3 8.4 10.7 12.1 12.6 11.9 11.7 11.3 11.0 10.7Luxembourg 5.2 4.6 4.8 5.1 5.8 6.0 6.5 6.3 6.0 6.1 6.1Netherlands 4.4 5.0 5.0 5.8 7.3 7.4 6.9 6.0 4.9 4.7 4.5Portugal 10.7 12.0 12.9 15.8 16.4 14.1 12.6 11.2 9.1 8.9 8.8Spain 17.9 19.9 21.4 24.8 26.1 24.5 22.1 19.6 17.3 16.5 16.1Sweden 8.3 8.6 7.8 8.0 8.0 7.9 7.4 6.9 6.7 6.4 6.0United Kingdom 7.6 7.8 8.1 7.9 7.6 6.1 5.3 4.8 4.3 4.2 4.0
EU-13 8.4 9.9 9.8 10.0 10.1 9.0 7.9 6.6 5.4 5.1 4.8Bulgaria 6.9 10.3 11.3 12.3 12.9 11.5 9.1 7.6 6.2 5.9 5.7Croatia 9.3 11.8 13.7 15.8 17.4 17.2 16.1 13.3 11.0 10.6 10.2Cyprus 5.4 6.3 7.9 11.9 15.9 16.2 15.0 13.0 11.1 10.9 10.8Czech Republic 6.7 7.3 6.7 7.0 7.0 6.1 5.1 4.0 3.0 2.7 2.5Estonia 13.6 16.7 12.4 9.9 8.6 7.4 6.2 6.7 5.8 5.1 4.8Hungary 10.0 11.2 11.1 11.0 10.1 7.8 6.8 5.1 4.3 3.9 3.9Latvia 17.6 19.5 16.2 15.0 11.8 10.8 9.9 9.6 8.5 8.0 7.7Lithuania 13.8 17.8 15.4 13.4 11.8 10.7 9.2 7.9 7.6 7.2 6.9Malta 6.9 6.8 6.4 6.4 6.3 5.8 5.4 4.8 4.1 4.1 4.0Poland 8.1 9.6 9.7 10.2 10.4 9.0 7.5 6.2 4.9 4.6 4.4Romania 6.5 7.0 7.2 6.9 7.1 6.8 6.8 5.9 5.1 4.9 4.7Slovakia 12.1 14.5 13.7 14.0 14.2 13.2 11.5 9.7 7.9 7.0 6.6Slovenia 5.9 7.3 8.2 8.9 10.2 9.7 9.0 8.0 6.7 6.8 6.0
Other Europe 4.0 4.2 3.8 3.8 4.1 4.1 4.4 4.6 4.3 4.2 4.0Iceland 7.1 7.5 7.1 6.0 5.5 4.9 3.9 3.0 2.9 2.9 2.7Norway 3.2 3.6 3.3 3.2 3.5 3.5 4.4 4.7 4.2 4.1 4.0Switzerland 4.3 4.5 4.0 4.1 4.3 4.5 4.5 4.6 4.5 4.4 4.1Memorandum items:Major developed economies 8.0 8.1 7.6 7.3 7.1 6.4 5.8 5.5 5.1 4.7 4.4Euro area 9.6 10.2 10.2 11.4 12.0 11.6 10.9 10.0 9.1 8.8 8.6
Source: UN/DESA, based on data of the OECD and Eurostat.a Unemployment data are standardized by the OECD and Eurostat for comparability among countries and over time, in conformity with the definitions of the International Labour Organization (see OECD, Standardized Unemployment Rates: Sources and Methods (Paris, 1985)).b Data for country groups are weighted averages, where labour force is used for weights.c Partly estimated.d Baseline scenario forecasts, based in part on Project LINK and the UN/DESA World Economic Forecasting Model.
164 World Economic Situation and Prospects 2018
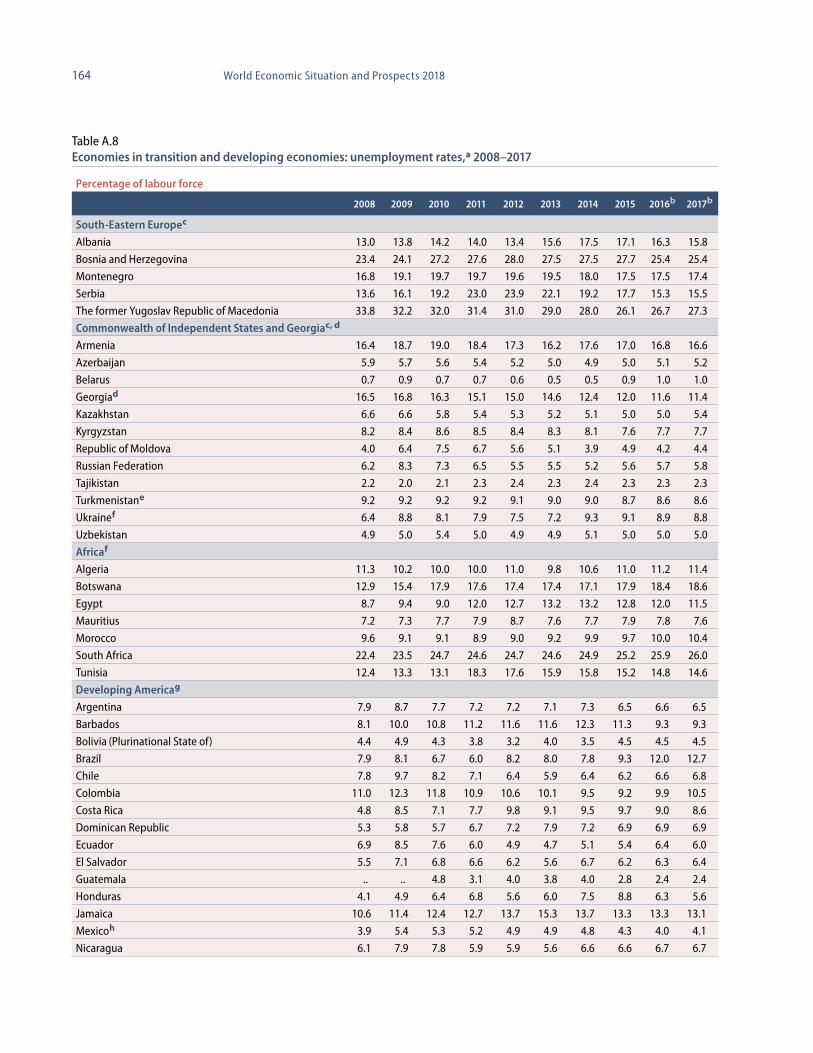
Table A.8Economies in transition and developing economies: unemployment rates,a 2008–2017
Percentage of labour force
2008 2009 2010 2011 2012 2013 2014 2015 2016b 2017b
South-Eastern Europec
Albania 13.0 13.8 14.2 14.0 13.4 15.6 17.5 17.1 16.3 15.8
Bosnia and Herzegovina 23.4 24.1 27.2 27.6 28.0 27.5 27.5 27.7 25.4 25.4
Montenegro 16.8 19.1 19.7 19.7 19.6 19.5 18.0 17.5 17.5 17.4
Serbia 13.6 16.1 19.2 23.0 23.9 22.1 19.2 17.7 15.3 15.5
The former Yugoslav Republic of Macedonia 33.8 32.2 32.0 31.4 31.0 29.0 28.0 26.1 26.7 27.3
Commonwealth of Independent States and Georgiac, d
Armenia 16.4 18.7 19.0 18.4 17.3 16.2 17.6 17.0 16.8 16.6
Azerbaijan 5.9 5.7 5.6 5.4 5.2 5.0 4.9 5.0 5.1 5.2
Belarus 0.7 0.9 0.7 0.7 0.6 0.5 0.5 0.9 1.0 1.0
Georgiad 16.5 16.8 16.3 15.1 15.0 14.6 12.4 12.0 11.6 11.4
Kazakhstan 6.6 6.6 5.8 5.4 5.3 5.2 5.1 5.0 5.0 5.4
Kyrgyzstan 8.2 8.4 8.6 8.5 8.4 8.3 8.1 7.6 7.7 7.7
Republic of Moldova 4.0 6.4 7.5 6.7 5.6 5.1 3.9 4.9 4.2 4.4
Russian Federation 6.2 8.3 7.3 6.5 5.5 5.5 5.2 5.6 5.7 5.8
Tajikistan 2.2 2.0 2.1 2.3 2.4 2.3 2.4 2.3 2.3 2.3
Turkmenistane 9.2 9.2 9.2 9.2 9.1 9.0 9.0 8.7 8.6 8.6
Ukrainef 6.4 8.8 8.1 7.9 7.5 7.2 9.3 9.1 8.9 8.8
Uzbekistan 4.9 5.0 5.4 5.0 4.9 4.9 5.1 5.0 5.0 5.0
Africaf
Algeria 11.3 10.2 10.0 10.0 11.0 9.8 10.6 11.0 11.2 11.4
Botswana 12.9 15.4 17.9 17.6 17.4 17.4 17.1 17.9 18.4 18.6
Egypt 8.7 9.4 9.0 12.0 12.7 13.2 13.2 12.8 12.0 11.5
Mauritius 7.2 7.3 7.7 7.9 8.7 7.6 7.7 7.9 7.8 7.6
Morocco 9.6 9.1 9.1 8.9 9.0 9.2 9.9 9.7 10.0 10.4
South Africa 22.4 23.5 24.7 24.6 24.7 24.6 24.9 25.2 25.9 26.0
Tunisia 12.4 13.3 13.1 18.3 17.6 15.9 15.8 15.2 14.8 14.6
Developing Americag
Argentina 7.9 8.7 7.7 7.2 7.2 7.1 7.3 6.5 6.6 6.5
Barbados 8.1 10.0 10.8 11.2 11.6 11.6 12.3 11.3 9.3 9.3
Bolivia (Plurinational State of) 4.4 4.9 4.3 3.8 3.2 4.0 3.5 4.5 4.5 4.5
Brazil 7.9 8.1 6.7 6.0 8.2 8.0 7.8 9.3 12.0 12.7
Chile 7.8 9.7 8.2 7.1 6.4 5.9 6.4 6.2 6.6 6.8
Colombia 11.0 12.3 11.8 10.9 10.6 10.1 9.5 9.2 9.9 10.5
Costa Rica 4.8 8.5 7.1 7.7 9.8 9.1 9.5 9.7 9.0 8.6
Dominican Republic 5.3 5.8 5.7 6.7 7.2 7.9 7.2 6.9 6.9 6.9
Ecuador 6.9 8.5 7.6 6.0 4.9 4.7 5.1 5.4 6.4 6.0
El Salvador 5.5 7.1 6.8 6.6 6.2 5.6 6.7 6.2 6.3 6.4
Guatemala .. .. 4.8 3.1 4.0 3.8 4.0 2.8 2.4 2.4
Honduras 4.1 4.9 6.4 6.8 5.6 6.0 7.5 8.8 6.3 5.6
Jamaica 10.6 11.4 12.4 12.7 13.7 15.3 13.7 13.3 13.3 13.1
Mexicoh 3.9 5.4 5.3 5.2 4.9 4.9 4.8 4.3 4.0 4.1
Nicaragua 6.1 7.9 7.8 5.9 5.9 5.6 6.6 6.6 6.7 6.7
165Annex tables
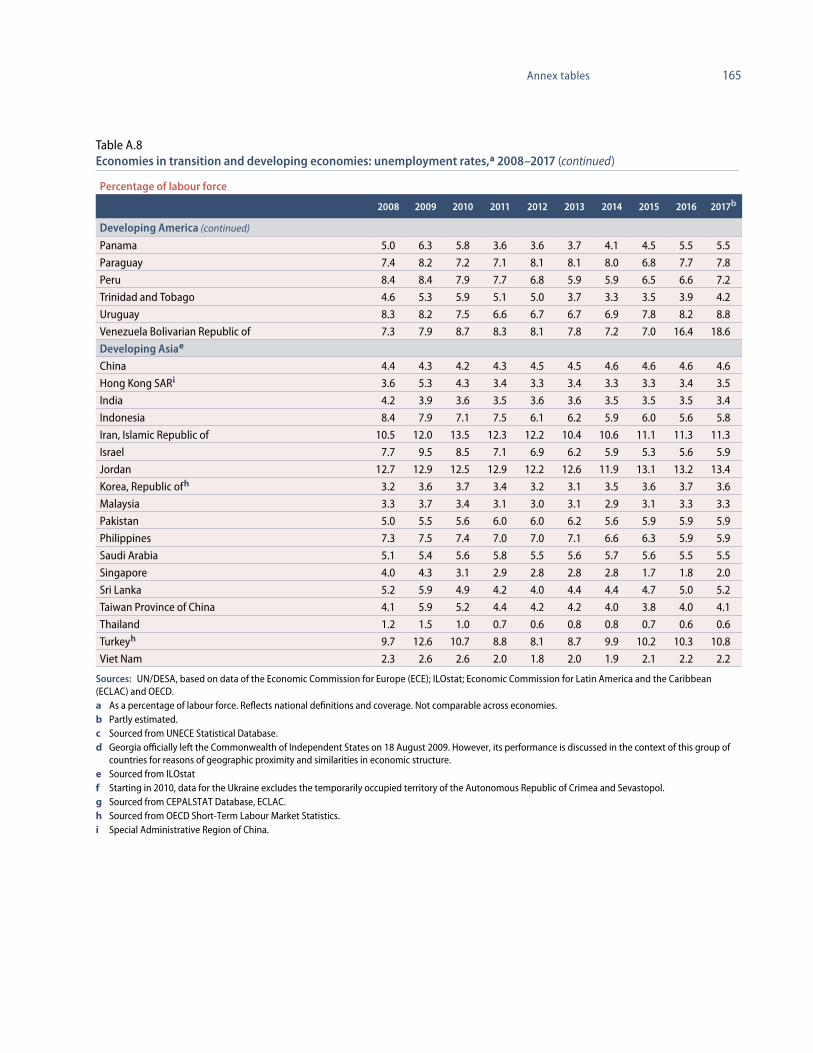
Table A.8Economies in transition and developing economies: unemployment rates,a 2008–2017 (continued)
Percentage of labour force
2008 2009 2010 2011 2012 2013 2014 2015 2016 2017b
Developing America (continued)
Panama 5.0 6.3 5.8 3.6 3.6 3.7 4.1 4.5 5.5 5.5
Paraguay 7.4 8.2 7.2 7.1 8.1 8.1 8.0 6.8 7.7 7.8
Peru 8.4 8.4 7.9 7.7 6.8 5.9 5.9 6.5 6.6 7.2
Trinidad and Tobago 4.6 5.3 5.9 5.1 5.0 3.7 3.3 3.5 3.9 4.2
Uruguay 8.3 8.2 7.5 6.6 6.7 6.7 6.9 7.8 8.2 8.8
Venezuela Bolivarian Republic of 7.3 7.9 8.7 8.3 8.1 7.8 7.2 7.0 16.4 18.6
Developing Asiae
China 4.4 4.3 4.2 4.3 4.5 4.5 4.6 4.6 4.6 4.6
Hong Kong SARi 3.6 5.3 4.3 3.4 3.3 3.4 3.3 3.3 3.4 3.5
India 4.2 3.9 3.6 3.5 3.6 3.6 3.5 3.5 3.5 3.4
Indonesia 8.4 7.9 7.1 7.5 6.1 6.2 5.9 6.0 5.6 5.8
Iran, Islamic Republic of 10.5 12.0 13.5 12.3 12.2 10.4 10.6 11.1 11.3 11.3
Israel 7.7 9.5 8.5 7.1 6.9 6.2 5.9 5.3 5.6 5.9
Jordan 12.7 12.9 12.5 12.9 12.2 12.6 11.9 13.1 13.2 13.4
Korea, Republic ofh 3.2 3.6 3.7 3.4 3.2 3.1 3.5 3.6 3.7 3.6
Malaysia 3.3 3.7 3.4 3.1 3.0 3.1 2.9 3.1 3.3 3.3
Pakistan 5.0 5.5 5.6 6.0 6.0 6.2 5.6 5.9 5.9 5.9
Philippines 7.3 7.5 7.4 7.0 7.0 7.1 6.6 6.3 5.9 5.9
Saudi Arabia 5.1 5.4 5.6 5.8 5.5 5.6 5.7 5.6 5.5 5.5
Singapore 4.0 4.3 3.1 2.9 2.8 2.8 2.8 1.7 1.8 2.0
Sri Lanka 5.2 5.9 4.9 4.2 4.0 4.4 4.4 4.7 5.0 5.2
Taiwan Province of China 4.1 5.9 5.2 4.4 4.2 4.2 4.0 3.8 4.0 4.1
Thailand 1.2 1.5 1.0 0.7 0.6 0.8 0.8 0.7 0.6 0.6
Turkeyh 9.7 12.6 10.7 8.8 8.1 8.7 9.9 10.2 10.3 10.8
Viet Nam 2.3 2.6 2.6 2.0 1.8 2.0 1.9 2.1 2.2 2.2
Sources: UN/DESA, based on data of the Economic Commission for Europe (ECE); ILOstat; Economic Commission for Latin America and the Caribbean (ECLAC) and OECD. a As a percentage of labour force. Reflects national definitions and coverage. Not comparable across economies.b Partly estimated.c Sourced from UNECE Statistical Database.d Georgia officially left the Commonwealth of Independent States on 18 August 2009. However, its performance is discussed in the context of this group of countries for reasons of geographic proximity and similarities in economic structure.e Sourced from ILOstatf Starting in 2010, data for the Ukraine excludes the temporarily occupied territory of the Autonomous Republic of Crimea and Sevastopol.g Sourced from CEPALSTAT Database, ECLAC.h Sourced from OECD Short-Term Labour Market Statistics.i Special Administrative Region of China.
166 World Economic Situation and Prospects 2018
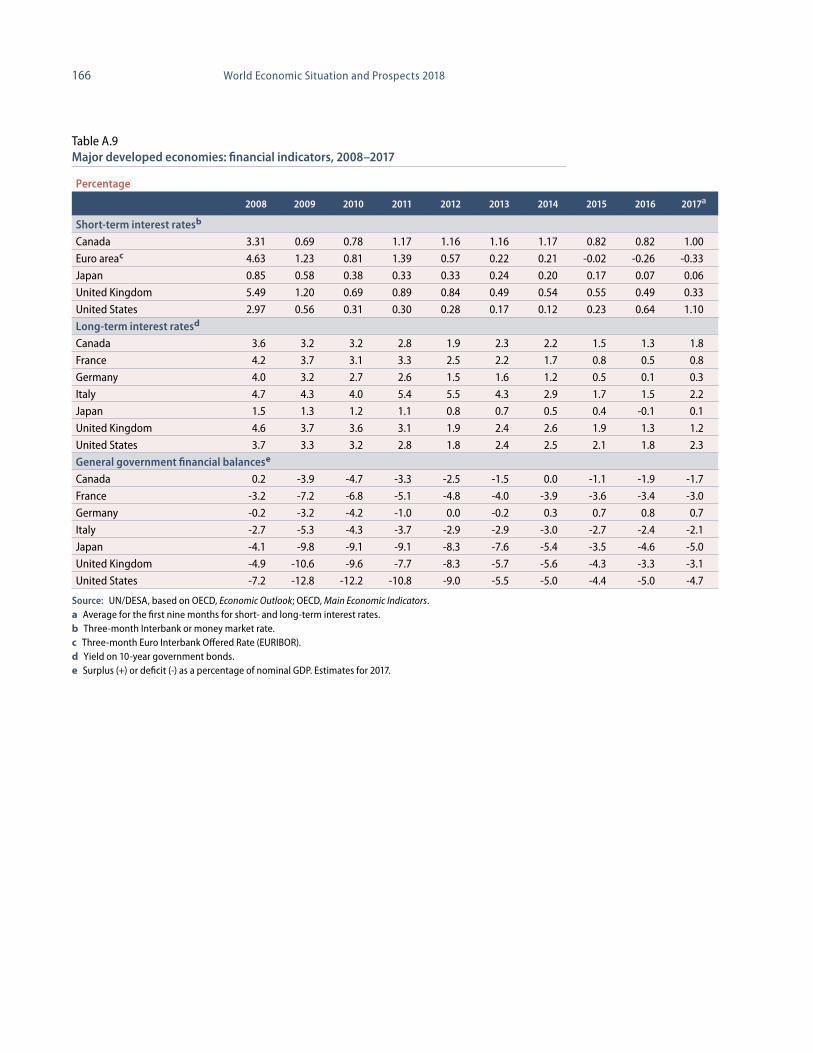
Table A.9Major developed economies: financial indicators, 2008–2017
Percentage
2008 2009 2010 2011 2012 2013 2014 2015 2016 2017a
Short-term interest ratesb
Canada 3.31 0.69 0.78 1.17 1.16 1.16 1.17 0.82 0.82 1.00
Euro areac 4.63 1.23 0.81 1.39 0.57 0.22 0.21 -0.02 -0.26 -0.33
Japan 0.85 0.58 0.38 0.33 0.33 0.24 0.20 0.17 0.07 0.06
United Kingdom 5.49 1.20 0.69 0.89 0.84 0.49 0.54 0.55 0.49 0.33
United States 2.97 0.56 0.31 0.30 0.28 0.17 0.12 0.23 0.64 1.10
Long-term interest ratesd
Canada 3.6 3.2 3.2 2.8 1.9 2.3 2.2 1.5 1.3 1.8
France 4.2 3.7 3.1 3.3 2.5 2.2 1.7 0.8 0.5 0.8
Germany 4.0 3.2 2.7 2.6 1.5 1.6 1.2 0.5 0.1 0.3
Italy 4.7 4.3 4.0 5.4 5.5 4.3 2.9 1.7 1.5 2.2
Japan 1.5 1.3 1.2 1.1 0.8 0.7 0.5 0.4 -0.1 0.1
United Kingdom 4.6 3.7 3.6 3.1 1.9 2.4 2.6 1.9 1.3 1.2
United States 3.7 3.3 3.2 2.8 1.8 2.4 2.5 2.1 1.8 2.3
General government financial balancese
Canada 0.2 -3.9 -4.7 -3.3 -2.5 -1.5 0.0 -1.1 -1.9 -1.7
France -3.2 -7.2 -6.8 -5.1 -4.8 -4.0 -3.9 -3.6 -3.4 -3.0
Germany -0.2 -3.2 -4.2 -1.0 0.0 -0.2 0.3 0.7 0.8 0.7
Italy -2.7 -5.3 -4.3 -3.7 -2.9 -2.9 -3.0 -2.7 -2.4 -2.1
Japan -4.1 -9.8 -9.1 -9.1 -8.3 -7.6 -5.4 -3.5 -4.6 -5.0
United Kingdom -4.9 -10.6 -9.6 -7.7 -8.3 -5.7 -5.6 -4.3 -3.3 -3.1
United States -7.2 -12.8 -12.2 -10.8 -9.0 -5.5 -5.0 -4.4 -5.0 -4.7
Source: UN/DESA, based on OECD, Economic Outlook; OECD, Main Economic Indicators.a Average for the first nine months for short- and long-term interest rates.b Three-month Interbank or money market rate.c Three-month Euro Interbank Offered Rate (EURIBOR).d Yield on 10-year government bonds.e Surplus (+) or deficit (-) as a percentage of nominal GDP. Estimates for 2017.

167Annex tables
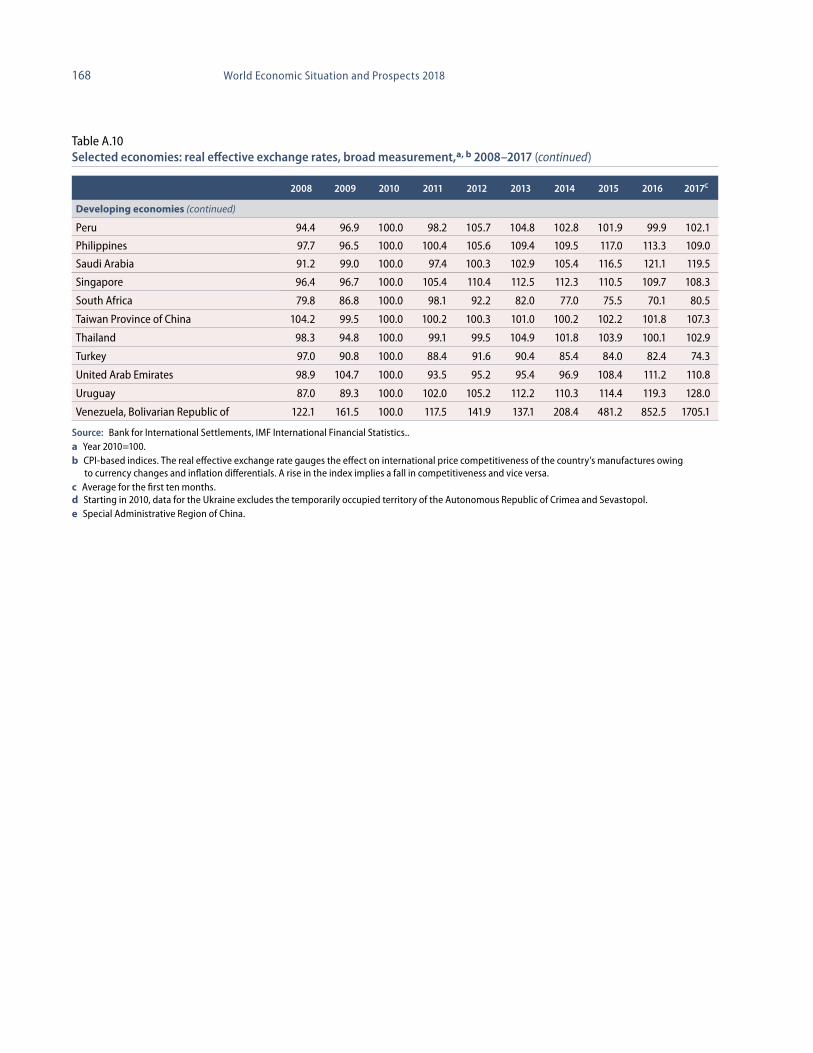
Table A.10Selected economies: real effective exchange rates, broad measurement,a, b 2008–2017
2008 2009 2010 2011 2012 2013 2014 2015 2016 2017c
Developed economies
Australia 90.3 87.5 100.0 106.9 108.5 102.9 98.2 89.6 90.3 93.6
Bulgaria 99.5 103.6 100.0 101.7 100.2 100.8 99.8 96.6 96.8 97.7
Canada 96.1 91.6 100.0 101.6 100.9 97.2 91.4 83.2 81.5 82.5
Croatia 102.1 103.1 100.0 97.3 95.2 96.3 95.5 92.2 92.6 93.4
Czech Republic 104.1 99.7 100.0 101.7 97.7 95.9 90.6 88.0 90.3 92.9
Denmark 101.6 104.4 100.0 99.2 96.5 97.3 98.2 94.7 96.0 96.1
Euro area 108.0 108.9 100.0 99.3 94.4 97.7 98.2 89.7 91.5 91.7
Hungary 105.5 99.3 100.0 99.6 96.8 95.9 92.0 88.0 88.6 90.3
Japan 88.5 99.4 100.0 101.3 100.0 79.7 75.1 70.3 79.6 76.3
New Zealand 98.8 92.1 100.0 103.9 106.5 109.5 113.0 104.7 105.3 108.5
Norway 98.7 96.2 100.0 100.3 99.6 97.9 93.4 85.2 85.6 87.0
Poland 112.7 95.0 100.0 98.2 95.2 96.1 96.6 92.1 88.3 90.9
Romania 106.7 98.8 100.0 102.5 96.3 100.9 101.7 98.0 96.3 94.5
Sweden 104.6 94.4 100.0 105.8 105.1 106.3 100.9 93.9 94.5 93.6
Switzerland 92.5 96.2 100.0 109.5 105.1 103.4 104.5 111.2 108.9 107.7
United Kingdom 110.2 99.5 100.0 100.5 104.5 103.1 110.3 115.5 103.4 97.8
United States 100.3 104.5 100.0 95.0 97.2 97.5 99.6 110.5 114.5 114.5
Economies in transition
Russian Federation 100.0 91.5 100.0 103.7 104.9 106.7 96.2 77.8 76.5 89.7
Ukrained 116.3 97.4 100.0 100.3 102.9 99.7 78.2 73.7 72.6 75.7
Developing economies
Algeria 102.0 100.0 100.0 99.2 103.9 101.5 102.8 97.8 96.1 98.9
Argentina 110.4 103.1 100.0 95.2 98.2 90.1 73.9 86.4 70.9 74.3
Brazil 87.7 87.5 100.0 104.6 94.4 90.0 88.9 74.0 78.3 85.6
Chile 97.5 94.3 100.0 100.8 102.8 101.6 92.0 90.2 91.5 94.3
China 96.4 100.7 100.0 102.5 108.7 115.6 118.3 129.7 124.4 120.2
Colombia 91.1 87.6 100.0 98.5 103.9 100.1 95.3 77.8 74.9 77.4
Hong Kong SARe 100.6 104.1 100.0 95.9 99.4 103.1 107.4 118.1 121.5 121.6
India 94.9 89.6 100.0 100.1 93.8 89.4 90.8 97.8 98.7 102.8
Indonesia 88.9 88.5 100.0 100.0 96.3 93.0 87.1 88.9 92.5 94.8
Iran, Islamic Republic of 85.6 97.0 100.0 109.3 123.2 122.4 92.0 103.9 106.6 108.3
Israel 97.6 95.5 100.0 100.8 95.9 102.2 103.3 103.0 104.5 109.2
Korea, Republic of 104.4 92.4 100.0 99.9 99.5 103.9 109.9 110.9 109.2 112.4
Malaysia 97.9 95.0 100.0 99.8 99.6 99.7 99.3 91.6 87.8 85.7
Mexico 105.7 92.8 100.0 99.4 96.4 101.9 101.0 90.9 79.1 81.0
Morocco 102.3 104.2 100.0 97.8 95.9 97.6 97.7 98.1 100.4 100.0
Nigeria 99.2 92.0 100.0 100.4 111.5 119.0 127.4 126.5 116.2 105.0
Pakistan 94.6 95.1 100.0 102.9 104.5 102.4 109.9 120.0 122.8 126.6
168 World Economic Situation and Prospects 2018
2008 2009 2010 2011 2012 2013 2014 2015 2016 2017c
Developing economies (continued)
Peru 94.4 96.9 100.0 98.2 105.7 104.8 102.8 101.9 99.9 102.1
Philippines 97.7 96.5 100.0 100.4 105.6 109.4 109.5 117.0 113.3 109.0
Saudi Arabia 91.2 99.0 100.0 97.4 100.3 102.9 105.4 116.5 121.1 119.5
Singapore 96.4 96.7 100.0 105.4 110.4 112.5 112.3 110.5 109.7 108.3
South Africa 79.8 86.8 100.0 98.1 92.2 82.0 77.0 75.5 70.1 80.5
Taiwan Province of China 104.2 99.5 100.0 100.2 100.3 101.0 100.2 102.2 101.8 107.3
Thailand 98.3 94.8 100.0 99.1 99.5 104.9 101.8 103.9 100.1 102.9
Turkey 97.0 90.8 100.0 88.4 91.6 90.4 85.4 84.0 82.4 74.3
United Arab Emirates 98.9 104.7 100.0 93.5 95.2 95.4 96.9 108.4 111.2 110.8
Uruguay 87.0 89.3 100.0 102.0 105.2 112.2 110.3 114.4 119.3 128.0
Venezuela, Bolivarian Republic of 122.1 161.5 100.0 117.5 141.9 137.1 208.4 481.2 852.5 1705.1
Source: Bank for International Settlements, IMF International Financial Statistics..a Year 2010=100.b CPI-based indices. The real effective exchange rate gauges the effect on international price competitiveness of the country’s manufactures owing to currency changes and inflation differentials. A rise in the index implies a fall in competitiveness and vice versa.c Average for the first ten months. d Starting in 2010, data for the Ukraine excludes the temporarily occupied territory of the Autonomous Republic of Crimea and Sevastopol.e Special Administrative Region of China.
Table A.10Selected economies: real effective exchange rates, broad measurement,a, b 2008–2017 (continued)

169Annex tables
Table A.11Indices of prices of primary commodities, 2008–2017
Index: Year 2000=100
Non-fuel commodities Combined index
Manufactured export prices
Real prices of non-fuel
commoditiesaaCrude
petroleumbbFoodTropical
beverages
Vegetable oilseeds and oils
Agricultural raw
materials
Minerals and
metals Dollar SDR
2008 234 178 298 198 332 256 213 142 180 342.2
2009 220 181 213 163 232 213 182 134 159 221.2
2010 230 213 262 226 327 256 222 136 188 280.6
2011 265 270 333 289 375 302 253 150 201 389.3
2012 270 212 307 223 322 277 239 146 190 396.6
2013 255 174 269 206 306 258 225 149 173 383.6
2014 240 214 253 186 280 243 211 148 164 348.9
2015 204 197 203 161 218 202 190 133 152 179.3
2016 207 190 226 157 205 200 191 132 152 147.7
2017 202 185 230 170 246 210 202 134 157 183.1
2014I 244 198 279 198 289 249 214 151 165 379.6
II 245 220 270 191 281 248 212 150 165 383.6
III 238 220 237 181 285 242 210 149 162 365.2
IV 233 219 227 172 265 232 209 142 164 265.8
2015I 218 201 215 164 235 214 201 134 160 182.3
II 204 196 210 166 236 207 196 134 154 217.0
III 200 197 194 160 209 196 185 134 147 174.5
IV 195 194 193 153 193 189 179 132 143 143.9
2016I 193 180 204 148 189 186 177 130 143 109.3
II 212 186 230 157 198 200 188 133 151 153.6
III 218 197 231 157 206 206 195 133 155 155.5
IV 205 197 240 165 229 208 202 132 158 172.2
2017I 207 191 242 180 250 216 211 132 164 188.3
II 200 180 222 164 235 205 197 134 153 175.7
III 197 182 222 165 255 209 196 … .. 181.1
Source: UNCTAD, Monthly Commodity Price Bulletin; United Nations, Monthly Bulletin of Statistics; and data from the Organization of the Petroleum Exporting Countries (OPEC) website, available from http://www.opec.org.a Combined index of non-fuel commodity prices in dollars, deflated by manufactured export price index.b The new OPEC reference basket, introduced on 16 June 2005, currently has 14 crudes. Indonesian (Minas) and Gabon (Rabi Light) crudes were added.
170 World Economic Situation and Prospects 2018
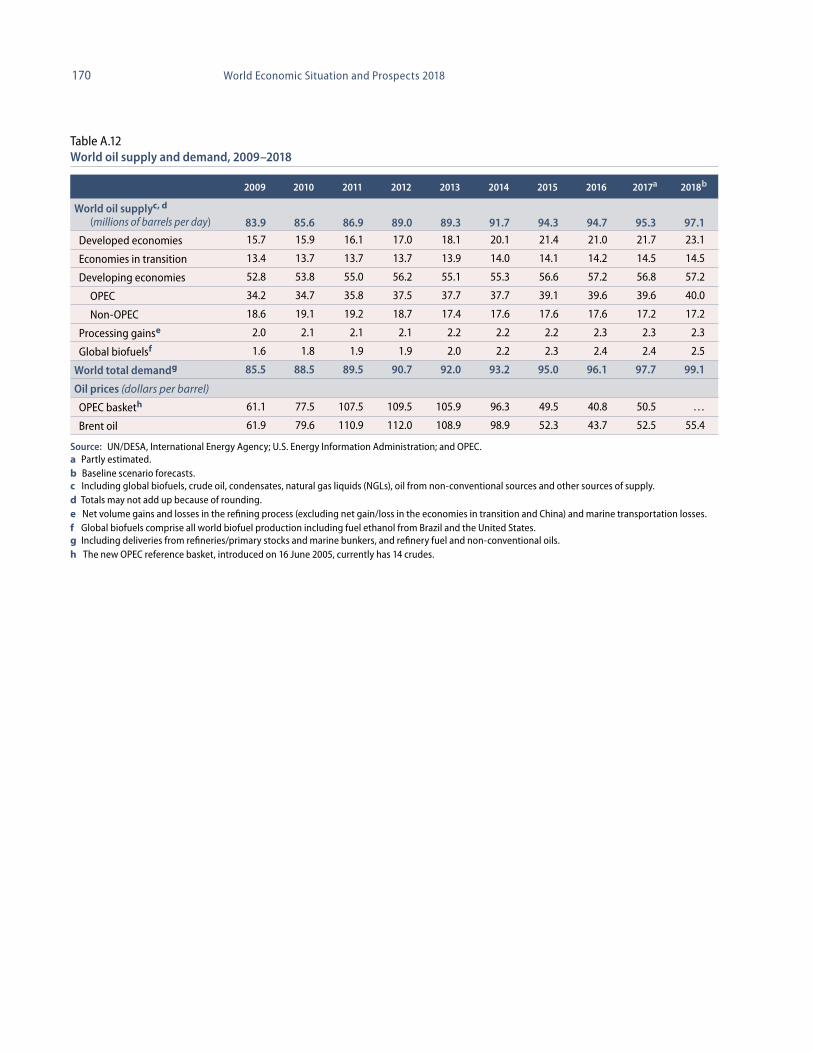
Table A.12World oil supply and demand, 2009–2018
2009 2010 2011 2012 2013 2014 2015 2016 2017a 2018b
World oil supplyc, d (millions of barrels per day) 83.9 85.6 86.9 89.0 89.3 91.7 94.3 94.7 95.3 97.1
Developed economies 15.7 15.9 16.1 17.0 18.1 20.1 21.4 21.0 21.7 23.1
Economies in transition 13.4 13.7 13.7 13.7 13.9 14.0 14.1 14.2 14.5 14.5
Developing economies 52.8 53.8 55.0 56.2 55.1 55.3 56.6 57.2 56.8 57.2
OPEC 34.2 34.7 35.8 37.5 37.7 37.7 39.1 39.6 39.6 40.0
Non-OPEC 18.6 19.1 19.2 18.7 17.4 17.6 17.6 17.6 17.2 17.2
Processing gainse 2.0 2.1 2.1 2.1 2.2 2.2 2.2 2.3 2.3 2.3
Global biofuelsf 1.6 1.8 1.9 1.9 2.0 2.2 2.3 2.4 2.4 2.5
World total demandg 85.5 88.5 89.5 90.7 92.0 93.2 95.0 96.1 97.7 99.1
Oil prices (dollars per barrel)
OPEC basketh 61.1 77.5 107.5 109.5 105.9 96.3 49.5 40.8 50.5 …
Brent oil 61.9 79.6 110.9 112.0 108.9 98.9 52.3 43.7 52.5 55.4
Source: UN/DESA, International Energy Agency; U.S. Energy Information Administration; and OPEC. a Partly estimated.b Baseline scenario forecasts. c Including global biofuels, crude oil, condensates, natural gas liquids (NGLs), oil from non-conventional sources and other sources of supply.d Totals may not add up because of rounding.e Net volume gains and losses in the refining process (excluding net gain/loss in the economies in transition and China) and marine transportation losses.f Global biofuels comprise all world biofuel production including fuel ethanol from Brazil and the United States. g Including deliveries from refineries/primary stocks and marine bunkers, and refinery fuel and non-conventional oils.h The new OPEC reference basket, introduced on 16 June 2005, currently has 14 crudes.
171Annex tables
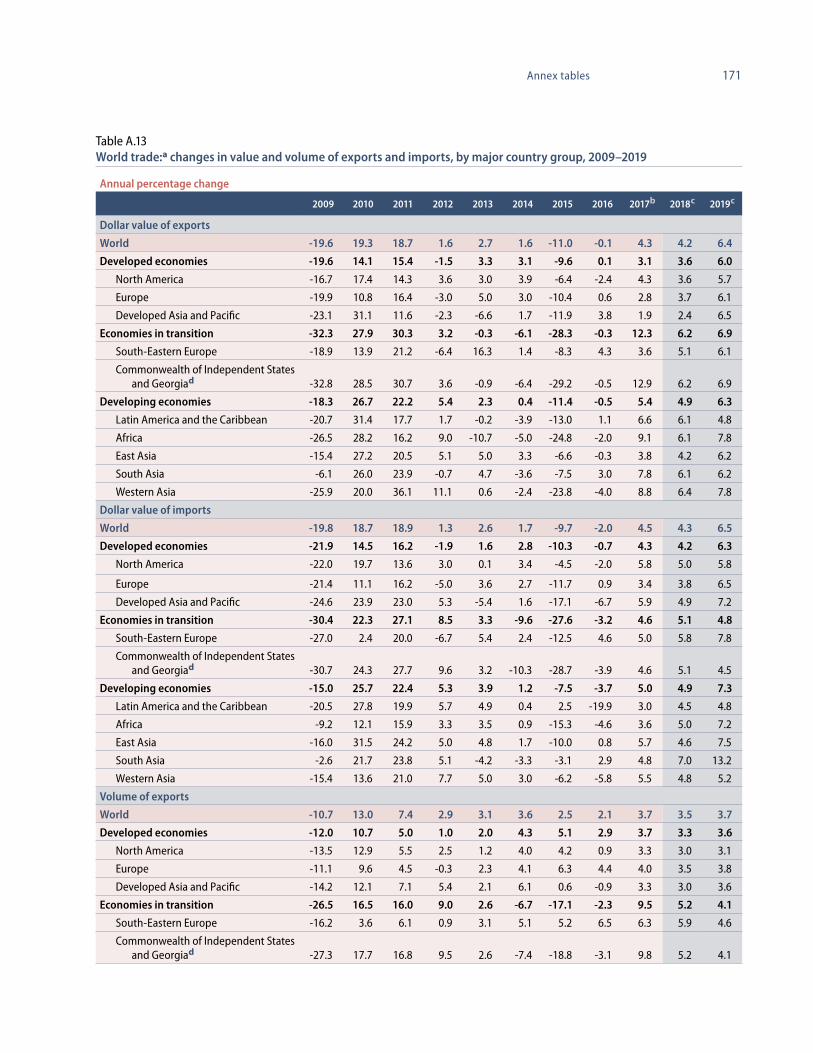
Table A.13World trade:a changes in value and volume of exports and imports, by major country group, 2009–2019
Annual percentage change
2009 2010 2011 2012 2013 2014 2015 2016 2017b 2018c 2019c
Dollar value of exports
World -19.6 19.3 18.7 1.6 2.7 1.6 -11.0 -0.1 4.3 4.2 6.4
Developed economies -19.6 14.1 15.4 -1.5 3.3 3.1 -9.6 0.1 3.1 3.6 6.0
North America -16.7 17.4 14.3 3.6 3.0 3.9 -6.4 -2.4 4.3 3.6 5.7
Europe -19.9 10.8 16.4 -3.0 5.0 3.0 -10.4 0.6 2.8 3.7 6.1
Developed Asia and Pacific -23.1 31.1 11.6 -2.3 -6.6 1.7 -11.9 3.8 1.9 2.4 6.5
Economies in transition -32.3 27.9 30.3 3.2 -0.3 -6.1 -28.3 -0.3 12.3 6.2 6.9
South-Eastern Europe -18.9 13.9 21.2 -6.4 16.3 1.4 -8.3 4.3 3.6 5.1 6.1
Commonwealth of Independent States and Georgiad -32.8 28.5 30.7 3.6 -0.9 -6.4 -29.2 -0.5 12.9 6.2 6.9
Developing economies -18.3 26.7 22.2 5.4 2.3 0.4 -11.4 -0.5 5.4 4.9 6.3
Latin America and the Caribbean -20.7 31.4 17.7 1.7 -0.2 -3.9 -13.0 1.1 6.6 6.1 4.8
Africa -26.5 28.2 16.2 9.0 -10.7 -5.0 -24.8 -2.0 9.1 6.1 7.8
East Asia -15.4 27.2 20.5 5.1 5.0 3.3 -6.6 -0.3 3.8 4.2 6.2
South Asia -6.1 26.0 23.9 -0.7 4.7 -3.6 -7.5 3.0 7.8 6.1 6.2
Western Asia -25.9 20.0 36.1 11.1 0.6 -2.4 -23.8 -4.0 8.8 6.4 7.8
Dollar value of imports
World -19.8 18.7 18.9 1.3 2.6 1.7 -9.7 -2.0 4.5 4.3 6.5
Developed economies -21.9 14.5 16.2 -1.9 1.6 2.8 -10.3 -0.7 4.3 4.2 6.3
North America -22.0 19.7 13.6 3.0 0.1 3.4 -4.5 -2.0 5.8 5.0 5.8
Europe -21.4 11.1 16.2 -5.0 3.6 2.7 -11.7 0.9 3.4 3.8 6.5
Developed Asia and Pacific -24.6 23.9 23.0 5.3 -5.4 1.6 -17.1 -6.7 5.9 4.9 7.2
Economies in transition -30.4 22.3 27.1 8.5 3.3 -9.6 -27.6 -3.2 4.6 5.1 4.8
South-Eastern Europe -27.0 2.4 20.0 -6.7 5.4 2.4 -12.5 4.6 5.0 5.8 7.8
Commonwealth of Independent States and Georgiad -30.7 24.3 27.7 9.6 3.2 -10.3 -28.7 -3.9 4.6 5.1 4.5
Developing economies -15.0 25.7 22.4 5.3 3.9 1.2 -7.5 -3.7 5.0 4.9 7.3
Latin America and the Caribbean -20.5 27.8 19.9 5.7 4.9 0.4 2.5 -19.9 3.0 4.5 4.8
Africa -9.2 12.1 15.9 3.3 3.5 0.9 -15.3 -4.6 3.6 5.0 7.2
East Asia -16.0 31.5 24.2 5.0 4.8 1.7 -10.0 0.8 5.7 4.6 7.5
South Asia -2.6 21.7 23.8 5.1 -4.2 -3.3 -3.1 2.9 4.8 7.0 13.2
Western Asia -15.4 13.6 21.0 7.7 5.0 3.0 -6.2 -5.8 5.5 4.8 5.2
Volume of exports
World -10.7 13.0 7.4 2.9 3.1 3.6 2.5 2.1 3.7 3.5 3.7
Developed economies -12.0 10.7 5.0 1.0 2.0 4.3 5.1 2.9 3.7 3.3 3.6
North America -13.5 12.9 5.5 2.5 1.2 4.0 4.2 0.9 3.3 3.0 3.1
Europe -11.1 9.6 4.5 -0.3 2.3 4.1 6.3 4.4 4.0 3.5 3.8
Developed Asia and Pacific -14.2 12.1 7.1 5.4 2.1 6.1 0.6 -0.9 3.3 3.0 3.6
Economies in transition -26.5 16.5 16.0 9.0 2.6 -6.7 -17.1 -2.3 9.5 5.2 4.1
South-Eastern Europe -16.2 3.6 6.1 0.9 3.1 5.1 5.2 6.5 6.3 5.9 4.6
Commonwealth of Independent States and Georgiad -27.3 17.7 16.8 9.5 2.6 -7.4 -18.8 -3.1 9.8 5.2 4.1

172 World Economic Situation and Prospects 2018
Annual percentage change
2009 2010 2011 2012 2013 2014 2015 2016 2017b 2018c 2019c
Developing economies -7.6 13.0 9.2 5.0 4.1 4.5 1.5 1.9 2.8 3.1 3.4
Latin America and the Caribbean -9.3 8.8 6.4 2.5 1.2 1.3 5.1 1.2 1.0 1.9 2.2
Africa -10.9 10.6 1.2 6.8 -5.9 4.8 3.0 2.4 3.4 3.1 4.0
East Asia -7.4 16.6 9.6 4.6 6.5 5.8 0.7 2.3 3.3 3.5 3.5
South Asia -0.1 11.4 12.0 3.2 5.2 5.8 5.1 0.6 1.2 2.3 3.5
Western Asia -7.8 6.0 13.4 8.7 2.4 1.5 -0.8 1.4 2.5 3.4 3.9
Volume of imports
World -10.7 13.0 7.4 2.9 3.1 3.6 2.5 2.1 3.7 3.5 3.7
Developed economies -12.0 10.7 5.0 1.0 2.0 4.3 5.1 2.9 3.7 3.3 3.6
North America -13.5 12.9 5.5 2.5 1.2 4.0 4.2 0.9 3.3 3.0 3.1
Europe -11.1 9.6 4.5 -0.3 2.3 4.1 6.3 4.4 4.0 3.5 3.8
Developed Asia and Pacific -14.2 12.1 7.1 5.4 2.1 6.1 0.6 -0.9 3.3 3.0 3.6
Economies in transition -26.5 16.5 16.0 9.0 2.6 -6.7 -17.1 -2.3 9.5 5.2 4.1
South-Eastern Europe -16.2 3.6 6.1 0.9 3.1 5.1 5.2 6.5 6.3 5.9 4.6
Commonwealth of Independent States and Georgiad
-27.3 17.7 16.8 9.5 2.6 -7.4 -18.8 -3.1 9.8 5.2 4.1
Developing economies -7.0 16.4 10.3 5.0 4.6 3.4 0.5 1.3 3.2 3.6 3.7
Latin America and the Caribbean -14.4 21.3 11.2 4.6 3.0 0.2 -1.6 -2.7 1.2 2.2 2.4
Africa -2.4 8.3 2.2 6.5 2.5 1.8 -0.6 0.6 3.8 4.7 4.3
East Asia -6.1 19.9 11.4 4.8 6.8 5.1 1.2 2.6 3.8 3.7 3.7
South Asia 1.3 8.6 12.3 2.8 -6.0 0.5 1.4 1.0 2.9 4.0 7.6
Western Asia -10.0 8.1 8.8 7.1 6.0 2.6 -0.6 0.1 2.4 3.4 2.5
Source: UN/DESA.a Includes goods and non-factor services.b Partly estimated.c Baseline forecast, based in part on Project LINK.d Georgia officially left the Commonwealth of Independent States on 18 August 2009. However, its performance is discussed in the context of this group of countries for reasons of geographic proximity and similarities in economic structure.
Table A.13World tradea: changes in value and volume of exports and imports, by major country group, 2009–2019 (continued)

173Annex tables
Table A.14Balance of payments on current accounts, by country or country group, summary table, 2008–2016
Billions of dollars
2008 2009 2010 2011 2012 2013 2014 2015 2016
Developed economies -765.7 -256.1 -181.6 -219.1 -167.2 16.7 -1.1 54.2 97.8Japan 142.6 145.3 221.0 129.8 59.7 45.9 36.8 134.1 188.1
United States -681.4 -372.5 -430.7 -444.6 -426.2 -349.5 -373.8 -434.6 -451.7
Europea -166.4 60.3 134.2 194.5 336.3 433.9 427.6 471.6 450.3
EU-15 -127.3 21.9 52.0 126.7 233.6 301.1 313.0 356.9 350.6
EU-13 -120.9 -41.8 -49.9 -48.7 -29.8 -0.5 -2.8 3.0 9.1
Economies in transitionb 90.3 35.4 62.5 98.8 59.1 11.6 50.9 48.6 -4.5South-Eastern Europe -18.6 -7.5 -6.0 -8.5 -8.5 -5.7 -6.2 -4.4 -4.3
Commonwealth of Independent Statesc 111.6 44.1 69.7 109.2 69.4 18.2 58.8 54.7 1.7
Developing economiesd 726.8 366.0 385.3 444.0 453.8 362.5 371.3 170.9 166.1Net fuel exporters 426.1 64.5 213.5 474.6 465.3 369.2 190.4 -182.5 -140.5
Net fuel importers 300.7 301.5 171.8 -30.5 -11.4 -6.7 180.9 353.4 306.6
Latin America and the Caribbean -39.0 -33.6 -96.9 -113.9 -134.5 -164.1 -183.8 -172.8 -98.7Net fuel exporters 37.1 -1.5 0.2 10.5 -3.6 -2.7 -10.7 -37.8 -19.0
Net fuel importers -1.9 -35.1 -96.7 -103.4 -138.1 -166.7 -194.5 -210.6 -117.7
Africa 21.3 -44.9 -9.9 -12.9 -43.2 -62.5 -95.6 -144.2 -119.6Net fuel exporters 108.3 1.2 40.4 43.6 54.3 14.3 -42.1 -90.6 -68.4
Net fuel importers -87.0 -46.1 -50.3 -56.5 -97.6 -76.8 -53.5 -53.6 -51.2
Western Asia 220.8 36.6 99.2 274.1 338.5 278.3 196.2 -77.9 -96.1Net fuel exporters 264.2 48.1 146.5 351.8 400.6 348.6 242.7 -47.6 -62.0
Net fuel importers -43.4 -11.5 -47.3 -77.7 -62.1 -70.3 -46.5 -30.3 -34.0
East and South Asia 523.9 407.8 392.9 296.7 293.2 310.8 454.5 565.9 480.5Net fuel exporters 16.6 16.6 26.4 68.6 13.9 8.9 0.4 -6.5 8.9
Net fuel importers 507.3 391.2 366.5 228.1 279.2 301.8 454.1 572.4 471.6
World residuale 51.4 145.3 266.2 323.7 345.7 390.8 421.0 273.8 259.4
Source: International Monetary Fund (IMF), World Economic Outlook database, October 2017.Note: IMF-WEO has adopted the sixth edition of the Balance of Payments Manual (BPM6).a Europe consists of the EU-15, the EU-13 and Iceland, Norway and Switzerland (Table A).b Includes Georgia.c Excludes Georgia, which left the Commonwealth of Independent States on 18 August 2009.d Libya has been excluded in the calculation due to unavailability of data.e Statistical discrepancy.

174 World Economic Situation and Prospects 2018
Table A.15Balance of payments on current accounts, by country or country group, 2008–2016
Billions of dollars
2008 2009 2010 2011 2012 2013 2014 2015 2016
Developed economies
Trade balance -817.8 -410.8 -493.0 -671.0 -628.4 -494.6 -535.7 -413.5 -324.7
Services, net 303.8 278.3 311.0 402.2 411.8 487.1 550.7 521.8 488.1
Primary income 94.3 220.0 354.0 414.5 404.2 401.7 373.2 300.5 289.7
Secondary income -345.9 -343.4 -353.5 -364.6 -354.8 -377.3 -389.1 -354.3 -355.1
Current-account balance -765.7 -256.1 -181.6 -219.1 -167.2 16.7 -1.1 54.2 97.8
Japan
Trade balance 55.6 57.8 108.5 -4.5 -53.9 -90.0 -99.9 -7.4 51.4
Services, net -38.0 -34.9 -30.3 -35.0 -47.8 -35.7 -28.8 -16.0 -10.8
Primary income 138.1 134.6 155.1 183.1 175.6 181.6 184.6 173.8 167.1
Secondary income -13.1 -12.3 -12.4 -13.8 -14.2 -10.0 -19.0 -16.3 -19.7
Current-account balance 142.6 145.3 221.0 129.8 59.7 45.9 36.8 134.1 188.1
United States
Trade balance -832.5 -509.7 -648.7 -740.6 -741.2 -702.2 -751.5 -761.9 -752.5
Services, net 123.8 125.9 154.0 192.0 204.4 240.4 261.2 261.4 247.7
Primary income 129.7 115.2 168.2 211.1 207.5 206.0 210.8 181.0 173.2
Secondary income -102.3 -103.9 -104.3 -107.0 -96.9 -93.6 -94.2 -115.1 -120.1
Current-account balance -681.4 -372.5 -430.7 -444.6 -426.2 -349.5 -373.8 -434.6 -451.7
Europea
Trade balance -72.3 51.1 43.4 48.9 188.2 297.3 308.5 394.3 404.0
Services, net 237.0 202.3 212.3 275.9 290.3 318.9 349.1 301.6 267.7
Primary income -101.8 30.5 110.0 107.4 94.7 85.1 40.8 -5.8 -10.4
Secondary income -229.3 -223.7 -231.5 -237.7 -236.8 -267.4 -270.7 -218.5 -211.1
Current-account balance -166.4 60.3 134.2 194.5 336.3 433.9 427.6 471.6 450.3
EU-15
Trade balance -45.8 39.7 7.2 3.8 113.6 197.0 220.5 326.9 347.9
Services, net 158.4 140.2 150.9 208.0 224.2 248.0 273.6 230.3 189.7
Primary income -14.9 57.0 118.0 144.1 121.8 108.0 65.3 1.1 8.2
Secondary income -224.9 -215.1 -224.1 -229.2 -226.0 -251.9 -246.4 -201.4 -195.3
Current-account balance -127.3 21.9 52.0 126.7 233.6 301.1 313.0 356.9 350.6
EU-13
Trade balance -128.7 -45.7 -47.7 -51.4 -34.7 -14.4 -17.1 -11.4 -9.2
Services, net 45.3 36.0 36.2 45.1 45.6 52.9 58.5 55.6 65.1
Primary income -46.6 -36.9 -45.7 -49.9 -45.4 -44.5 -47.1 -44.6 -47.5
Secondary income 9.1 4.8 7.4 7.5 4.7 5.4 2.9 3.5 0.8
Current-account balance -120.9 -41.8 -49.9 -48.7 -29.8 -0.5 -2.8 3.0 9.1
Economies in transitionb
Trade balance 176.7 105.6 154.3 221.7 205.9 179.4 203.1 132.3 62.3
Services, net -27.8 -24.1 -31.0 -36.6 -52.7 -61.4 -62.7 -39.2 -23.6
Primary income -72.2 -58.9 -72.7 -98.6 -103.9 -113.3 -97.0 -54.4 -54.2
Secondary income 13.6 13.3 11.9 12.3 9.7 6.9 7.4 9.9 11.0
Current-account balance 90.3 35.4 62.5 98.8 59.1 11.6 50.9 48.6 -4.5
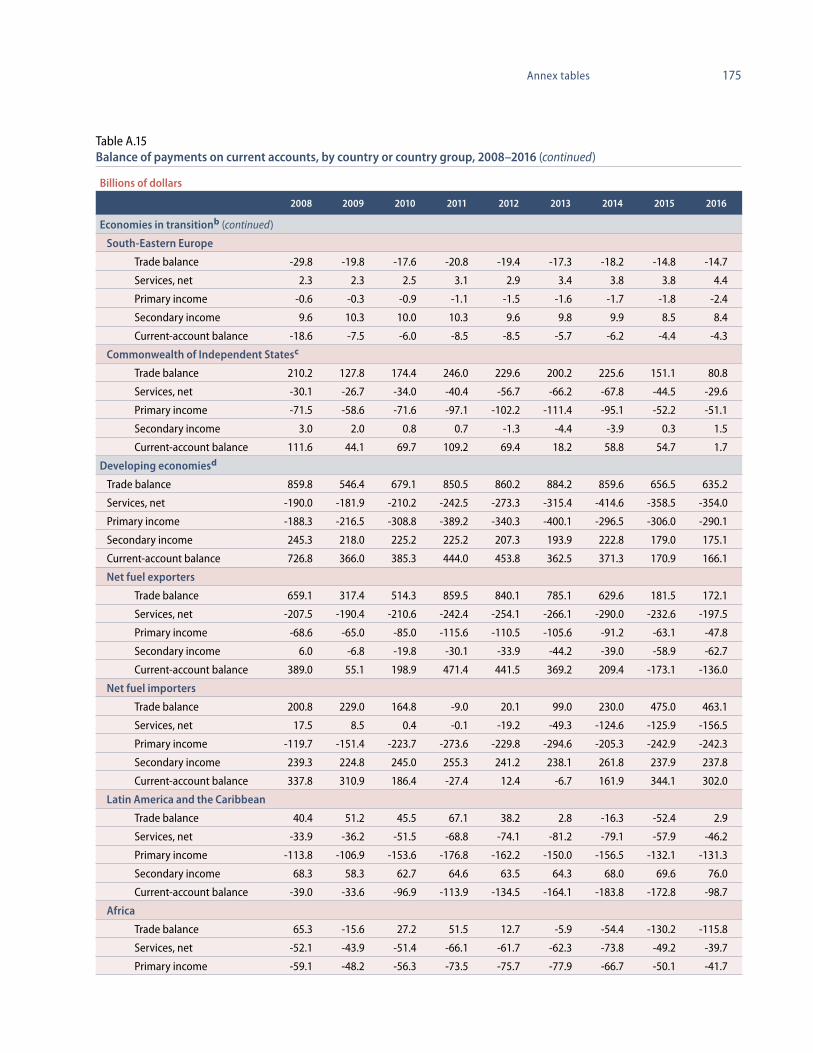
175Annex tables
Billions of dollars
2008 2009 2010 2011 2012 2013 2014 2015 2016
Economies in transitionb (continued)
South-Eastern Europe
Trade balance -29.8 -19.8 -17.6 -20.8 -19.4 -17.3 -18.2 -14.8 -14.7
Services, net 2.3 2.3 2.5 3.1 2.9 3.4 3.8 3.8 4.4
Primary income -0.6 -0.3 -0.9 -1.1 -1.5 -1.6 -1.7 -1.8 -2.4
Secondary income 9.6 10.3 10.0 10.3 9.6 9.8 9.9 8.5 8.4
Current-account balance -18.6 -7.5 -6.0 -8.5 -8.5 -5.7 -6.2 -4.4 -4.3
Commonwealth of Independent Statesc
Trade balance 210.2 127.8 174.4 246.0 229.6 200.2 225.6 151.1 80.8
Services, net -30.1 -26.7 -34.0 -40.4 -56.7 -66.2 -67.8 -44.5 -29.6
Primary income -71.5 -58.6 -71.6 -97.1 -102.2 -111.4 -95.1 -52.2 -51.1
Secondary income 3.0 2.0 0.8 0.7 -1.3 -4.4 -3.9 0.3 1.5
Current-account balance 111.6 44.1 69.7 109.2 69.4 18.2 58.8 54.7 1.7
Developing economiesd
Trade balance 859.8 546.4 679.1 850.5 860.2 884.2 859.6 656.5 635.2
Services, net -190.0 -181.9 -210.2 -242.5 -273.3 -315.4 -414.6 -358.5 -354.0
Primary income -188.3 -216.5 -308.8 -389.2 -340.3 -400.1 -296.5 -306.0 -290.1
Secondary income 245.3 218.0 225.2 225.2 207.3 193.9 222.8 179.0 175.1
Current-account balance 726.8 366.0 385.3 444.0 453.8 362.5 371.3 170.9 166.1
Net fuel exporters
Trade balance 659.1 317.4 514.3 859.5 840.1 785.1 629.6 181.5 172.1
Services, net -207.5 -190.4 -210.6 -242.4 -254.1 -266.1 -290.0 -232.6 -197.5
Primary income -68.6 -65.0 -85.0 -115.6 -110.5 -105.6 -91.2 -63.1 -47.8
Secondary income 6.0 -6.8 -19.8 -30.1 -33.9 -44.2 -39.0 -58.9 -62.7
Current-account balance 389.0 55.1 198.9 471.4 441.5 369.2 209.4 -173.1 -136.0
Net fuel importers
Trade balance 200.8 229.0 164.8 -9.0 20.1 99.0 230.0 475.0 463.1
Services, net 17.5 8.5 0.4 -0.1 -19.2 -49.3 -124.6 -125.9 -156.5
Primary income -119.7 -151.4 -223.7 -273.6 -229.8 -294.6 -205.3 -242.9 -242.3
Secondary income 239.3 224.8 245.0 255.3 241.2 238.1 261.8 237.9 237.8
Current-account balance 337.8 310.9 186.4 -27.4 12.4 -6.7 161.9 344.1 302.0
Latin America and the Caribbean
Trade balance 40.4 51.2 45.5 67.1 38.2 2.8 -16.3 -52.4 2.9
Services, net -33.9 -36.2 -51.5 -68.8 -74.1 -81.2 -79.1 -57.9 -46.2
Primary income -113.8 -106.9 -153.6 -176.8 -162.2 -150.0 -156.5 -132.1 -131.3
Secondary income 68.3 58.3 62.7 64.6 63.5 64.3 68.0 69.6 76.0
Current-account balance -39.0 -33.6 -96.9 -113.9 -134.5 -164.1 -183.8 -172.8 -98.7
Africa
Trade balance 65.3 -15.6 27.2 51.5 12.7 -5.9 -54.4 -130.2 -115.8
Services, net -52.1 -43.9 -51.4 -66.1 -61.7 -62.3 -73.8 -49.2 -39.7
Primary income -59.1 -48.2 -56.3 -73.5 -75.7 -77.9 -66.7 -50.1 -41.7
Table A.15Balance of payments on current accounts, by country or country group, 2008–2016 (continued)

176 World Economic Situation and Prospects 2018
Billions of dollars
2008 2009 2010 2011 2012 2013 2014 2015 2016
Africa (continued)
Secondary income 67.1 62.8 70.6 75.3 81.4 83.6 99.2 85.2 77.6
Current-account balance 21.3 -44.9 -9.9 -12.9 -43.2 -62.5 -95.6 -144.2 -119.6
Western Asia Trade balance 343.6 164.5 264.0 459.4 537.6 491.0 421.8 128.0 91.2
Services, net -85.4 -75.3 -90.8 -99.7 -109.8 -116.7 -132.4 -106.4 -93.3
Primary income -6.1 -12.0 -16.2 -15.5 -9.0 -6.2 2.1 6.6 11.0
Secondary income -31.3 -40.5 -57.9 -70.1 -80.4 -89.8 -95.2 -106.0 -104.9
Current-account balance 220.8 36.6 99.2 274.1 338.5 278.3 196.2 -77.9 -96.1
East Asia Trade balance 410.6 346.2 342.3 272.5 271.7 396.3 508.4 711.1 656.9
Services, net -18.6 -26.4 -16.5 -7.9 -27.8 -55.3 -129.3 -145.0 -174.7
Primary income -9.4 -49.4 -82.7 -123.4 -93.5 -166.0 -75.4 -130.4 -128.1
Secondary income 141.2 137.4 149.8 155.5 142.7 135.8 150.7 130.1 126.4
Current-account balance 523.9 407.8 392.9 296.7 293.2 310.8 454.5 565.9 480.5
South Asia Trade balance 218.6 241.1 340.3 401.2 437.8 569.0 527.0 375.3 372.7
Services, net 86.0 72.3 69.8 123.0 85.8 110.2 73.4 124.0 110.5
Primary income -166.2 -55.5 -27.5 -73.3 -39.9 -111.8 -20.3 -59.9 -54.7
Secondary income -87.0 -112.2 -116.4 -127.1 -137.8 -176.5 -158.9 -165.5 -169.0
Current-account balance 51.4 145.3 266.2 323.7 345.7 390.8 421.0 273.8 259.4
World residuale
Trade balance 239.4 250.8 239.4 338.1 393.7 435.1 567.3 512.0 357.6
Services, net 124.6 60.4 74.8 70.5 124.0 90.3 117.6 100.9 127.8
Primary income -21.0 -150.9 -46.0 -26.0 -61.8 -29.7 -101.1 -7.0 -61.7
Secondary income -105.4 -114.5 -135.0 -140.7 -158.8 -172.8 -212.2 -199.8 -176.3
Current-account balance 237.5 45.7 133.1 241.9 297.1 322.7 371.5 406.0 247.3
Source: International Monetary Fund (IMF), World Economic Outlook database, October 2017.Note: IMF-WEO has adopted the sixth edition of the Balance of Payments Manual (BPM6).a Europe consists of the EU-15, the EU-13 and Iceland, Norway and Switzerland (Table A).b Includes Georgia.c Excludes Georgia, which left the Commonwealth of Independent States on 18 August 2009.d Libya has been excluded in the calculation due to unavailability of data.e Statistical discrepancy.
Table A.15Balance of payments on current accounts, by country or country group, 2007–2015 (continued)

177Annex tables
Table A.16Net ODA from major sources, by type, 1995–2016
Donor group or country
Growth rate of ODA (2015 prices and exchange rates)
ODA as a percentage
of GNI
Total ODA (millions
of dollars)
Percentage distribution of ODA by type, 2016
Bilateral Multilateral
1995-2005
2005-2013 2014 2015 2016 2016 2016 Total
Total (United Nations
& Other)United Nations Other
Total DAC countries 1.8 1.2 1.0 1.0 1.1 0.32 142619 71.5 28.5 4.1 24.4Total EU 1.8 1.3 1.1 1.0 1.1 0.51 81308 66.3 33.7 4.2 29.5
Austria 2.5 0.7 1.1 1.1 1.2 0.41 1583 61.3 38.7 2.6 36.1
Belgium 1.9 1.2 1.1 0.8 1.2 0.49 2306 62.1 37.9 5.9 32.0
Denmark 1.3 1.4 1.0 0.9 0.9 0.75 2372 71.7 28.3 9.7 18.6
Finland 2.3 1.6 1.1 0.8 0.8 0.44 1057 60.0 40.0 9.3 30.7
Francea 1.2 1.1 0.9 0.9 1.1 0.38 9501 57.4 42.6 3.7 39.0
Germany 1.3 1.4 1.2 1.1 1.4 0.70 24670 79.3 20.7 1.7 19.0
Greece .. .. 0.6 1.0 1.0 1.1 0.14 264 26.9 73.1 2.7 70.5
Ireland 4.7 1.2 1.0 0.9 1.1 0.33 802 53.0 47.0 16.4 30.6
Italy 3.1 0.7 1.2 1.0 1.2 0.26 4856 48.1 51.9 3.5 48.5
Luxembourg 3.9 1.7 1.0 0.9 1.1 1.00 384 70.7 29.3 9.9 19.5
Netherlands 1.6 1.1 1.0 1.0 0.9 0.65 4988 63.7 36.3 8.5 27.7
Portugal 1.5 1.3 0.9 0.7 1.1 0.17 340 37.5 62.5 3.5 59.0
Spain 2.2 0.8 0.8 0.7 2.9 0.33 4096 60.8 39.2 1.5 37.7
Sweden 2.0 1.7 1.1 1.1 0.7 0.94 4870 71.1 28.9 9.9 19.0
United Kingdom 3.4 1.7 1.1 1.0 1.0 0.70 18013 63.9 36.1 4.4 31.7
Australia 0.7 2.9 0.9 0.8 0.9 0.25 3025 73.2 26.8 8.7 18.1
Canada 1.8 1.3 0.9 1.0 0.9 0.26 3962 68.5 31.5 6.2 25.3
Japan 0.9 2.2 0.8 1.0 1.1 0.20 10368 68.0 32.0 4.2 27.7
New Zealand 2.2 1.7 1.1 0.9 1.0 0.25 438 81.7 18.3 9.0 9.3
Norway 2.2 2.0 0.9 0.8 1.0 1.11 4352 78.7 21.3 8.9 12.4
Switzerland 1.6 1.8 1.1 1.0 1.0 0.54 3563 78.1 21.9 6.6 15.3
United States 3.8 1.1 1.1 0.9 1.1 0.18 33589 83.2 16.8 2.1 14.7
Source: UN/DESA, based on OECD/DAC online database, available from http://www.oecd-ilibrary.org/statistics.a Excluding flows from France to the Overseas Departments, namely Guadeloupe, French Guiana, Martinique and Réunion.
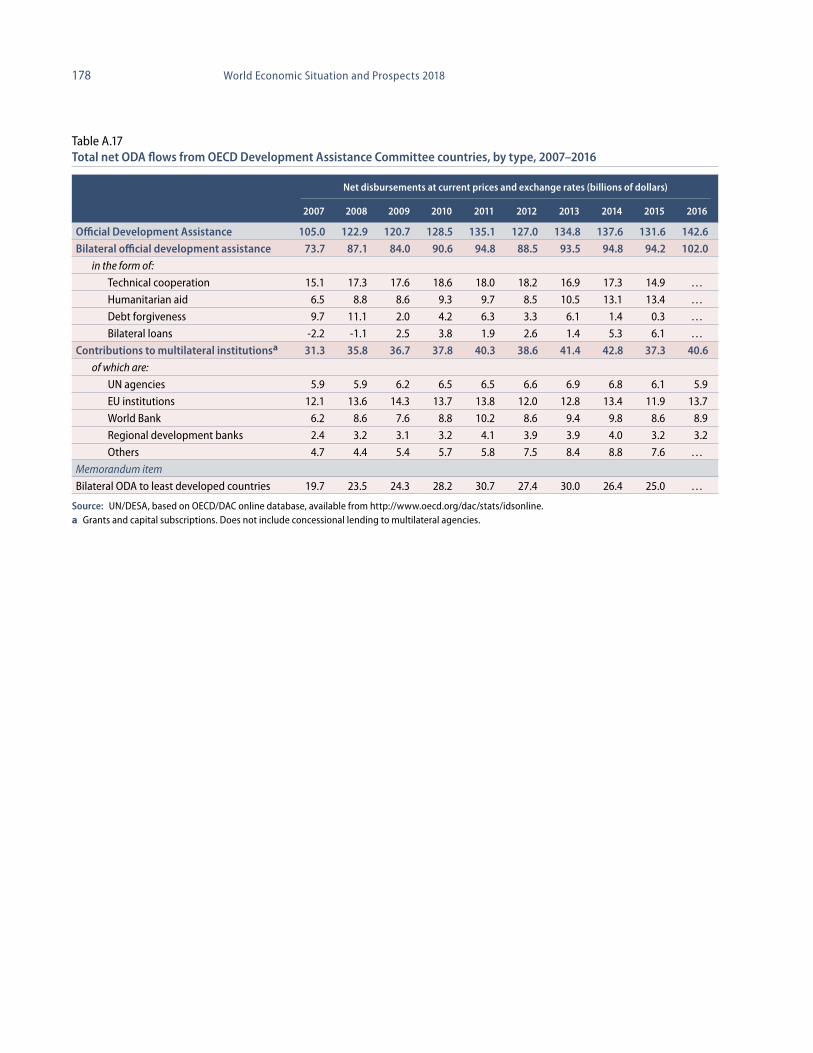
178 World Economic Situation and Prospects 2018
Table A.17Total net ODA flows from OECD Development Assistance Committee countries, by type, 2007–2016
Net disbursements at current prices and exchange rates (billions of dollars)
2007 2008 2009 2010 2011 2012 2013 2014 2015 2016
Official Development Assistance 105.0 122.9 120.7 128.5 135.1 127.0 134.8 137.6 131.6 142.6Bilateral official development assistance 73.7 87.1 84.0 90.6 94.8 88.5 93.5 94.8 94.2 102.0
in the form of:
Technical cooperation 15.1 17.3 17.6 18.6 18.0 18.2 16.9 17.3 14.9 …
Humanitarian aid 6.5 8.8 8.6 9.3 9.7 8.5 10.5 13.1 13.4 …
Debt forgiveness 9.7 11.1 2.0 4.2 6.3 3.3 6.1 1.4 0.3 …
Bilateral loans -2.2 -1.1 2.5 3.8 1.9 2.6 1.4 5.3 6.1 …
Contributions to multilateral institutionsa 31.3 35.8 36.7 37.8 40.3 38.6 41.4 42.8 37.3 40.6of which are:
UN agencies 5.9 5.9 6.2 6.5 6.5 6.6 6.9 6.8 6.1 5.9
EU institutions 12.1 13.6 14.3 13.7 13.8 12.0 12.8 13.4 11.9 13.7
World Bank 6.2 8.6 7.6 8.8 10.2 8.6 9.4 9.8 8.6 8.9
Regional development banks 2.4 3.2 3.1 3.2 4.1 3.9 3.9 4.0 3.2 3.2
Others 4.7 4.4 5.4 5.7 5.8 7.5 8.4 8.8 7.6 …
Memorandum item
Bilateral ODA to least developed countries 19.7 23.5 24.3 28.2 30.7 27.4 30.0 26.4 25.0 …
Source: UN/DESA, based on OECD/DAC online database, available from http://www.oecd.org/dac/stats/idsonline. a Grants and capital subscriptions. Does not include concessional lending to multilateral agencies.
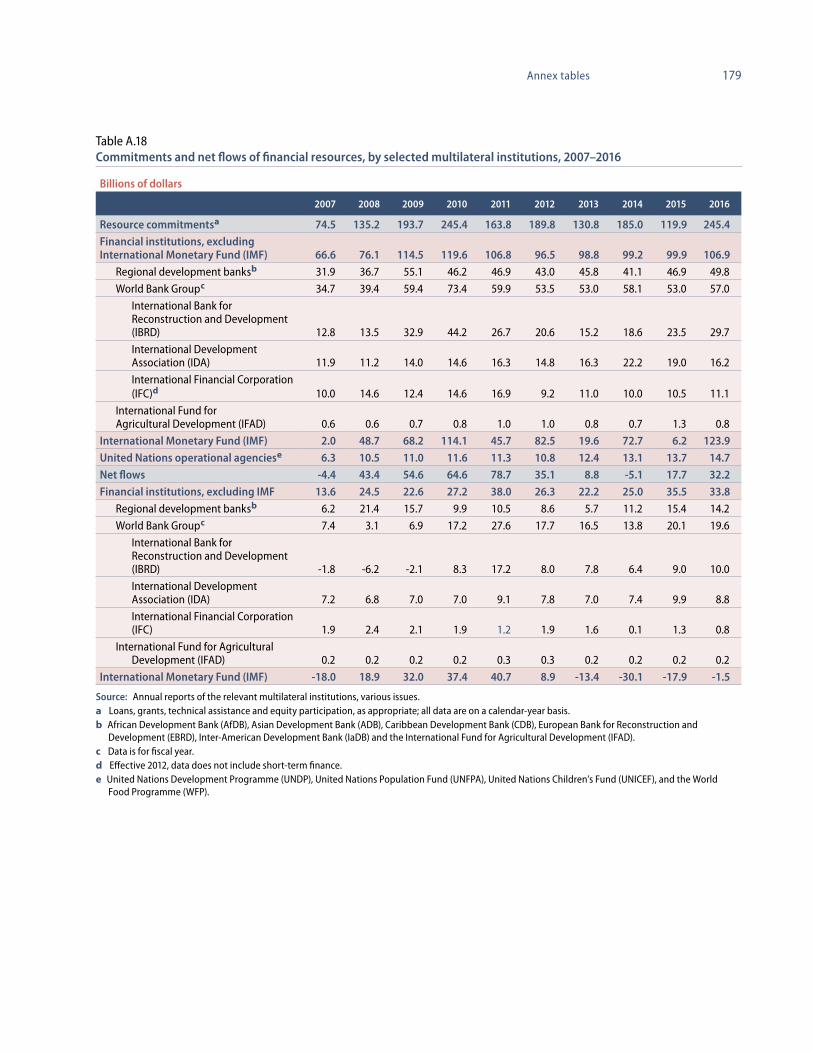
179Annex tables
Table A.18Commitments and net flows of financial resources, by selected multilateral institutions, 2007–2016
Billions of dollars
2007 2008 2009 2010 2011 2012 2013 2014 2015 2016
Resource commitmentsa 74.5 135.2 193.7 245.4 163.8 189.8 130.8 185.0 119.9 245.4Financial institutions, excluding International Monetary Fund (IMF) 66.6 76.1 114.5 119.6 106.8 96.5 98.8 99.2 99.9 106.9
Regional development banksb 31.9 36.7 55.1 46.2 46.9 43.0 45.8 41.1 46.9 49.8
World Bank Groupc 34.7 39.4 59.4 73.4 59.9 53.5 53.0 58.1 53.0 57.0
International Bank for Reconstruction and Development(IBRD) 12.8 13.5 32.9 44.2 26.7 20.6 15.2 18.6 23.5 29.7
International Development Association (IDA) 11.9 11.2 14.0 14.6 16.3 14.8 16.3 22.2 19.0 16.2
International Financial Corporation (IFC)d 10.0 14.6 12.4 14.6 16.9 9.2 11.0 10.0 10.5 11.1
International Fund for Agricultural Development (IFAD) 0.6 0.6 0.7 0.8 1.0 1.0 0.8 0.7 1.3 0.8
International Monetary Fund (IMF) 2.0 48.7 68.2 114.1 45.7 82.5 19.6 72.7 6.2 123.9United Nations operational agenciese 6.3 10.5 11.0 11.6 11.3 10.8 12.4 13.1 13.7 14.7Net flows -4.4 43.4 54.6 64.6 78.7 35.1 8.8 -5.1 17.7 32.2Financial institutions, excluding IMF 13.6 24.5 22.6 27.2 38.0 26.3 22.2 25.0 35.5 33.8
Regional development banksb 6.2 21.4 15.7 9.9 10.5 8.6 5.7 11.2 15.4 14.2
World Bank Groupc 7.4 3.1 6.9 17.2 27.6 17.7 16.5 13.8 20.1 19.6
International Bank for Reconstruction and Development(IBRD) -1.8 -6.2 -2.1 8.3 17.2 8.0 7.8 6.4 9.0 10.0
International Development Association (IDA) 7.2 6.8 7.0 7.0 9.1 7.8 7.0 7.4 9.9 8.8
International Financial Corporation (IFC) 1.9 2.4 2.1 1.9 1.2 1.9 1.6 0.1 1.3 0.8
International Fund for Agricultural Development (IFAD) 0.2 0.2 0.2 0.2 0.3 0.3 0.2 0.2 0.2 0.2
International Monetary Fund (IMF) -18.0 18.9 32.0 37.4 40.7 8.9 -13.4 -30.1 -17.9 -1.5
Source: Annual reports of the relevant multilateral institutions, various issues.a Loans, grants, technical assistance and equity participation, as appropriate; all data are on a calendar-year basis.b African Development Bank (AfDB), Asian Development Bank (ADB), Caribbean Development Bank (CDB), European Bank for Reconstruction and Development (EBRD), Inter-American Development Bank (IaDB) and the International Fund for Agricultural Development (IFAD).c Data is for fiscal year.d Effective 2012, data does not include short-term finance.e United Nations Development Programme (UNDP), United Nations Population Fund (UNFPA), United Nations Children’s Fund (UNICEF), and the World Food Programme (WFP).