weekly research review - csun.eduvcovrig/weekly research review 090517.pdfeekly research review ......
TRANSCRIPT

Tuesday, September 5, 2017
IIG Research
W eekly Research Review
D.A. Davidson & Co. Individual Investor Group • IIG Research – Seattle & Los Angeles • www.davidsoncompanies.com/indv
Weekly Market Update U.S. equities rallied for the second consecutive week, which
included the end of August and the first day of September. All major indices were higher and the Nasdaq Composite ended the week at a new all-time high. Sector gains were broad-based as eight of eleven S&P 500 GICS sectors moved higher led by five sector moves greater than 1.5%. The S&P 500 traded higher every day last week to close at 2,477, +1.4% for the week, and nearly at its 2,481 all-time high reached in early August. The Nasdaq Composite gained +2.7% and did set a new high. In Q3 (through September 1) the Nasdaq Composite was up +4.8%, with the S&P 500 +2.2%, and the Russell 2000 (small caps) -0.1%. Last week’s market surge was led by five big sector moves: Healthcare +3.0%, Technology +2.1%, Materials +1.9%, Consumer Discretionary +1.6%, and Industrials +1.5%.
The pre-Labor Day holiday week was light on corporate news, but included a heavy week of economic data related to both Q2 and Q3. Market moved higher despite the devastation in south Texas caused by Hurricane Harvey and rising tensions with North Korea. There was some evidence of flight-to-quality in the Treasury bond market as 10-year yields, at 2.14%, remained close to 2017 lows. The week’s economic data calendar ended with a worse than expected July jobs report as the BLS reported that non-farm payrolls increased +156,000, below the consensus estimate of 180,000. However, the rolling three-month average was +185,000 and the manufacturing jobs component was strong. Other data reflected solid personal income and outlays (evidence of a healthy consumer) and a much better than expected ISM manufacturing report. The Commerce Department revised higher the 2Q17 U.S. GDP report to +3.0% from +2.6% previously, as both consumer spending and non-residential business investment were above initial estimates. Inflation at +1.4% remained stubbornly low as many believe that wages must move higher to sustain GDP growth above 2.5%. Hurricane Harvey caused “500-year” flooding in Houston, and disrupted the nation’s energy infrastructure, shutting a major pipeline and taking 20% of U.S. refining capacity off-line. Retail gas prices surged 12% nationally, to $2.57 per gallon. Higher gasoline prices create a headwind to consumer spending, but prices were stable after refiners were hopeful to resume production. After North Korea fired a ballistic missile over Japan, tensions flared once again. While investors have largely discounted these tensions, North Korea remains a wild card that must be taken seriously, in our opinion.
Equity markets are lower to begin a holiday-shortened week as geopolitical tensions are high, and another powerful hurricane is heading for the U.S. Congress returns from its August recess and bonds continue to rally. Traders return from August-holiday after last week’s gains approaching new highs on light volume. Not surprisingly, indices are down more than 1% as the downside is tested, with weakness attributed to North Korea’s ongoing missile tests, despite economic sanctions and warnings from multiple countries. Hurricane Irma has reached category 5 status and could hit the coast of Florida later in the week. Congress has identified three major issues on its September schedule; raising the debt ceiling, passing a spending bill, and passing a reduction in corporate taxes. Some are hopeful that a hurricane-relief package could be rolled in to the spending bill and also make a debt-ceiling increase more likely. Equity market weakness is offset by a rally in bonds, the 10-year treasury yield is now 2.07%, as well as gains in oil and gold. The week also began with a large merger announcement as aerospace and industrial conglomerate United Technologies (UTX) agreed to acquire Rockwell Collins (COL), a leading provider of aviation electronics and interiors in a stock and cash deal valued at $30 billion. The agreement is subject to regulatory approval, which will look at industry consolidation and competition.
Source: FactSet; *Factset Consensus EPS (FFO for Real Estate)
Table of Contents: Event Calendar (page 2) Earnings Release Calendar (pages 3) Global Index Performance (page 4) Fixed Income Weekly (page 5) Money Flow Snapshot (pages 6-7) Trading Range Charts (pages 8-10) IIG Research Update (pages 11-18) Institutional Research Update (page 19)
Please refer to pages 20-21 of this report for detailed disclosure and certification information.
Close YTDS&P 500 2,476.55 +1.37% +10.62%Dow Jones Industrial Average 21,987.56 +0.80% +11.26%NASDAQ Composite 6,435.33 +2.71% +19.55%Russell 2000 1,413.57 +2.62% +4.16%MSCI EAFE 1,938.37 +0.55% +15.11%MSCI Emerging Markets 1,091.36 +0.55% +26.57%Bloomberg Commodity Index 84.98 +2.02% -2.90%Barclays U.S. Aggregate Bond 104.10 +0.06% +1.36%
Major Indices (Price Returns) Last Week
S&P 500Last Week YTD Current 10yr Avg Weight
Health Care +2.98% +17.64% 16.6x 13.8x 14.6%
Information Technology +2.21% +25.22% 18.6x 14.3x 23.4%
Materials +1.87% +11.11% 17.3x 14.7x 2.9%
Consumer Discretionary +1.56% +10.43% 20.0x 16.6x 12.1%
Industrials +1.50% +8.33% 17.5x 14.5x 10.1%
S&P 500 +1.37% +10.62% 17.6x 14.1x --
Energy +0.77% -16.08% 28.0x 18.9x 5.7%
Consumer Staples +0.51% +6.08% 19.5x 16.3x 8.5%
Real Estate +0.40% +6.62% 18.1x 17.2x 3.1%
Financials -0.10% +6.13% 13.5x 11.7x 14.3%
Utilities -0.64% +12.00% 18.3x 14.3x 3.2%
Telecom Services -1.35% -11.15% 12.8x 13.1x 2.1%
S&P 500 Sectors Price Returns Forward P/E*

Weekly Research Review — Tuesday, September 5, 2017
Event Calendar Conferences, Economics, Stock Splits, IPOs, Etc.
D.A. Davidson & Co. Individual Investor Group Research Page 2 of 22
GENERAL CALENDAR Tuesday, September 5
3-Month Treasury Bills auction ($39 billion) 6-Month Treasury Bills auction ($33 billion) 1-Month Treasury Bills auction ($20 billion) United Technologies Corp. @ Acquisition of Rockwell Collins, Inc Johnson & Johnson @ Barclays Consumer Staples Conference Enterprise Products Partners LP @ Barclays Energy Conference
Wednesday, September 6
Enbridge, Inc. @ Barclays CEO Energy Conference Occidental Petroleum Corp. @ Barclays CEO Energy Conference Express Scripts Holding Co. @ Wells Fargo Health Care Conference Johnson & Johnson @ Wells Fargo Health Care Conference NextEra Energy, Inc. @ Barclays CEO Energy Conference Kimberly-Clark Corp. @ Barclays Consumer Staples Conference Dollar General Corp. @ Goldman Sachs Retailing Conference Plains All American Pipeline LP @ Barclays Energy Conference IBM Corp. @ Drexel Hamilton TMT Conference AT&T, Inc. @ Drexel Hamilton TMT Conference Novartis AG @ Wells Fargo Health Care Conference Schlumberger NV @ Barclays Consumer Staples Conference
Thursday, September 7
Procter & Gamble Co. @ Barclays Consumer Conference Kinder Morgan, Inc. @ Barclays CEO Energy Conference The Home Depot, Inc. @ Goldman Sachs Healthcare Conference Duke Energy Corp. @ Barclays CEO Energy Conference Alphabet, Inc. @ Citi Global Technology Conference Expedia, Inc. @ Citi Global Technology Conference IBM Corp. @ Citi Global Technology Conference AT&T, Inc. @ Bank of America Communications Conference
Friday, September 8
Merck & Co., Inc. @ European Society for Oncology Congress QUALCOMM, Inc. @ Citi Global Technology Conference Sources: Company Reports, FactSet
STOCK SPLITS
Merrimack Pharmaceuticals, Inc. (MACK-$1.30-NASDAQ) Details: 1-for-10 ratio, payable 9/5, ex-date 9/6, announced 8/31
Sources: Company Reports, FactSet
ECONOMIC CALENDAR Consensus Last
Tuesday, September 5
Johnson Redbook Retail Sales (9/2, W/W%) — 0.2% Core Capital Goods Orders (July, M/M%) — 0.4% Durable Orders, ex-Trans (July, M/M%) 0.5% 0.5% Durable Orders (July, M/M%) -6.8% -6.8% Durable Shipments (July, M/M%) — 0.4% Factory Inventories (July, M/M%) — 0.2% Factory Orders (July, M/M%) -3.2% 3.2%
Wednesday, September 6
Domestic Auto Sales (August, SAAR) 4.6M 4.6M Domestic Light Truck Sales (August, SAAR) 8.4M 8.4M Total Light Vehicle Sales (August) 16.7M 16.7M MBA Mortgage Applications (9/1, W/W%) — -2.3% Weekly Retail Sales (9/2, W/W%) — 0.4% Trade Balance: Exports (July, M/M Chg) $192.9B $194.4B Trade Balance: Imports (July, M/M Chg) $237.5B $238.0B Trade Balance (July, M/M Chg) -$44.5B -$43.6B Markit PMI Services (August) 56.9 56.9 ISM Non-Mfg - Prices (August) — 55.7 ISM Non-Mfg (August) 55.1 53.9 BLS Payroll Guidance (2017) — -150.0K
Thursday, September 7
Continuing Jobless Claims (8/26) 1,942K 1,942K Initial Jobless Claims (9/2) 240.0K 236.0K Unit Labor Costs (Q2, Q/Q Ann.) 0.6% 0.6% Productivity (Q2, Q/Q Ann.) 1.2% 0.9% EIA Crude Oil Stocks (9/1, W/W Chg) — -5.4M EIA Distillate Stocks (9/1, W/W Chg) — 0.75M Cushing OK Crude Inventory (9/1) — 0.69M Total Fuel Ethanol Inventory (9/1) — 21.3M Fuel Ethanol Total Production (9/1) — 1.0M U.S. Refinery Utilization (Week Ended, 9/1) — 1.2% EIA Gasoline Stocks (9/1, W/W Chg) — 0.04M EIA Natural Gas Stocks (9/1, W/W Chg) — 30.0B M2 Money Supply (Week Ended, 8/28) — $39.6B
Friday, September 8
Wholesale Inventories (July, M/M%) 0.4% 0.4% Wholesale Sales (July, M/M%) — 0.7% Baker Hughes U.S. Rotary Gas Rigs (9/8) — 183.0 Baker Hughes U.S. Rotary Oil Rigs (9/8) — 759.0 Baker Hughes U.S. Rig Count (9/8) — 943.0 Consumer Credit (July) $14.8B $12.4B

Weekly Research Review — Tuesday, September 5, 2017
Earnings Release Calendar S&P 500, D.A. Davidson IIG Research, D.A. Davidson Institutional Research
D.A. Davidson & Co. Individual Investor Group Research Page 3 of 22
Source: FactSet YTD Market(A) D.A. Davidson & Co. makes a market in this security Dividend Total Cap Current Year Ago LT Growth ForwardTicker Company Name Sector Time (Expected) Yield Return ($mil) Qtr EPS Act. Rate P/E
TUESDAY, SEPTEMBER 5
(A) DLTH Duluth Holdings, Inc. Consumer Discretionary After-Market Davidson Institutional Research 0.0% -21.4% 579 $0.10 $0.11 20% 25.7xHPE Hewlett Packard Enterprise Co. Information Technology After-Market S&P 500 1.8% 7.1% 23,506 $0.26 $1.32 -8% 10.5x
WEDNESDAY, SEPTEMBER 6
(A) GFN General Finance Corp. Industrials Pre-Market Davidson Institutional Research 0.0% -18.0% 120 ($0.07) ($0.15) 11% ― (A) NCS NCI Building Systems, Inc. Industrials After-Market Davidson Institutional Research 0.0% 7.0% 1,188 $0.32 $0.32 13% 13.8x
THURSDAY, SEPTEMBER 7
(A) FNSR Finisar Corp. Information Technology After-Market Davidson Institutional Research 0.0% -23.4% 2,640 $0.40 $0.22 15% 10.1x
FRIDAY, SEPTEMBER 8
KR The Kroger Co. Consumer Staples Pre-Market S&P 500 2.2% -34.2% 20,118 $0.39 $0.40 4% 11.3x
Consensus Estimates

Weekly Research Review — Tuesday, September 5, 2017
Global Index Performance Global Equity and Commodity Index Performance Update
D.A. Davidson & Co. Individual Investor Group Research Page 4 of 22
3
U.S. Equities Closing
Level Last Week % Change
September % Change
Q3 2017 % Change
YTD 2017 % Change
1 Year % Change
% Off 52 Week High Low
NASDAQ Composite Index 6,435.33 2.71 0.10 4.80 19.55 23.11 0.39 27.83 Russell 2000 1,413.57 2.62 0.59 -0.13 4.16 14.02 2.65 22.27 S&P 500 2,476.55 1.37 0.20 2.19 10.62 14.08 0.57 18.85 Dow Jones Industrial Average 21,987.56 0.80 0.18 2.99 11.26 19.37 0.86 22.95 CBOE Market Volatility Index 10.13 -10.20 -4.34 -9.39 -27.85 -24.85 55.98 14.59 S&P 500 Sectors Sector
Weight %
Health Care 14.60 2.98 -0.08 2.24 17.64 11.93 0.08 22.82 Information Technology 23.44 2.21 -0.05 7.59 25.22 28.77 0.05 31.60 Materials 2.92 1.87 0.63 2.79 11.11 13.59 0.83 19.75 Consumer Discretionary 12.08 1.56 0.46 0.19 10.43 11.82 2.40 17.48 Industrials 10.09 1.50 0.15 -0.00 8.33 15.07 1.79 19.67 Energy 5.70 0.77 0.81 -2.62 -16.08 -7.69 18.34 2.38 Consumer Staples 8.49 0.51 0.41 -0.47 6.08 1.36 4.12 9.90 Real Estate 3.05 0.40 -0.08 1.91 6.62 -0.76 2.77 12.42 Financials 14.25 -0.10 0.44 0.16 6.13 24.71 2.53 29.69 Utilities 3.24 -0.64 -0.30 4.81 12.00 11.72 0.86 18.78 Telecommunications Services 2.13 -1.35 0.05 1.88 -11.15 -9.12 12.81 6.05 Growth & Value Closing
Level
Russell 2000 Growth 865.31 3.51 0.55 1.18 10.84 15.75 1.89 26.35 Russell 1000 Growth 1,244.07 2.08 0.08 4.36 18.08 18.92 0.21 24.52 S&P Mid Cap 400 Growth 797.57 1.94 0.34 -0.07 7.79 10.71 2.69 19.32 Russell 2000 Value 1,746.87 1.71 0.64 -1.46 -1.85 12.33 4.40 18.39 S&P Mid Cap 400 Value 588.57 1.41 0.47 -0.97 1.30 10.78 3.73 15.70 Russell 1000 Value 1,140.57 0.81 0.36 0.07 3.45 9.33 2.12 13.66 International Equities Closing
Level Last Week % Change
September % Change
Q3 2017 % Change
YTD 2017 % Change
1 Year % Change
% Off 52 Week High Low
Regions (USD)
MSCI The World Index 1,965.79 1.09 0.31 2.58 12.25 14.06 0.30 18.41 MSCI Europe 1,717.12 0.60 0.52 3.24 16.73 16.26 0.89 24.21 MSCI Emerging Markets 1,091.36 0.55 0.34 7.97 26.57 22.48 0.00 30.08 MSCI EAFE 1,938.37 0.55 0.39 2.93 15.11 14.39 0.87 20.09 MSCI Pacific 2,646.67 0.46 0.16 2.74 12.67 11.89 0.96 16.81 MSCI Frontier Markets 595.75 -0.06 0.25 5.69 19.30 21.89 0.39 22.49 Countries (USD)
MSCI Russia 564.66 4.08 0.56 10.74 -6.29 15.09 9.22 15.09 MSCI Canada 1,688.39 1.62 1.12 4.90 7.07 10.14 0.00 13.48 MSCI India 571.28 1.59 0.46 6.95 27.91 16.56 1.37 33.51 MSCI Brazil 2,038.52 1.44 2.04 19.90 21.93 23.45 0.00 32.74 MSCI United Kingdom 1,168.53 1.25 0.78 1.66 9.25 7.33 1.85 15.64 MSCI Italy 286.31 0.54 0.73 10.10 24.86 33.38 0.11 47.82 MSCI France 1,848.27 0.52 0.59 4.45 20.07 23.92 0.60 28.94 MSCI Japan 3,129.77 0.41 -0.04 1.90 10.94 10.64 1.41 16.45 MSCI China 81.53 0.34 -0.04 12.58 39.23 31.65 0.18 42.79 MSCI Australia 823.36 0.13 0.74 4.17 11.10 12.99 1.25 18.44 MSCI Germany 2,197.67 -0.16 0.59 2.68 16.08 18.18 0.49 25.44 Commodities Closing
Level Last Week % Change
September % Change
Q3 2017 % Change
YTD 2017 % Change
1 Year % Change
% Off 52 Week High Low
Natural Gas (NYM $/btu) 3.07 6.15 0.99 1.15 -17.56 9.96 21.88 19.73 Gold ($/ozt) 1,320.40 2.73 0.66 6.29 15.23 0.83 2.07 17.30 Bloomberg Commodity Index 84.98 2.02 0.38 2.88 -2.90 3.50 4.90 7.08 Crude Oil (NYM $/bbl) 47.29 -1.21 0.13 2.72 -11.97 9.57 13.15 11.19 Sources: FactSet Prices, MSCI Barra, Russell Investments, Standard & Poor’s

Weekly Research Review — Tuesday, September 5, 2017
Fixed Income Weekly
D.A. Davidson & Co. Individual Investor Group Research Page 5 of 22
The Fixed Income Weekly was not available at time of publication. We expect it to resume next week.
U.S. Treasury Yield Curve 9/1/17 8/1/17 6/1/17 9/1/16 3 Month 1.00% 1.07% 0.97% 0.32% 6 Month 1.09% 1.15% 1.07% 0.45% 1 Year 1.24% 1.22% 1.16% 0.58% 2 Year 1.35% 1.35% 1.29% 0.78% 3 Year 1.46% 1.49% 1.45% 0.90% 5 Year 1.73% 1.80% 1.76% 1.18% 10 Year 2.15% 2.25% 2.21% 1.57% 30 Year 2.77% 2.86% 2.86% 2.23%
1M 3M 6M 1Y 2Y 3Y 5Y 7Y 10Y 30Y0.0
0.5
1.0
1.5
2.0
2.5
3.0
3.5
4.0%One Year AgoOne Quarter AgoOne Month AgoLast
Reproduced with permission. ©2017 Morningstar Inc. All rights reserved. The information contained herein is not represented or warranted to be accurate, correct, complete, or timely. This report is for information purposes only, and should not be considered a solicitation to buy or sell any security

Weekly Research Review — Tuesday, September 5, 2017
Money Flow Snapshot Overbought/Oversold Levels for Focus List, Dividend Achievers, and Income Opportunities
For a copy of the full referenced report for companies mentioned, please contact your D.A. Davidson & Co. representative or call 1-800-389-8000. D.A. Davidson & Co. Individual Investor Group Research Page 6 of 22
Three Week Oversold/Overbought Ranges (Based on 15-day Relative Strength RSI)
ADP DG ENB EPD ESRX EXPE GSK IBM INTC KMB KMI LTC NVS CVS PAA HCP SLB JWN CIO SYF MSFT DUK EMR SYK NWE AAPL KBR GE Discretionary OXY AVY NEE JNJ PPG Energy Materials HBI VFC CB CMG PNC TCPC Industrials Real Estate MRK WPC DE OAK T UMPQ Staples Technology PG ZTS QCOM UTX Financials XOM S&P 500 Volatility Health Care Utilities
11-19 20-25 26-30 31-35 36-40 41-45 46-50 51-55 56-60 61-65 66-75 76-80 81-90
Four Month Oversold/Overbought Ranges (Based on 15-week Relative Strength RSI)
CB CVS DE DG EMR CIO ENB EXPE HCP JNJ INTC KBR KMI ADP NVS DUK EPD LTC JWN PNC HBI AAPL ESRX OAK MRK SYK PG MSFT GSK PPG NWE Discretionary WPC VFC GE PAA KMB TCPC SYF Financials ZTS Health Care CMG IBM QCOM OXY UMPQ UTX Industrials Materials Technology AVY SLB XOM Energy T Volatility Staples Real Estate Utilities S&P 500 NEE 11-19 20-25 26-30 31-35 36-40 41-45 40-50 51-55 56-60 61-65 66-75 76-80 81-90
Note: IIG Research Focus List stocks in blue.
Oversold Overbought
Oversold Overbought

Weekly Research Review — Tuesday, September 5, 2017
Money Flow Snapshot Overbought/Oversold Levels for Buy-Rated D.A. Davidson Institutional Research Stocks
For a copy of the full referenced report for companies mentioned, please contact your D.A. Davidson & Co. representative or call 1-800-389-8000. D.A. Davidson & Co. Individual Investor Group Research Page 7 of 22
Three Week Oversold/Overbought Ranges (Based on 15-day Relative Strength RSI)
ABDC AL AMAT ATEN AVGO CBFV ACIA CBI AER CDOR AHH FFWM AHT GBNK BCC AYR ARCC GFN CLW BRG BANR GPK COLM CHFC BOFI HPP DLTH CORR BSRR LITE EEFT AAOI DFS BUSE LMB GMRE BANC DST COLB MSBI GOOD CIT FFBC EBMT MTZ IP COF FFIV FDUS NANO IRET FLR GLAD FRME NLS KRG APTS FNB HAFC HFWA PDFS LLNW BFIN CIO FNGN HAS KLIC ROIC LRCX ELY CLAR FNSR HBAN MBFI RPT MAA FORM CPT FSIC HPT NAVI RYAM MKSI HBI GPT HIVE LTXB NTRI SLM NEWT HIW IPGP LKFN OCLR NXRT SMCI NSA IPAR KBR NKE PBH RTEC SONS TER KS OXM ESIO APOG NTCT PFBC SLRC SPWH TPC MLNX PWR EXP GWB PLAB PPBI TCPC SYF UBA SUM REXR EXTR HOPE QCRH UAA UMPQ WSFS WRK SWKS SNPS MNR NTAP RSYS VMI VBTX Mid Cap 400 WSBC TBK STRL NWPX TSC VSTO ZION WAL S&P 500 Russell 2000 USCR UFPI TRNO
11-19 20-25 26-30 31-35 36-40 41-45 46-50 51-55 56-60 61-65 66-75 76-80 81-90
This chart highlights the short-term RSI snapshot for D.A. Davidson Institutional Buy-rated stocks as of September 1, 2017, ex-vacated coverage. Benchmark indices are the S&P Mid Cap 400 and Russell 2000, shown in red.
Oversold Overbought

Weekly Research Review — Tuesday, September 5, 2017
Trading Range Charts Major Global Indices
D.A. Davidson & Co. Individual Investor Group Research Page 8 of 22
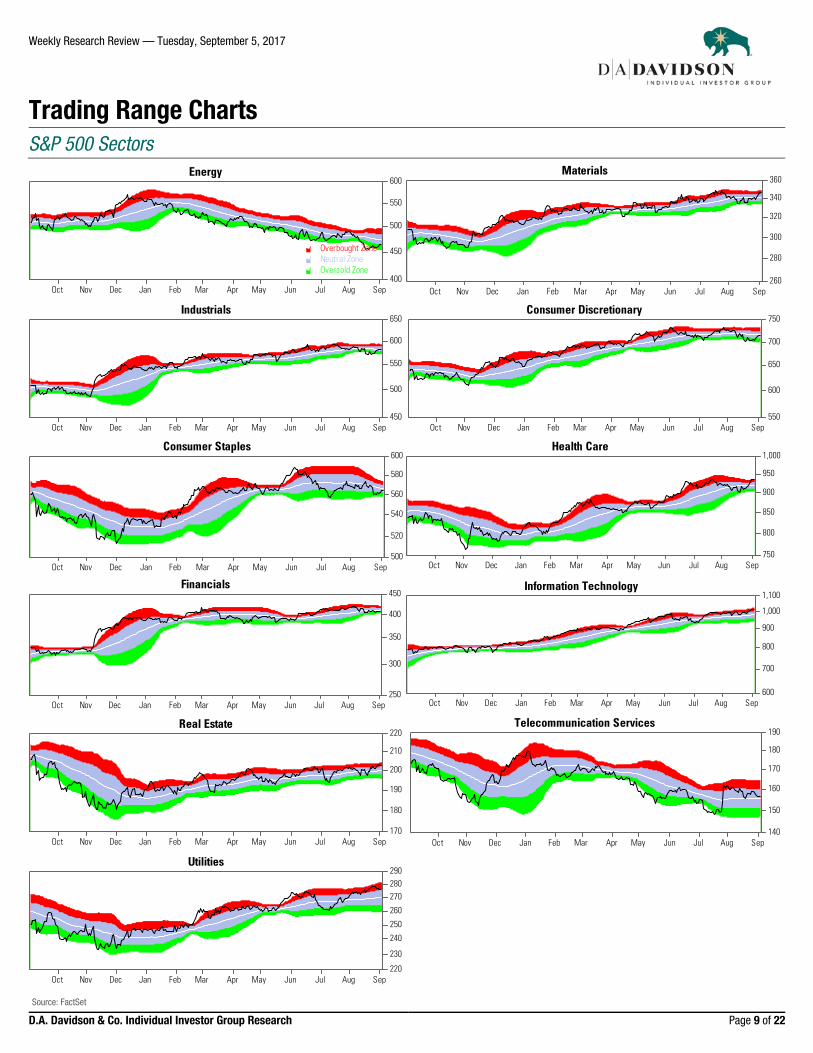
The following three pages highlight our 1-year trading range charts for the major global equity & fixed income indices, S&P 500 sectors, and ten major commodities. In each chart, the grey shading represents between one standard deviation above and below the dataset’s 50-day moving average. The red shading represents between one and two standard deviations above the 50-day moving average, and the green shading represents between one and two standard deviations below the 50-day moving average. Moves into and above the red shading are considered overbought, while moves into and below the green shading are considered oversold.
Oct Nov Dec Jan Feb Mar Apr May Jun Jul Aug Sep2,050
2,100
2,150
2,200
2,250
2,300
2,350
2,400
2,450
2,500
2,550S&P 500
Overbought ZoneNeutral ZoneOversold Zone
Oct Nov Dec Jan Feb Mar Apr May Jun Jul Aug Sep
17,000
18,000
19,000
20,000
21,000
22,000
23,000Dow Jones Industrial Average
Oct Nov Dec Jan Feb Mar Apr May Jun Jul Aug Sep4,600
4,800
5,000
5,200
5,400
5,600
5,800
6,000
6,200
6,4006,600
NASDAQ Composite
Oct Nov Dec Jan Feb Mar Apr May Jun Jul Aug Sep
1,400
1,450
1,500
1,550
1,600
1,650
1,700
1,750
1,800
1,850S&P Mid Cap 400
Oct Nov Dec Jan Feb Mar Apr May Jun Jul Aug Sep1,100
1,150
1,200
1,250
1,300
1,350
1,400
1,450
1,500Russell 2000
Oct Nov Dec Jan Feb Mar Apr May Jun Jul Aug Sep
1,550
1,600
1,650
1,700
1,750
1,800
1,850
1,900
1,950
2,000MSCI EAFE
Oct Nov Dec Jan Feb Mar Apr May Jun Jul Aug Sep800
850
900
950
1,000
1,050
1,100
1,150MSCI Emerging Markets
Oct Nov Dec Jan Feb Mar Apr May Jun Jul Aug Sep
100
101
102
103
104
105
106
107
108
109Barclays U.S. Aggregate Bond Index
Source: FactSet
Weekly Research Review — Tuesday, September 5, 2017
Trading Range Charts S&P 500 Sectors
D.A. Davidson & Co. Individual Investor Group Research Page 9 of 22
Oct Nov Dec Jan Feb Mar Apr May Jun Jul Aug Sep400
450
500
550
600Energy
Overbought ZoneNeutral ZoneOversold Zone
Oct Nov Dec Jan Feb Mar Apr May Jun Jul Aug Sep260
280
300
320
340
360Materials
Oct Nov Dec Jan Feb Mar Apr May Jun Jul Aug Sep450
500
550
600
650Industrials
Oct Nov Dec Jan Feb Mar Apr May Jun Jul Aug Sep
550
600
650
700
750Consumer Discretionary
Oct Nov Dec Jan Feb Mar Apr May Jun Jul Aug Sep500
520
540
560
580
600Consumer Staples
Oct Nov Dec Jan Feb Mar Apr May Jun Jul Aug Sep
750
800
850
900
950
1,000Health Care
Oct Nov Dec Jan Feb Mar Apr May Jun Jul Aug Sep250
300
350
400
450Financials
Oct Nov Dec Jan Feb Mar Apr May Jun Jul Aug Sep
600
700
800
900
1,000
1,100Information Technology
Oct Nov Dec Jan Feb Mar Apr May Jun Jul Aug Sep170
180
190
200
210
220Real Estate
Oct Nov Dec Jan Feb Mar Apr May Jun Jul Aug Sep140
150
160
170
180
190Telecommunication Services
Oct Nov Dec Jan Feb Mar Apr May Jun Jul Aug Sep220
230
240
250
260
270280290
Utilities
Source: FactSet

Weekly Research Review — Tuesday, September 5, 2017
Trading Range Charts Major Commodities
D.A. Davidson & Co. Individual Investor Group Research Page 10 of 22
Oct Nov Dec Jan Feb Mar Apr May Jun Jul Aug Sep38
40
42
4446485052545658
Crude Oil ($/bbl)
Overbought ZoneNeutral ZoneOversold Zone
Oct Nov Dec Jan Feb Mar Apr May Jun Jul Aug Sep2.40
2.60
2.80
3.00
3.20
3.40
3.603.804.004.20
Natural Gas ($/btu)
Oct Nov Dec Jan Feb Mar Apr May Jun Jul Aug Sep1,050
1,100
1,150
1,200
1,250
1,300
1,350
1,400
1,450Gold ($/ozt)
Oct Nov Dec Jan Feb Mar Apr May Jun Jul Aug Sep14
15
16
17
18
19
20
21
22Silver ($/ozt)
Oct Nov Dec Jan Feb Mar Apr May Jun Jul Aug Sep850
900
950
1,000
1,050
1,100
1,150
1,200
1,250Platinum ($/ozt)
Oct Nov Dec Jan Feb Mar Apr May Jun Jul Aug Sep1.80
2.00
2.20
2.40
2.60
2.80
3.003.203.40
Copper ($/lbs)
Oct Nov Dec Jan Feb Mar Apr May Jun Jul Aug Sep3.0
3.2
3.4
3.6
3.8
4.0
4.2Corn ($/bu)
Oct Nov Dec Jan Feb Mar Apr May Jun Jul Aug Sep
3
4
5
6Wheat ($/bu)
Oct Nov Dec Jan Feb Mar Apr May Jun Jul Aug Sep1.10
1.20
1.30
1.40
1.50
1.60
1.701.80
1.90Coffee ($/lbs)
Oct Nov Dec Jan Feb Mar Apr May Jun Jul Aug Sep
1.20
1.40
1.60
1.80
2.00
2.20
2.40Orange Juice ($/lbs)
Source: FactSet

Weekly Research Review — Tuesday, September 5, 2017
IIG Research Update Primary Research Coverage Summary
D.A. Davidson & Co. Individual Investor Group Research Page 11 of 22
Price (9/1/17)
Market Cap (mm) Rating Price
Target Sector Style Yield
Douglas A. Christopher, CFA • [email protected] • (213) 244-9338
Amgen Inc. AMGN (A) $178.71 $129,738 BUY/ADD $207.00 Health Care Large-Cap Blend 2.6% Duke Energy Corporation DUK $87.09 $60,854 BUY/ADD $90.00 Utilities Large-Cap Value 4.1% Healthcare Trust of America, Inc. Class A HTA $31.11 $6,240 BUY/ADD $33.00 Real Estate Income/Total Return 3.9% Kinder Morgan Inc Class P KMI $19.36 $43,452 BUY/ADD $26.00 Energy Income/Total Return 2.6% LTC Properties, Inc. LTC $48.79 $1,931 BUY/ADD $50.00 Real Estate Income/Total Return 4.7% NorthWestern Corporation NWE (A) $60.23 $2,917 BUY/ADD $63.00 Utilities Income/Total Return 3.5% Occidental Petroleum Corporation OXY $59.75 $46,348 BUY/ADD $87.00 Energy Large-Cap Growth 5.2% Plains All American Pipeline, L.P. PAA $21.84 $16,139 NEUTRAL $20.00 Energy Income/Total Return 10.1% Target Corporation TGT $56.22 $31,132 BUY/ADD $71.00 Consumer Discretionary Large-Cap Value 4.4% W. P. Carey Inc. WPC $69.34 $7,425 BUY/ADD $75.00 Real Estate Mid-Cap Value 5.8%
James D. Ragan, CFA • [email protected] • (206) 389-4070
Alphabet Inc. Class A GOOGL $951.99 $282,818 BUY/ADD $750.00 Information Technology Large-Cap Growth 0.0% Apple Inc. AAPL $164.05 $846,064 BUY/ADD $179.00 Information Technology Large-Cap Growth 1.5% Caterpillar Inc. CAT $118.28 $69,843 NEUTRAL $107.00 Industrials Large-Cap Growth 2.6% General Electric Company GE $25.14 $216,232 BUY/ADD $31.00 Industrials Large-Cap Growth 3.8% Harley-Davidson, Inc. HOG $47.37 $7,859 NEUTRAL $62.00 Consumer Discretionary Large-Cap Growth 3.1% Home Depot, Inc. HD $150.78 $180,624 NEUTRAL $157.00 Consumer Discretionary Large-Cap Growth 2.4% Intel Corporation INTC (A) $35.09 $165,452 BUY/ADD $42.00 Information Technology Large-Cap Value 3.1% Microsoft Corporation MSFT (A) $73.94 $568,503 BUY/ADD $75.00 Information Technology Large-Cap Value 2.1% Nordstrom, Inc. JWN $46.44 $7,717 BUY/ADD $57.00 Consumer Discretionary Large-Cap Growth 3.2% QUALCOMM Incorporated QCOM (A) $52.05 $75,896 BUY/ADD $75.00 Information Technology Large-Cap Growth 4.4% United Rentals, Inc. URI $120.56 $10,143 NEUTRAL $114.00 Industrials Mid-Cap Growth 0.0%
Matt G. Griffith, CFA • [email protected] • (206) 389-4011
Avery Dennison Corporation AVY $95.01 $8,424 BUY/ADD $118.00 Materials Mid-Cap Value 1.9% Deere & Company DE $116.14 $37,152 BUY/ADD $135.00 Industrials Large-Cap Value 2.1% PNC Financial Services Group, Inc. PNC $126.64 $59,934 BUY/ADD $144.00 Financials Large-Cap Value 2.4%
Brent P. Williams, CFA • [email protected] • (206) 389-4076
Costco Wholesale Corporation COST $158.24 $69,403 NEUTRAL $180.00 Consumer Staples Large-Cap Growth 1.3% Expedia, Inc. EXPE (A) $148.23 $20,580 BUY/ADD $190.00 Consumer Discretionary Large-Cap Growth 0.8% PPG Industries, Inc. PPG $104.59 $26,825 BUY/ADD $120.00 Materials Large-Cap Value 1.7% Stericycle, Inc. SRCL $71.74 $6,122 NEUTRAL $85.00 Industrials Mid-Cap Blend 0.0% Stryker Corporation SYK $141.09 $52,777 BUY/ADD $162.00 Health Care Large-Cap Growth 1.2% Zoetis, Inc. Class A ZTS $62.87 $30,856 BUY/ADD $65.00 Health Care Large-Cap Growth 0.7%

Weekly Research Review — Tuesday, September 5, 2017
IIG Research Update The Focus List – Best Ideas For Capital Appreciation
D.A. Davidson & Co. Individual Investor Group Research Page 12 of 22
Ticker Add Add Price Dividend 52 Week Beta Market Analyst Date Price (9/1) Yield High - Low Cap ($mil)
Consumer Discretionary
Chipotle Mexican Grill, Inc. CMG 4/19/16 $455.18 $319.95 0.0% $499 - $296 0.60 9,122 Morningstar Research (2) Dollar General Corporation DG 9/7/16 $71.95 $72.54 1.4% $81 - $66 0.94 19,892 Morningstar Research (2) Expedia, Inc. (A) EXPE 3/23/17 $127.45 $148.23 0.8% $161 - $106 1.10 20,580 Brent Williams, CFA (2) Nordstrom, Inc. JWN 3/12/14 $62.10 $46.44 3.2% $63 - $40 1.12 7,720 James Ragan, CFA (2)
Energy
Schlumberger NV (A) SLB 3/16/16 $73.23 $63.35 3.2% $88 - $63 0.86 88,023 Morningstar Research
Financials
PNC Financial Services Group, Inc PNC 9/30/16 $90.35 $126.64 2.4% $133 - $87 1.26 60,687 Matt Griffith, CFA(2) Synchrony Financial (A) SYF 1/14/16 $28.18 $30.92 1.9% $38 - $26 1.50 24,592 Arren Cyganovich, CFA(1) Umpqua Holdings Corporation (A) UMPQ 10/1/13 $16.41 $17.71 3.6% $20 - $15 1.45 3,900 Jeff Rulis (1)
Health Care
Express Scripts Holding Co. ESRX 9/30/13 $61.80 $62.16 0.0% $78 - $58 0.97 35,900 Morningstar Research Merck & Co., Inc. MRK 12/30/15 $52.35 $63.83 2.9% $67 - $58 0.81 174,586 Morningstar Research Stryker Corporation SYK 2/18/16 $97.04 $141.09 1.2% $149 - $106 0.96 52,777 Brent Williams, CFA(2) Zoetis, Inc. ZTS 11/14/16 $49.81 $62.87 0.7% $64 - $47 0.84 30,856 Brent Williams, CFA(2)
Industrials
Deere & Co DE 9/7/16 $84.16 $116.14 2.1% $132 - $80 0.99 37,149 Matt Griffith, CFA (2) General Electric Company GE 7/11/08 $27.75 $25.14 3.8% $32 - $24 0.90 217,661 James Ragan, CFA (2) KBR, Inc. (A) KBR 4/7/14 $26.58 $16.43 1.9% $18 - $13 1.70 2,298 Brent Thielman, CFA (2)
Information Technology
Apple, Inc. AAPL 9/25/15 $114.72 $164.05 1.5% $165 - $103 1.04 847,356 James Ragan, CFA (2) Intel Corporation (A) INTC 10/27/08 $14.40 $35.09 3.1% $38 - $33 1.08 164,888 James Ragan, CFA (2) QUALCOMM Inc. (A) QCOM 7/29/13 $75.68 $52.05 4.4% $72 - $51 1.23 76,901 James Ragan, CFA (2)
Materials
Avery Dennison Corporation AVY 3/2/17 $81.12 $95.01 1.9% $97 - $69 0.87 8,398 Matt Griffith, CFA (2) PPG Industries, Inc. PPG 7/31/17 $105.38 $104.59 1.7% $114 - $90 1.16 26,825 Brent Williams, CFA (2)
Focus List 2017 YTD Total Return & Current Yield 3.3% 2.1%
S&P 500 2017 YTD Total Return & Current Yield 12.2% 2.0% Focus List Total Return since inception (12/31/08) 192.8%
S&P 500 Total Return since 12/31/08 230.3% (1) D.A. Davidson & Co. Institutional Research analyst (2) D.A. Davidson & Co. Individual Investor Group Research analyst

Weekly Research Review — Tuesday, September 5, 2017
IIG Research Update The Focus List – Trading Range Charts
D.A. Davidson & Co. Individual Investor Group Research Page 13 of 22
Oct Nov Dec Jan Feb Mar Apr May Jun Jul Aug Sep80
90
100
110
120130140150160170180
Apple Inc. (AAPL)
Oct Nov Dec Jan Feb Mar Apr May Jun Jul Aug Sep65
70
75
80
85
90
95
100Avery Dennison Corp. (AVY)
Oct Nov Dec Jan Feb Mar Apr May Jun Jul Aug Sep
250
300
350
400
450
500
550Chipotle Mexican Grill Inc. (CMG)
Oct Nov Dec Jan Feb Mar Apr May Jun Jul Aug Sep70
80
90
100
110
120
130
140Deere Co. (DE)
Oct Nov Dec Jan Feb Mar Apr May Jun Jul Aug Sep50
60
70
80
90
100
110Dollar General Corp. (DG)
Oct Nov Dec Jan Feb Mar Apr May Jun Jul Aug Sep100
110
120
130
140
150
160
170Expedia Inc. (EXPE)
Oct Nov Dec Jan Feb Mar Apr May Jun Jul Aug Sep55
60
65
70
75
80
85Express Scripts Holding Co. (ESRX)
Oct Nov Dec Jan Feb Mar Apr May Jun Jul Aug Sep22
24
26
28
30
32
34General Electric Co. (GE)
Oct Nov Dec Jan Feb Mar Apr May Jun Jul Aug Sep31
32
33
34
35
36
37
3839
40Intel Corp. (INTC)
Oct Nov Dec Jan Feb Mar Apr May Jun Jul Aug Sep12
13
14
15
16
17
18
19
20KBR Inc. (KBR)
Oct Nov Dec Jan Feb Mar Apr May Jun Jul Aug Sep54
56
58
60
62
64
66
68
70Merck & Co., Inc. (MRK)
Oct Nov Dec Jan Feb Mar Apr May Jun Jul Aug Sep
30
35
40
45
50
55
606570
Nordstrom Inc. (JWN)
Oct Nov Dec Jan Feb Mar Apr May Jun Jul Aug Sep70
80
90
100
110
120
130
140PNC Financial Services Group, Inc (PNC)
Oct Nov Dec Jan Feb Mar Apr May Jun Jul Aug Sep85
90
95
100
105
110
115
120PPG Industries, Inc. (PPG)
Oct Nov Dec Jan Feb Mar Apr May Jun Jul Aug Sep45
50
55
60
65
70
75
80QUALCOMM Inc. (QCOM)
Source: FactSet

Weekly Research Review — Tuesday, September 5, 2017
IIG Research Update The Focus List – Trading Range Charts
D.A. Davidson & Co. Individual Investor Group Research Page 14 of 22
Oct Nov Dec Jan Feb Mar Apr May Jun Jul Aug Sep60
65
70
75
80
85
90
95Schlumberger NV (SLB)
Overbought ZoneNeutral ZoneOversold Zone
Oct Nov Dec Jan Feb Mar Apr May Jun Jul Aug Sep
100
110
120
130
140
150
160Stryker Corp. (SYK)
Oct Nov Dec Jan Feb Mar Apr May Jun Jul Aug Sep
22
24
26
28
30
323436384042
Synchrony Financial (SYF)
Oct Nov Dec Jan Feb Mar Apr May Jun Jul Aug Sep13
14
15
16
17
18
19202122
Umpqua Holdings Corp. (UMPQ)
Oct Nov Dec Jan Feb Mar Apr May Jun Jul Aug Sep
45
50
55
60
65
70Zoetis, Inc (ZTS)
Source: FactSet
Weekly Research Review — Tuesday, September 5, 2017
IIG Research Update Dividend Achievers – Best Ideas For Growth & Income
D.A. Davidson & Co. Individual Investor Group Research Page 15 of 22
Ticker Add Add Price Dividend Statistics 52 Week Beta Market Date Price (9/1) Yield 10yr Growth Increases High - Low Cap ($mil)
Consumer Discretionary
V.F. Corporation (A) VFC 11/17/16 $56.10 $63.58 2.6% 12.2% 43 years $64 - $48 0.80 25,026
Consumer Staples
CVS Health Corporation CVS 2/19/16 $96.89 $77.92 2.6% 27.0% 14 years $94 - $69 0.66 79,211 Kimberly-Clark Corporation KMB 12/29/08 $51.91 $123.21 3.1% 6.6% 44 years $136 - $111 0.56 43,530 The Procter & Gamble Company PG 11/1/05 $55.25 $92.53 3.0% 8.2% 61 years $93 - $81 0.52 235,953
Energy
Exxon Mobil Corporation XOM 6/17/09 $71.42 $76.57 4.0% 8.8% 35 years $93 - $76 0.83 324,435
Financials
Chubb Limited CB 9/4/15 $100.30 $140.49 2.0% 11.0% 22 years $150 - $121 0.63 65,386
Health Care
Johnson & Johnson JNJ 12/29/08 $58.15 $131.03 2.6% 8.0% 54 years $137 - $109 0.53 351,685 Novartis AG NVS 12/13/12 $63.07 $83.81 2.8% 7.4% 19 years $87 - $67 0.80 219,781
Industrials
Emerson Electric Co EMR 11/1/05 $35.12 $58.81 3.3% 7.4% 61 years $64 - $49 1.31 37,640 United Technologies Corporation UTX 12/28/08 $51.13 $117.92 2.4% 9.9% 23 years $125 - $98 0.81 94,191
Information Technology
Automatic Data Processing, Inc ADP 12/29/08 $38.08 $107.35 2.1% 11.1% 42 years $122 - $85 0.98 47,704 International Business Machines IBM 2/6/14 $174.67 $144.08 4.2% 17.5% 22 years $183 - $139 0.76 134,274 Microsoft Corporation (A) MSFT 2/24/15 $44.09 $73.94 2.1% 14.8% 14 years $75 - $56 1.13 569,504
Telecommunication Services
AT&T Inc. (A) T 11/1/05 $23.78 $37.48 5.2% 3.7% 33 years $43 - $36 0.74 230,127
Utilities
NextEra Energy, Inc. NEE 8/19/09 $57.17 $150.16 2.6% 8.8% 21 years $151 - $110 0.40 70,300 Dividend Achievers 2017 YTD Total Return & Current Yield 7.9% 3.0%
S&P 500 2017 YTD Total Return & Current Yield 12.2% 2.0% Dividend Achievers Total Return since inception (10/6/05) 201.4%
S&P 500 Total Return since 10/6/05 167.5%

Weekly Research Review — Tuesday, September 5, 2017
IIG Research Update Dividend Achievers – Trading Range Charts
D.A. Davidson & Co. Individual Investor Group Research Page 16 of 22
Oct Nov Dec Jan Feb Mar Apr May Jun Jul Aug Sep34
36
38
40
42
44
46AT&T Inc. (T)
Oct Nov Dec Jan Feb Mar Apr May Jun Jul Aug Sep80
85
90
95
100
105
110115120125
Automatic Data Processing Inc. (ADP)
Oct Nov Dec Jan Feb Mar Apr May Jun Jul Aug Sep115
120
125
130
135
140
145
150
155Chubb Ltd. (CB)
Oct Nov Dec Jan Feb Mar Apr May Jun Jul Aug Sep65
70
75
80
85
90
95
100
105CVS Health Corp. (CVS)
Oct Nov Dec Jan Feb Mar Apr May Jun Jul Aug Sep46
48
50
52
54
565860626466
Emerson Electric Co. (EMR)
Oct Nov Dec Jan Feb Mar Apr May Jun Jul Aug Sep70
75
80
85
90
95
100Exxon Mobil Corp. (XOM)
Oct Nov Dec Jan Feb Mar Apr May Jun Jul Aug Sep130
140
150
160
170
180
190International Business Machines Corp. (IBM)
Oct Nov Dec Jan Feb Mar Apr May Jun Jul Aug Sep105
110
115
120
125
130
135
140Johnson & Johnson (JNJ)
Oct Nov Dec Jan Feb Mar Apr May Jun Jul Aug Sep105
110
115
120
125
130
135
140
145Kimberly-Clark Corp. (KMB)
Oct Nov Dec Jan Feb Mar Apr May Jun Jul Aug Sep45
50
55
60
65
70
75
80Microsoft Corp. (MSFT)
Oct Nov Dec Jan Feb Mar Apr May Jun Jul Aug Sep100
110
120
130
140
150
160NextEra Energy Inc (NEE)
Oct Nov Dec Jan Feb Mar Apr May Jun Jul Aug Sep60
65
70
75
80
85
90Novartis AG ADS (NVS)
Oct Nov Dec Jan Feb Mar Apr May Jun Jul Aug Sep78
80
82
84
86
88
90
92
94
96Procter & Gamble Co. (PG)
Oct Nov Dec Jan Feb Mar Apr May Jun Jul Aug Sep95
100
105
110
115
120
125
130United Technologies Corp. (UTX)
Oct Nov Dec Jan Feb Mar Apr May Jun Jul Aug Sep
45
50
55
60
65
70VF Corp. (VFC)
Source: FactSet

Weekly Research Review — Tuesday, September 5, 2017
IIG Research Update Income Opportunities – Select List of Attractive Income Securities
D.A. Davidson & Co. Individual Investor Group Research Page 17 of 22
Ticker Add Add Price Dividend 52 Week Market Analyst Price Target/
Date Price (9/1) Yield High - Low Cap ($mil) Fair Value(B)
Consumer Discretionary
Hanesbrands Inc. (A) HBI 3/15/17 $19.96 $24.75 2.3% $26 - $19 9,021 Andrew Burns, CFA (1) $29.00 Target Corporation TGT 8/14/17 $55.65 $56.22 4.3% $79 - $50 30,709 Doug Christopher, CFA (2) $71.00
Energy
Enbridge Inc. ENB 2/27/17 $41.59 $40.45 4.4% $46 - $38 66,574 Morningstar Research $51.00 Enterprise Products Partners L.P. (A) EPD 12/29/15 $25.06 $26.09 6.3% $30 - $25 56,067 Morningstar Research $29.50 Occidental Petroleum Corp. OXY 4/22/15 $79.42 $59.75 5.1% $78 - $58 45,683 Doug Christopher, CFA (2) $87.00
Financials
Oaktree Capital Group, LLC OAK 4/22/15 $52.17 $45.55 7.2% $48 - $37 2,924 Morningstar Research $50.00 TCP Capital Corp. (A) TCPC 4/22/15 $16.13 $16.68 8.6% $17 - $15 981 Arren Cyganovich, CFA (1) $19.00
Healthcare
GlaxoSmithKline plc. GSK 4/22/15 $47.24 $40.20 5.0% $44 - $37 97,790 Morningstar Research $49.00
Real Estate
City Office REIT, Inc. (A) CIO 4/22/15 $13.17 $12.85 7.3% $13 - $12 389 Barry Oxford, CFA (1) $15.50 HCP, Inc. HCP 6/16/16 $35.51 $30.14 4.9% $40 - $28 14,135 Morningstar Research $33.00 LTC Properties, Inc. LTC 4/22/15 $44.11 $48.79 4.6% $54 - $44 1,930 Doug Christopher, CFA (2) $50.00 W.P. Carey, Inc. WPC 1/31/17 $61.94 $69.34 5.7% $69 - $56 7,412 Doug Christopher, CFA (2) $75.00
Utilities
Duke Energy Corp. DUK 1/12/16 $71.27 $87.09 4.0% $88 - $73 60,959 Doug Christopher, CFA (2) $90.00 NorthWestern Corp (A) NWE 10/12/16 $53.50 $60.23 3.4% $64 - $54 2,919 Doug Christopher, CFA (2) $63.00
Composition Statistics 2015 2016 2017
Added 15 3 4 Removed 3 2 3
Notes: (1) D.A. Davidson & Co. Institutional Research analyst (2) D.A. Davidson & Co. Individual Investor Group Research analyst
Shareholders receive K-1 statements for tax purposes from the following companies: EPD and OAK.
(A) D. A. Davidson & Co. makes a market in this security. (B) The price target and fair value estimates are sourced from the most recent research reports from D.A. Davidson’s Individual Investor Group Research, Institutional Research, or Morningstar Equity Research, a third-party source. For a copy of the most recent reports containing all required disclosure information for covered companies referenced in the Income Opportunities List, please contact your D.A. Davidson & Co. representative or call 1-800-755-7848.
Inception date for the Income Opportunities list is 4/22/2015. The Income Opportunities list is currently prepared by James Ragan, CFA and Doug Christopher, CFA. Sources: D.A. Davidson & Co., FactSet, Morningstar Equity Research

Weekly Research Review — Tuesday, September 5, 2017
IIG Research Update Income Opportunities – Trading Range Charts
D.A. Davidson & Co. Individual Investor Group Research Page 18 of 22
Oct Nov Dec Jan Feb Mar Apr May Jun Jul Aug Sep11
11.5
12
12.5
13
13.5
14
14.5City Office REIT, Inc. (CIO)
Oct Nov Dec Jan Feb Mar Apr May Jun Jul Aug Sep
70
72
74
76
78808284868890
Duke Energy Corp. (DUK)
Oct Nov Dec Jan Feb Mar Apr May Jun Jul Aug Sep36
38
40
42
44
46
48Enbridge Inc. (ENB)
Overbought ZoneNeutral ZoneOversold Zone
Oct Nov Dec Jan Feb Mar Apr May Jun Jul Aug Sep23
24
25
26
27
28
29
30
31Enterprise Products Partners L.P. (EPD)
Oct Nov Dec Jan Feb Mar Apr May Jun Jul Aug Sep
34
36
38
40
42
44
46
48GlaxoSmithKline PLC ADS (GSK)
Oct Nov Dec Jan Feb Mar Apr May Jun Jul Aug Sep26
28
30
32
34
36
38
40HCP Inc., Inc. (HCP)
Oct Nov Dec Jan Feb Mar Apr May Jun Jul Aug Sep18
20
22
24
26
28
30Hanesbrands Inc. (HBI)
Oct Nov Dec Jan Feb Mar Apr May Jun Jul Aug Sep
42
44
46
48
50
52
54
56LTC Properties Inc. (LTC)
Oct Nov Dec Jan Feb Mar Apr May Jun Jul Aug Sep52
54
56
58
60
62
64
66NorthWestern Corp. (NWE)
Oct Nov Dec Jan Feb Mar Apr May Jun Jul Aug Sep34
36
38
40
42
44
46
48
50Oaktree Capital Group, LLC (OAK)
Oct Nov Dec Jan Feb Mar Apr May Jun Jul Aug Sep55
60
65
70
75
80
85Occidental Petroleum Corp. (OXY)
Oct Nov Dec Jan Feb Mar Apr May Jun Jul Aug Sep
45
50
55
60
65
7075808590
Target Corp. (TGT)
Oct Nov Dec Jan Feb Mar Apr May Jun Jul Aug Sep14.5
15
15.5
16
16.5
17
17.5
18TCP Capital Corp. (TCPC)
Oct Nov Dec Jan Feb Mar Apr May Jun Jul Aug Sep50
55
60
65
70
75W.P. Carey, Inc. (WPC)
Source: FactSet

Weekly Research Review — Tuesday, September 5, 2017
Institutional Research Update Morning Research Summary – Last Week’s Publications
D.A. Davidson & Co. Individual Investor Group Research Page 19 of 22
Tuesday, August 29
Link to Morning Research Summary Industry Update:
• Financial Institutions Industry • Paper & Forest Products Industry • Real Estate Industry
Wednesday, August 30
Link to Morning Research Summary Industry Update:
• Construction Industry • Financial Institutions Bison Select
Thursday, August 31
Link to Morning Research Summary New Research Coverage: ACIW(A)
Company Updates: FORM(A)
Friday, September 1
Link to Morning Research Summary New Research Coverage: FCCY(A), NFBK(A), OSBC(A), PFS(A), UMH(A)
Earnings Reports: DY(A), GEF(A), OXM(A)
Earnings Preview: DLTH(A)
Company Updates: BANC(A) Tuesday, September 5
Link to Morning Research Summary Earnings Reports: LULU(A), XCRA(A) Industry Update:
• Financial Institutions Industry • Institutional Special Report

Weekly Research Review — Tuesday, September 5, 2017 Copyright D.A. Davidson & Co., 2017. All rights reserved. Member SIPC.
Required Disclosures
D.A. Davidson & Co. Individual Investor Group Research Page 20 of 22
D.A. Davidson & Co. expects to receive, or intends to seek, compensation for investment banking services from the companies mentioned in this report in the next three months.
D.A. Davidson & Co. is a full service investment firm that provides both brokerage and investment banking services. The analysts identified in this report will receive compensation that is based upon (among other factors) D.A. Davidson & Co.’s investment banking revenue. D.A. Davidson & Co.’s analysts, however, are not directly compensated for involvement in specific investment banking transactions.
James Ragan, the analyst who prepared this report, or his immediate family owns an investment position in: AAPL, COST, GE, GOOGL, IBM, INTC, MRK, MSFT, PAA, QCOM, SLB, T
Doug Christopher, the analyst who prepared this report, or his immediate family owns an investment position in: EPD, ENB, HBI, KMI
Matt Griffith, the analyst who prepared this report, or his immediate family owns an investment position in: ADP, CVS, DE, PNC, VFC
Brent Williams, the analyst who prepared this report, or his immediate family owns an investment position in: CMG, EXPE, ESRX, KBR, JWN, SRCL, SYF, UMPQ
The following disclosures apply to stocks mentioned in this report if and as indicated: (A) D.A. Davidson & Co. was making a market in this company’s securities at the time this report was published.
Analyst Certification: The analysts identified in this report attest that (i) all the views expressed accurately reflect their personal views about the common stock of the subject company, and (ii) no part of their compensation was, is, or will be, directly or indirectly, related to the specific recommendations or views expressed in the report.
Ratings Information
Buy/Add - Security appears undervalued based on our current view of valuation measures, expectations, and its risk profile.
Neutral - Security appears fairly valued based on our current view of valuation measures, expectations, and its risk profile.
Sell/Reduce - Security appears over-valued based on our current view of valuation measures, expectations, and its risk profile.
Rating Distribution (as of 6/30/2017) Coverage Universe Distribution Investment Banking Distribution azbycx IR IIG Combined IR IIG Combined BUY/ADD (Buy) 56% 78% 58% 13% 0% 11% NEUTRAL (Hold) 43% 19% 40% 6% 0% 5% SELL/REDUCE (Sell) 1% 3% 2% 0% 0% 0%
IIG denotes Individual Investor Group Research; IR denotes Institutional Research whose rating scale is Buy, Neutral, Underperform. Investment Banking Distribution denotes companies from whom D.A. Davidson & Co. has received compensation in the last 12 months. Price targets are an evaluation of price potential over the next 12-18 months based upon assessment of future earnings and cash flow, comparable company valuations, growth prospects and other financial criteria. Certain risks may impede achievement of these price targets including, but not limited to, broader market and macroeconomic fluctuations and unforeseen changes in the subject company’s fundamentals or business trends
Focus List Securities Selection and Publication Process: The Focus List is prepared by James Ragan and Brent Williams of D.A. Davidson & Co.’s Individual Investor Research Group. To be eligible for inclusion on the Focus List, securities must be covered by D.A. Davidson’s Individual Investor Group Research, Institutional Research, or Morningstar Equity Research (the “Research Universe”). In addition, the security must be rated an equivalent “Buy” from D.A. Davidson Individual Investor Group or Institutional Research, or 3 stars or higher by Morningstar at the time the security is added to the Focus List. The Focus List may also include Exchange Traded Funds (ETFs). To be eligible for inclusion on the Focus List, an ETF must be rated between 3 and 5 stars by Morningstar. Other than Mr. Ragan and Mr. Williams, D.A. Davidson analysts who publish Institutional or Individual Investor Group research are not involved in the preparation of the Focus List.
Of all the eligible securities from the Research Universe, as well as eligible ETFs, those ultimately selected for inclusion on the Focus List represent those believed by Mr. Ragan and Mr. Williams to represent the current ideas considered most timely at the time it is added to the Focus List. While the time horizon for eligible securities from D.A. Davidson’s Individual Investor Group and Institutional Research and that of Morningstar is typically 12-18 months, the Focus List will be a periodic publication that will select the timeliest eligible securities as of the date of its publication. If the rating on a security included on the Focus List is changed by the covering analyst from D.A. Davidson’s Individual Investor Group Research, Institutional Research, or the covering analyst from Morningstar in such a way that it is no longer an eligible security, that security will automatically be removed from the Focus List. In addition to a change in the rating, other factors, including a change in market or sector conditions, company or industry fundamentals, or discontinuance of coverage by the covering analyst, may also cause a security to be removed from the Focus List. A security on the Focus List may be removed from the list even if it is still an eligible security based on Mr. Ragan and Mr. Williams’ determination that it is no longer timely. The Focus List will disclose any securities removed from the list in the first publication following the removal of the security.

Weekly Research Review — Tuesday, September 5, 2017 Copyright D.A. Davidson & Co., 2017. All rights reserved. Member SIPC.
Required Disclosures
D.A. Davidson & Co. Individual Investor Group Research Page 21 of 22
Dividend Achievers Securities Selection and Publication Process: Dividend Achievers is prepared by James Ragan and Matt Griffith of D.A. Davidson & Co.’s Individual Investor Research Group. To be eligible for inclusion in Dividend Achievers, securities must be covered by D.A. Davidson’s Individual Investor Group Research, Institutional Research, or Morningstar Equity Research (the “Research Universe”). Other than Mr. Ragan and Mr. Griffith, D.A. Davidson analysts who publish Institutional or Individual Investor Group research are not involved in the preparation of Dividend Achievers.
Of all the eligible securities from the Research Universe, those ultimately selected for inclusion in Dividend Achievers will have a minimum 10-year history of consecutive dividend increases and, in the opinion of Mr. Ragan and Mr. Griffith, have a positive outlook for future growth. The overall dividend yield for Dividend Achievers is expected to be above the average market yield. Dividend Achievers may not have holdings in all sectors at all times, but Mr. Ragan and Mr. Griffith strive to maintain diversity across most economic sectors. Dividend Achievers will be a periodic publication that will highlight the current securities included. Securities may be removed from Dividend Achievers if the underlying company fails to sustain its record of consecutive annual dividend increases or if there is a significant change in company fundamentals. Changes to Dividend Achievers may also be prompted by Mr. Ragan and Mr. Griffith’s views of the risk/reward profile offered by individual securities. Dividend Achievers will disclose any securities removed from the list in the first publication following the removal of the security.
Income Opportunities Securities Selection and Publication Process: Income Opportunities is prepared by James Ragan and Doug Christopher of D.A. Davidson & Co.’s Individual Investor Research Group. To be eligible for inclusion on the Income Opportunities list, securities must be covered by D.A. Davidson’s Individual Investor Group Research, Institutional Research, or Morningstar Equity Research (the “Research Universe”). In addition, the security must be rated an equivalent “Buy” from D.A. Davidson Individual Investor Group or Institutional Research, or 3 stars or higher by Morningstar at the time the security is added to the Income Opportunities list. The Income Opportunities list may include common stocks, limited partners (LP and MLP) units, and Real Estate Investment Trust (REIT) shares. Other than Mr. Ragan and Mr. Christopher, D.A. Davidson analysts who publish Institutional or Individual Investor Group research are not involved in the preparation of the Income Opportunities list. Of all the eligible securities from the Research Universe, those ultimately selected for inclusion on the Income Opportunities list represent those believed by Mr. Ragan and Mr. Christopher to represent the current ideas considered most timely at the time it is added to the Income Opportunities list. While the time horizon for eligible securities from D.A. Davidson’s Individual Investor Group and Institutional Research and that of Morningstar is typically 12-18 months, Income Opportunities will be a managed list that is periodically updated as deemed appropriate. If the rating on a security included on the Income Opportunities list is changed by the covering analyst from D.A. Davidson’s Individual Investor Group Research, Institutional Research, or the covering analyst from Morningstar in such a way that it is no longer an eligible security, that security will automatically be removed from the Income Opportunities list. In addition to a change in the rating, other factors, including a change in market or sector conditions, company or industry fundamentals, or discontinuance of coverage by the covering analyst, may also cause a security to be removed from the Income Opportunities list. A security on the Income Opportunities list may be removed from the list even if it is still an eligible security based on Mr. Ragan and Mr. Christopher’s determination that it is no longer timely. The Income Opportunities list will disclose any securities removed from the list in the first publication following the removal of the security. Important Notice: The purchase of Master Limited Partnerships (MLPs) and some Mortgage REITs in an IRA, qualified plan, or Charitable Remainder Trust may trigger an IRS 990-T filing if the MLP/Mortgage REIT generates $1,000 or more of Unrelated Business Taxable Income (“UBTI”). UBTI is reported by an MLP on its annual form K-1. This is provided for informational purposes only and does not constitute tax advice. D.A. Davidson & Co. does not provide tax advice and investors should consult with their tax professional before investing.
Other Disclosures: The information contained herein has been obtained by sources we consider reliable, but is not guaranteed. Any opinions expressed are based on our interpretation of data available to us at the time of the original publication of the report. Assumptions, opinions, and estimates constitute our judgment as of the date of this report and are subject to change without notice. Investors must bear in mind that inherent in investments are the risks of fluctuating prices and the uncertainties of dividends, rates of return and yield, as well as broader market and macroeconomic fluctuations and unforeseen changes in the fundamentals or business trends affecting the securities referred to in this report. Investors should also remember that past performance is not necessarily an indicator of future performance and D.A. Davidson & Co. makes no guarantee, express or implied, as to future performance. The information is not intended to be used as the primary basis for investment decisions. Because of individual client requirements, it should not be construed as advice designed to meet the particular investment needs of any investor. It is not a representation by us, or an offer, or the solicitation of an offer, to sell or buy any security. Further, a security described in a report may not be eligible for solicitation in the states in which a client resides. Further information and elaboration is available upon request.
For a copy of the most recent reports containing all required disclosure information for covered companies referenced in this report, please contact your D.A. Davidson & Co. representative or call 206-389-8000.

Weekly Research Review — Tuesday, September 5, 2017
IIG Research Contacts
D.A. Davidson & Co. Individual Investor Group Research Page 22 of 22
CONTACT INFORMATION James D. Ragan, CFA Director of IIG Research 206.389.4070 [email protected]
Douglas A. Christopher, CFA Senior Research Analyst 213.244.9338 [email protected]
Matthew G. Griffith, CFA Senior Research Analyst 206.389.4011 [email protected]
Brent P. Williams, CFA Research Analyst 206.389.4076 [email protected]
Brooke K. Van Lohuizen Research Associate 206.903.8674 [email protected]
Joseph-Andrew L. Malach Research Associate 206.389.4082 [email protected]