weekly projects update - w/e 17th june
TRANSCRIPT

Weekly Waste Projects Update – week ending 17th
June 2016
Weekly Waste Projects Update: week ending 17th
June 2016 Source: AcuComm Business Database
01
New/Updated Projects Reported (w/e 17th June 2016)
Number
Estimated Value (all projects)
Estimated Value (new projects only)
US$ millions US$ millions
Anaerobic Digestion 4 55 41
Biofuel 3 298 298
Biogas 4 63 27
Gasification 1 96 -
Incineration (with energy recovery) 16 2,154 606
Incineration (without energy recovery) - - -
Integrated/mixed facilities 3 285 -
Landfill 5 196 158
MBT 2 87 16
Other - - -
Recycling 8 376 280
Waste processing 1 50 50
Total 47 3,661 1,476
In the week ended 17th June 2016, AcuComm added 47 new or updated waste projects to
our Business Database, worth an estimated US$3,661million and waste capacity of just over
9.6 million tonnes.
This takes the cumulative total to 4,152 active projects since 2013,
with a total estimated investment value of US$316.5 billion.
Biofuel
34.3%
Recycling
32.1%
Landfill
18.1%
Waste processing
5.8%
Anaerobic Digestion
4.7%
Others
5.0%
Est. Value of New Projects by Facility Type (w/e 17th Jun 2016)
To find out more information about the projects and investments
covered in this update, click here

Weekly Waste Projects Update – week ending 17th
June 2016
Weekly Waste Projects Update: week ending 17th
June 2016 Source: AcuComm Business Database
02
New/Updated Projects Reported (w/e 17th June 2016)
Number Capacity (tonnes) MW
Anaerobic Digestion 4 154,062 9
Biofuel 3 408,847 20
Biogas 4 235,239 9
Gasification 1 199,940 29
Incineration (with energy recovery) 16 4,212,276 1,035
Incineration (without energy recovery) - - -
Integrated/mixed facilities 3 1,307,792 93
Landfill 5 1,973,574 13
MBT 2 288,857 9
Other - - -
Recycling 8 661,480 -
Waste processing 1 172,570 -
Total 47 9,614,637 1,217
The total estimated waste capacity of projects reported on
in the past week is just over 9.6 million tonnes. WtE
incineration was the largest category, accounting for just
over 4.2 million tonnes.
The total estimated power generation from these projects
was 1,217 MW. WtE incineration was the largest category,
accounting for 1,035 MW.
Incineration (with
energy recovery)
43.8%
Landfill
20.5%
Integrated/mixed
facilities
13.6%
Others
22.1%
Reported Capacity of Projects by Facility Type (w/e
17th Jun 2016)
To find out more information about the projects and investments
covered in this update, click here

Weekly Waste Projects Update – week ending 17th
June 2016
Weekly Waste Projects Update: week ending 17th
June 2016 Source: AcuComm Business Database
03
New Projects Reported by Waste Types (w/e 17th June 2016)
Number Capacity (tonnes) MW
Animal 2 107,618 1
Clinical - - -
Construction/Demolition - - -
e-Waste 1 55,015 -
Food 3 87,346 7
Gas 2 - 13
Glass - - -
Hazardous 2 128,583 -
Heat 1 230,000 104
Industrial 2 207,585 -
Metals 2 305,551 -
MSW 15 5,090,475 462
Oil - - -
Organic (general/unspecified) 4 1,445,059 167
Other 1 265,821 8
Paper - - -
Plant biomass (non-waste) 1 55,000 7
Plant biomass (waste) 1 66,717 2
Plastics 1 15,400 -
Radioactive - - -
Rubber - - -
Sewage/wastewater - - -
Wood 9 1,554,467 446
Total 47 9,614,637 1,217
Municipal Solid Wate (MSW) was the leading
feedstock type reported on in the past week,
accounting for an estimated 5.1 million tonnes, or
52.9% of the total.
MSW
52.9%
Wood
16.2%
Organic
(general/unspecified)
15.0%
Others
15.9%
Reported Capacity of Projects by Waste Type (w/e
17th Jun 2016)
To find out more information about the projects and investments
covered in this update, click here

Weekly Waste Projects Update – week ending 17th
June 2016
Weekly Waste Projects Update: week ending 17th
June 2016 Source: AcuComm Business Database
04
New/Updated Projects, Country Coverage, (w/e 17th June 2016)
Projects
USA 8
UK 7
Spain 3
Indonesia 2
Canada 2
Belarus 2
Japan 2
Estonia 2
Sweden 2
Finland 2
Others 15
Total 47
The leading countries in the past week were the
USA with eight projects and the UK with seven.
8
7
3
2 2 2 2 2 2 20
15
0
2
4
6
8
10
12
14
16
US
A
UK
Sp
ain
Ind
on
es
ia
Can
ad
a
Bela
rus
Jap
an
Es
ton
ia
Sw
ed
en
Fin
lan
d
Oth
ers
Reported Projects by Country (w/e 17th Jun 2016)
To find out more information about the projects and investments
covered in this update, click here
Weekly Waste Projects Update – week ending 17th
June 2016
Weekly Waste Projects Update: week ending 17th
June 2016 Source: AcuComm Business Database
05
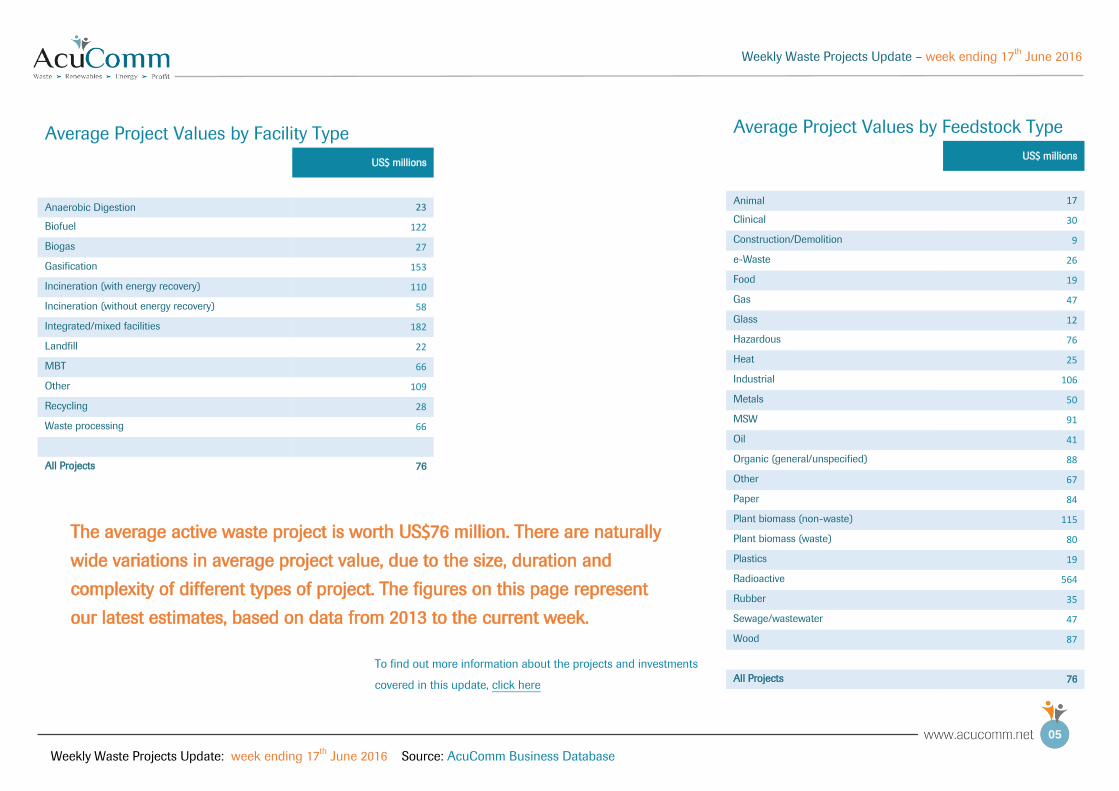
Average Project Values by Facility Type
US$ millions
Anaerobic Digestion 23
Biofuel 122
Biogas 27
Gasification 153
Incineration (with energy recovery) 110
Incineration (without energy recovery) 58
Integrated/mixed facilities 182
Landfill 22
MBT 66
Other 109
Recycling 28
Waste processing 66
All Projects 76
Average Project Values by Feedstock Type
US$ millions
Animal 17
Clinical 30
Construction/Demolition 9
e-Waste 26
Food 19
Gas 47
Glass 12
Hazardous 76
Heat 25
Industrial 106
Metals 50
MSW 91
Oil 41
Organic (general/unspecified) 88
Other 67
Paper 84
Plant biomass (non-waste) 115
Plant biomass (waste) 80
Plastics 19
Radioactive 564
Rubber 35
Sewage/wastewater 47
Wood 87
All Projects 76
The average active waste project is worth US$76 million. There are naturally
wide variations in average project value, due to the size, duration and
complexity of different types of project. The figures on this page represent
our latest estimates, based on data from 2013 to the current week.
To find out more information about the projects and investments
covered in this update, click here

Weekly Waste Projects Update – week ending 17th
June 2016
Weekly Waste Projects Update: week ending 17th
June 2016 Source: AcuComm Business Database
06
Top Five Projects, week ending 17th June 2016, by Estimated Value (US$ millions) Click the flag for more information on each project
1 Sweden 406 Construction of a 90 MW cogeneration plant.
2 Poland 257 Construction of a 220 MW RDF-fuelled CHP plant.
3 UK 240 Development of an RDF-fuelled CHP plant.
4 Japan 231 Construction of an ash recycling facility.
5 Hungary 187 Construction of a co-generation power plant.
Top Five Projects, week ending 17th June 2016, by Reported Waste Capacity (tonnes)
1 Australia 1,500,000 Expansion to create world's largest landfill site.
2 UK 770,000 Construction of a Resource Recovery Park including WtE plant.
3 Germany 230,000 Supply of waste heat from waste-to-energy plant.
4 UK 200,000 Development of an RDF-fuelled CHP plant.
5 Lithuania 200,000 Construction of a co-generation power plant.
Top Five Projects, week ending 17th June 2016, by Reported Power Generation (MW)
1 Poland 220 Construction of a 220 MW RDF-fuelled CHP plant.
2 Finland 200 Construction of a biomass CHP plant.
3 Sweden 140 Construction of a 90 MW cogeneration plant.
4 Germany 104 Supply of waste heat from waste-to-energy plant.
5 Lithuania 94 Construction of a co-generation power plant.

Weekly Waste Projects Update – week ending 17th
June 2016
Weekly Waste Projects Update: week ending 17th
June 2016 Source: AcuComm Business Database
07
