week 6 lesson 6
TRANSCRIPT
WEEK 6 LESSON 6THE PROFIT AND LOSS STATEMENT
FOODSERVICE MATH & ACCOUNTING: WEEK 6, LESSON 6 2
THE PROFIT & LOSS (P & L) STATEMENT The Profit & Loss (P & L) Statement is a document that details the financial picture of your establishment. This statement is used to identify areas of success and opportunities in your business. Each line in the Profit & Loss (P & L) Statement comes with a narrative that explains how the business is operating. A low food cost on the statement could come with the narrative that the Chef bulk purchased many items over the month to reduce food cost. A high Other expense could tell the tale of a major repair due to power outage. In any case the best management staff knows how the Profit & Loss (P & L) Statement reflects the reported figures. Managers who are surprised at their Profit & Loss (P & L) Statement each month are typically not diligent in the management of the business.
In order to develop a Profit & Loss (P & L) Statement, we must first review the General Ledger. You should notice that all revenues or money coming into the business are represented as a positive and all expenses are represented as a negative. In the Profit & Loss (P & L) Statement almost everything will be expressed as a positive, except for Profit. Profit is all available cash from the business revenue after all expenses are paid. This is what the business is all about, making a profit.
Even in a non-profit setting, the ‘profit’ goes back into the business for some other use.
*Note: All forms of business must have their revenue exceed their total expenses. Failing to do so will result in a lack of operational funds and the business will cease to exist.
FOODSERVICE MATH & ACCOUNTING: WEEK 6, LESSON 6 3
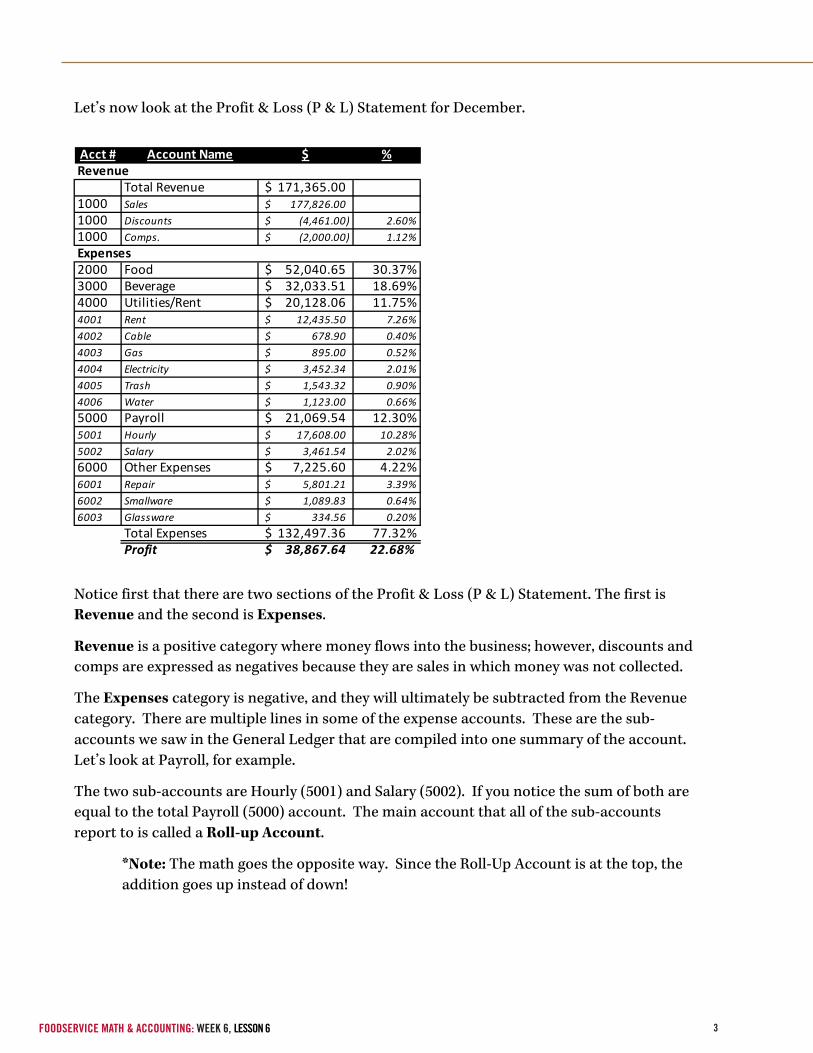
Let’s now look at the Profit & Loss (P & L) Statement for December.
Notice first that there are two sections of the Profit & Loss (P & L) Statement. The first is Revenue and the second is Expenses.
Revenue is a positive category where money flows into the business; however, discounts and comps are expressed as negatives because they are sales in which money was not collected.
The Expenses category is negative, and they will ultimately be subtracted from the Revenue category. There are multiple lines in some of the expense accounts. These are the sub-accounts we saw in the General Ledger that are compiled into one summary of the account. Let’s look at Payroll, for example.
The two sub-accounts are Hourly (5001) and Salary (5002). If you notice the sum of both are equal to the total Payroll (5000) account. The main account that all of the sub-accounts report to is called a Roll-up Account.
*Note: The math goes the opposite way. Since the Roll-Up Account is at the top, theaddition goes up instead of down!
Acct # Account Name $ %
Total Revenue 171,365.00$ 1000 Sales 177,826.00$ 1000 Discounts (4,461.00)$ 2.60%1000 Comps. (2,000.00)$ 1.12%
2000 Food 52,040.65$ 30.37%3000 Beverage 32,033.51$ 18.69%4000 Utilities/Rent 20,128.06$ 11.75%4001 Rent 12,435.50$ 7.26%4002 Cable 678.90$ 0.40%4003 Gas 895.00$ 0.52%4004 Electricity 3,452.34$ 2.01%4005 Trash 1,543.32$ 0.90%4006 Water 1,123.00$ 0.66%5000 Payroll 21,069.54$ 12.30%5001 Hourly 17,608.00$ 10.28%5002 Salary 3,461.54$ 2.02%6000 Other Expenses 7,225.60$ 4.22%6001 Repair 5,801.21$ 3.39%6002 Smallware 1,089.83$ 0.64%6003 Glassware 334.56$ 0.20%
Total Expenses 132,497.36$ 77.32%Profit 38,867.64$ 22.68%
Revenue
Expenses

FOODSERVICE MATH & ACCOUNTING: WEEK 6, LESSON 6 4
ANALYZING THE PROFIT & LOSS (P & L) STATEMENT We can also see the percentages in each category. These are all metrics that are calculated using the following equation:
𝐴𝐴𝐴𝐴𝐴𝐴𝐴𝐴𝐴𝐴𝐴𝐴𝐴𝐴𝐴𝑂𝑂𝑂𝑂𝐴𝑆𝑆𝐴𝐴𝑆𝑆 − 𝐴𝐴𝐴𝐴𝐴𝐴𝐴𝐴𝐴𝐴𝐴𝐴𝐴𝐴𝐴𝑇𝑇𝐴𝐴𝐴𝐴𝑇𝑇𝑇𝑇𝑅𝑅𝑅𝑅𝑅𝑅𝑅𝑅𝐴𝐴𝐴𝐴𝑅𝑅 = %𝐴Metric
This equation is used for each account to show how much of the revenue is being used. If we were to show these percentages as a pie chart, we would have a visual representation of where the revenues are being used.
From this pie graph we can see the largest expense is Food. It is critical as a manager to know where most of the revenues are going, and it will also validate what type of business we are. If we were trying to be a bar that was known for craft cocktails, but the food was the bigger business, then we are not being successful at our mission.
Let’s go back to our goals. We wanted to have a planned 27.41% food cost and a 19.31% planned beverage cost. How did we do? According to the Profit & Loss (P & L) Statement and this chart, we did not make the goal for food cost, but we performed better than planned for beverages. As a Food Service Professional in charge of these numbers you must know why your numbers look like this. Let’s say this month you had a cooler repair which lead to product going bad. Replacing the cooler would explain the $5,801.21 in repairs, as well as an increase in food cost.
Food30%
Beverage19%Utilities/Rent
12%
Payroll12%
Other Expenses
4%
Profit23%
FOODSERVICE MATH & ACCOUNTING: WEEK 6, LESSON 6 5
HOW EVERYDAY DECISIONS AFFECT PROFIT Now that you understand how the business works and how transactions are reported, you can begin to see how your management style affects Bottom Line of your business. The Bottom Line is the last line on the Profit & Loss (P & L) Statement, which is known as Profit.
If you spend too much money on any one thing, the money comes directly from the profit. By mismanaging your organization, you lose the ability to collect Capital between financial periods. Capital is the term used for large sums of money used to make large purchases. If I am the owner of Sammie’s & Sodas and I’m expecting $40K per month from my business, I can plan to purchase the building in six months. In six months, I would expect to have $240,000 in my pocket to put down on a mortgage, which is a business investment. If you, as my manager, use $10K of that money on something that was not planned, my business model will not work and maybe my competitor purchases my building because I did not have the funds to purchase. Then, when my lease is up in a year, my landlord may raise my rent to the point that I can’t afford it (local laws permitting).
These are real situations and it is critical to stick to a plan because if you don’t, it can negatively affect other parts of the business. For example, before spending all of your money on equipment repairs, you might do some research to see if you could spend the same amount of money on a new piece of equipment with a warranty. You must be intelligent in your spending decisions. could spend the same amount of money on a new piece of equipment with a warranty. You must be intelligent in your spending decisions since there is only so much profit to invest back into a business.

IMAGE SOURCESPhoto of pen and accounting documents licensed through Adobe Stock.
Photo of USD currency licensed through Adobe Stock.