wednesday 8 october 2014
DESCRIPTION
Where are we now? What do the changes in Welfare Reform, Housing and Planning mean for local government?. Wednesday 8 October 2014. Conference Chair Cllr Roger Begy, Rutland County Council. Welfare reform – where are we now?. Rose Doran, Senior Adviser, Local Government Association. - PowerPoint PPT PresentationTRANSCRIPT

Where are we now?What do the changes in Welfare
Reform, Housing and Planning mean for local government?
Wednesday 8 October 2014

Conference Chair
Cllr Roger Begy, Rutland County Council

Welfare reform – where are we now?Rose Doran, Senior Adviser,
Local Government Association
East Midlands 08/10/2014 www.local.gov.uk

The reforms• Started in earnest in April 2013• Aim to:
– simplify mainstream housing and employment benefits– Majority of interactions online– improve work incentives– encourage personal responsibility– target support at those who need it most– significantly reduce the overall benefits bill
• Income of households claiming benefit estimated to be on average lower by £1,615 a year – or £31 a week – in 2015/16 as a result of welfare reforms
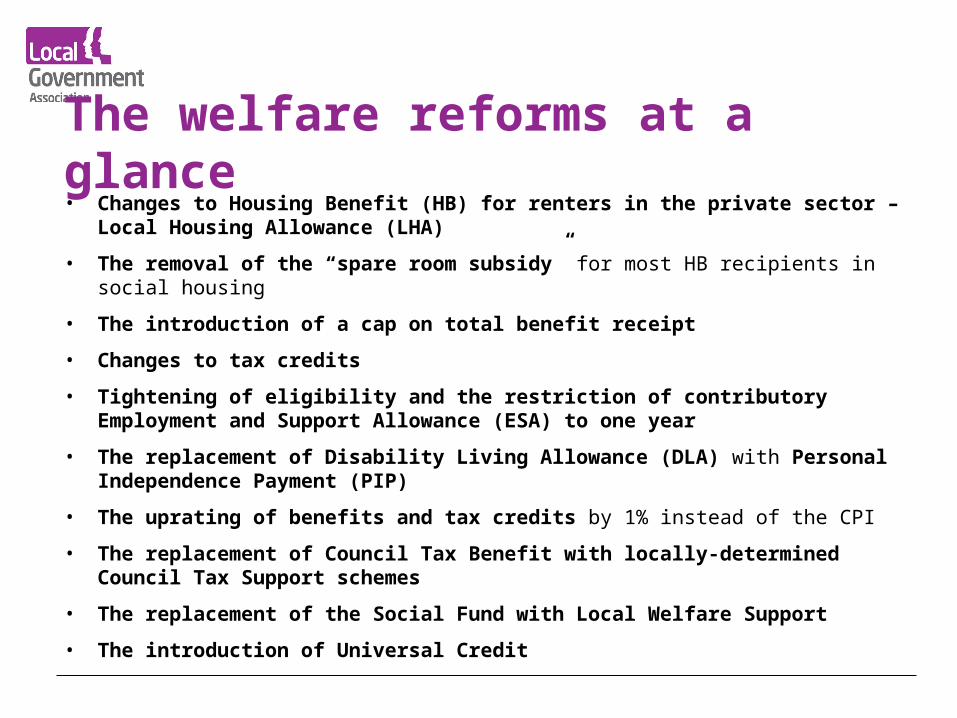
The welfare reforms at a glance• Changes to Housing Benefit (HB) for renters in the private sector – Local
Housing Allowance (LHA)
• The removal of the “spare room subsidy” for most HB recipients in social housing
• The introduction of a cap on total benefit receipt
• Changes to tax credits
• Tightening of eligibility and the restriction of contributory Employment and Support Allowance (ESA) to one year
• The replacement of Disability Living Allowance (DLA) with Personal Independence Payment (PIP)
• The uprating of benefits and tax credits by 1% instead of the CPI
• The replacement of Council Tax Benefit with locally-determined Council Tax Support schemes
• The replacement of the Social Fund with Local Welfare Support
• The introduction of Universal Credit
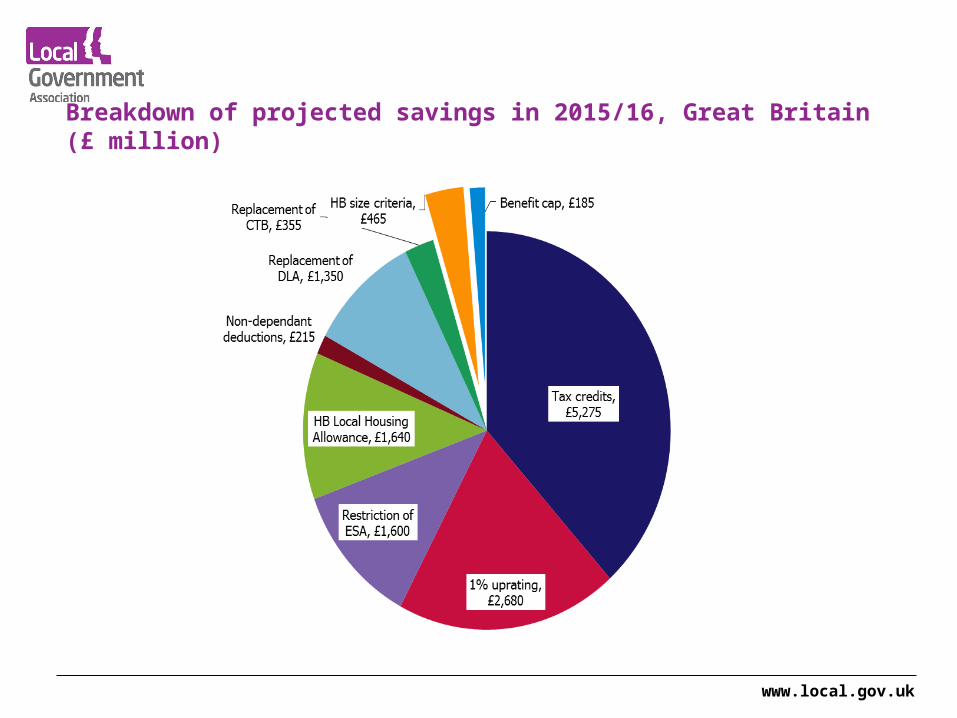
Breakdown of projected savings in 2015/16, Great Britain (£ million)
www.local.gov.uk

Councils at the heart of successful delivery:• Housing and planning
• Employment and skills
• Support for those facing the most significant barriers
• Inclusive growth
Impact - housing
• LHA, benefit cap and ‘bedroom tax’ – significant impacts for some households
• Little evidence of inclination to move• Shortage of properties to move to• Impacts cushioned by discretionary (and transitional)
funding• Benefit cap – initial drop, now quite static caseload• Some evidence LHA rate is bringing down rents but not
in more expensive places• UC – impact of Direct Payments

Mitigation - housing
• Low rent = low employment• We need freedom to build more affordable homes –
pressure at the lowest end• Statutory responsibilities for housing and homelessness• HB admin• Relationship with RSLs and private landlords• Financial capability and integrated support

Employment
• Employment is the key way for people to manage impact• Local Support Services – integrating welfare, employment
and skills• Skills deficit – need for greater local discretion and
influence• Work programme has some key weaknesses – re-let 2016• Integrated support - benefits of a caseworker approach• Linked to broader economy and inclusive growth – councils
best placed to do this

Discretionary local support• Local Support Services
• Discretionary Housing Payment
• Local Welfare Schemes – review and consultation
Impacts Tracker
http://lginform.local.gov.uk/
View and compare impacts by local authority
Report narrative to provide some context and discussion of mitigation
Universal Credit• UC replaces the following benefits/tax credits:
• Working Tax Credit, • Child Tax Credit, • Housing Benefit, • Income Support, • Income-based Jobseeker’s Allowance• Income-related Employment and Support
Allowance.
• Working age • Monthly payment to household• Online claims and interface

Universal Credit roll out
• Live Service – began with new claims for single jobseekers in Tameside (Ashton-under-Lyne) in April 2013
• Slow and incremental – small group of councils; staged by claimant type• All of North West from June 2014• Couples in existing Live Service areas from Summer 2014• Roll out to remaining councils will commence between February 2015
and February 2016• Expansion will apply to new claims for single job seekers. New
applications for ‘legacy benefits’, such as housing benefit, will be closed from 2016
• Final IT solution is being developed and will be in place by 2018• Local Support Services - trialling and testing (e.g. Melton and Rushcliffe)

Single Fraud Investigation Service• Phase 1 go live 1 July (9 councils, 35 staff)
• Phase 2 schedule published
• Roll out started 1 October
– On 1 Oct 23 more councils went live, 48 more staff
• Funding: £12m top slice from HB Admin Grant 2014/15 from councils live by 31 March 2015 (figures promised this month)
• SLA for Information Provision – each council will need to sign up; will be reviewed after December
• Principles agreed for new burdens funding 2015/16
• TUPE like

Practicalities• We keep some HB – e.g. pensioners• TUPE for council staff?• SFIS• Direct payments – Landlord (tenant) preparation• Live service• Completed IT solution – being piloted• We will press to remain at the heart of delivery
and support for local people• Steady state – 2018

Further information…
www.local.gov.uk
www.cesi.org.uk

The impact of Welfare Reform in Leicester
Karen WenlockRevenues & Benefits Manager
October 2014
Content
• Council Tax reduction
• Under – occupancy
• Benefit Income Cap
• Discretionary Funding
• Summary of Impacts
• Any Questions

Council Tax Reduction – summary of changes 2013/14
An Equality Impact Assessment ensured that those households likely to be affected by the proposed changes were identified Capping support to a band B property:
– Council tax reduction calculated at the band B rate, even if claimant lives in a higher band property
– This affected 2,091 households in band C – G A maximum award limit at 80%:
– All working age people (25,000) had to pay at least 20% towards their council tax bill– Of these 16,000 households had not paid any Council Tax before. eg £3.79 per week for a couple in a band A property (£197.85 pa) £4.43 per week for a couple in a band B property (£230.83 pa) Reducing the upper savings limit from £16,000 to £6,000– 281 households were affected by this change – It meant that people (and/or their partners) with more than £6,000 of savings could not
claim council tax reductionRemoving second adult rebate– 593 households would not receive the 25% financial support.(This is NOT single
person discount)Setting a minimum award level @ £3.60 week - 703 households were potentially affected by this change
20

What did we do to help?
• We launched a targeted ‘talk to us’‘ publicity campaign
• Additional ‘prompt to pay’ letters were sent to a target client group
• These households who had not previously paid council tax were identified and the recovery procedure amended to send additional reminders
• Payment arrangements for this group were closely monitored
• 12 monthly direct debit instalments were offered to all households
• The council sort to reduce the burden of debt for all households in the city, where lower level debt is not paid, through negotiating lower court costs
• Expected a number of charge payers issued with liability orders to allow recovery of debt through attachment to welfare benefits and earnings

Did it work?
• Council tax collection was higher than expected and exceeded our target last year
• Quarter 1 recovery information for this year confirms collection has remained strong and slightly exceeds last years figures at the same point.
• Take up of the Council Tax Reduction and Discretionary Relief schemes has been less than expected. We are currently undertaking a targeted take up campaign for both.

Under-occupancy - Impact Analysis
• In the 2011 Census in Leicester 129,603 households in the council tax property base.
• Of these 31,270 residents declared they lived in a social housing property.
• From April 2013 a total of 3,844 households were affected
By 31st March 2014 this had reduced to 2,976
By 30th June 2014 this had reduced to 2,874
• Average loss per week, per household
£10.91 for one spare room or £19.96 for two or more 13/14
£12.16 as above or £22.31 as above Q1. 14/15
Main three wards affected:
• Council Housing: New Parks, Braunstone park/Rowley fields and Eyre's Monsell.
• Housing Association: Spinney Hill, Coleman, Stoneygate.
• 23

Under-occupancy
24
What was done to help?
• Where known, all households were contacted by their landlords, prior to the rule applying to them, offering advice and support.
• Leaflets were made available offering advice on taking on a lodger
• All households were offered housing advice and support should they wish to move to smaller, less expensive, alternative accommodation.
• Promotion of the HomeChoice, EasyMove, HomeSwapper schemes to help households find new homes. (Supported by Discretionary Housing Payments to minimise rent arrears while waiting to find a suitable place).
• RSL provided support through their financial inclusion officers to provide advice, facilitate exchanges within their own stock or register with Home Choice etc,
• The housing allocations policy was reviewed and updated to reflect the welfare changes.
25
Following the changes
• High take up for discretionary applications - Support of this nature is on-going were it is evidenced the householder is helping themselves to manage the financial commitment eg Registered for alternative accommodation and actively bidding
• By March 2014 868 households no longer have the rule applied (Q1.= 970).
Reasons for the reduction are varied - combination of finding work, changes to
household, moving to alternative accommodation
• LCC Tenants affected has reduced. The anticipated rent arrears increase has has not been as high as anticipated, mainly due to all the advice/support provided to the affected tenants, including support to apply for DHP
Initiatives to help those struggling to pay:- • Invitations to come and talk about how to pay regular, affordable amounts• Clockwise Rent Account promoted• Tackling tenancy fraud - to bring properties back into the market
What size is a bedroom?
• Section 365 in the Housing Act, 1985, is used to calculate the maximum number of people who can live in a property, without causing ‘statutory’ overcrowding.
• The Government’s Housing Benefit guidance does not take any account at all of the size of a bedroom. A room is either a bedroom or it is not.
• Any room with adequate ventilation and a minimum of 50 sq feet (4.65 sq metres) of floor space can be considered as ‘available for use as sleeping accommodation

Re-classification of a bedroom
• LCC - Re-classification of bed rooms occur when: Where significant adaptations to the property have occurred.
Such as a through floor lift has been installed.
Where the accommodation has seen a change to the floor plan.
If the bedroom size is less than 50 square feet (reference Housing Act 1985) the room will no longer be deemed to be a bedroom.
This has been undertaken on a case by cases basis and not as a wholesale reclassification exercise.

Current Situation - Appeals
A large number of appeals have been made to First Tier Tribunal
on issues around the under occupancy changes:-
•Breaches of Human Rights – eg. Disability Discrimination
These appeals have not been successful at Upper Tribunal the
main reason given is that the DHP scheme is seen as a “Fair
and proportionate response to the discrimination”
NB) As a result the intention of DHP has been changed.
Previously awards were purely discretionary, guidance now indicates that, in certain situations, DHP payments must be used to provide support. (e.g. Disabled child with a carer)
Current Situation
Room Size •A number of appeals have been heard on this issue but as yet there have been no clear and binding decisions.
Room use•A number of appeals have been made to challenge whether a room should be counted as a bedroom.•Historic use of the room seems key but no set rule can be applied, decisions made so far have been varied.
At present the Upper Tribunal has stayed all appeals on these issues pending the hearing of test cases.

Benefit Income Capping
• 72% were female claimants. Of these 59% are lone parents.• 47% white, 36% Black, minority, ethnic, 17% unknown• Q1 2014/15 192 affected , loss between £ 2.09 – £122.52
Ave loss. RSL = £50.11 Council = £ 62.09 Private = £65.81
31
How many households were affected?:
Initial DWP scans in July 2013 showed 725 households could face the Benefit Income Cap..
From August 2013 to March 2014 at any one time between 170 and 220 households were affected by the rule.
Benefit Income Cap
Working age
All domestic dwellings
202
£22.61 - £116.36
Spinney Hills Stoneygate Braunstone/Rowley Fields

What did the council do to help?
• Following the national trend only half the households expected to be affected by the rule have actually had the rule applied and their Housing benefit reduced.
• Collaborative working with job centre plus supports households back into the jobs market/ Improving skills through training
• All households were contacted to offer housing advice and support should they wish to cheaper alternative accommodation.
• All households with children have been contacted to ensure support and advice is offered to ensure households have enough food to feed the children.
• Housing options are monitoring the housing market and reports of notice of seeking processions/evictions to establish if this rule is resulting in families losing their home.
• Contacted every household offering Discretionary Housing payments and housing advice should they wish to move.
• Offered budgeting advice if they wish to remain in the property and manage their budgets in order they can afford to do so.
• If they are seeking to help themselves a Discretionary Housing payments are used to support them while they manage the transition to another property.
32
Summary of Impacts
• The combination of the welfare reforms has had a significant effect
• The council, social landlords and advice agencies in the city have worked together to identify those affected and in need of support.
We have found that:-• For most of the welfare reform changes over half of the
households affected have children• There has been a disproportionate affect on lone parent
households• The impacts are being felt in areas already identified as
financially deprived

Discretionary Housing Payment (DHP)
fund allocation
Local Authority 2012/13 2013/14
Leicester City 209,549 813,252
Nottingham City 211,880 696,031
Derby City 234,767 560,754
Coventry City 329,445 798,643
The number of DHP applications received for 2013/14 was 3442 against 426 for the entirety of 12/13.The 2013/14 DHP fund was spent in fullDHP awards (One snapshot period) 801 under occupancy 96 BIC 441 multiple reasonsCouncil tax Discretionary relief fund spend to March 2014 was £262,2362014/15 – 1207 applications have been received to date. 34

Local Welfare Provision - Community Support Grant
Funding for Leicester is £1,606,825m (2013/14 &2014/15)Council adopted our scheme from April 2013. The key headlines being to:•alleviate poverty;•support vulnerable young people in the transition to adult life;•safeguard residents in their own home•help those who are trying to help themselves;•keep families together;•support the vulnerable in the local community; •help people through personal and difficult events.
The policy intention supports other council strategies and recommendations: •Leicester City’s Child Poverty Commission recommendations•Leicester City’s food plan 13/16•Children’s society recommendations
NB)Funding for 2015/16 remains in doubt – however following a judicial review on 30/09/14 the government notified authorities that it had agreed to reconsider how the local welfare provision should be funded and would notify the outcome as soon as possible.

Community Support Grant
Take up
•LCC received 2613 requests for a CSG payment •1463 approved, 1055 declined ( a number of these were duplicate and incomplete)•£367,211.53 in award payments made•700 referrals to other sources of support for those whom we are unable to support through the scheme- they usually receive a referral to the LCC partner food bank •1700 food bank referrals.
•Crisis Grants - 2013/14 Awarded 873 crisis grants (non-cash based awards and funds which are not recovered from the client) of £57,078.38•The average award was £64.94. They received co-op vouchers which exclude the purchase of alcohol and cigarettes, for food, fuel to ups direct onto fuel cards, clothing and most would also receive a 3 day food parcel.
•Support Grants - 2013/14 Awarded 590 community support grants (non-cash based awards and funds which are not recovered from the client) of £310,211•An average award is £515.17. Including white goods, beds, bedding, carpeting of homes mainly social housing stock, curtains, sofas, tables etc.
36
Community Support Grant – “Pass it on”
The LWA funding has been used to pilot a LCC recycling scheme to ensure a sustainable resource for furniture and household goods for those in need in future years. This recycling scheme runs alongside the main provision which provides new items
Our initial findings are encouraging:- •This pilot has shown the council is able to minimise purchasing new goods for the first seven months of the pilot the savings were £58,334. •Donated items include bed frames, sofas, chairs, dining room tables, bedside tables, computer desks, wardrobes, dressing tables etc.•174 households in the city received 746 furniture items. All were assessed as safe, clean and re-useable. •All electrical items received were PAT tested. •£1,398, 19 tons of waste was redirected from landfill.
This venture is currently operating at a very low level in order to test the viability, however expansion of the pilot has been agreed and work is in progress
37

Sanctions
• A major issue in the city has been the increased activity at the DWP regarding the use of sanctions with increasing number of applicants presenting both to us and other advice services who have no means of support.
• Initially these applications were not supported under the policy, as the DWP has retained the administration of a hardship fund and the crisis loan for alignment payments converted to a discretionary fund called short term benefit advances ( again advance loan) a in order to support the DWP sanctions policy.
• However the scheme and the local impacts have been continually reviewed and monitored by the council and advice agencies and recent upward trend in sanctioned claims has identified hardship and STBA payments are awarded in very small numbers leaving significant number of household’s struggling to cope.
• LCC policy has been amended in recognition of this need and in future some applicants who have no other means of support will receive assistance.
• The numbers of crisis grant applicants have increased by 43.10%, the number of awards has increased by 61.76%, the average award has increased to £70.30 in April 2014 and the monthly spend for crisis grants has increased by 48.9% since the policy change was introduced.
38
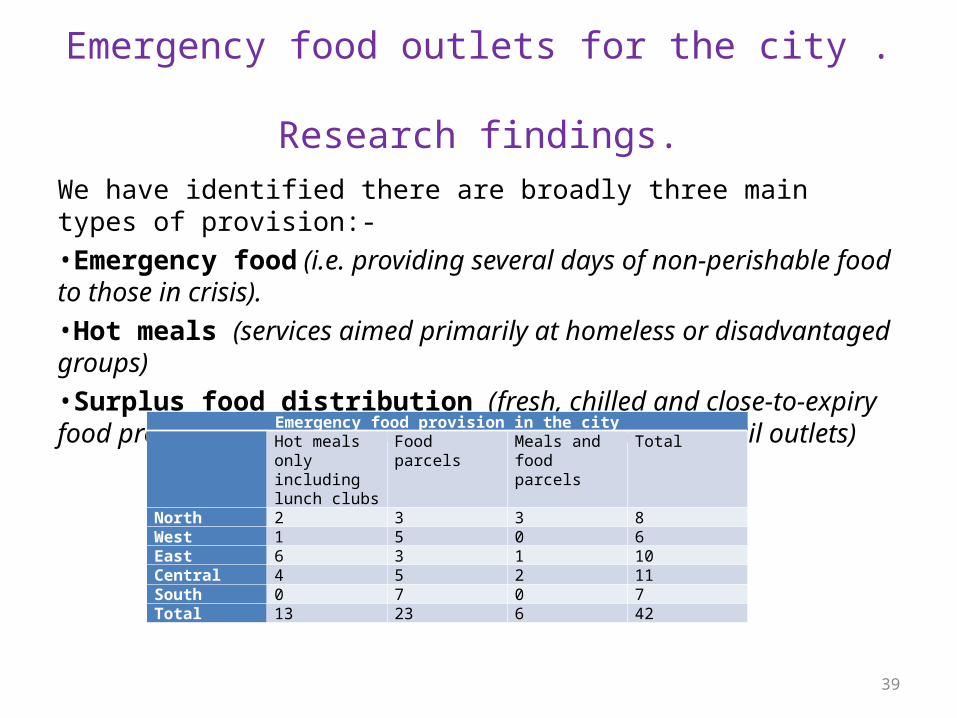
Emergency food outlets for the city . Research findings.
We have identified there are broadly three main types of provision:-•Emergency food (i.e. providing several days of non-perishable food to those in crisis). •Hot meals (services aimed primarily at homeless or disadvantaged groups)•Surplus food distribution (fresh, chilled and close-to-expiry food provided to eliminate food waste from wholesale/retail outlets)
39
Emergency food provision in the city Hot meals only
including lunch clubs
Food parcels Meals and food parcels
Total
North 2 3 3 8West 1 5 0 6East 6 3 1 10Central 4 5 2 11South 0 7 0 7Total 13 23 6 42
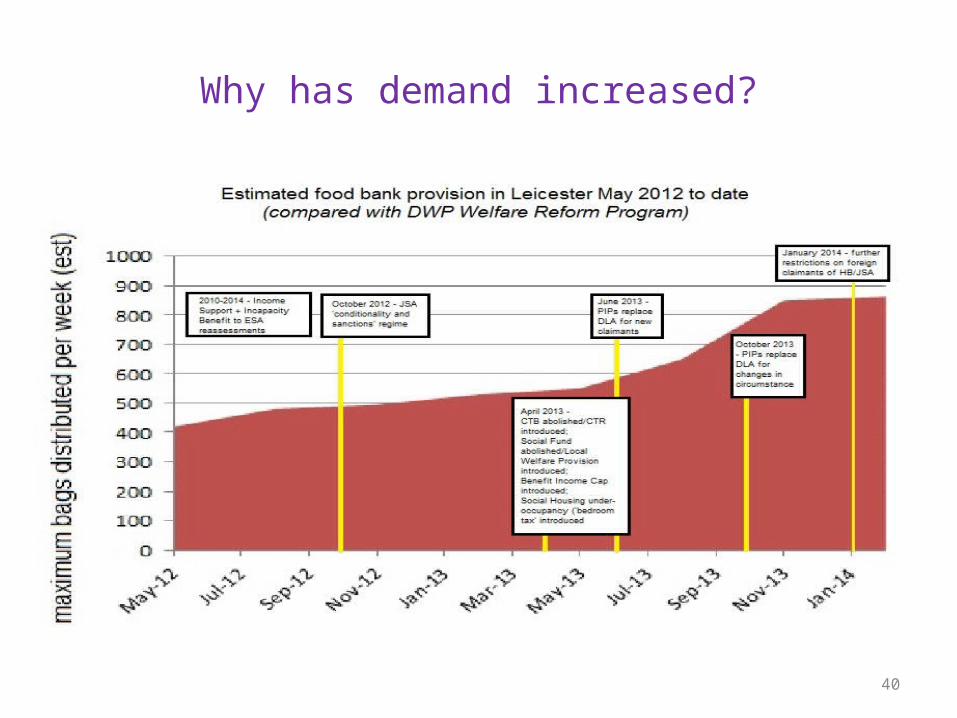
Why has demand increased?
40

What does the future look like?
41
The viability of current food banks to continue operations in the next 12 months.

Risks and issues identified
The information gathered during this exercise has helped to get a better understanding of the provision in Leicester. The main issues and risks are:
•Virtually all sites reported they are struggling to meet demand •Not all the deprived inner-city areas have a food bank provision.•Informal support in local communities appears to exist which might be providing assistance, but unreported
Improvements were identified in relation to •communication, referral arrangements between food banks to increase efficiency and further reduce food waste.•Setting up of a clear structure of standards, in key areas, to ensure that all providers operate in the same way in an agree framework, for example satisfy key training, advice and Health and Safety requirements
Funding of schemes- memberships, running costs and other associated costs is increasingly difficult, sustainability of the outlets is under threat.
•This is currently under review to establish what assistance/support can be given to ensure the continuation of the provision.
•Leicester has developed at Food Plan to address the need for a co ordinated approach to those in need of support in the city in a wide range of areas.
42
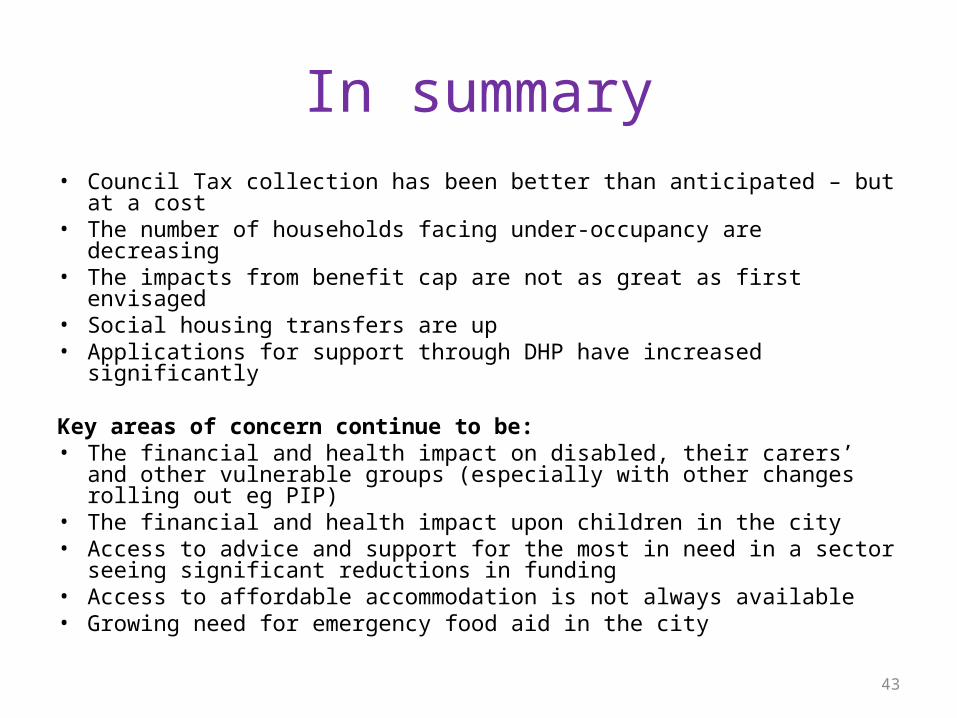
In summary• Council Tax collection has been better than anticipated – but at a cost• The number of households facing under-occupancy are decreasing• The impacts from benefit cap are not as great as first envisaged• Social housing transfers are up• Applications for support through DHP have increased significantly
Key areas of concern continue to be:• The financial and health impact on disabled, their carers’ and other
vulnerable groups (especially with other changes rolling out eg PIP)• The financial and health impact upon children in the city • Access to advice and support for the most in need in a sector seeing
significant reductions in funding• Access to affordable accommodation is not always available• Growing need for emergency food aid in the city
43

Thank you for listening
• Any questions?
• My contact details are:
Karen WenlockRevenues & Benefits [email protected]

Questions
Welfare Reform: Where are we now?
Sarah ShortEast Midlands Councils

Where we were in February 2014
Housing supply and stock Support for people back into employment Cost of administering welfare reforms Local support for the most vulnerable Welfare Assistance Schemes Funding

Where are we now?
Recent government announcements Data
Where next?
Does this picture resonate? What are the key challenges for your
authority? What questions do you have for DWP? What are the key asks for your authority?
Going forward….
New report on welfare reforms in the East Midlands in February 2014
Steering Group to inform councils on progress

Refreshment Break

Where are we now?
Housing

Cllr Gary Porter
South Holland District Council
LGA Vice-Chair

Successful places with homes and jobs
A NATIONAL AGENCYWORKING LOCALLY
Where are we now?HCA update
East Midlands Councils
Charlotte Hill
Wednesday 8th October 2014

Contents Delivery context and the role of
HCA Existing programmes – grant and
investment Current delivery pressures Future programmes
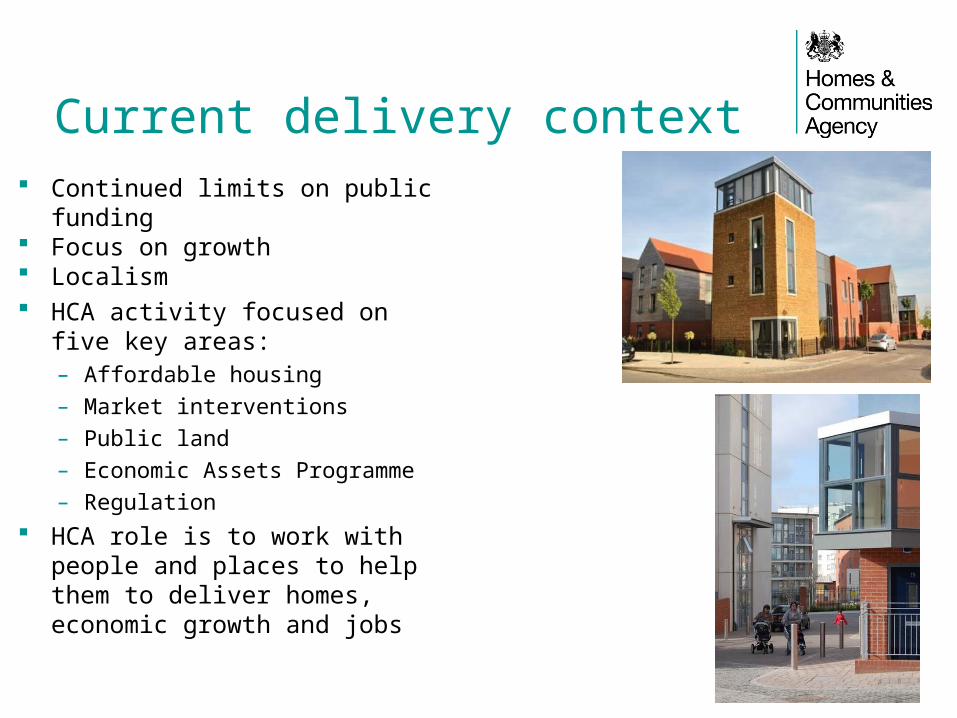
Current delivery context Continued limits on public funding Focus on growth Localism HCA activity focused on five key
areas:– Affordable housing
– Market interventions
– Public land
– Economic Assets Programme
– Regulation
HCA role is to work with people and places to help them to deliver homes, economic growth and jobs

Delivering local priorities Investment has to be aligned with
local priorities HCA assists local delivery with the
right mix of:– HCA and other public land and
economic assets
– Affordable housing investment and regulation
– Market interventions
We are locally driven. We work with councils, LEPs, Core Cities and other local partners, effectively targeting our investment and support at their identified priorities.
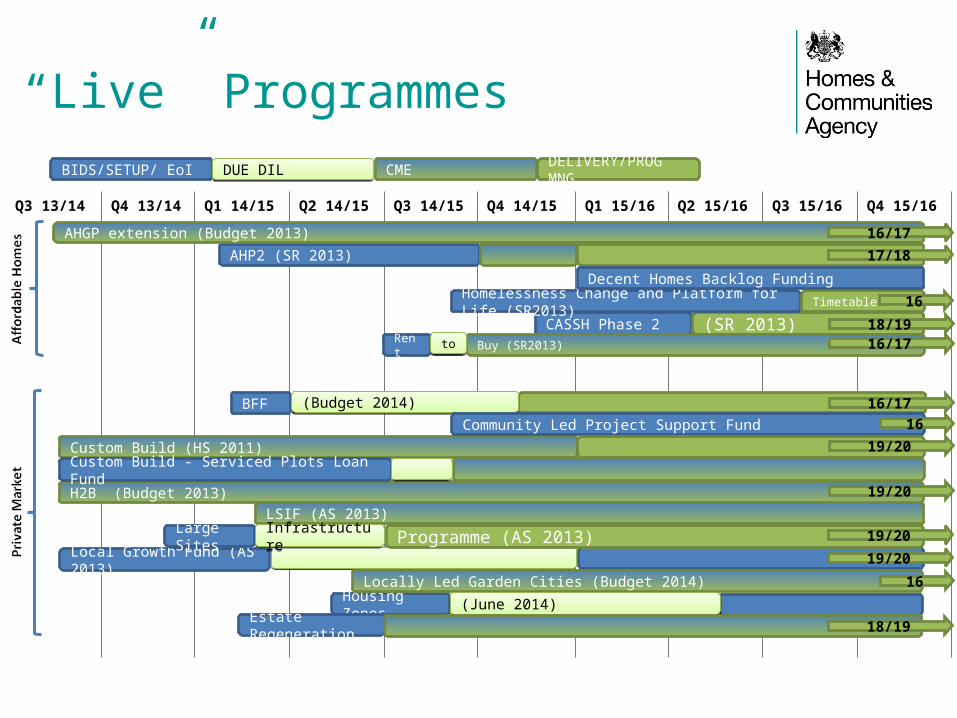
“Live” Programmes
Q3 13/14 Q4 13/14 Q1 14/15 Q2 14/15 Q3 14/15 Q4 14/15 Q1 15/16 Q2 15/16 Q3 15/16 Q4 15/16
BIDS/SETUP/ EoI DELIVERY/PROG MNG
AHP2 (SR 2013)
CASSH Phase 2
LSIF (AS 2013)
Local Growth Fund (AS 2013)
Custom Build (HS 2011)
(SR 2013)
H2B (Budget 2013)
Rent
Homelessness Change and Platform for Life (SR2013)
BFF
Buy (SR2013)
Timetable tbc
Housing Zones
Decent Homes Backlog Funding
(Budget 2014)(Budget 2014)Community Led Project Support Fund
Custom Build - Serviced Plots Loan Fund
AHGP extension (Budget 2013)
DUE DILDUE DIL
Locally Led Garden Cities (Budget 2014)
(June 2014)(June 2014)
toto
Estate Regeneration
CME
Large Sites InfrastructureInfrastructure Programme (AS 2013)
17/18
18/19
16/17
16/17
16
16/17
16
19/20
18/19
19/20
16
19/20
19/20

Current delivery pressures - AHP

Current delivery pressures - AHP

Current delivery pressures - AHP

New Programmes
2015-18 Affordable Housing ProgrammeTotal Midlands allocation is £226.5m for 11,545 homes of which the local authorities in the East Midlands have an allocation of £91.3m for 4,641 homes
Builders Finance FundInitial shortlist of sites in the Midlands totals £81.8m for 2,859 homes of which £36.1m and 1,590 homes are on sites within local authorities in the East Midlands
Large Scale Infrastructure ProgrammeSites in the Midlands have been shortlisted for funding of £246.7m for 49,722 homes of which £174.2m and 31,168 homes are in the East Midlands

2015 – 18 Affordable Homes
Keeping in touch homesandcommunities.co.uk
// /HCA_UK
/homes-&-communities-agency
Affordable Homes Programme – HCA partner briefing– 12 November 2014, 10.00am – 12.30pm
– HCA, 5 St Philips Place, Colmore Row, Birmingham, B3 2PW

Lunch

Where are we now?
Planning

Current Trends & Future Prospects
Andrew PritchardDirector of Policy & Infrastructure

Introduction
Review of recent history Current challenges Some alternative futures What remains the same for councils in any
eventuality A question for you!

Planning & Housing March 2010
Regional Plans Local Development Frameworks Regional allocations for housing, transport
& economic development spending Fiscal stimulus boost to Affordable
Housing Programme

May 2010: Proposals for Change
Localism & deregulation System based on
neighbourhood plans Removal of Government
targets for housing & planning
Fiscal incentives to encourage house-building
Presumption in favour of sustainable development
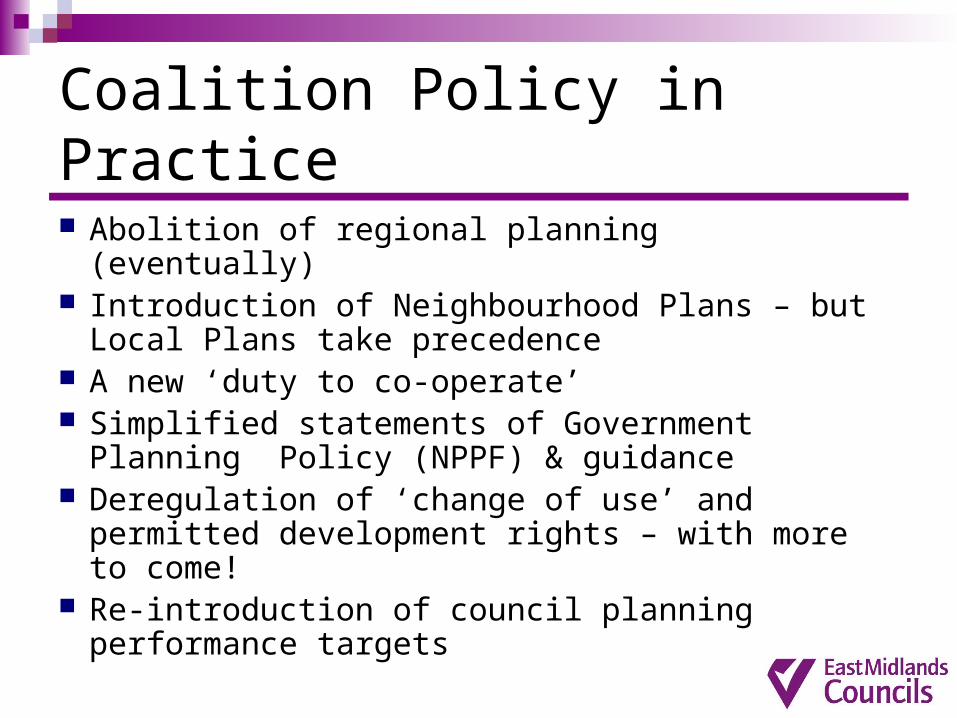
Coalition Policy in Practice
Abolition of regional planning (eventually) Introduction of Neighbourhood Plans – but Local
Plans take precedence A new ‘duty to co-operate’ Simplified statements of Government Planning
Policy (NPPF) & guidance Deregulation of ‘change of use’ and permitted
development rights – with more to come! Re-introduction of council planning performance
targets
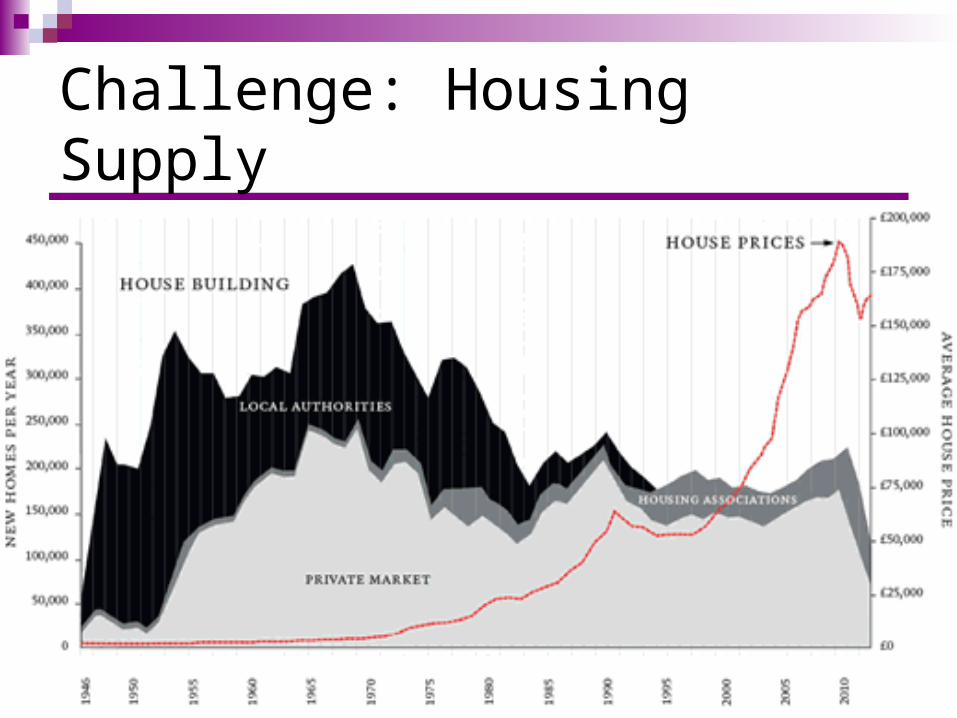
Challenge: Housing Supply
Challenge: Finance
Annual Housing Benefit Bill: circa £22 billion (revenue)
Annual affordable housing program: circa £2 billion (capital)
Is this balance right? - how can it be changed?
Challenge: Duty of Co-operate
Stevenage Mid Sussex Aylesbury Vale Brighton West Dorset NW Leicestershire
A political consensus?
Major political parties agree on the need for more housing & for a new generation of ‘garden cities’
But they differ fundamentally on the means by which this should be achieved

Wolfson Prize for Economics
£250,000 to come up with a proposal for a new Garden City
Proposals should be visionary and popular, but must not require any public money to deliver
Secretariat for competition by Policy Exchange

The winner!

Visionary & Popular?
“A recipe for un-wanted urban sprawl”
Brandon Lewis MP
Housing & Planning Minister
“You could put two new towns
in the centre of Croydon...”
Lord Rogers
Labour Peer

Lyons Housing Review
Set up by Labour to find ways of increasing housing delivery to 200,000 pa
Proposals for unlocking development land; infrastructure deliver; new garden cities; ‘right to grow’; planning gain
Due to report shortly…

De-Regulation v State Intervention
Treasury/LSE view: planning increases development costs and is SO last century..
Current moves towards de-regulation could be a prelude to move fundamental changes...
Do NOT take the current planning system for granted!

Dealing with uncertainty!
Regardless of the outcome of this ideological debate, some things are likely to remain constant for councils over the next Parliament (2020)

Get your plan in place!
The Achilles Heal of the current system is the lack of plan coverage
Without either Structure Plan or Regional Plan - the local plan is the only show in town
Only 17 adopted plans in the EM (only 3 post NPPF)
Councils must get plans in place to retain a credible system

Delivery is king!
Government is acutely aware that development remains at historically low levels
Credible 5 Year Housing land supply is essential
Councils must act proactively to get development away
Neighbourhood planning is here to stay!
Neighbourhood planning is a perceived success
Both Government & opposition have voiced support
Councils must work with communities to support neighbourhood planning

Make co-operation work!
There are no proposals from either the Government or Opposition to re-instate statutory strategic planning in the next Parliament
Council’s must make co-operation work
More Joint planning arrangements?

Q: How much of a priority is planning for your council? On average each council in the EM has
around 20 staff working on planning… 14 on Development Management 6 on plan-making Less than half are RTPI members 80% of councils do not have a planner in
the Corporate Management Team…

Shale Gas Exploration & Development
Background and Environmental Impacts
East Midlands Councils
Briefing Event on 8th October 2014
Dr Ian Campbell CGeol FGS
Presentation TitleShale Gas Exploration and Development
What is Shale Gas?
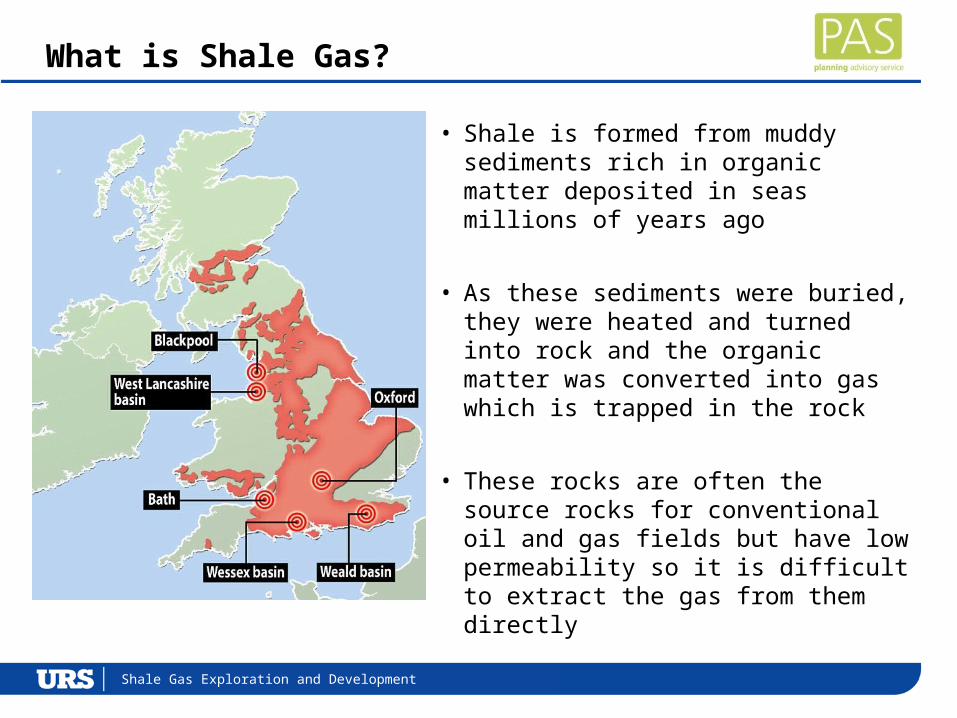
• Shale is formed from muddy sediments rich in organic matter deposited in seas millions of years ago
• As these sediments were buried, they were heated and turned into rock and the organic matter was converted into gas which is trapped in the rock
• These rocks are often the source rocks for conventional oil and gas fields but have low permeability so it is difficult to extract the gas from them directly

Presentation TitleShale Gas Exploration and Development
UK On-shore Hydrocarbon Provinces
• In the UK shales potentially containing gas and or oil are present in:
• Northern England• Southern England• Midland Valley of Scotland
• The British Geological Survey has Produced assessments of the amount of hydrocarbons in each area in 2013 and 2014

Presentation TitleShale Gas Exploration and Development
Resources and Reserves
Hydrocarbon Province Shale Gas(Billions of cubic
metres)
Shale Oil (Billions of tonnes)
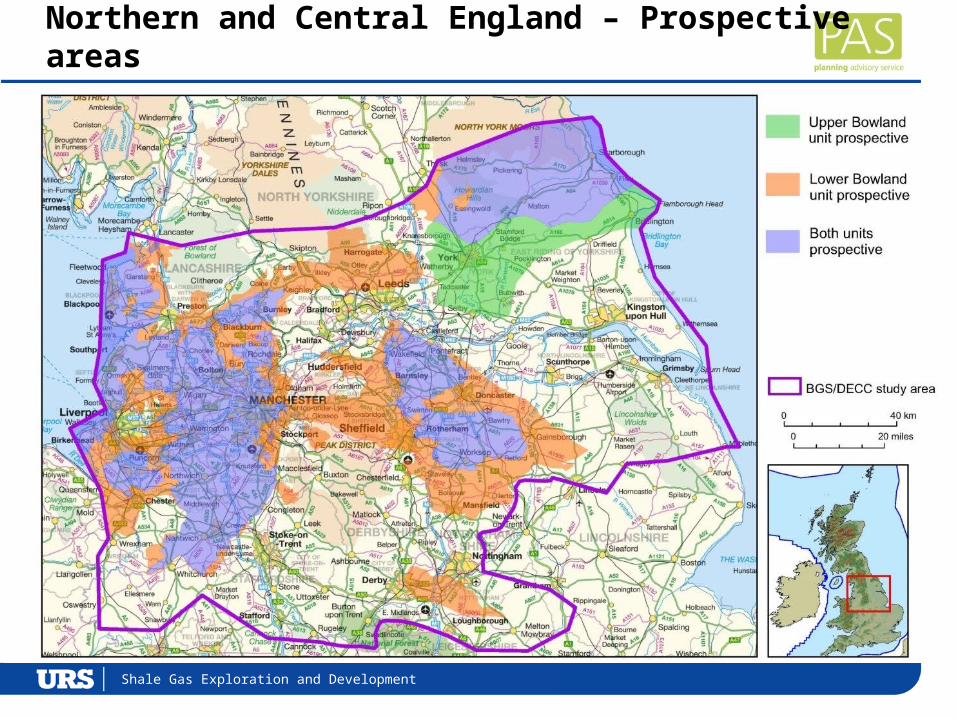
Northern & Central England (Bowland Shale)
23,300 – 64,600 -
Central Scotland 1,400 – 3,800 0.4 – 1.5
Weald Basin - 290 – 1,100
• Resource estimate prepared using a 3D model based on geophysics and a limited number of boreholes – significant uncertainties
• Reserve - the amount of gas which may be extracted cannot estimated at present without further exploration and appraisal
Presentation TitleShale Gas Exploration and Development
Northern and Central England – Prospective areas

Presentation TitleShale Gas Exploration and Development
Petroleum Exploration & Development Licensing
Existing and 14th Round Licence Blocks

Presentation TitleShale Gas Exploration and Development
Licensing in Northern and Central England
Location of Current PEDLs in Northern and Central England compared to Bowland Shale Resource

Presentation TitleShale Gas Exploration and Development
Exploration, Appraisal and Development
There are three phases in the development of a Shale Gas field
1.Exploration – how much shale is there? Does not typically involve fracking
2.Appraisal – how much gas will it produce?
Involves fracking
3.Development – commercial production of shale gas Involves fracking
All will require planning permission with environmental impact assessment

Presentation TitleShale Gas Exploration and Development
Drilling for Shale Gas
Source: Total S.A.
• Rocks containing shale gas in the UK are typically 2,000 m to 3,000 m below the ground surface
• Accessing the gas uses established oil and gas drilling technologies, in particular:
• Horizontal Drilling – to maximise the amount of shale available for fracking
• Hydraulic fracturing (“fracking”)– to maximise the amount of gas which can be extracted from the shale

Presentation TitleShale Gas Exploration and Development
Hydraulic Fracturing
• Wells are progressively cased with steel tubes cemented in place
• Steel liner perforated within the shale using explosive guns
• Water, sand and additives are pumped at pressure into the shale
• Fracking opens up hairline fractures that allow the gas to flow from the shale
• All chemical additives used will require pre-approval by the Environment Agency and are required to be non-hazardous (non-carcinogenic)

Presentation TitleShale Gas Exploration and Development
Hydraulic Fracturing
• Gas is allowed to flow from the well.
• Some fracking fluid will return with the gas (“flow back” fluid)
• The gas will either be:
• flared – during exploration or appraisal; or
• piped off-site to the gas transmission network - during production
Presentation TitleShale Gas Exploration and Development
What will Shale Gas Exploration look like?
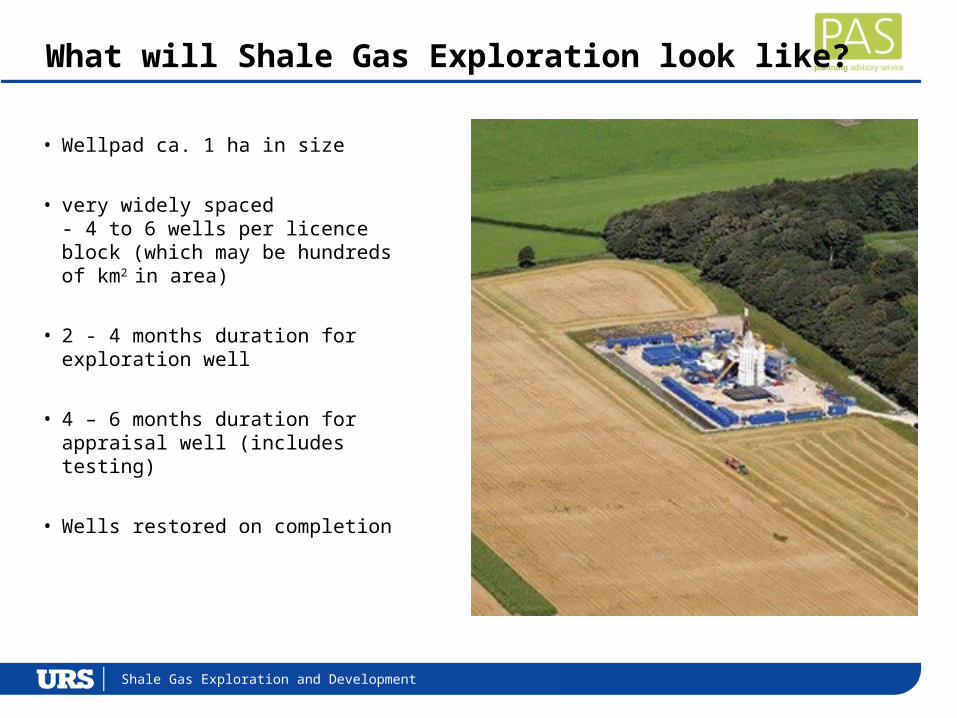
• Wellpad ca. 1 ha in size
• very widely spaced - 4 to 6 wells per licence block (which may be hundreds of km2 in area)
• 2 - 4 months duration for exploration well
• 4 – 6 months duration for appraisal well (includes testing)
• Wells restored on completion

Presentation TitleShale Gas Exploration and Development
What might Shale Gas Development look like?
• Wellpad ca. 2 ha in size
• single well pad can develop 5 – 10 square kilometres
• Multi-well development pads - 8 to 20 individual wells
• Individual wells can reach over 2,000 metres horizontally
• Drilling phase – several years per wellpad?

Presentation TitleShale Gas Exploration and Development
What might Shale Gas Production Look Like?
• After drilling a small well pad remains
• Drilling rig and associated structures removed from site.
• Gas production infrastructure only
• Site can be screened
• Off-site gas collection and transmission infrastructure will be required to service a number of pads. Pipework is likely to be underground.
• Each well pad operational for up to 20 years and restored on completion

Presentation TitleShale Gas Exploration and Development
Water Use and Treatment
• Typical shale gas well uses between 10 – 20 thousand cubic metres (4 to 8 swimming pools) of water
• Mains water
• Surface water
• Groundwater
• Water which flows back from well:
• Contains natural minerals (some of which may be naturally radioactive)
• Collected and contained on-site in closed tanks (not open ponds)
• Pre-treat on-site and treat at water treatment works
• Recycle and re-use – for multi-well developments
Presentation TitleShale Gas Exploration and Development
Groundwater Contamination
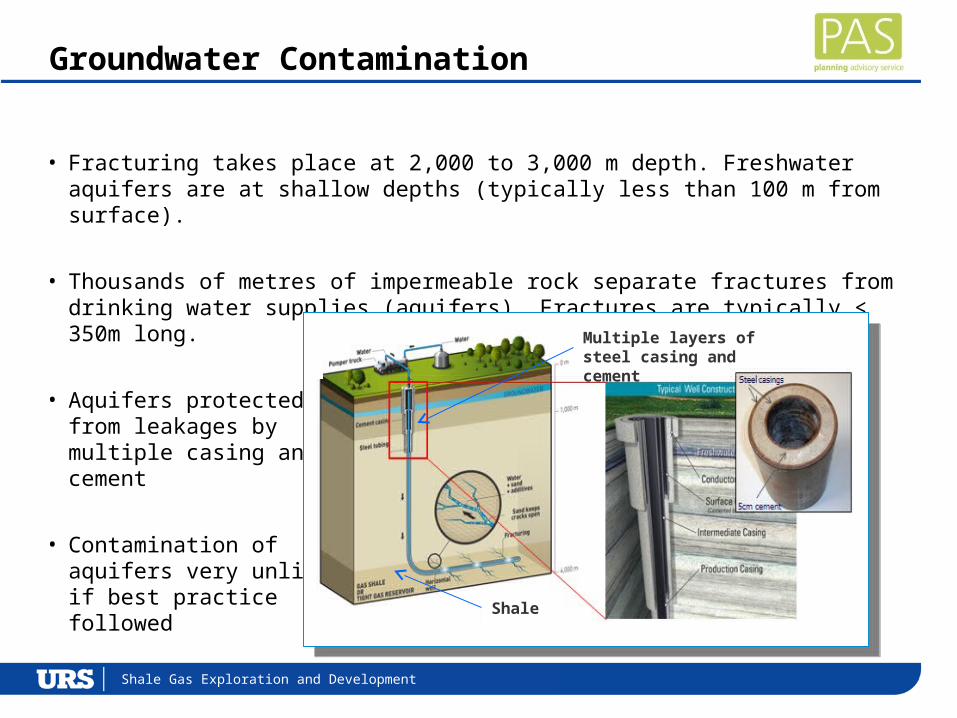
• Fracturing takes place at 2,000 to 3,000 m depth. Freshwater aquifers are at shallow depths (typically less than 100 m from surface).
• Thousands of metres of impermeable rock separate fractures from drinking water supplies (aquifers). Fractures are typically < 350m long.
• Aquifers protected from leakages bymultiple casing andcement
• Contamination of aquifers very unlikely if best practice followed Shale
Multiple layers of steel casing and cement

Presentation TitleShale Gas Exploration and Development
Surface Contamination
• Sources - leakage and uncontrolled discharges at the ground surface
• Can potentially contaminate:
• Groundwater
• Surface Water
• Soil
• Controls:
• Impermeable bunded well pads
• Flowback water containment
• Good working practices
• Monitoring
Presentation TitleShale Gas Exploration and Development
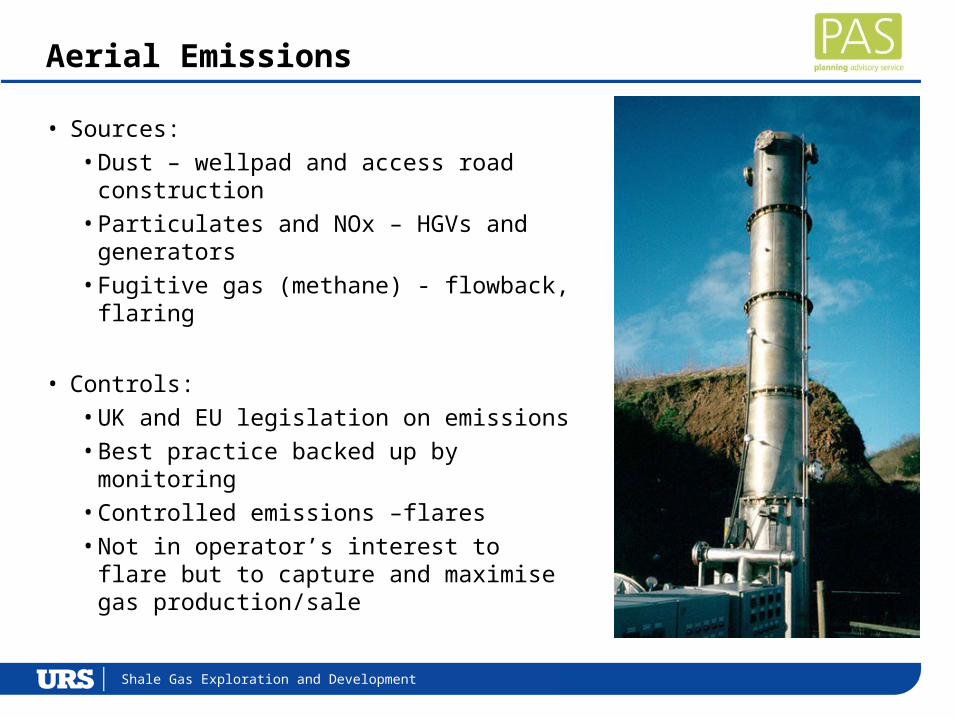
Aerial Emissions
• Sources:
• Dust – wellpad and access road construction
• Particulates and NOx – HGVs and generators
• Fugitive gas (methane) - flowback, flaring
• Controls:
• UK and EU legislation on emissions
• Best practice backed up by monitoring
• Controlled emissions –flares
• Not in operator’s interest to flare but to capture and maximise gas production/sale
Presentation TitleShale Gas Exploration and Development
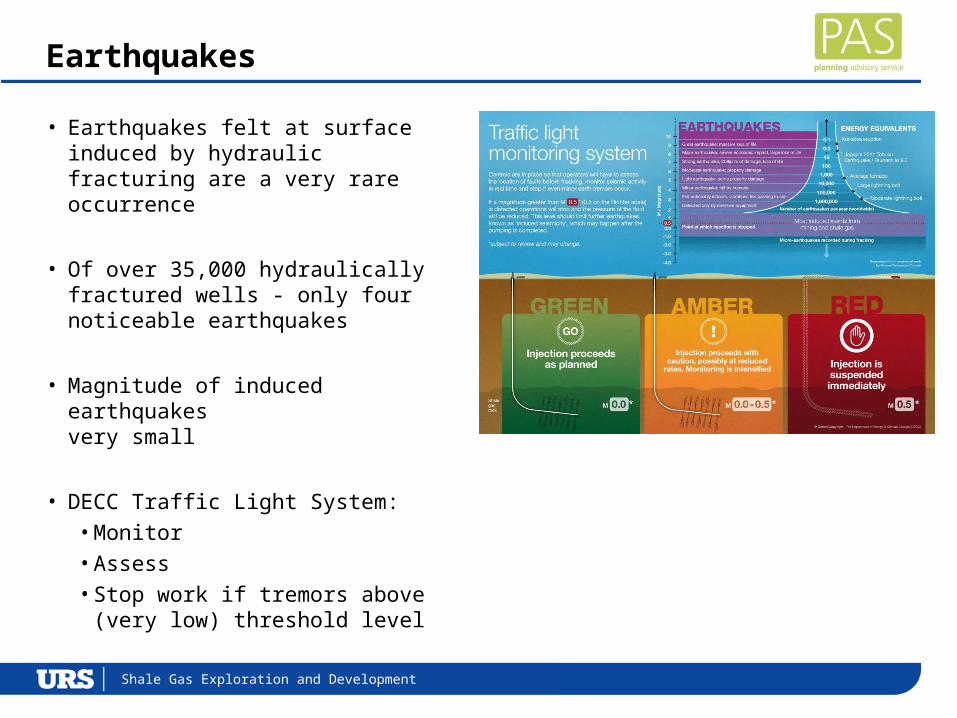
Earthquakes
• Earthquakes felt at surface induced by hydraulic fracturing are a very rare occurrence
• Of over 35,000 hydraulically fractured wells - only four noticeable earthquakes
• Magnitude of induced earthquakes very small
• DECC Traffic Light System:
• Monitor
• Assess
• Stop work if tremors above (very low) threshold level
Presentation TitleShale Gas Exploration and Development
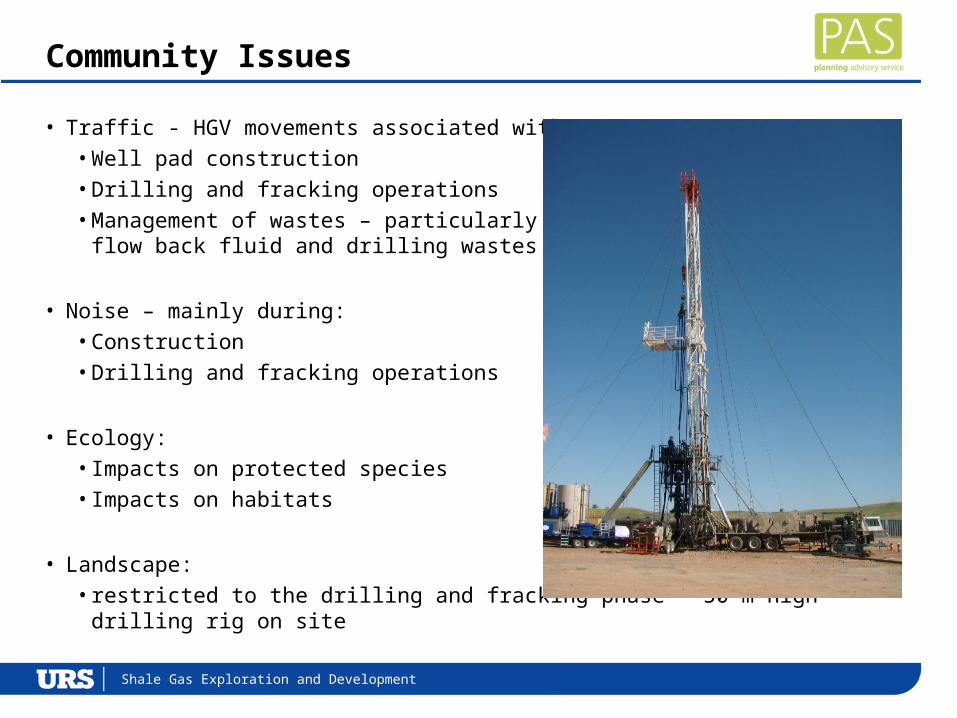
Community Issues
• Traffic - HGV movements associated with:
• Well pad construction
• Drilling and fracking operations
• Management of wastes – particularly flow back fluid and drilling wastes
• Noise – mainly during:
• Construction
• Drilling and fracking operations
• Ecology:
• Impacts on protected species
• Impacts on habitats
• Landscape:
• restricted to the drilling and fracking phase – 50 m high drilling rig on site

Presentation TitleShale Gas Exploration and Development
Regulatory Controls
Environment Agency:
• Intention to drill under Water Resources Act
• Environmental Permit(s) – mining waste, radioactive substances, discharges to water
• Water abstraction licence
Health and Safety Executive
• Assess well design and monitor well construction
• Independent inspections by competent person
Coal Authority – notify if drilling through coal seams
DECC
•Environmental Risk Assessment – whole life cycle
•Seismic Assessment
•Go/no go decision

Presentation TitleShale Gas Exploration and Development
Effectiveness of Regulation
The Royal Society/Royal Academy of Engineering – Shale Gas Extraction in the UK: A Review of Hydraulic Fracturing 2012
“Shale gas extraction in the UK is presently at a very small scale. […] Uncertainties can be addressed through robust monitoring systems and research […] Co-ordination of the [regulators] must be maintained. Regulatory capacity may need to be increased.”
Public Health England –Review of Public Health Impacts 2014
“The currently available evidence indicates that the potential risks to public health from exposure to the emissions associated with shale gas extraction are low if the operations are properly run and regulated.”
Presentation TitleShale Gas Exploration and Development
Summary
• The UK has a potentially significant shale gas resource
• There is a need to undertake more extensive exploration and appraisal activities to better assess the commercial viability of shale gas
• Environmental impacts can occur during exploration/development and require:
• Comprehensive baseline assessments
• Assessment and understanding of risks and impacts
• Implementation of mitigation where required
• Monitoring before, during and after hydraulic fracturing
• Regulatory control and guidance
• Existing regulations can control progress of shale gas developments in UK
• Slower development in UK than US should allow time to develop best practice and more robust regulatory controls if prove to be necessary
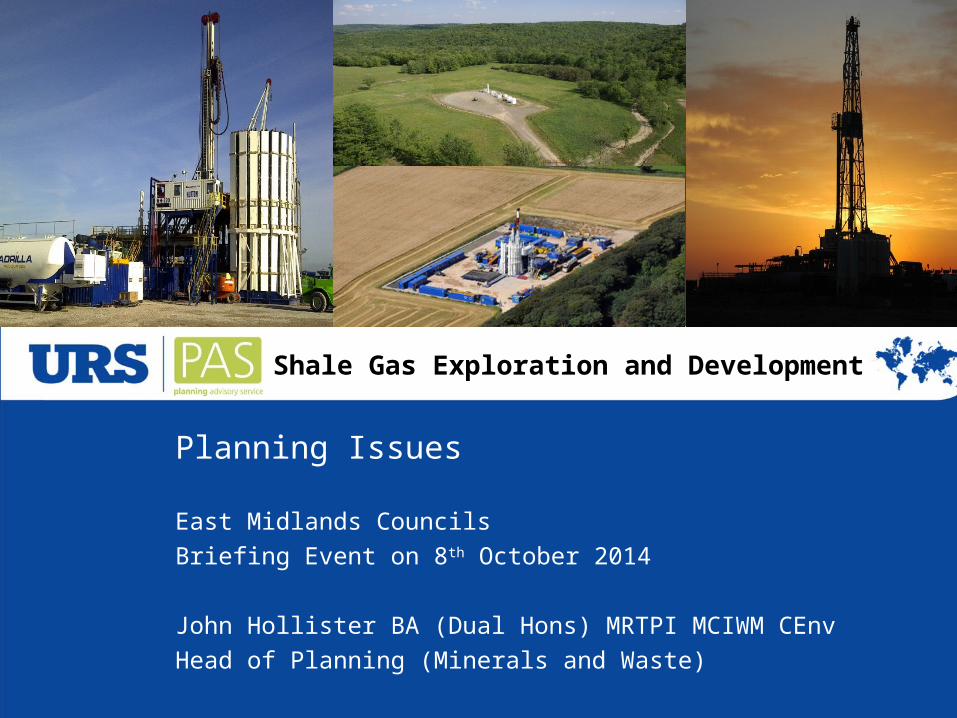
Shale Gas Exploration and Development
Planning Issues
East Midlands Councils
Briefing Event on 8th October 2014
John Hollister BA (Dual Hons) MRTPI MCIWM CEnv
Head of Planning (Minerals and Waste)

Presentation TitlePlanning Advisory Service: Shale Gas Exploration and Development
Introduction
Applications for planning permission to carry out shale gas exploration, appraisal and production are “County Matters” – to be determined by County Councils in two tier Local Government areas.
Like any other application , must be determined in accordance with Section 38(6) of the Planning and Compulsory Purchase Act 2004 – which states:
“ if regard is to be had to the development plan for the purpose of any determination to be made under the Planning Acts the determination must be made in accordance with the plan unless material considerations indicate otherwise.”
- so in this presentation I will consider the situation of terms of:
• development plans; and• material considerations.
- finish with a few thoughts on issues for planning decision makers.
Presentation TitlePlanning Advisory Service: Shale Gas Exploration and Development
Development Plan
Shale gas is too recent a phenomenon to be addressed in most plans.
Policies only likely to exist for conventional (i.e. not involving hydraulic fracturing) hydrocarbon development in areas which have seen this activity in the past.
Existing policies typically structured in terms of the 3 phases of
development (exploration, appraisal and production) – to reflect:
•different policy considerations at each stage; and•planning decisions should not pre-empt those to be taken •later at the production stage.
MPAs which fall in areas subject of PEDLs issued by DECC will need to consider the issues likely raised by shale gas development.
In the interim, decisions on individual shale gas proposals are likely to give more weight to the ‘material considerations’ which apply.

Presentation TitlePlanning Advisory Service: Shale Gas Exploration and Development
Material Considerations
No statutory definition of “material considerations”.
Established through case law - wide range of policy and evidential documents.
In the case of shale gas – two key policy / guidance documents:
• National Planning Policy Framework (NPPF) (DCLG, March 2012); and• Planning Practice Guidance (PPG) (DCLG, March 2014).
Also important evidential material in:
•reports referred to by Ian Campbell; and•reports published by DECC.

Presentation TitlePlanning Advisory Service: Shale Gas Exploration and Development
Material Considerations - NPPF
Paragraph 14 Presumption in favour
of sustainable development
Paragraph 142 important that there is a sufficient
supply of ……. energy
Paragraph 144 local planning authorities should
give great weight to the benefits of
mineral extraction, including to the
economy…..
Paragraph 147 When planning for ….. unconventional
hydrocarbons, MPAs should clearly distinguish
between the three phases of development and address constraints on production and processing…..

Presentation TitlePlanning Advisory Service: Shale Gas Exploration and Development
Material Considerations - PPG
Minerals para 91 …. shale gas …pressing need to establish – through exploratory drilling – whether or not there are sufficient recoverable quantities present to facilitate economically viable full scale production.
Minerals para 112 … mineral planning authorities should
rely on the assessment of other
regulatory bodies [seismic, well design &
integrity, waste and water management, gas
flaring]…… before granting planning
permission they will need to be satisfied that
these issues can or will be adequately
addressed by taking the advice from the
relevant regulatory body.
Minerals para 223 shale gas development in National Parks, the Broads, AONBs and World Heritage Sites should be refused except in exceptional circumstances (see NPPF para 116). PPG amendment 28.07.2014.
Presentation TitlePlanning Advisory Service: Shale Gas Exploration and Development
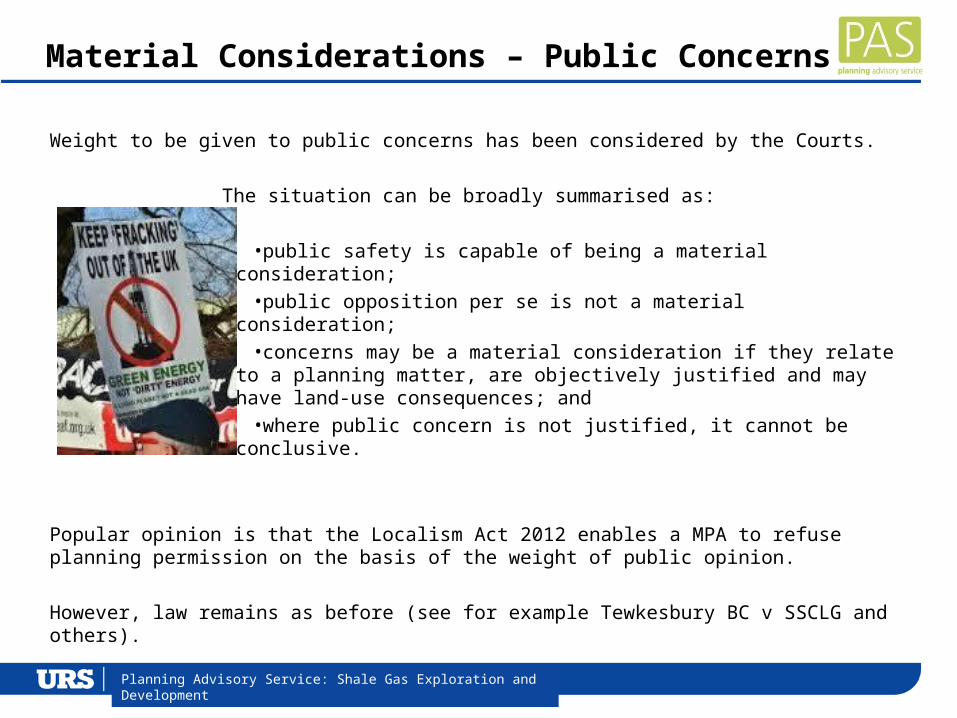
Material Considerations – Public Concerns
Weight to be given to public concerns has been considered by the Courts.
The situation can be broadly summarised as:
•public safety is capable of being a material consideration;•public opposition per se is not a material consideration;•concerns may be a material consideration if they relate to a
planning matter, are objectively justified and may have land-use consequences; and
•where public concern is not justified, it cannot be conclusive.
Popular opinion is that the Localism Act 2012 enables a MPA to refuse planning permission on the basis of the weight of public opinion.
However, law remains as before (see for example Tewkesbury BC v SSCLG and others).

Presentation TitlePlanning Advisory Service: Shale Gas Exploration and Development
Financial Matters
The UK Onshore Operators Group (UKOOG) commitment to provide:
• £100,000 per well site where hydraulic fracturing takes place; and• 1% of revenues, allocated approximately 2/3rd to the local community and 1/3rd at
the county level.
DECC estimates this could be worth £5 to £10 million for a typical producing site over its lifetime.
Prime Minister announced on 13th January 2014 that Councils will be able to keep 100 per cent of business rates they collect from shale gas sites – double the current 50 per cent figure. DECC has estimated that the business rates could be worth up to £1.7 million a year for a typical site.
Infrastructure Bill 2014 to remove 3rd party landownership rights regarding direction regarding directional drilling – voluntary payment to the community of
£20,000 per directional well.

Some Thoughts

Presentation TitlePlanning Advisory Service: Shale Gas Exploration and Development
Main Points (1)
NPPF and PPG seek to achieve a proper planning balance – but no doubt that the Government is strongly supportive of shale gas development.
Recent changes to PPG appears to be a response to criticism (by RSPB and others) that there should be some ‘no – go areas’
PPG now establishes a presumption against in key environmental areas e.g. National Parks, The Broads, AONBs and World Heritage Sites.
Planning decision makers need to strike the right balance between the role of the MPA and the other regulatory regimes – even when faced with public concerns.

Presentation TitlePlanning Advisory Service: Shale Gas Exploration and Development
Main Points (2)
Regulation 122(2) of the Community Infrastructure Levy Regulations 2010 sets out the limitations which apply to the use of planning obligations.
“A planning obligation may only constitute a reason for granting planning permission for the development if the obligation is:
• necessary to make the development acceptable in planning terms;
• directly relate to the development; and
• fairly and reasonably related in scale and kind to the development.”
The type of local community benefits scheme which UKOOG has adopted fails all three of the tests set out in Regulation 122(2).
Planning decision makers therefore likely to be advised by officers that it would be improper to take any account of such financial benefits when determining applications.
Planning Advisory Service: Shale Gas Exploration and Development
Presentation TitlePlanning Advisory Service: Shale Gas Exploration and Development
Close
Any questions ?
Planning Advisory Service: Shale Gas Exploration and Development

Event summary and close