webinar rear-end collision -- 5-29-2014 · 5/29/2014 1 center for urban transportation research |...
TRANSCRIPT

5/29/2014
1
Center for Urban Transportation Research | University of South Florida
Evaluation of Rear-end Collisions and Identification of Possible Solutions
William P. Morris and Christopher P. DeAnnuntis
CUTR Webcast May 29, 2014
2
Purpose
• Determine if rear-end collisions are increasing• Conduct an assessment to ascertain the prevalence of
rear-end collisions• Identify conditions that exist when rear-end collisions
occur• Identify mitigation strategies for agencies that have
identified rear-end collisions as a major issue• Assess impact of Yield to Bus and pull out bays on rear-
end collisions• Identify solutions and/or strategies to reduce rear-end
collisions• Examine bus safety legislation in other states and assess
whether Florida’s current statutes need to be revised

5/29/2014
2
3
Major Incident Report – National Transit Database
• NTD Database for Major Incidents• Compiles data from all reporting agencies in all 50
states and territories• Starting in 2008, included “rear-ended” and “rear-
ending” as collision types• Data was aggregated by FTA Region• For analysis and comparison, rear-ended and
rear-ending collisions as a percentage of total collisions were compiled.
• For comparison, collisions per 100,000 miles was used as a leveling data set for analysis.
4
Total Annual Motorbus Collisions with Rear-ended and Rear-ending (2008-2012)
0
1,000
2,000
3,000
4,000
2008 2009 2010 2011 2012
383 277 274 291 204
633 722 697 686 668
3,162 3,121 3,224 3,2613,696
Collision Type (Rear-ending)Collision Type (Rear-ended)Total Motor Bus Collisions

5/29/2014
3
5
Total Annual Motorbus Collisions per 100,000 miles -2008-2012
0.000
0.050
0.100
0.150
0.200
0.250
2008 2009 2010 2011 2012
0.020 0.014 0.014 0.016 0.011
0.032 0.037 0.036 0.037 0.037
0.162 0.158 0.168 0.1760.203
Total Rear-ending Collisions per 100,000 miles
Total Rear-ended Collisions per 100,000 miles
Total Collisions per 100,000 miles
6
Rear-ended and Rear-ending as a Percentage of Total Collisions – 2008-2012
0.0%
5.0%
10.0%
15.0%
20.0%
25.0%
2008 2009 2010 2011 2012
12.1%8.9% 8.5% 8.9%
5.5%
20.0%23.1% 21.6% 21.0%
18.1%
Collision Type (rear-ending) as % of Total Collisions
Collision Type (rear-ended) as % of Total Collisions

5/29/2014
4
7
Total Collisions with Rear-ended and Rear-ending by FTA Region - 2012
0
100
200
300
400
500
600
700
800
Region 1 Region 2 Region 3 Region 4 Region 5 Region 6 Region 7 Region 8 Region 9 Region 10
16 29 31 36 28 15 5 8 31 5
32 43 73
197
11764
14 3077
21
157
440
543610
725
357
90 101
552
121
Collision Type (Rear-ending)
Collision Type (Rear-ended)
2012 Motor Bus Collisions
8
Annual Motorbus Collisions, All Florida Agencies, 2008-2012
0
50
100
150
200
250
300
350
2008 2009 2010 2011 2012
30 30 14 14 14
104123
97120 128
310287 276
311336
Collision Type (Rear-ending) Collision Type (Rear-ended)
Annual Motor Bus Collisions

5/29/2014
5
9
Annual Motorbus Collisions by Collision Type as a Percentage of Total Florida Transit Agency Collisions,
2008-2012
0.0%
10.0%
20.0%
30.0%
40.0%
50.0%
2008 2009 2010 2011 2012
9.7% 10.5%5.1% 4.5% 4.2%
33.5%
42.9%
35.1%38.6% 38.1%
Collision Type (rear-ending) as % of Total Fl Agency Collisions
Collision Type (rear-ended) as % of Total Fl Agency Collisions
10
Annual Motorbus Collisions per 100,000 Miles, All Florida Agencies, 2008-2012
0.00
0.05
0.10
0.15
0.20
0.25
0.30
2008 2009 2010 2011 2012
0.03 0.030.01 0.01 0.01
0.090.11
0.090.11 0.10
0.27 0.26 0.250.28 0.30
Rear-Ending Collisions per 100,000 milesRear-Ended Collisions per 100,000 milesTotal Collisions per 100,000 miles

5/29/2014
6
11
Broward County Transit Division: Motorbus Collisions, 2008-2012
0
20
40
60
80
2008 2009 2010 2011 2012
11 5 4 5 4
1321
1324 26
44 47 50
6779
Collision Type (Rear-ending)
Collision Type (Rear-ended)
Total Motor Bus Collisions
12
Central Florida Regional Transportation: Annual Motorbus Collisions, 2008-2012
0
10
20
30
40
50
60
70
2008 2009 2010 2011 2012
1 4 2 3 3
1118 18
27
3931
42 4349
66
Collision Type (Rear-ending)
Collisions Type (Rear-ended)
Annual Motor Bus Collisions
5/29/2014
7
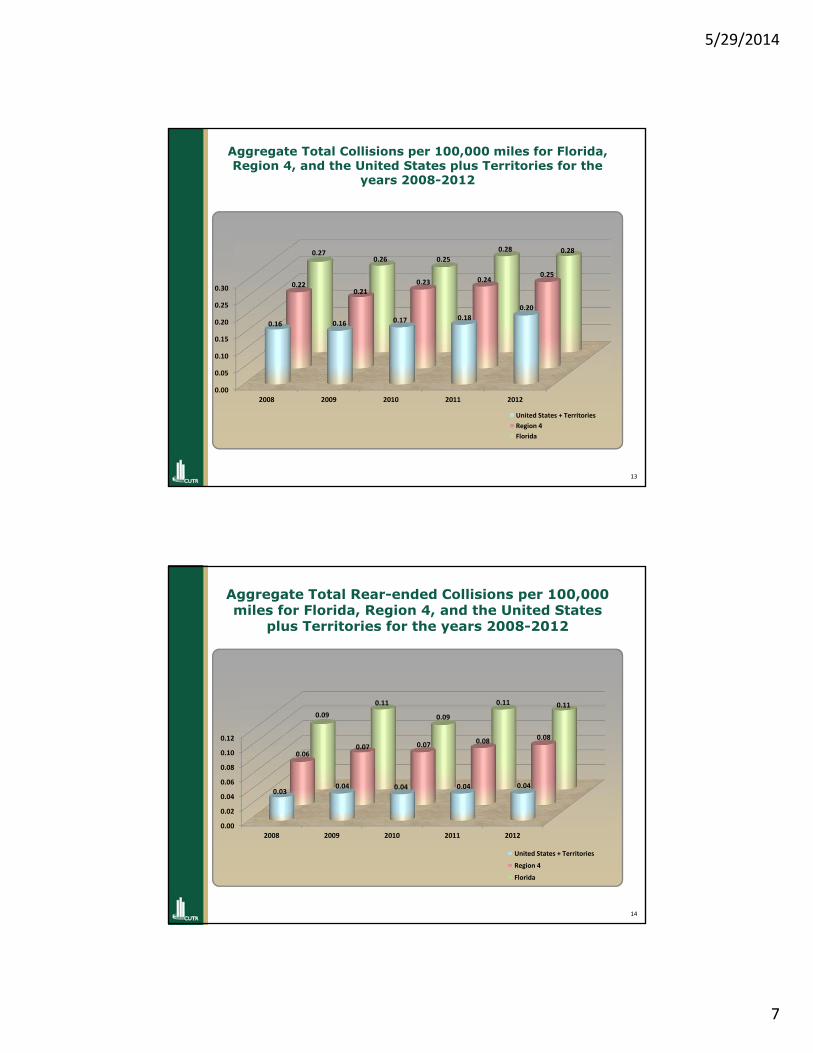
13
Aggregate Total Collisions per 100,000 miles for Florida, Region 4, and the United States plus Territories for the
years 2008-2012
0.00
0.05
0.10
0.15
0.20
0.25
0.30
2008 2009 2010 2011 2012
0.16 0.16 0.17 0.180.20
0.220.21
0.23 0.240.25
0.270.26 0.25
0.28 0.28
United States + TerritoriesRegion 4Florida
14
Aggregate Total Rear-ended Collisions per 100,000 miles for Florida, Region 4, and the United States
plus Territories for the years 2008-2012
0.00
0.02
0.04
0.06
0.08
0.10
0.12
2008 2009 2010 2011 2012
0.030.04 0.04 0.04 0.04
0.060.07 0.07 0.08 0.08
0.090.11
0.09
0.11 0.11
United States + Territories
Region 4
Florida
5/29/2014
8
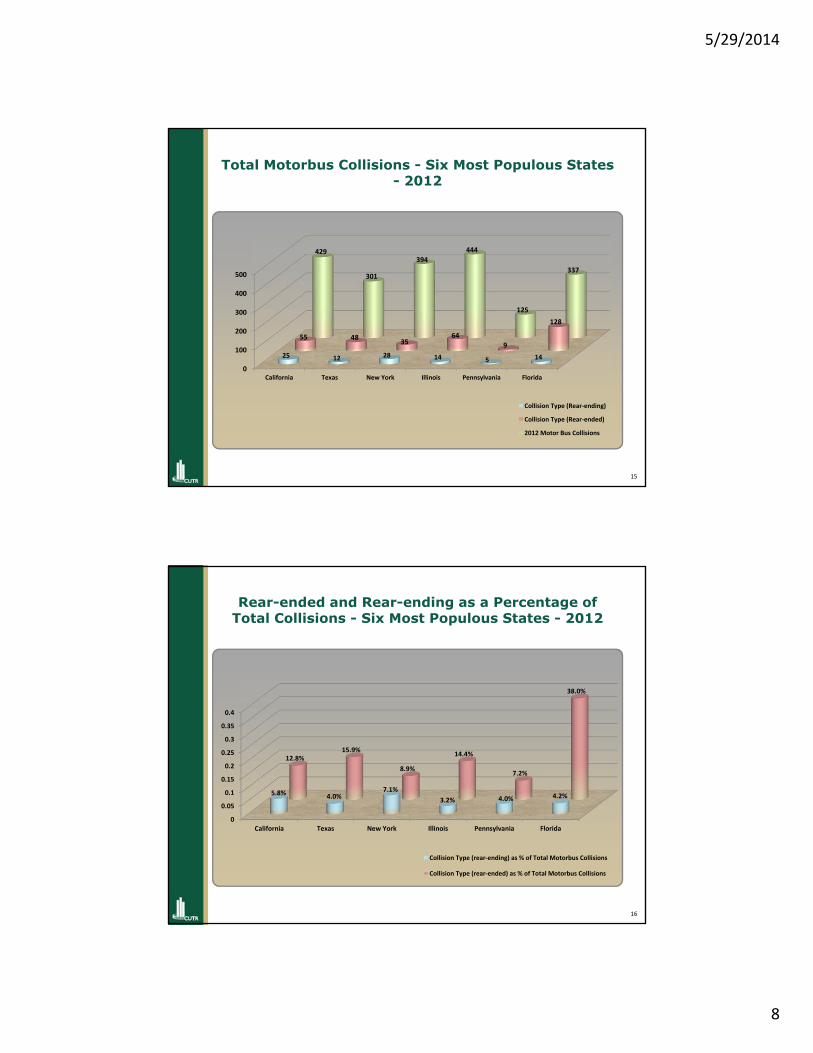
15
Total Motorbus Collisions - Six Most Populous States - 2012
0
100
200
300
400
500
California Texas New York Illinois Pennsylvania Florida
25 12 28 14 5 14
55 48 3564
9
128
429
301
394444
125
337
Collision Type (Rear-ending)
Collision Type (Rear-ended)
2012 Motor Bus Collisions
16
Rear-ended and Rear-ending as a Percentage of Total Collisions - Six Most Populous States - 2012
0
0.05
0.1
0.15
0.2
0.25
0.3
0.35
0.4
California Texas New York Illinois Pennsylvania Florida
5.8% 4.0%7.1%
3.2% 4.0% 4.2%
12.8%15.9%
8.9%
14.4%
7.2%
38.0%
Collision Type (rear-ending) as % of Total Motorbus Collisions
Collision Type (rear-ended) as % of Total Motorbus Collisions

5/29/2014
9
17
Collisions per 100,000 Miles - Six Most Populous States
0.000
0.100
0.200
0.300
0.400
0.500
California Texas New York Illinois Pennsylvania Florida
0.008 0.010 0.015 0.015 0.006 0.012
0.0180.039
0.0190.069
0.011
0.108
0.14
0.240.21
0.48
0.15
0.28
Total Rear-ending Collisions per 100,000 miles
Total Rear-ended Collisions per 100,000 miles
Total Collisions per 100,000 miles
18
Review of Collision Files
• Reviewed a total of 55 files of rear-ended collisions at LYNX (CFRTA) from January 2011 through December 2012.
• Reviewed a total of 51 rear-ended collision files at Broward County Transit (BCT) from October 2011 to September 2013.

5/29/2014
10
19
Factors Coded from Collision Files
• Route Direction, direction the bus was traveling when the collision occurred;
• Roadway surface conditions, expressed as dry or wet;
• Lighting conditions, expressed as light, dark (lighting and no-lighting), dawn and dusk;
• Weather conditions, expressed as clear, cloudy or raining;
• Time factors, including day of week and time of day;
• Roadway factors, which include prevalent rear-ended collision corridors, roadway classifications, ownership, lanes, divided/undivided, jurisdiction, and posted speed limits;
• Transit factors, including stop location (near side, far side and mid-block), bus movement at rear-ended collision location, passenger injuries, and estimated damage; and
• Other vehicle factors, reported for Broward only and including estimated speed of vehicle rear-ending the bus, distraction, obstructed vision, suspicion of drug and/or alcohol use, and whether the driver of the vehicle was transported for medical treatment.
20
Principal Collision Facilities with >1 Rear-ended Collision
0
2
4
6
8
SR 441 BrowardBoulevard
University Drive SunriseBoulevard
Davie Road Coconut CreekParkway
8
65
43
2
Broward
5/29/2014
11
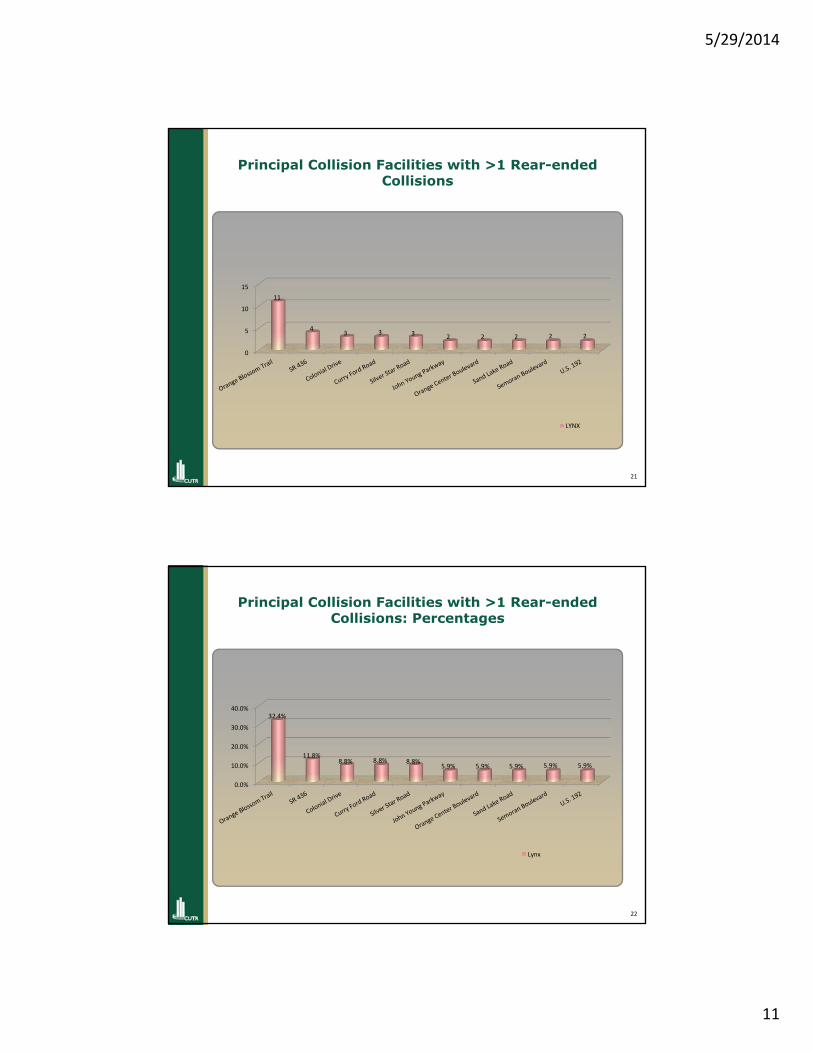
21
Principal Collision Facilities with >1 Rear-ended Collisions
0
5
10
1511
43 3 3 2 2 2 2 2
LYNX
22
Principal Collision Facilities with >1 Rear-ended Collisions: Percentages
0.0%
10.0%
20.0%
30.0%
40.0%32.4%
11.8%8.8% 8.8% 8.8%
5.9% 5.9% 5.9% 5.9% 5.9%
Lynx

5/29/2014
12
23
Roadway Jurisdiction at Rear-ended Collision Location
0
5
10
15
20
25
30
35
40
County Local State
75
37
3
13
39
Broward LYNX
24
Roadway Jurisdiction at Rear-ended Collision Location: Percentages
0.0%
10.0%
20.0%
30.0%
40.0%
50.0%
60.0%
70.0%
80.0%
County Local State
14.3%10.2%
75.5%
5.5%
23.6%
70.9%
Broward Lynx

5/29/2014
13
25
Number of Lanes and Divided/Undivided Roadways at Rear-ended Collision Location
0
5
10
15
20
25
30
35
2 Undivided 4 Divided 4 Undivided 6 Divided 8 Divided
1
12
2
31
4
7
14
10
24
0
Broward LYNX
26
Number of Lanes and Divided/Undivided Roadways at Rear-ended Collision Location: Percentages
0.0%
10.0%
20.0%
30.0%
40.0%
50.0%
60.0%
70.0%
2 Undivided 4 Divided 4 Undivided 6 Divided 8 Divided
2.0%
24.0%
4.0%
62.0%
8.0%
12.7%
25.5%
18.2%
43.6%
0
Broward Lynx

5/29/2014
14
27
Vehicle Lanes and Jurisdiction
0
5
10
15
20
25
30
1 13
52
7
1
28
3
5 4 42 3
86
22
Broward LYNX
28
Vehicle Lanes and Jurisdiction: Percentages
0.0%
10.0%
20.0%
30.0%
40.0%
50.0%
60.0%
2.0% 2.0%5.9%
9.8%3.9%
13.7%
2.0%
54.9%
5.9%
9.1% 7.3% 7.3% 3.6% 5.5%
14.5%10.9%
40.0%
Broward Lynx
5/29/2014
15
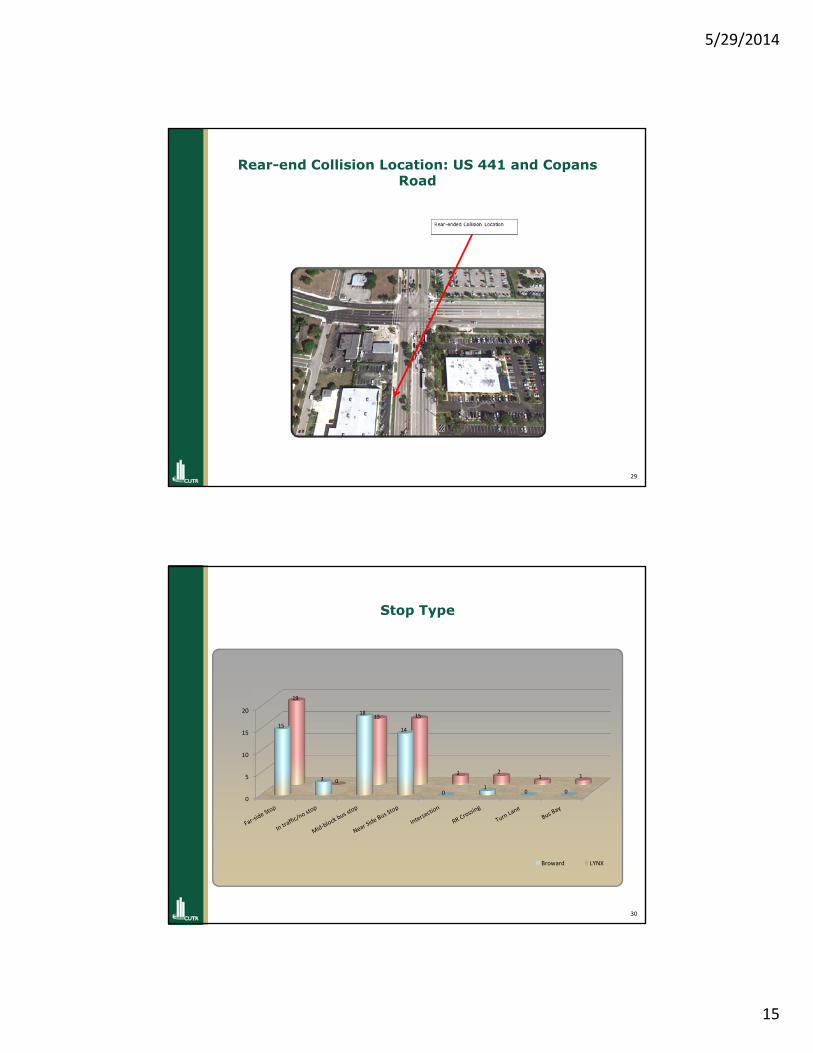
29
Rear-end Collision Location: US 441 and Copans Road
30
Stop Type
0
5
10
15
20
15
3
18
14
01
0 0
19
0
15 15
2 21 1
Broward LYNX

5/29/2014
16
31
Stop Type: Percentages
0.0%
10.0%
20.0%
30.0%
40.0%
29.4%
5.9%
35.3%
27.5%
0.0%2.0% 0.0% 0.0%
34.5%
0.0%
27.3% 27.3%
3.6% 3.6% 1.8% 1.8%
Broward Lynx
32
Bus Movement Status at Rear-ended Collision Location
0
10
20
30
40
50
60
Departing stop N/A Moving Slowing down Stopped
2 1 04
44
0 0 40
51
Broward LYNX
5/29/2014
17
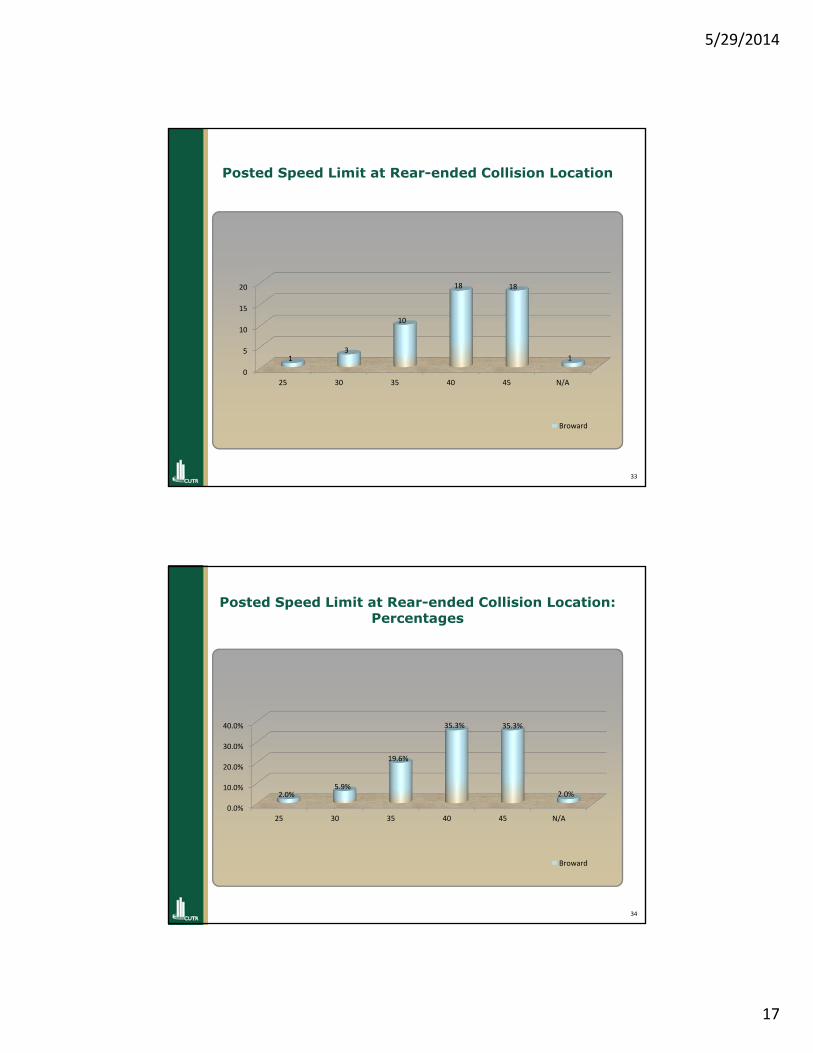
33
Posted Speed Limit at Rear-ended Collision Location
0
5
10
15
20
25 30 35 40 45 N/A
13
10
18 18
1
Broward
34
Posted Speed Limit at Rear-ended Collision Location: Percentages
0.0%
10.0%
20.0%
30.0%
40.0%
25 30 35 40 45 N/A
2.0%5.9%
19.6%
35.3% 35.3%
2.0%
Broward

5/29/2014
18
35
Consultation with Transit Agencies
36
Technology Improvements
• Reflective Striping - PSTA, LeeTran, HART, RTS • LED lights – HART, SCAT in Brevard, LeeTran• Flashing “Stop” signs (Red) – HART, PSTA, LeeTran• Yield to Bus – Illuminated - LeeTran• Yield to Bus – Non-illuminated – Pasco County Public Transit • Cameras/Video – SCAT in Brevard, RTS, HART, PSTA, VOTRAN,
LeeTran, Pasco County Public Transit• Audio (Bus interior) - VOTRAN• 4 red bars to indicate bus is stopping – SCAT in Brevard• 2nd Yield to Bus Sign - LeeTran• Fluorescent lights – Pasco County Public Transit• Red strobe and amber strobe lights – SCAT in Brevard

5/29/2014
19
37
Rear Exterior Treatments –LeeTran Bus
38
PalmTran - Agency with Comparatively High Total Collisions per 100,000 Miles
National Aggregate (U.S. + Territories)Six Most Populous States
Region 4Florida
PalmTran
00.05
0.10.15
0.20.25
0.30.35
0.40.45
2008 2009 2010 2011 2012
0.16 0.16 0.17 0.180.20
N/A N/A N/A N/A
0.220.22
0.210.23 0.24 0.25
0.16
0.26 0.250.28 0.28
0.35
0.41 0.40 0.400.36

5/29/2014
20
39
Total Collisions per 100,000 Miles ‒ Comparison of Aggregate Five-year Agency Data to Florida
Aggregate Data, 2008-2012
0.070.11
0.160.20
0.220.24
0.270.31
0.36
0.370.39
0.490.62
0.00 0.10 0.20 0.30 0.40 0.50 0.60 0.70
ECAT/Escambia County
RTS/GainesvilleSpacecoast/Brevard County
JTA/Jacksonville
VOTRAN/Volusia CountyLeeTran/Lee County
Florida AggregateLYNX/Central Florida
BCT/Broward CountyPSTA/Pinellas County
PalmTran/Palm Beach CountyHART/Hillsborough County
PCPT/Pasco County
FL Transit Agencies
Florida Aggregate
40
HART - Agency with Comparatively High Rear-ended Collisions per 100,000 Miles
National Aggregate (U.S. + Territories)Six Most Populous States
Region 4Florida
HART
0
0.05
0.1
0.15
0.2
0.25
2008 2009 2010 2011 2012
0.030.04 0.04 0.04 0.04
N/A N/A N/A N/A
0.04
0.06 0.07 0.07 0.08 0.08
0.090.11
0.090.11 0.11
0.180.16
0.19
0.22 0.21

5/29/2014
21
41
Rear-ended Collision per 100,000 Miles ‒ Comparison of Aggregate Five-year Agency Data to
Florida Aggregate Data, 2008-2012
0.030.05
0.060.07
0.100.12
0.120.13
0.14
0.150.15
0.200.43
0.00 0.10 0.20 0.30 0.40 0.50
RTS/Gainesville
VOTRAN/Volusia CountyJTA/Jacksonville
ECAT/Escambia County
Florida AggregateSpacecoast/Brevard County
BCT/Broward CountyLeeTran/Lee County
PSTA/Pinellas CountyPalmTran/Palm Beach County
LYNX/Central FloridaHART/Hillsborough County
PCPT/Pasco County
FL Transit Agencies
Florida Aggregate
42
LYNX - Agency Comparatively High Percentage of Rear-ended Collisions to Total Collisions
National Aggregate (U.S. + Territories)Six Most Populous States
Region 4Florida
LYNX
0%
10%
20%
30%
40%
50%
60%
2008 2009 2010 2011 2012
20%23% 22% 21%
18%
N/A N/A N/A N/A
17%
26%
34%31% 33% 32%
34%
43%
35%39% 38%35%
43% 42%
55%59%
5/29/2014
22
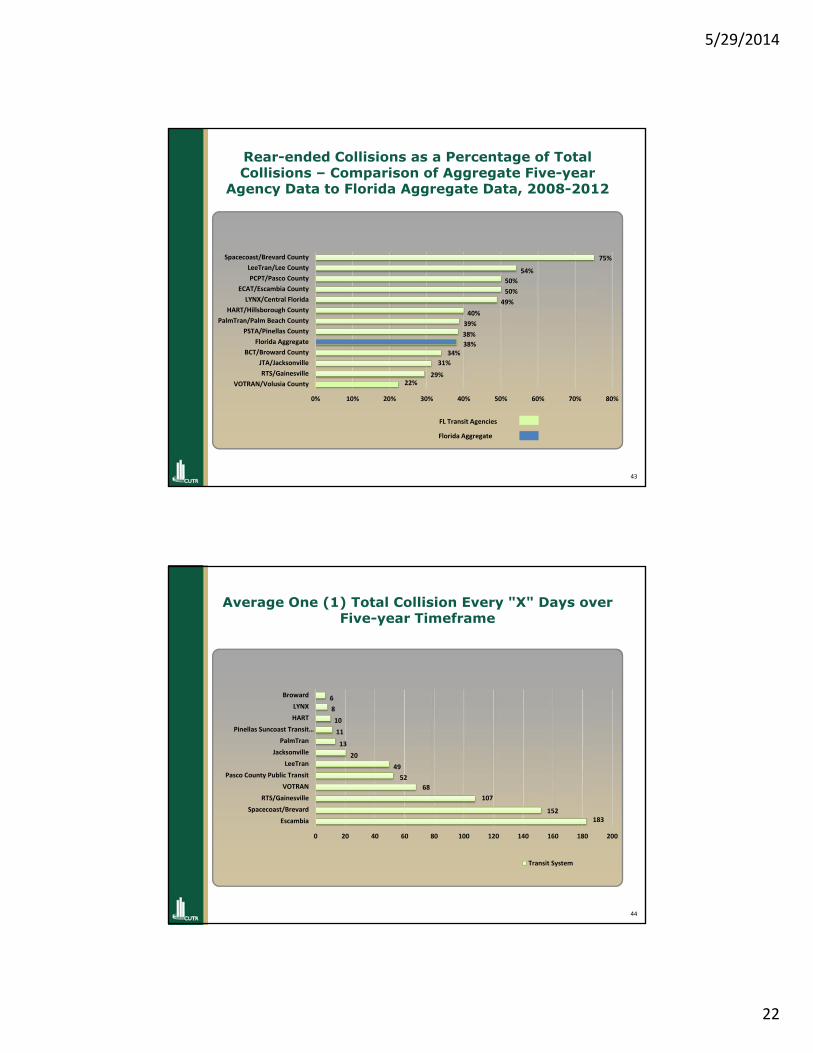
43
Rear-ended Collisions as a Percentage of Total Collisions ‒ Comparison of Aggregate Five-year
Agency Data to Florida Aggregate Data, 2008-2012
22%29%
31%34%
38%38%39%
40%49%
50%50%
54%
75%
0% 10% 20% 30% 40% 50% 60% 70% 80%
VOTRAN/Volusia CountyRTS/Gainesville
JTA/JacksonvilleBCT/Broward County
Florida AggregatePSTA/Pinellas County
PalmTran/Palm Beach CountyHART/Hillsborough County
LYNX/Central FloridaECAT/Escambia County
PCPT/Pasco CountyLeeTran/Lee County
Spacecoast/Brevard County
FL Transit Agencies
Florida Aggregate
44
Average One (1) Total Collision Every "X" Days over Five-year Timeframe
183152
10768
5249
2013
1110
86
0 20 40 60 80 100 120 140 160 180 200
EscambiaSpacecoast/Brevard
RTS/GainesvilleVOTRAN
Pasco County Public TransitLeeTran
JacksonvillePalmTran
Pinellas Suncoast Transit…HARTLYNX
Broward
Transit System

5/29/2014
23
45
Average One (1) Rear-ended Collision “x” Days over Five-year Timeframe
365365
304203
9176
6534
2925
1916
0 50 100 150 200 250 300 350 400
Escambia/PensacolaRTS/Gainesville
VOTRANSpacecoast/Brevard
LeeTranPasco County Public Transit
JTA/JacksonvillePalmTran
Pinellas Suncoast Transit…HART
BrowardLYNX
Transit System
46
Mitigation Strategies• Post-collision investigation• Move/Improve/Remove bus stops• Post-collision training for individual
operators• Annual in-service training• Training for operators to maximize
technology enhancements• Every transit system has policies,
procedures and training but not all agree on effectiveness

5/29/2014
24
47
The “It” Questions
What is the factor or what are the factors that contribute to rear-ended bus collisions?
Is it the amount of service on a facility?
Is it conditions at the bus stop?
Is it the design of the road network?
Is it traffic operations?
48
Future Research
• Factors that are within the control of the transit agency.
• All collisions and reportable incidents– Rear-ended collisions may be most prevalent,
but may not be the most expensive
• Best practices in post-collision investigation• Best practices in risk management

5/29/2014
25
49
Contact Information
William [email protected]
Christopher [email protected]
Download final report:http://www.nctr.usf.edu/2014/04/evaluation-of-rear-end-bus-collisions-and-identification-of-possible-solutions-2/