yardvmc.weebly.comyardvmc.weebly.com/.../trends_in_world_population_fill… · web viewworld...
TRANSCRIPT
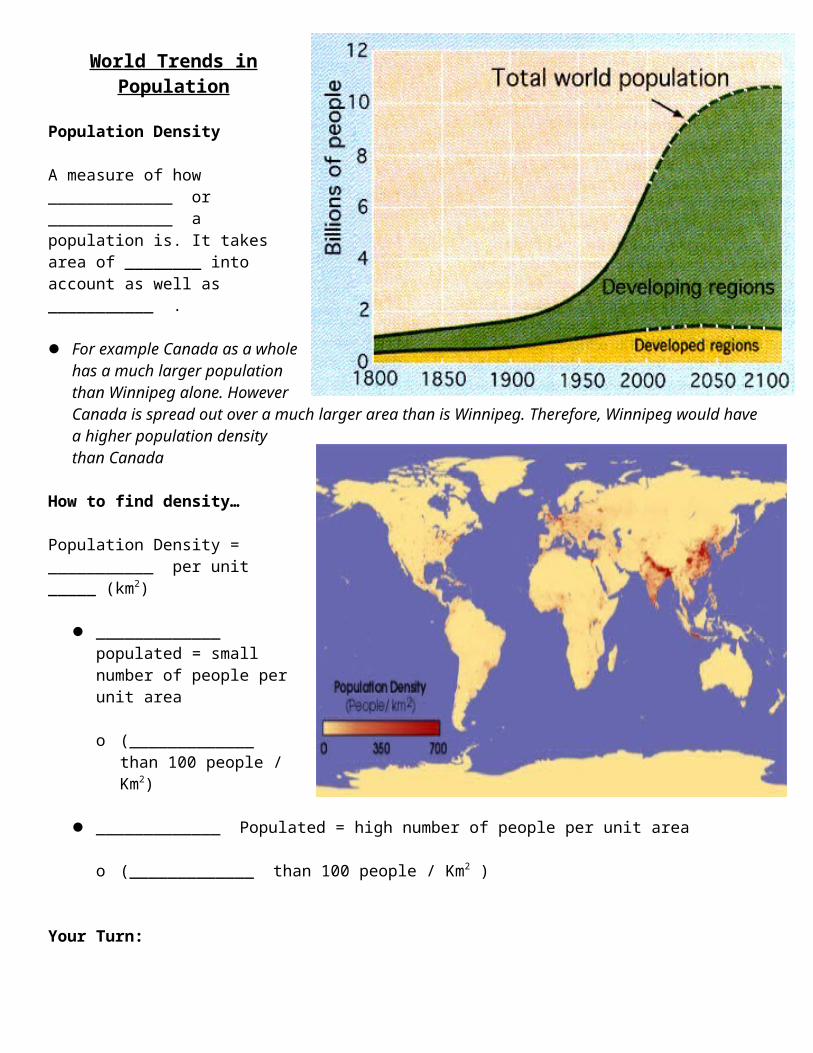
World Trends in Population
Population Density
A measure of how _____________ or _____________ a population is. It takes area of ________ into account as well as ___________ .
For example Canada as a whole has a much larger population than Winnipeg alone. However Canada is spread out over a much larger area than is Winnipeg. Therefore, Winnipeg would have a higher population density than Canada
How to find density…
Population Density = ___________ per unit _____ (km2)
_____________ populated = small number of people per unit area
o (_____________ than 100 people / Km2)
_____________ Populated = high number of people per unit area
o (_____________ than 100 people / Km2 )
Your Turn:

Density: Global Trends
North America: o _____________ populated in _____________ , o _____________ populated along north eastern U.S. and south western U.S.
South America: o _____________ populated in _____________ , o _________ populated along Western Coast but most dense south Eastern
Brazil
Europe: o _____________ populated in _____________ North, o Densely populated throughout _____________
Asia: o _____________ populated in _____________ & _____________ , o Densely populated in _____________ _____________
Africa: o _____________ populated in _____________ , o Densely in _____________ & _____________
Factors Affecting Density
Climate: _____________ comfortable _____________ attract people. Notice that most
people live in a _____________ climate region.
Economics: Population _____________ has changed over time. No longer are dense
populations around _____________ resources. ___________ and the move to the _________ and now the ___________ ages have changed population distribution.
Transportation: _____________
regions attracted business and people because of _____________ transportation. It was true for _____________

settlement and is still true today. Most major cities are located on the _____________ .

Annual Growth Rate (AGR)
Generally it is a measure of "how ___________ is the population _____________ ?" It is measured as the percentage _____________ in a population over a period of
______. The calculation used to provide a measure is known as the
____________________(AGR)
The formula is: AGR = pop. change x 100% ÷ years for change pop. original
Sample calculation of AGR:
Mexico
Mexico’s population changed from 49 million to 72 million between the years 1971 & 1981
AGR = pop. change x 100% ÷ years for change
pop. Original
AGR = 72 – 49 x 100% ÷ 10 = 4.7% (very high) 49
Another…
Sweden
Sweden's population changed from 7.9 million to 8.3 million between the years 1971 & 1981
AGR = pop. change x 100% ÷ years for change pop. Original
AGR = 8.3 – 7.9 x 100% ÷ 10 = 0.5% (very low) 7.9
Your Turn…

How Fast is Fast?
Fast growing: AGR _______ o For example Mexico,
between 1971 & 1981, had a fast growing population with an AGR of 4.7%
Slow growing: AGR _______ o For example Sweden,
between 1971 & 1981, had a slow growing population with an AGR of 0.5%
What Is Canada’s AGR?
Canada’s population was 30.7 million in 2000, and it is now 34.8 million in 2012.What is our AGR over the past 12 years?
AGR = pop. change x 100% ÷ years for change pop. original
AGR=
MB’s AGR
Manitoba grew in population from 1.15 million in 2000, to 1.26 million in 2012.
AGR = pop. change x 100% ÷ years for change pop. original
AGR=
Trends in population growth rates
Most countries population growth rates are _____________ . Especially _____________ nations.
This trend towards lower growth rates should not be confused with decreasing populations. The world’s population is still growing at a _____________ rate.
Note: _____________ nations have __________ AGRs.
Why?
Economic Conditions that Affect Country’s AGR Better _____________ conditions affect a number of things that have allowed
developed nations to _____________ their populations. Some of the _____________ that developed nations enjoy that promote population _____________ include:
1. Education of Masses
educated people are more aware of ___________________ and statistics show that _____________ education is correlated with _____________ number of children.
2. Education of Females
it is assumed that the education of _____________ has resulted in them taking on a greater variety of _____________ roles in _____________ nations. Again statistics show that _____________ educated women tend to have _____________ children
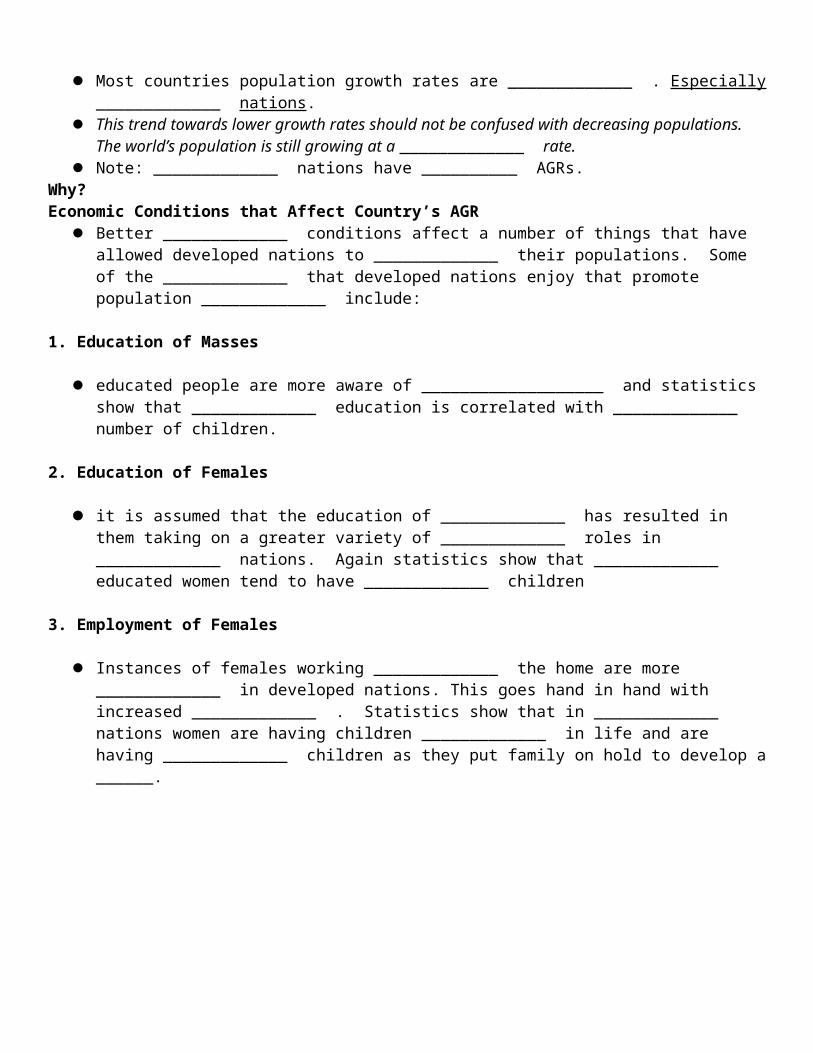
3. Employment of Females
Instances of females working _____________ the home are more _____________ in developed nations. This goes hand in hand with increased _____________ . Statistics show that in _____________ nations women are having children _____________ in life and are having _____________ children as they put family on hold to develop a ______.
4. Ability to access birth control:
While a trip to the corner store for birth control is a _________ task in a __________ nation, in lesser developed nations the cost is ___________ . Feeding the family takes _____________ over birth control. Furthermore the _____________ of a corner store is a problem for some let alone the _____________
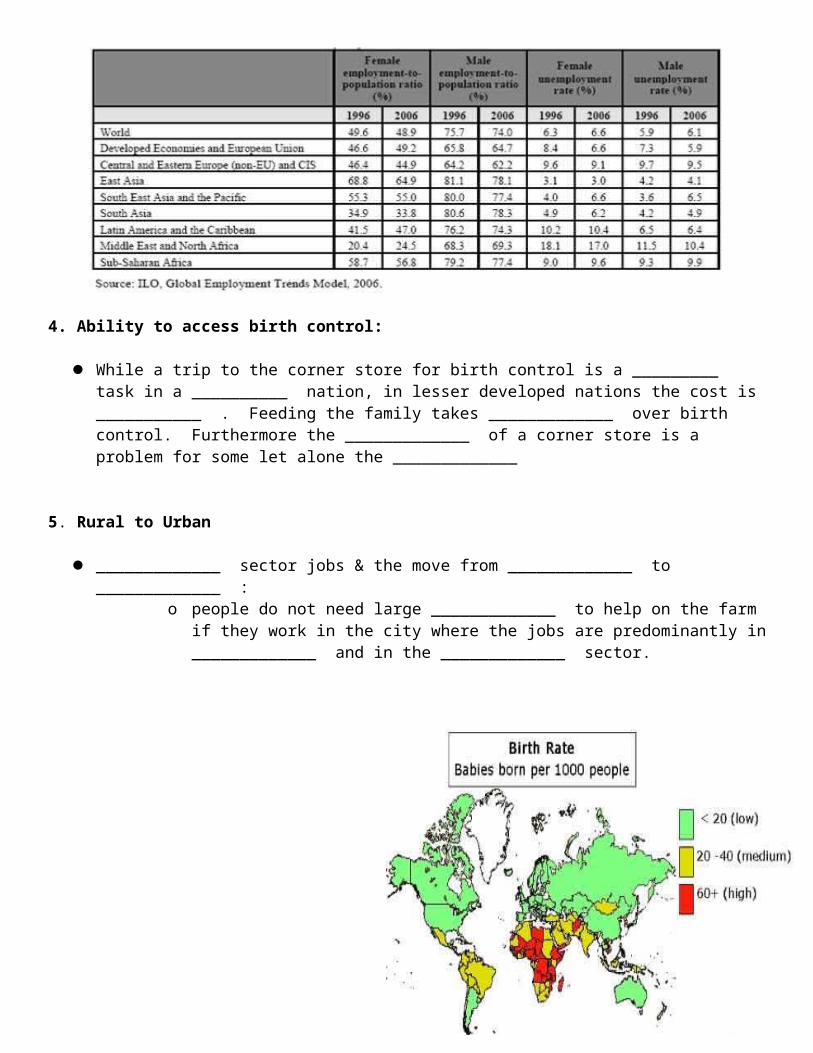
5. Rural to Urban
_____________ sector jobs & the move from _____________ to _____________ :o people do not need
large _____________ to help on the farm if they work in the city where the jobs are predominantly in _____________ and in the _____________ sector.
6. Health Care and Services
_____________ and _____________ planning services are _____________ and are
predominantly found in more _____________ nations. We may not _____________ the services we have available to us because we are so _____________ to them. However our government collects millions of dollars in taxes that contribute to public health _____________ , _____________ , family _____________ clinics, and family _____________ courses in grade school.
Astounding Stats…What’s the Issue?
Nearly one in four people, _____________ , live on less than _____________ . _____________ people in the world today struggle to survive on _____________
Population Control
In developed nations family _____________ , _____________ plans, easy access to birth _____________ , _____________ and a changing _____________ of living have all led to a _____________ , _____________ population. However, in _____________ developed nations, education, family planning, birth control and pensions are all very _____________ to obtain.
What plan (of the 7) would you _____________ to help developing nations control their population?
1. Legislation by government could make it _______ to have more than a certain number of ____ .
Is that humane? How do we ensure the correct number? What is done with children over the limit?
2. Some people have proposed that _____ and ______ used to be our natural means of birth control.
However if we want to have a manageable plan to control the earth's population surely we cannot let people in famine go unaided or reduce peacekeeping missions. Clearly this is not an option.
3. Increasing _____________ of the masses is correlated with _____________ births.
Could we help to provide education in developing nations? Is that humane?
4. _____________ plans & _____________ allow us to be secure into our _____________ and we do not have to worry about having children to _____________ of us.
Is this something we could promote in under-developed nations?
5. In some regions of the world the _____________ between the education received by ___________ and males is ___________ . We know that education of women is correlated with ________ births.
Is the education of women something we could promote?

6. There is little doubt that _____________ is the biggest factor _____________ populations in developed nations.
Could we provide less expensive birth control for developing nations?
7. Highly _____________ economies are associated with _____________ birth rates.
Should we concentrate on supporting improvements to their economies as an ultimate route to controlling birth rates?
8. _____________ has increased and health care has _____________ . Death rates are _____________ and people are _____________ longer…
Should we stop keeping people alive for so long? Is that humane? Who decides?
Natural Change
There are only two factors that can increase a population, _____________ and _____________ .
__________ Increase: considers only _______ as a means of increasing the population.
Likewise, there are only two factors that can decrease a population, _____________ and _____________ .
Natural Decrease: considers only the ______ as a means of decreasing the population.
Natural Change = difference in _____________ & _____________ Natural Increase occurs when there are more __________ than deaths (most
of the World)
Natural Decrease occurs when there are more _______ than births (Some Euros, Japan soon)
Rate of Natural Increase (RNI)
It is a measure of how ________ the population is _____________ by natural causes (births and deaths).

The formula is: RNI = BR – DR
Try:
Population Growth Rate & Standard of Living
_____________ populations are characteristic of a high _________ of __________ due to:
o _____ birth rate caused by good family _____________ , access to _____________ control, _____________ planning, _____________ , etc.
o _____________ death rate caused by good _______ care, _______ , education etc.
Population Growth Rate and Standard of Living
_____________ populations are characteristic of a _____________ standard of living: _____________ birth rate due to poor __________ to birth control, lack of education
etc. _____________ death rate due to _____________ medical care & nutrition
China vs. India
__________ people worldwide lives in either China, (largest _____________ country), or India, (largest _____________ )
China remains the most _____________ nation, with _____________ people, followed by India, which is home to _____________
India's higher _____________ rate means the gap is _____________ and the UN expects it to overtake China before _____________ .
Both are experiencing _____________ growth in _____________ populations.

India and China have to face the challenge of providing for their _____________ populations, just as many Western nations do.
As people live _____________ and fertility _____________ , there will be millions more people in _____________ and fewer _____________ to support them.
It has been suggested that China will have to _____________ its strict _____________ policy to _____________ the problem.
In India, where only ______ of the workforce is covered by formal _____________ schemes, there are questions over how the _____________ will be _____________ .

Population Pyramids
Population _____________ are graphs that show the _________ structure of a population by age & ______________
Notice the following points about population pyramids:o normally ______ are on the
left and ________ are on the right;
o age categories are in ____ year increasing intervals labeled up the __________ axis;
o the _____________ axis is measured in ____________ (or

sometimes in _____ of population).
1. _____________
____________ population pyramids have this classic _____________ / _____________ shape.
The _____ base of this population pyramid indicates a high _______ rate & the narrow top indicates a high _______ rate.
Generally speaking an expanding population is characteristic of a _____________ standard of living:
o high _____________ due to poor access to birth control, lack of education etc.o high _____________ due to poor medical care & nutritiono Note: high ____________________ rate!
2. _____________
population pyramids have a ½ ______ shape.
The ______ of this population pyramid is similar in ________ to the population of the ____________ ages which indicates a _____________ population.
Generally speaking stable populations are characteristic of a _____________ standard of living due to:
o low _____________ due to good family planning, access to birth control, financial planning, education, etc.;
o low _____________ due to good medical care, nutrition, education etc.

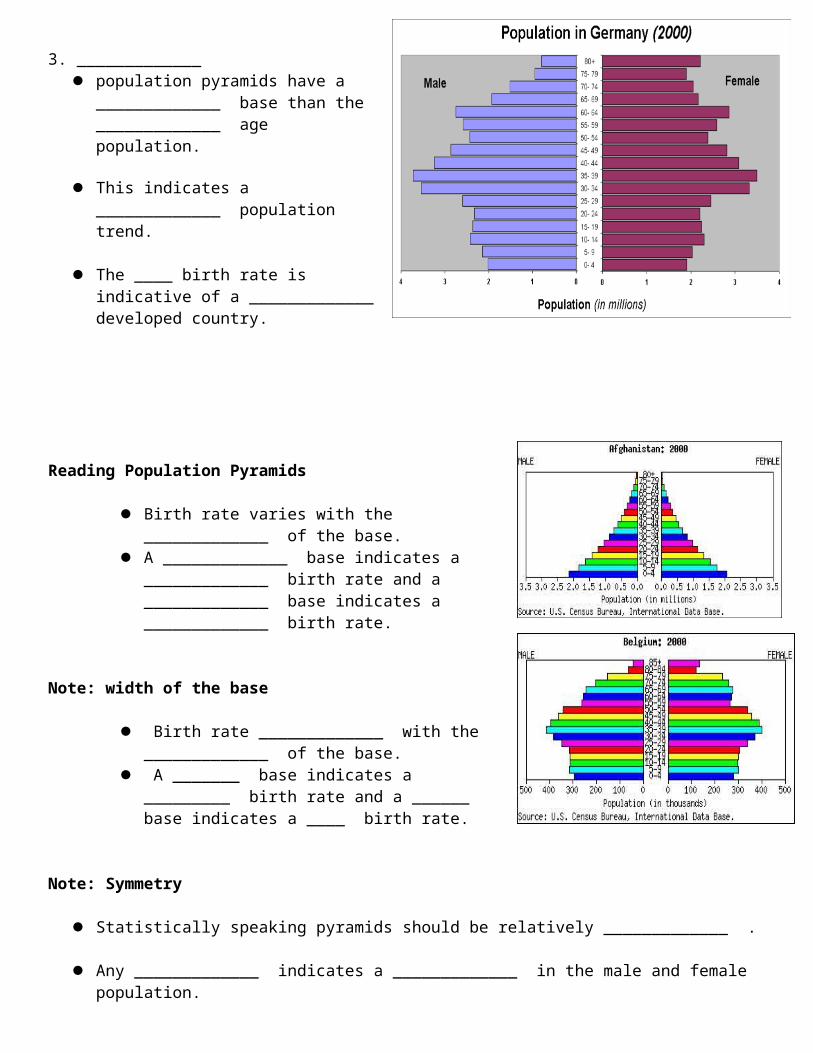
3. _____________ population pyramids have a
_____________ base than the _____________ age population.
This indicates a _____________ population trend.
The ____ birth rate is indicative of a _____________ developed country.
Reading Population Pyramids
Birth rate varies with the _____________ of the base. A _____________ base indicates a _____________ birth rate and a _____________
base indicates a _____________ birth rate.
Note: width of the base
Birth rate _____________ with the _____________ of the base.
A _______ base indicates a _________ birth rate and a ______ base indicates a ____ birth rate.
Note: Symmetry
Statistically speaking pyramids should be relatively _____________ .
Any _____________ indicates a _____________ in the male and female population.
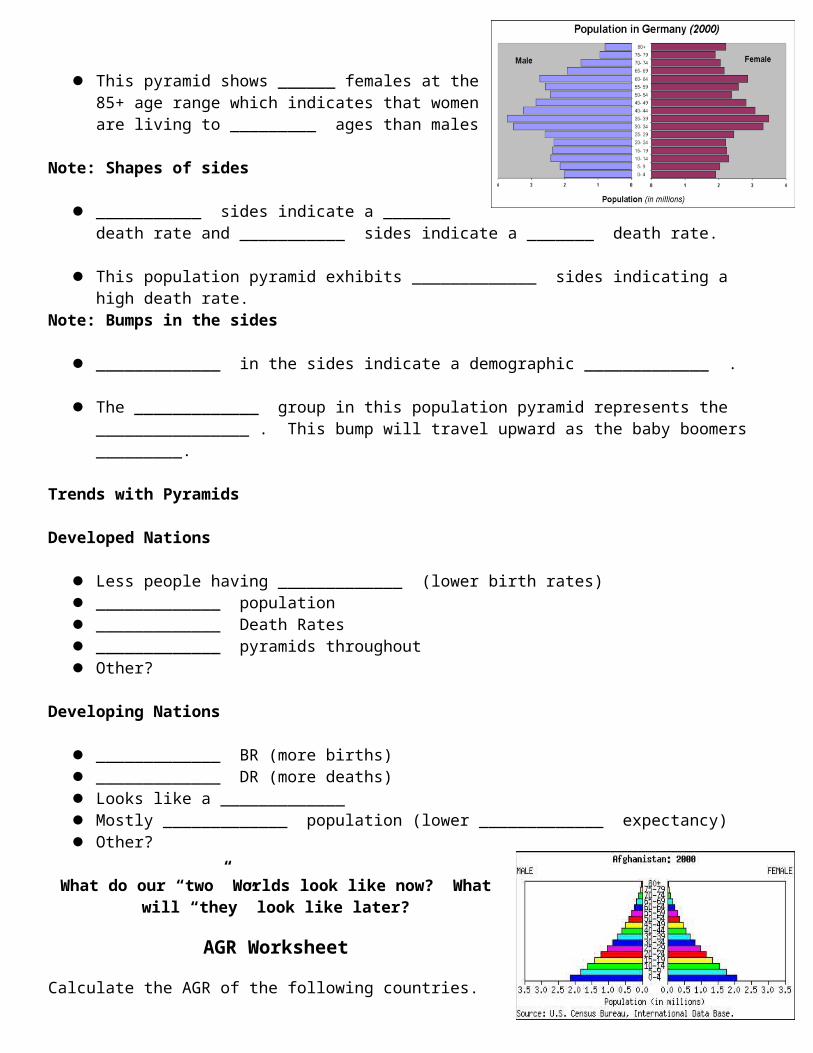
This pyramid shows ______ females at the 85+ age range which indicates that women are living to _________ ages than males
Note: Shapes of sides
___________ sides indicate a _______ death rate and ___________ sides indicate a _______ death rate.

This population pyramid exhibits _____________ sides indicating a high death rate.
Note: Bumps in the sides
_____________ in the sides indicate a demographic _____________ .
The _____________ group in this population pyramid represents the ________________ . This bump will travel upward as the baby boomers _________.
Trends with Pyramids
Developed Nations
Less people having _____________ (lower birth rates) _____________ population _____________ Death Rates _____________ pyramids throughout Other?
Developing Nations
_____________ BR (more births) _____________ DR (more deaths) Looks like a _____________ Mostly _____________ population (lower _____________ expectancy) Other?
What do our “two” Worlds look like now? What will “they” look like later?
AGR WorksheetCalculate the AGR of the following countries.
1. Country A had a population of 24, 222, 000 in 1980, and now has a population of 35, 450, 000 in 2010. What is their AGR?
2. Country B had a population of 123, 500, 000 in 2005, and now has a population of 125, 750, 900 in 2012. What is their AGR?
3. Country C had a population of 14, 000, 000 in 2000, and now has a population of 13, 555, 000 in 2012. What is the AGR?
4. Country D had a population of 300, 450, 100 in 1970, and now has a population of 330, 460, 200 in 2010. What is the AGR?
5. Country E had a population of 15, 790, 350 in 2010, and now has a population of 15, 900, 784 in 2012. What is their AGR?
China's One Child Policy
By Brian Carnell
Wednesday, May 17, 2000
One of the more extreme measures taken in an attempt to control population has been China’s one-child policy. Some environmentalists and population advocates ranging from Garrett Hardin to media mogul Ted Turner have suggested the rest of the world adopt similar policies. Unfortunately for Hardin, Turner and others, when you get beyond the mythology and seriously examine the one-child policy, it is clear the policy is not viable even if one can stomach the horrendous human rights violations it entails.
Following the consolidation of politically power by the Communists in China, the nation’s population exploded. Annual population growth exceeded 2 percent for most years between 1949 and 1974 (Tien et al 1992, p.6). Beginning in the mid-1970s, however, China abruptly shifted gears and fertility declined dramatically. The annual population growth rate has remained around 1.5 percent since the mid-1970s.
This sequence of events is significant mainly for this reason -- the one-child policy wasn’t adopted by China until 1979, yet China’s huge fertility drop occurred between 1970 and 1979 when live births fell from 34 per 1,000 people to 18 per 1,000 people. Since the introduction of the one-child policy in 1979, there has been no large drop in fertility and in fact China experienced a slight increase fluctuating around 21 births per 1,000 people in the 1980s (Tien, et al 1992, pp.6-8). As Tien, et al put it, the impact of the one-child policy has been minimal:

The TFR [Total Fertility Rate] never fell below a 2.5 child-per woman average in rural areas, although it dropped to about 1.2 in urban areas. By the mid-1980s, less than one-fifth of all eligible married couples had signed the one-child certificate -- a contract which granted couples and their child economic and educational advantages in return for promising not to have more than one child. Throughout the 1980s, nearly half of all reported births were second, third, or higher order births. Various surveys suggested that the desire to have at least two children remained strong among Chinese couples (Tien, et al 1992, p.11).
Why did the one-child policy fail? The likely explanation is that there are limits to how far government policies can push demographic changes. Policies emphasizing later marriage and fewer children in the 1970s clearly played a part in lowering total fertility rates. Contraceptive usage in China by the early 1980s, for example, was extraordinarily high for Asia at 71 percent of women of reproductive age.
The one-child policy, however, was strongly resisted by people, especially couples living in rural regions. Enforcing the one-child policy in the face of such heavy resistance would have required more forceful measures than the Chinese government was willing to use. This is the source of criticism of China from population advocates such as Garrett Hardin who argued China needs to more strictly enforce the one-child policy.
Finally, the one-child policy and the successful resistance to it should give pause to claims made in Western nations that there are up to 500,000 "missing" girls in China. The usual claim is that the "missing" girl phenomenon is caused by infanticide. In fact a far more likely explanation is that Chinese couples systematically fail to report the birth of girls. Tien et al note that figures on the sex ratios of adoptions bear this out:
Adoptions rose sharply in the 1980s. There were over 500,000 cases in 1987 and about 400,000 per year between 1984 and 1986, compared with fewer than 200,000 before the one-child policy. The extremely low sex ratios of 27 to 36 boys per 100 girls among the adopted children are not surprising; parents traditionally are more likely to give away girls, a practice that intensified under the one-child stipulation. When the adopted children by year of adoption are added to their respective cohort of births, the sex ratio at birth comes closer to normal for the years in question. This reduces the number of missing girls by half (Tien, et al 1996, pp.15-17).
In addition, girls in China, like girls in much of the developing world, receive far less attention and resources than boys. As a result the sex ratio of infant deaths in China averaged 114 over the 1980s (Tien et al 1996, p.16-7).
This low ratio suggest that girls receive less care and attention than boys in many Chinese homes, reducing the chance of survival of girls beyond their first birthday. Most importantly, this gender discrimination affects girls most adversely in the poorest areas (Tien, et al 1996, pp.16-17).


CHINA’S ONE CHILD POLICY
China performs 13 million abortions a year. When Chen Guangcheng dared criticized the slaughter, the government of China threw him in prison for four long years. So, while the U.S. State Department and Chinese officials wrangle over Mr. Chen's fate, the larger questions concern the horrific contours of government population control and the fate of those who dissent in China.
While the One Child Policy has been effective in drastically reducing Chinese birth rates, the measures adopted in its name have required exhaustive, violent, insidious and systemic violations of human rights. Starting in 1979, the government of China stripped women of their power over their bodies and erased a family's right to make the most cherished, private and fundamental decisions about their own future.
Today, Chinese law dictates the number of children a family may have, and how close in age they must be. In more remote areas, ghastly regulations bring the full force of the police state to bear on any woman of child-bearing age. If she dares to defy the state's commands on her body, a young woman in China can be fined, and so can her family and neighbors. She can be beaten, ostracized or detained. The belongings of her entire family can be confiscated, their houses bulldozed, and her husband, parents and siblings held hostage until she turns herself in.
When she gives in to authorities, she faces a state-ordered abortion -- with no regard for her health risks or religious beliefs, or viability of her child -- and forced insertion of an IUD. Even further, under Chinese law, a woman may be sterilized by the state if she has a second child, refuses IUD insertion, or fails to appear for one of the quarterly uterus inspections with the population police.
According to the government of China itself, 38 percent of women of child-bearing age have been sterilized, and China performs 35,000 abortions a day, often conducted under coercion. The vast majority are gender selective, as boys continue to be favored over girls.
If a woman manages, despite the odds, to give birth to this unsanctioned child, the full power of the socialist state will crash down upon her newborn infant, who will be denied a residence permit and education papers, restricted from employment and stripped of any child food subsidy.
It's obvious that China faces a range of demographic and economic difficulties stemming from its own population growth, and that the global community has a vested interest in avoiding the worst impacts of that growth. But China cannot suppress its way out by silencing those who question the policy of slaughter. Imagine, instead, that the State challenges its people to a rigorous and open debate in the public square. With 1.3 billion heads put to the task, it's hard to imagine that a better, more humane and effective policy would not surface, one that could be adopted by countries facing similar issue

across the globe. As China emerges as a global leader, it would do well to remember, in the words of Robert Kennedy, "The harshest dissent often goes hand in hand with the deepest idealism and love of country. "
One of China's lesser-publicized tactics is to post a woman's name on a bulletin board in her community under the heading "birth: not allowed." It's a practice that works by enlisting her neighbors and friends as deputy family planning thugs, empowered to monitor her reproductive decisions and notify the police if she becomes pregnant.
It's a brutally effective method -- and one the global community should take inspiration from in our fight to spread human rights in this nation of 1.3 billion and counting. The international community must rediscover its voice. We must commit to posting China's name ourselves, on the biggest bulletins boards on Earth: the global marketplaces of trade, politics and culture. Under the headline, "status quo: not allowed."
Last week, the world was reintroduced to Chen Guangcheng after six years in detention. He is safe, he is free and he is ready to keep fighting. This time, he should do so with the voices of the world at his back.
Kerry Kennedy is President of the Robert F. Kennedy Center for Justice and Human Rights.
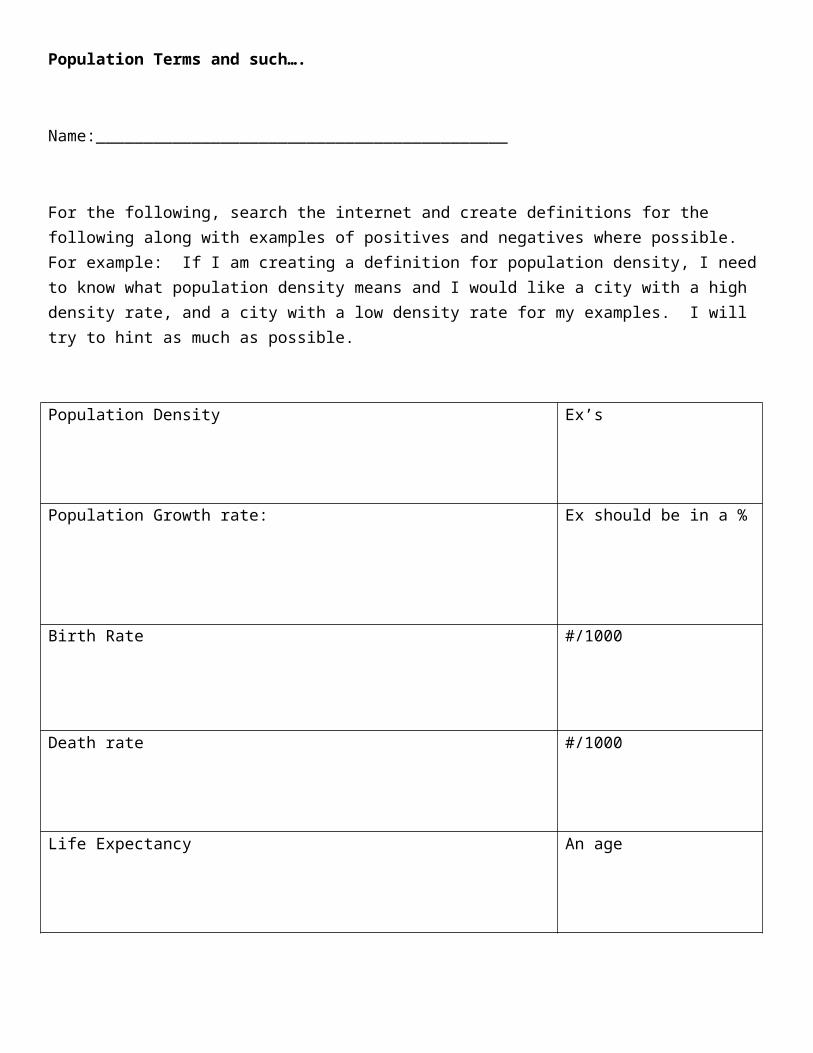
Population Terms and such….
Name:___________________________________________
For the following, search the internet and create definitions for the following along with examples of positives and negatives where possible. For example: If I am creating a definition for population density, I need to know what population density means and I would like a city with a high density rate, and a city with a low density rate for my examples. I will try to hint as much as possible.
Population Density Ex’s
Population Growth rate: Ex should be in a %
Birth Rate #/1000
Death rate #/1000
Life Expectancy An age
Developed Country Ex of countries (3)

Newly Industrialized Country Ex of countries (3)
Developing Country Ex of countries (3)
GDP $ value
Doctors/1000 #/1000
Literacy Rate % of population
Immigration Ex of how it works
Emigration Ex of how it works

World in Balance – The People Paradox
Throughout the video looking at various population issues around the world, jot some notes down, and prepare an answer to the following questions. It would be best to use facts and statistics to help your answer when you can. Please organize answers into 3 separate responses. This mini-assignment will be due the following class: ________________________
India:
What are the major issues in terms of population problems? In your answer, discuss the following:
Women and their role
Tradition vs. Not
Male children vs. Female children
Solution?
Japan:
What is the issue facing Japan in the near future? In your answer, discuss the following:
The new women in Japan
What is going to happen to Japan? How do we know?
How will they deal with this problem?
Solution?
Kenya:
What is the issue in Kenya? In your answer, discuss the following:
Role of women
Role of a virus
What will Kenya look in the future?
Solution?
Population Assignment – GEO20
Name:____________________________________
In this very short unit, you (individually) will be responsible for comparing/contrasting two different types of countries: Developing and Developed. Using PowerPoint, create a slideshow comparing your two countries.
Choosing your countries: (if you’re not sure, come and see me…I’d like you to try first though)
Choose 1 Developed Country:______________________________
Choose 1 Developing Country:______________________________
You will need to find/create the following for each country in order to compare/contrast:
1. General information :
Size/area
Population
Religion
Languages/religions/anything cultural you deem important
Capital
government type
What does all this mean?
2. Development status:
GDP
education of masses
Doctors per 1000
life expectancy
What does all this mean?
3. Population Density of country and largest cities (2)…this is not overall population.

4. Annual Growth Rate (AGR) for both countries:
If there are areas of countries with differences, please add
Was there a time where things changed drastically? (increased or decreased?)
What does all this mean?
5. Reasons for high or low AGR (please discuss both countries):
Education of females vs. education of the masses
Roles of Females vs. Males
Birth Control?
Does development status have anything to do with above? Why/Why not?
Employment of the masses (females vs. males)
Explain.
6. Advice: Your last slide should provide advice from you to your 2 countries. For each, be specific in what you think needs changing, and how they may be able to do that.
7. Summary: This will not be included in your PowerPoint presentation, but attached as a word document. Please take a look at your information above and summarize why your two countries are fine or having difficulty with population numbers. Please provide facts rather than a general summary (ex of what not to write: “China is having trouble because they have too many people….” I need to know why they have so many, and what they are doing to control numbers if anything, and I need to know what the future looks like for China as we breach 7 Billion people….)
**You will need to read and search a lot for very specific information. Don’t settle for the first thing you find. Demand more answers! I will.
Due: __________________
How to submit your assignment:

Population Control Propaganda Poster
Propaganda is ... the deliberate attempt by some individual or group to form, control, or alter the attitudes of other groups by the use of instruments of communication, with the intention that in any given situation the reaction of those so influenced will be that desired by the propagandist.
To Summarize Propaganda
is deliberate aims to control or alter people's attitudes aims to produce predictable behaviour by those who have had their attitudes
controlled or altered does not depend on violence or bribery
Individually, create 2 posters which will convince a group to change how they view population and/or family planning. I would like you to choose two different regions for your two messages. Some possible messages could be:
Birth rates Death rates Immigration Urban/rural AGR Overpopulation Other???
Assignment:
1. Decide which country or area is to receive your message. Your messages must include facts and statistics form the given area (lab Tues/Thurs)
2. Choose suitable slogans/messages for these groups.
3. Create 2 posters which are both eye catching and convincing.
4. Present the poster to the class. Explain why you think this approach would change a person’s attitude. (Depending on time available…)
5. Provide a ½ page summary for each issue of your given region/country. Your page should also provide suggestions as to how they can solve their problem. Consider the research you have just done! That’s the information you will need for your explanation.
Due Date:_____________