web humanitarianism in the network age
DESCRIPTION
TRANSCRIPT

OCHA POLICY AND STUDIES SERIES
HUmANITARIANISm IN THE NETwORk AgEINCLUDINg wORLD HUmANITARIAN DATA AND TRENDS 2012

OCHA POLICY AND STUDIES SERIES
HUmANITARIANISm IN THE NETwORk AgEINCLUDINg wORLD HUmANITARIAN DATA AND TRENDS 2012

ACkNOwLEDgmENTS
OCHA wishes to acknowledge the contributions of its committed staff at headquarters and in the field in preparing and reviewing this publication.
Managing editors: Rahul Chandran, Andrew Thow (OCHA)Editors: Daniel Gilman, Andrea Noyes (OCHA)Team Leader: Christina Bennett (OCHA)Copy Editor: Nina Doyle (OCHA)Design, graphics and layout: Hype & Slippers, Broadley Design and raven + crow studio, OCHA Visual Information Unit
This publication was made possible by the critical support and feedback from our advisory group members: Rob Bailey, Paul Knox-Clarke, Paul Currion, Dennis Dijkzeul, Mark Foran, Rachel Houghton, Ashley Jackson, Hugh Macleman, Jemilah Mahmood, John Mitchell, Gisli Olafsson, Emrys Schoemaker, Alexandra Sicotte-Levesque, Nigel Snoad, Philip Tamminga and Peter Walker.
We would also like to thank our team of researchers and consultants: Mark Bailey, Ivo Bottcher, Grant Gordon, Emmanuel Letouzé, Lezlie Morinière, Angela Raven-Roberts, Mark Turner, Imogen Wall and Lauren Young.
We are also grateful for the support and advice provided by our colleagues at ACAP (Lars-Peter Nissen), UNDP (Maxx Dilley), FAO (Cristina Amaral, Laurent Thomas, Sandra Aviles, Sue Lautze, Tomio Shichiri), WFP (Alfred Gilman, Anthony Craig, Brian Lander, Joyce Luma, Darlene Tymo, Graham Farmer, Martin Kristenssen), IFRC (Neil Bauman), HAP (Robert Schoefield), UNHCR (Jens Hesemann, Kimberly Roberson, Shelley Gronell), UNICEF (Gavin Wood, Genevieve Boutin, Josephine Ippe, Michel LePechoux, Dermot Carty, Christopher Fabian, Erica Kochi), SocialMedia4Good (Timo Luege) and UN Global Pulse (Robert Kirkpatrick).
Humanitarian data and trends was developed by OCHA Policy Development and Studies Branch in partnership with Lydia Poole and Lisa Walmsley of Development Initiatives.
Photo credits: Page 8 – AP Photo / Rafiq Maqbool; Page 22 – Bill & Melinda Gates Foundation / Natasha Fillion; Page 42 – AP Photo / Sayyid Abdul Azim; Page 54 – Dennis Drenner / American Red Cross.
United Nations publication Sales No. E.13.III.M.1 Price USD $28.00 ISBN-13 978-92-1-132037-4 eISBN 978-92-1-056103-7 Copyright © United Nations 2013
For more information, please contact:Policy Development and Studies Branch (PDSB)UN Office for the Coordination of Humanitarian Affairs (OCHA)E-mail: [email protected]: +1 917 367 4263

1
TAbLE Of CONTENTS
Executive Summary 2Introduction 6Chapter I: The network age 9 1. The Increased Reach of Communications 10 2. New partnerships for humanitarian action 16 3. The need for change 18Chapter 2: Humanitarian information in the network age 23 1. The opportunity: Data in the network age 25 A. Big data 26 B. Rich data through Geographical Information Systems 28 C. Open data 29 2. New techniques for the network age 29 A. Crowdsourcing 29 B. Crowdseeding 30 C. Mobile cash 32 3. Challenges and risks 34 A. Accuracy and utility 34 B. Bias 35 C. Power 35 D. Information overload 38 E. Increased expectations 38 F. Privacy, ethics and security 39 4. The need to adapt 40Chapter 3: Adaptation and change 43 1. Adapting to new data sources, tools and techniques 44 A. Ethical issues around new sources of information 46 2. Adapting to new partnerships and techniques in humanitarian action 46 A. Participatory mapping for preparedness and risk reduction 46 B. Community early warning systems 47 C. Standards as a basis for communications 49 3. Information as a basic need in humanitarian response 49 4. A holistic approach 52Chapter 4: Conclusions and recommendations 55Annex A: Further operational recommendations 58Glossary 61References 63World Humanitarian Data and Trends 2012 67

2
ExECUTIvE SUmmARY
In rich and poor countries, people are connecting through technology at an accelerating pace. In 2012, global mobile phone subscriptions topped 6 billion, including more than 1 billion smart phones, each with more computing power than NASA used to send a man to the moon. The planet has gone online, producing and sharing vast quantities of information.
Private corporations, Governments and humanitarian aid agencies are racing to understand how this will change the way they do business. Some see great opportunities; many face uncertainty. But everyone agrees that technology has changed how people interact and how power is distributed.This report explores how new ways of interacting are bringing people in need closer to people who can help. It responds to the changing needs and practices of communities, volunteers and frontline responders. It tells the story of agencies listening to their demands for change and responding creatively.
The report imagines how a world of increasingly informed, connected and self-reliant communities will affect the delivery of humanitarian aid. Its conclusions suggest a fundamental shift in power from capitals and headquarters to the people aid agencies aim to assist.
For some, this is an unsettling prospect. It calls for more diverse and bottom-up forms of decision-making—something that most Governments and humanitarian organizations were not designed for. Systems constructed to move information up and down hierarchies are
facing a new reality where information can be generated by anyone, shared with anyone and acted on by anyone.
This report focuses on organizations that are embracing these changes and reorienting their approaches around the essential objective of helping people to help themselves. It highlights their experiments and efforts to adapt, and the sometimes remarkable results. But it also recognizes the pitfalls and the fact that progress has not always been smooth.
The first section is divided into four chapters. The first chapter charts how new communications technologies are already affecting people’s behaviour in emergencies. The second chapter lays out some of the most pertinent features of these new technologies, and identifies the opportunities and difficulties in applying them. The third chapter describes how many aid agencies are adapting to a more open, participatory way of interacting with people in crisis, and how that is affecting their activities. The fourth chapter proposes a plan for humanitarian organizations to adapt.
The second section of this report presents country-level data and trend analysis relevant to humanitarian assistance. It brings this information together in one place and presents it in an accessible way. While researching this report, it became clear that there is no single, unified data repository that can support a better understanding of how humanitarian action continues to evolve. This section is a first step towards addressing this issue.

3
Chapter 1: A story of change
On 6 August 2012, Kassy Pajarillo issued an urgent appeal on the social network Twitter: her mother and grandmother were trapped by surging floodwaters in the Filipino capital, Manila, could anybody help? Within minutes, emergency responders had dispatched a military truck, and her family was saved.
Kassy was one of thousands of people that day who turned to digital social networks, galvanizing communities across the city and beyond to join hands: Government authorities, emergency responders, health officials, private businesses, multinational corporations and local citizen groups.
Chapter 1 presents the new face of emergency response, in which people from all walks of life are using modern communications technologies to help each other. Just as private companies are interacting more effectively with their customers, humanitarian agencies have an opportunity to get closer to the people they assist.
The spread of mobile phones, the growth of the Internet and the rise of digital social media are enabling people to reach out to each other across previously impenetrable divides. For example, in February 2012, citizens from across crisis-wracked Somalia communicated via SMS with high-ranking Government officials who had gathered at a summit in London to determine their future.
On offer is a better model for making humanitarian policy, whereby people determine their own priorities and then communicate them to those who would assist. This model offers the potential for new partnerships, in which groups that previously worked in isolation come together for a common cause.
These opportunities could not have come soon enough. Natural and man-made disasters are affecting more people more often and at more cost than ever before. By rethinking how aid agencies work and communicate with people in crisis, there is a chance that many more lives can be saved.
Chapter 2: Humanitarian Information in the network age
In a crisis, getting timely access to information is a matter of life and death. As more organizations become involved, the premium on establishing working information systems rises. But during periods of conflict or after a natural disaster, information gathering and analysis can become extremely difficult, and decisions are often made without a clear picture of the situation.
Analyses of emergency response during the past five years reveal that poor information management has severely hampered effective action, costing many lives. Responders have been hamstrung by a lack of shared standards and sharing. Despite efforts to improve, the flow of information between aid agencies and the people they help has consistently been overlooked.
Chapter 2 outlines how new technology offers humanitarian organizations the chance to address these shortfalls. Big data offers the chance to correlate and analyse vast pools of information, generating surprising insights into the places they operate. Data exhaust allows the by-products of one activity—such as cell phone usage—to be used in analysing ostensibly unrelated phenomena, such as the spread of cholera. Geographical Information Systems (GIS) situate data in place and time more accurately than previously possible. Open-data initiatives are providing access to information that was previously limited to a privileged few.

4
New ways of gathering and organizing information have spawned powerful applications for humanitarian agencies. Crowdsourcing and crisis mapping enable the rapid, low-cost and accurate analysis of complex situations, and offer new ways of visualizing that information for decision makers. Crowdseeding does this in a more targeted way by collaborating with specific individuals. Mobile cash offers faster and more secure ways of getting resources to people in need, as well as a more accurate understanding of how they use those resources, enabling more targeted delivery.
While ripe with potential, these techniques also bring significant complexities. The use of large open-data sets increases the possibility of compound errors. Information generated by crowdsourcing can be manipulated. Differing levels of access to technology can inject bias into data collected via mobile phones.
The sheer amount of data generated can also have a cost. Unless systems are designed to use it, they can become bogged down. Simply asking for information about needs might raise expectations beyond agencies’ capacity to deliver. Spreading information about highly sensitive situations can put people in danger.
Adapting to the network age requires an awareness of the opportunities and the risks. This can be simplified by following the principles identified in chapter 3.
Chapter 3: Humanitarian Aid in Flux
To take advantage of the new information environment, aid agencies need to adapt in three ways. They need to finds ways to work with new data sources, to collaborate with a wider range of partners, and to understand that information in itself is a life-saving need
for people in crisis. It is as important as water, food and shelter.
Adapting to new data sources requires an understanding of what is on offer, and the capacity to translate the data into useful information. As the 2010 Haiti crisis revealed, the usefulness of new forms of information gathering is limited by the awareness of responders that new data sources exist, and their applicability to existing systems of humanitarian decision-making. Accessing new data sources may require listening to people who may previously have been ignored.Using new forms of data may also require empowering technical experts to overrule the decisions of their less informed superiors.
Adapting to new forms of partnership includes working more closely with affected communities to create products useful to them. A map only understood by a few GIS experts in an aid agency is no use in a situation where the primary responders come from the towns and villages at risk. This may mean working with local councils to make intuitive maps, as in the Philippines, or working with small businesses to fund community-driven early warning systems, as in Malawi. Effective communication between partners requires the adoption of shared standards—a necessity that is not given enough priority.
Understanding information as a basic need requires a reassessment of what information is for. Instead of seeing it primarily as a tool for agencies to decide how to help people, it must be understood as a product, or service, to help affected communities determine their own priorities. This means understanding how information flows in their particular context. For example, posting flood warnings on the Internet may be less useful than erecting a large siren.

5
Adapting to all three requirements is likely to require more than ad hoc solutions. Humanitarian agencies can learn from other agencies, such as fire departments or militaries, on how to effectively respond to large amounts of often confusing information during a fast-moving crisis. The American Red Cross (ARC) has launched a new Digital Operations Centre in Washington, D.C., dedicated to gathering and translating information received through social media. While most organizations do not have the same level of resources as ARC, there are ways they can take a more holistic approach to the new information environment at a lower cost. The key is that they are open to change.
Chapter 4: Conclusions and Recommendations
To take full advantage of the network age, and to keep pace with the communities it aims to assist Governments, UN coordinating structures, humanitarian agencies, donors, civic groups, volunteers and private businesses need to work together.
Much of this will happen without any high-level prompting, through initiatives that spread on their own merit. But there are areas in which establishing common standards and ways of working can help.
Chapter 4 lays out a series of objectives, proposes criteria by which to measure progress, and suggests a number of steps, broken down by sector, to achieve them. These include enshrining the necessity for two-way communications into common funding pools, such as the Central Emergency Response Fund and consolidated appeals. Effective information sharing with affected communities needs to become a fundamental criterion for selecting and funding projects.
There are precedents, such as the recent introduction of the Gender Marker, to measure projects’ sensitivity to the differing needs of men and women. Achieving these goals is less a technical challenge than a matter of political will.
The main objectives identified are:
1. To recognize information as a basic need in humanitarian response.
2. To ensure information relevant to humanitarian action is shared freely.
3. To build capacity within aid organizations and Governments to understand and use new information sources.
4. To develop guidelines to ensure information is used in an ethical and secure manner.
The aim would be to achieve these objectives over the next three years. The network age, with its increased reach of communications networks and the growing groups of people willing and able to help those in need, is here today. The ways in which people interact will change, with or without the sanction of international humanitarian organizations. Either those organizations adapt to the network age, or they grow increasingly out of touch with the people they were established to serve.
If they choose to adapt, an old dream—enshrined in the Universal Declaration of Human Rights—has a chance of coming true: that all people gain the freedom to seek, receive and impart information and ideas through any media, regardless of any frontiers. That is a goal worth pursuing.

6
INTRODUCTION
In rich and poor countries, people are connecting through technology at an accelerating pace. In 2012, global mobile phone subscriptions topped 6 billion—including more than 1 billion smart phones, each with more computing power than NASA used to send a man to the moon. The planet has gone online, producing and sharing vast quantities of information.
Organizations and institutions across sectors, governments and humanitarian aid agencies are racing to understand how this will change the way they do business. Some see great opportunities; many face uncertainty. But everyone agrees that technology has changed how people interact and how power is distributed.
This report explores how new ways of interacting are bringing people in need closer to people who can help. It responds to the changing needs and practices of communities, volunteers and frontline responders. It tells the story of agencies listening to their demands for change and responding creatively.
This report imagines how a world of increasingly informed, connected and self-reliant communities will affect the delivery of humanitarian assistance. Its conclusions suggest a fundamental shift in power from capitals and headquarters to the people aid agencies aim to assist.
For some, this is an unsettling prospect. It calls for more diverse and bottom-up forms of
decision-making—a model that is not natural for most Governments and humanitarian organizations. Systems constructed to move information up and down hierarchies are facing a new reality where information can be generated by anyone, shared with anyone and acted on by anyone.
This report focuses on organizations that are embracing these changes and reorienting their approaches around the essential objective of helping people to help themselves. It highlights their experiments and efforts to adapt, and the sometimes remarkable results. But it also recognizes the pitfalls and the fact that progress has not always been smooth.
The first section is divided into four chapters. The first chapter charts how new communications technologies are already affecting people’s behaviour in emergencies. The second chapter lays out some of the most pertinent features of these new technologies, and identifies the opportunities and difficulties in applying them. The third chapter describes how aid agencies are adapting to a more open, participatory way of interacting with people in crisis, and how that is affecting their activities. The fourth chapter proposes a plan for humanitarian organizations to adapt to the network age.
The second section of this report presents country-level data and trend analysis of humanitarian assistance, bringing this information together to present it in an accessible way. While researching this report,

7
it became clear that there is no single, unified data repository that supports a better understanding of how humanitarian action continues to evolve. This section is a first step towards addressing this issue.
One report cannot provide all the answers. The report acknowledges that there are serious concerns, in particular a relative lack of empirical evaluation of the new techniques presented. Many anecdotes suggest that these innovations have saved lives, but there is little quantitative assessment, almost no baseline data and insufficient systematic learning. This is recognized and taken into account.
The report concludes that the opportunities clearly outweigh the challenges. More information is more widely available than ever before; making better use of this information will reap rewards. On offer is a better way of designing humanitarian response, whereby people determine their own priorities and communicate them to those who would assist. These opportunities could not have come soon enough. Natural and man-made disasters are affecting more people more often and at a higher cost than ever before. By rethinking how aid agencies work and communicate with people in crisis, there is a chance that many more lives can be saved. Achieving this goal is not a technical challenge—it is a matter of political will.
The report proposes four primary adaptations:
1. To recognize information as a basic need in humanitarian response.
2. To ensure information relevant to humanitarian action is shared freely.
3. To build capacity within aid organizations and Governments to understand and use new information sources.
4. To develop guidelines to ensure information is used in an ethical and secure manner.
The network age, with its increased reach of communications networks and the growing groups of people willing and able to help those in need, is here today. The ways in which people interact will change, with or without the sanction of international humanitarian organizations. Either those organizations adapt to the network age, or they grow increasingly out of touch with the people they were established to serve.
If they choose to adapt, an old dream—enshrined in the Universal Declaration of Human Rights—has a chance of coming true: that all people gain the freedom to seek, receive and impart information and ideas through any media, regardless of any frontiers. That is a goal worth pursuing.

Network age – AfghanistaanAn Afghan man speaks on a cell phone at a
park in Kabul, Afghanistan. The reach of global
communications has expanded dramatically
in the last decade. In Afghanistan, there are
more than 50 mobile phones for every 100
inhabitants.

9
CHAPTER 1
The Network Age
On 6 August 2012, floodwaters surged through the Cavite neighbourhood of Manila, the capital of the Philippines, stranding Kassy Pajarillo’s mother and grandmother. They both called Kassy’s mobile phone to ask her for help.
Kassy tried to drive home and rescue them, but she was stopped by deep waters. Worried about their safety, with her grandmother floating on an inflatable bed on rising waters, Kassy turned to the social network Twitter for assistance.
Twitter users responding to the floods were already organizing themselves around the hashtag #rescueph. By including that hashtag in her tweets, Kassy was able send out frequent updates, including the address and photographs of her family.
It worked. Kassy’s tweet was noticed by Filipino authorities who were monitoring the #rescueph messages. They dispatched a military truck to the neighbourhood, and her family was saved.
Kassy was one of thousands of people that day who turned to social networks for assistance. Those networks became increasingly organized in their response. On 7 August, members of the social networking group Tweetup Manila created a website that aggregated all the calls for help on Twitter, organizing them by name, address, details and status (“urgent rescue”,
“This is not an information age, it’s an age of networked intelligence, an age of vast promise.”Don Tapscott, Author and Professor,
TedGlobal 20121
202 Roxas St Aniban Bacoor Cavite. My mom and Lola who couldn’t walk anymore needs attention and rescue. Flood is waist high #rescuePH
Thank you for immediate help. Here they are @inahkins on their way to get the people stranded along roxas st
6 Aug
Figure 1 Tweets from Kassy Pajarillo requesting and confirming assistance after floods in the Philippines

10
“rescued” or “help on the way”). A dedicated Facebook group, Flood Report Philippines, shared information and images, weather-pattern updates, and information on health risks and how to safely navigate flooded streets.
National and metropolitan authorities also turned to social networks. The Metro Manila Development Authority sent out a stream of information on Twitter. This proved so useful that activists lobbied for the agency’s daily tweet limit to be extended. The Department of Health activated the Government’s Surveillance in Post-Extreme Emergencies and Disasters (SPEED) text message monitoring mechanism to track and respond to disease outbreaks.
Private-sector organizations were also quick to respond. Google activated a dedicated crisis site with a person finder, emergency contact information, news, updates, consolidated maps and satellite imagery. The maps showed which areas were underwater and where citizens could find relief centres. Smart, a major Filipino wireless services provider, set up free call stations in evacuation centres with battery-charging facilities, Internet access and free top-ups for phones. This let people use technology to seek help and establish contact with loved ones.
The frontline of humanitarian action has always consisted of communities helping themselves before outside aid arrives. The fact that the people of Manila turned to their social networks for help is not new. Affected people using technology to communicate, interact with and mobilize their social networks quicker than ever before was new. This resulted in a wider range of
actors—Governments, non-governmental organizations, private companies and volunteers—working together to help.
Modern communications are changing how people interact with each other in all spheres of life. Companies are increasingly weaving the use of real-time information from outside corporate walls into their everyday operations, enabling them to respond to customers’ needs with more speed and greater sensitivity. Humanitarian assistance operates under different motives and rules than the private sector, but the opportunity to use these changes is just as real. More lives can be saved by finding better ways to communicate and better meet people’s needs.
1. The Increased Reach of CommunicationsThe Philippines is a growing middle-income country with a GDP per capita of about US$4,000. It has a mobile phone penetration rate of 103 per cent, with more mobile phones than it has people (its population is 94 million). Filipinos sent an average of 2 billion SMS messages every day in early 2012,
“This is not about tinkering at the edges; this is about devising, living and experiencing a new model of
innovation that is fit forthe twenty-first century.”
Don Tapscott, Author, Macrowikinomics.

11
and over 92 per cent of Filipinos online have used Facebook.4
The penetration of new technology has changed the relationship of the average Filipino to information. They are not simply consumers of information; they are also producers, distributing information freely and widely, to be acted on and responded to by others.
Filipinos are part of a global trend: the emergence of a network age, where increased access to information and communications technologies has encouraged more decentralized decision-making and is helping to reshape social, political and economic activity.
The rise of the network age has been fuelled by the rapid expansion and wider reach of global communications in the last decade. The world now has more mobile-connected devices (mostly phones) than it has people. In
Mobile phone penetration rate in the Philippines. There are more phones than people.
103%
Figure 2Percentage change in mobile phone subscriptions between 2005 and 20116
Top 20 recipients of humanitarian aid
2000-2011
DevelopingWorldDeveloped0
100
200
300
400
%

12
INFORMATION FLOWinformation generated by anyone
transmitted from/to anywhere
INFORMATION FLOWinformation generated by anyone
transmitted from/to anywhere
105 countries there are more mobile-cellular subscriptions than inhabitants.2
As Figure 2 shows, there has been a striking increase in cellular penetration in the top 20 countries that receive international humanitarian assistance. The Group Speciale Mobile (GSM) alliance estimates mobile phone penetration in Africa to be about 70 per cent, reaching 735 million subscribers in 2012, which is up from 4 million in 1998.4
Almost all phones offer access to SMS.
Internet penetration is also growing rapidly. In Africa, 37 per cent of Tunisians and 26 per cent of Kenyans are online regularly.5 This growth in mobile phones and Internet access has facilitated the rapid expansion of digital
Figure 3 Information flow in the network age
“Generally we’ve gotten information…on TV and radio, but
some people do not always have access to that. But just
about every Haitian has a mobile phone.”
Reginald Barbier, student, Port-au-Prince, Haiti

13
social networks, especially in middle-income countries. The Philippines has over 14 million active social network users, Malaysia has 11 million and China over 150 million. It is still early (Internet-based social networks are only about five years old), but the growth is striking.
As the information on the next two pages shows, the adoption, use and choice of technology depend on many factors. They include affordability, availability, literacy, gender, age, status, physical abilities, cultural preferences, political environment, and the media/IT/telecoms network and infrastructure. But as costs fall and coverage increases, all indicators suggest that usage will continue to increase rapidly in rural areas and among poorer people.
The desire to communicate is a fundamental feature of the network age. Pervasive mobile telephony coupled with increasing access to social networks means information about humanitarian needs can be generated from anywhere (such as by a young woman in Manila, concerned about her grandmother) and transmitted to anywhere. At the same time, there are greater numbers of people—Governments, neighbours, local NGOs and international humanitarian organizations—
who are willing and able to respond to needs. The combination of new actors and technological reach has changed the way that people interact with humanitarian assistance. Whereas aid agencies once made assumptions about people’s needs in a crisis, people now have the tools to say what they need and want. By using technology to engage with their own networks, communities and individuals are determining how to help themselves and how they want to be helped by others, mobilizing local, national and sometimes global support to meet their needs.
Improving the flow of information represents the realization of an old ideal. The phrase “freedom to… seek, receive and impart information and ideas through any media and regardless of any frontiers” is in Article 19 of the Universal Declaration of Human Rights.7 Evidence from the frontlines of humanitarian action suggests that this freedom is increasingly demanded and increasingly found.
Together, the increased reach of communications networks and the growing network of people willing and able to help, are defining a new age—a network age—for humanitarian assistance.
Mobile phone subscribers in Africa in 2012. About 70% of the total population.
735 million

14
InternetInternet
Afghanistan
Somalia
Pakistan
Mobile
The increased reach of communications
By the end of 2011, more than 2.3 billion people were using the Internet
• 70% of those living in developed countries use the Internet
• 24% of those in developing countries use the Internet (projected to reach 50% by 2015)
• 6% of those in Least Developed Countries use the Internet (projected to reach 15% by 2015)
While costs are falling, �xed broadband services remain largely una�ordable in Africa
The world now has more mobile-connected devices than it has people – 88% of those devices are basic handsets
In 105 countries, there are more mobile subscriptions than people
Total subscriptions reached almost 6 billion by end 2011, corresponding to 86% of the world’s population
There are twice as many mobile broadband subscriptions than there are �xed broadband subscriptions
• 0.2 per 100 �xed line subscriptions in Africa compared to 3.3 per 100 wireless
• 2.1 per 100 �xed in Arab States compared to 11.7 per 100 wireless
• 6.4 per 100 �xed in Asia and Paci�c compared to 10.7 per 100 wireless
• 15.4 per 100 �xed in the Americas
compared to 29.7 per 100 wireless
Somalia was the 8th largest recipient of international humanitarian aid between 2006-2010 and the largest in 2011
Radio remains the dominant media – there are an estimated 35 local radio stations, though numbers �uctuate as stations are subject to suspension and takeovers by militia
Mobile phones are mainly used for personal communications and banking
• Most communication takes the form of voice calls
• SMS is used by money transfer services to alert recipients that a remittance is ready to collect
Internet use is growing but still limited to male, urban population
In late 2011, a mobile signal from Somalia was the only one available to the 135,000 inhabitants of the Dolo Ado refugee camp in Ethiopia
Afghanistan was the 6th largest recipient of international humanitarian aid between 2006-2010 and the second largest in 2011
Since 2001, the use of mobile telephony has soared, with an estimated 20 million subscribers, representing 65% of the population
In 2008, Roshan – then the largest mobile operator in Afghanistan – partnered with Vodafone to launch the M-Paisa payment service, drawing on the success of M-Pesa in Kenya. The service started by paying police salaries, but rapidly expanded to allow person-to-person money transfer, disbursement and repayment of micro�nance loans, airtime purchases and bill payments, using SMS and Interactive Voice Response (IVR). As of March 2012, Roshan had 1.2 million registered M-Paisa users, with double-digit growth rates, and had dispersed US$26 million in the �rst quarter of the year.
Pakistan was the 2nd largest recipient of international humanitarian aid between 2006-2010 and the 9th largest in 2011
As of October 2012, Pakistan had over 121 million mobile subscribers, representing 68.8% of the population
In spite of low literacy levels, SMS is popular – in 2011 each handset owner sent an average of 140 SMS messages per month. Amongst phone owners in the poorest 60 percent of the population, 51 per cent of men and 33 per cent of women used SMS.
The �oods of 2010 damaged just over 10% of the country’s 30,000 mobile phone base stations, although most were repaired very rapidly. Multiple organizations, ranging from large local NGO’s, such as the Strengthening Participatory Organization, to international organizations, such as IOM, used SMS for humanitarian messaging and feedback.
Internet and mobile technology continue to transform the way that data is generated, collected and shared. Devices and platforms amplify traditional communications and provide new ways of creating and sharing information. As costs fall and coverage increases, all the signs are that usage will increase rapidly in rural areas and among poorer people.
People are able to connect with each other faster and more easily than ever before. This is changing the balance of power, participation and accountability within the humanitarian system.
50%
40%
Cost of using the
internet as a proportion of
average income in
developing countries
6.85Mobile cellular
subscriptions per
100 inhabitants
54.26Mobile cellular
subscriptions per
100 inhabitants
61.61Mobile cellular
subscriptions per
100 inhabitants
People in developing
countries using
Internet by 2015
14
Figure 4

15
InternetInternet
Afghanistan
Somalia
Pakistan
Mobile
The increased reach of communications
By the end of 2011, more than 2.3 billion people were using the Internet
• 70% of those living in developed countries use the Internet
• 24% of those in developing countries use the Internet (projected to reach 50% by 2015)
• 6% of those in Least Developed Countries use the Internet (projected to reach 15% by 2015)
While costs are falling, �xed broadband services remain largely una�ordable in Africa
The world now has more mobile-connected devices than it has people – 88% of those devices are basic handsets
In 105 countries, there are more mobile subscriptions than people
Total subscriptions reached almost 6 billion by end 2011, corresponding to 86% of the world’s population
There are twice as many mobile broadband subscriptions than there are �xed broadband subscriptions
• 0.2 per 100 �xed line subscriptions in Africa compared to 3.3 per 100 wireless
• 2.1 per 100 �xed in Arab States compared to 11.7 per 100 wireless
• 6.4 per 100 �xed in Asia and Paci�c compared to 10.7 per 100 wireless
• 15.4 per 100 �xed in the Americas
compared to 29.7 per 100 wireless
Somalia was the 8th largest recipient of international humanitarian aid between 2006-2010 and the largest in 2011
Radio remains the dominant media – there are an estimated 35 local radio stations, though numbers �uctuate as stations are subject to suspension and takeovers by militia
Mobile phones are mainly used for personal communications and banking
• Most communication takes the form of voice calls
• SMS is used by money transfer services to alert recipients that a remittance is ready to collect
Internet use is growing but still limited to male, urban population
In late 2011, a mobile signal from Somalia was the only one available to the 135,000 inhabitants of the Dolo Ado refugee camp in Ethiopia
Afghanistan was the 6th largest recipient of international humanitarian aid between 2006-2010 and the second largest in 2011
Since 2001, the use of mobile telephony has soared, with an estimated 20 million subscribers, representing 65% of the population
In 2008, Roshan – then the largest mobile operator in Afghanistan – partnered with Vodafone to launch the M-Paisa payment service, drawing on the success of M-Pesa in Kenya. The service started by paying police salaries, but rapidly expanded to allow person-to-person money transfer, disbursement and repayment of micro�nance loans, airtime purchases and bill payments, using SMS and Interactive Voice Response (IVR). As of March 2012, Roshan had 1.2 million registered M-Paisa users, with double-digit growth rates, and had dispersed US$26 million in the �rst quarter of the year.
Pakistan was the 2nd largest recipient of international humanitarian aid between 2006-2010 and the 9th largest in 2011
As of October 2012, Pakistan had over 121 million mobile subscribers, representing 68.8% of the population
In spite of low literacy levels, SMS is popular – in 2011 each handset owner sent an average of 140 SMS messages per month. Amongst phone owners in the poorest 60 percent of the population, 51 per cent of men and 33 per cent of women used SMS.
The �oods of 2010 damaged just over 10% of the country’s 30,000 mobile phone base stations, although most were repaired very rapidly. Multiple organizations, ranging from large local NGO’s, such as the Strengthening Participatory Organization, to international organizations, such as IOM, used SMS for humanitarian messaging and feedback.
Internet and mobile technology continue to transform the way that data is generated, collected and shared. Devices and platforms amplify traditional communications and provide new ways of creating and sharing information. As costs fall and coverage increases, all the signs are that usage will increase rapidly in rural areas and among poorer people.
People are able to connect with each other faster and more easily than ever before. This is changing the balance of power, participation and accountability within the humanitarian system.
50%
40%
Cost of using the
internet as a proportion of
average income in
developing countries
6.85Mobile cellular
subscriptions per
100 inhabitants
54.26Mobile cellular
subscriptions per
100 inhabitants
61.61Mobile cellular
subscriptions per
100 inhabitants
People in developing
countries using
Internet by 2015
15
16
2. New partnerships for humanitarian action For many people, “humanitarian assistance” refers to a small group of established international organizations, often based in and funded by high-income countries, providing help to people in a major crisis. This view is now out of date. As Tim McNamara of the Open Knowledge Foundation observed, the world has seen:
“…not simply a technological shift [but] also a process of rapid decentralization of power. With extremely low barriers to entry, many new entrants are appearing in the fields of emergency and disaster response. They are ignoring the traditional hierarchies, because the new entrants perceive that there is something they can do which benefits others.”
McNamara was referring to the specific case of volunteer crisis mappers. However, the point holds true across all types of humanitarian work. At the local, national, regional and global levels, voluntary and private actors are taking on a greater role in providing humanitarian assistance. These new actors differ widely in their structure and their reach, ranging from local religious groups to regional organizations and global diaspora networks. This decentralization has spawned new forms of cooperation between communities and local and national Governments. One example, outlined opposite, relates to the Buzi river flood-warning system in Mozambique.
It is too early to say how these new partnerships will transform humanitarian
Governments and communities working in partnership in Mozambique
After devastating floods in 2000 killed over 700 people, Mozambique invested significantly in its capacity to respond to crises, with a focus on bringing Government and local communities together in a shared system. The National Disaster Management Agency (Instituto Nacional de Gestão de Calamidades), which previously focused on aid coordination, was given an enhanced mandate to coordinate disaster risk reduction. Emergency operations centres were established at national and sub-national levels to coordinate crisis response.
The Government also invested in early warning and local disaster risk management (DRM) committees. For example, the Inter-District Operational Flood Warning System (SIDPABB) in the Buzi river basin was established in 2007. Volunteers regularly read river gauges, and if the level rises above a threshold they send a radio message to a dedicated data-analysis centre. It assesses the information and may choose to issue a flood warning and alert local DRM committees. This low-tech but networked approach has successfully reduced fatalities, and the Government is working to add high-tech monitoring equipment that can stream information for real-time analysis, further increasing warning lead times.8
The case illustrates the potential of Government/community partnerships and the benefits of formal organization at both ends. As more cases like this appear, evaluations will need to investigate how to maintain volunteer capacities over time, and how context and culture might require differing forms of organization.
17
action, and there will never be an exhaustive list of all these efforts. Too many partnerships take place in response to a rapid need and vanish afterwards. Some may be as simple as a group of neighbours digging their friends out of rubble, working together with whoever can help. In Haiti, one of the most studied emergencies in recent history, it has proven impossible to accurately count the number of NGOs operating there. Estimates range from 3,000 to 20,000.9
However, it is clear that changes have taken place. A recent ALNAP report on the State of the Humanitarian System identified a growing assertiveness of aid-recipient Governments and regional organizations, alongside an increasing capacity to organize their response in emergencies.10 This is partly a function of increased economic capacity and partly a desire for greater self-reliance.
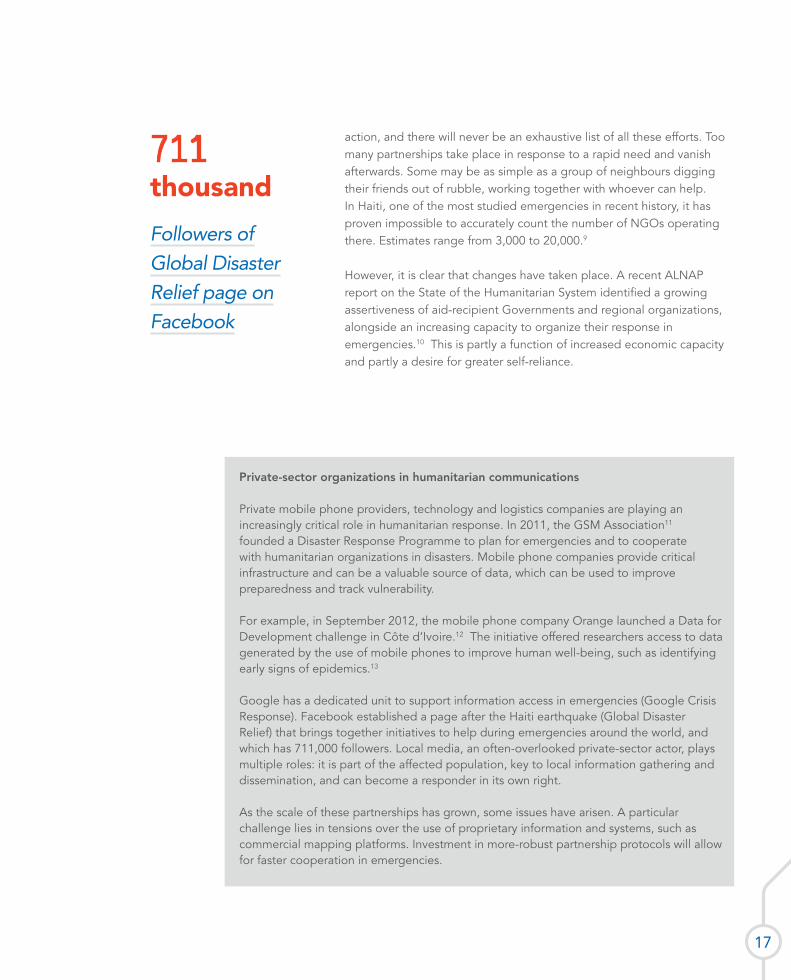
Followers of Global Disaster Relief page on Facebook
711 thousand
Private-sector organizations in humanitarian communications
Private mobile phone providers, technology and logistics companies are playing an increasingly critical role in humanitarian response. In 2011, the GSM Association11 founded a Disaster Response Programme to plan for emergencies and to cooperate with humanitarian organizations in disasters. Mobile phone companies provide critical infrastructure and can be a valuable source of data, which can be used to improve preparedness and track vulnerability.
For example, in September 2012, the mobile phone company Orange launched a Data for Development challenge in Côte d’Ivoire.12 The initiative offered researchers access to data generated by the use of mobile phones to improve human well-being, such as identifying early signs of epidemics.13
Google has a dedicated unit to support information access in emergencies (Google Crisis Response). Facebook established a page after the Haiti earthquake (Global Disaster Relief) that brings together initiatives to help during emergencies around the world, and which has 711,000 followers. Local media, an often-overlooked private-sector actor, plays multiple roles: it is part of the affected population, key to local information gathering and dissemination, and can become a responder in its own right.
As the scale of these partnerships has grown, some issues have arisen. A particular challenge lies in tensions over the use of proprietary information and systems, such as commercial mapping platforms. Investment in more-robust partnership protocols will allow for faster cooperation in emergencies.

18
The report found a larger and more diverse group of NGOs than expected and noted that southern NGOs’ influence was rising. It also found a significant increase in private-sector engagement, as illustrated in the case on page 17.
If humanitarian assistance is to adapt to the network age, understanding more about new actors and partners, their interests and the factors that are driving their greater participation will be essential. It is not clear that new actors are willing to work together in partnership. But the existence of a common goal (saving lives) and a shared basic drive (the desire to help) suggests a potential for deeper partnerships.
3. The need for changeThe network age has enabled a qualitatively different model of humanitarian response. Whereas political leaders and aid agencies, often far away from an emergency, once made assumptions about the needs of people in crisis, those people now have the tools to communicate their own expectations. New tools to engage broader social networks, communities and individuals are more effectively determining how people can help themselves, and how they want to be helped by others—mobilizing local, national and sometimes global support to meet their needs.
The network age is already changing humanitarian action in small yet critical ways. Needs assessments are driven by communities more than ever before, albeit still imperfectly. Preliminary evidence from a BBC, Internews and ActionAid partnership
with communities in Isiolo, Kenya,15 proved that using text messages to provide advance notice of aid delivery reduced the time it took to offload supplies from three or four hours to 30 minutes, because people were prepared for their arrival. Interviews with the community highlighted its satisfaction with this advance notice, as well as benefits from being able to connect to the wider world. These benefits include learning about market prices in nearby towns or where the conflict has flared. SMS messages have also helped to give Somali citizens a voice, as highlighted in the Somalia Speaks case study overleaf.
But there is also evidence that current humanitarian practice has not been able to take advantage of the new technologies and partnerships offered by the network age to share, manage, understand and then act on information in an effective and timely way. For example, early warning signals for the Horn of Africa famine in 2011 did not produce sufficient action in time, leading to thousands of avoidable deaths.16 Similarly, research has shown that the 2010 Pakistan floods were predictable.17 The European
“Being cut off from basic telecommunications services is a
hardship almost as acute as… other deprivations, and may indeed
reduce the chances of finding remedies to them.”
Kofi Annan, Secretary-General
of the United Nations, 199914

19
“There is a big change now. Long before, food used to stay overnight because there was no communication. Now we get information immediately, even when the trucks are still in Isiolo. We are aware that food is arriving tomorrow, and we go ready for distribution.” Community member
Oldonyiro
Somalia Speaks – text messaging gives people a voice
For the February 2012 London Conference on Somalia, the Al Jazeera TV network asked Somali citizens, via text message, how the conflict had affected their lives. With help from the diaspora, more than 2,000 responses were translated, geo-located and made available to conference attendees. The Somalia Speaks project enabled the voices of people from one of the world’s most inaccessible, conflict-ridden areas, in a language known to few outside their community, to be heard by decision makers from across the planet. Samples of these messages are below:
I am Abdi Wahab Sheikh Ahmed and I am in Bosaso. My message which I am sending the Somali delegation which is partaking in the London Conference is that they should be sceptical about the outcomes of this conference. They have a God given responsibility to their people which they represent.20
My name is Faiza Mohamud Muse. I am sending the Somali delegation. If you need or care about your people or your nationhood, then go and include your voices in the conference, and I hope that Allah/God makes it one of joyful outcomes for the people of the Horn of Africa.21
I am from the Ceelqooxle district in Galgaduud region. This year’s events have affected me deeply. What I experienced this year was my worst ever. The worst event is what I have seen on the Universal TV, when al-Shabab militia exploded students who were awaiting their exam results in Mogadishu.22
Jaabiri, from Puntland. Please look after Somalia and do not allow to be separated and pitted against each other, and don’t agree to colony and take advantage of this opportunity.23
The impact of these text messages is uncertain. It is possible that a careful, field-based system of outreach to Somali communities would have produced a more representative set of messages. Mobile phone use in Somalia is concentrated among men, yet the existence of these messages is powerful testimony to the desire among those Somalis with mobile phone access to communicate and express their thoughts.
20
Communicating in the world’s largest refugee camp
The Dadaab area, near the Kenya/Somalia border, is often described as the world’s largest refugee camp. Three independent camps (Hagadera, Ifo and Dagahaely) cover an area of over 50 km2 (the size of 7,000 football pitches) and house more than 450,000 refugees1 against an official capacity of 90,000 refugees. The camps were constructed in response to the crisis in Somalia in the 1990s. In 2011 they became the centre of attention once more, as thousands of refugees fled to Kenya to escape famine and conflict.
A 2011 study of Dadaab, by Internews, showed the cost of a lack of communication in the camps. More than 70 per cent of newly arrived refugees said that they didn’t know how to register for aid or locate family members. More than 40 per cent of long-term camp residents found themselves unable to raise concerns with aid organizations or Government representatives.
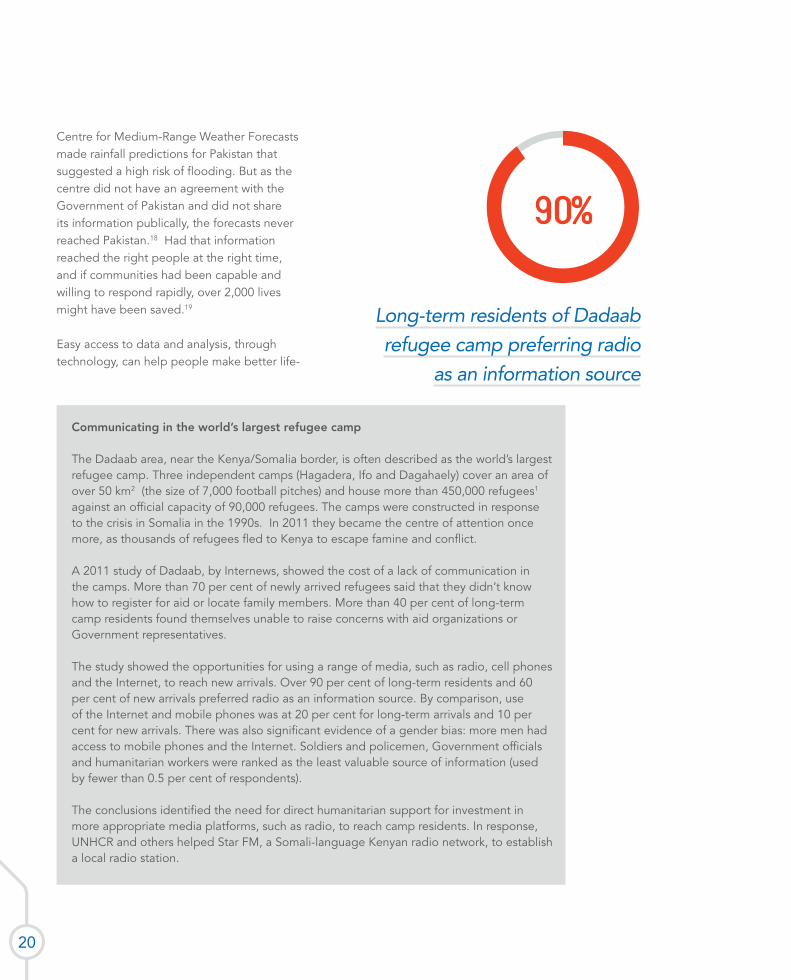
The study showed the opportunities for using a range of media, such as radio, cell phones and the Internet, to reach new arrivals. Over 90 per cent of long-term residents and 60 per cent of new arrivals preferred radio as an information source. By comparison, use of the Internet and mobile phones was at 20 per cent for long-term arrivals and 10 per cent for new arrivals. There was also significant evidence of a gender bias: more men had access to mobile phones and the Internet. Soldiers and policemen, Government officials and humanitarian workers were ranked as the least valuable source of information (used by fewer than 0.5 per cent of respondents).
The conclusions identified the need for direct humanitarian support for investment in more appropriate media platforms, such as radio, to reach camp residents. In response, UNHCR and others helped Star FM, a Somali-language Kenyan radio network, to establish a local radio station.
Centre for Medium-Range Weather Forecasts made rainfall predictions for Pakistan that suggested a high risk of flooding. But as the centre did not have an agreement with the Government of Pakistan and did not share its information publically, the forecasts never reached Pakistan.18 Had that information reached the right people at the right time, and if communities had been capable and willing to respond rapidly, over 2,000 lives might have been saved.19
Easy access to data and analysis, through technology, can help people make better life-
Long-term residents of Dadaab refugee camp preferring radio
as an information source
90%
21
saving decisions for themselves and mobilize the right types of external support. This can be as simple as ensuring that people know where to go and how to get help. But to do so effectively requires a clear understanding of how information flows locally and how people make decisions. (See Dadaab case study, page 20)
Traditionally, information management has been viewed as a technical task for back-room experts. But the increased reach of communications technology coupled with new partnerships mean that life-saving decisions are made everywhere, often simultaneously. Humanitarian assistance has to adapt to this change: to adapt to the increasing volume and complexity of information in the network age, and to the many new actors involved in using that information.

Network age – HaitiStudent, Jean Louis Thomas, writes a text
message to a friend in downtown Port-au-Prince,
Haiti. The Haiti earthquake in 2010 generated
massive amounts of information using old and
new technologies. Information management
systems were overwhelmed.

23
CHAPTER 2
Humanitarian information in the network age
Regular information channels fail in the chaos of a crisis, such as an earthquake or a war. Key people may have died, and information infrastructure, such as cellular and Internet links, may not work. Essential personnel may be inaccessible and Government offices closed or, as in Haiti, destroyed. Community-level structures, such as mandated village-evacuation points, may be overwhelmed. Where conflict is under way, the generation and collection of information might pose serious risks. Many countries have poor baseline data or a limited ability to access the right information quickly, as needed in an emergency.
In many cases, Governments may have essential information but do not have systems or agreements in place to allow their own disaster management organizations or external humanitarian responders to access this information. Some countries simply do not have resources or statistics capacity and therefore lack basic data that would improve response, such as census information. In conflict contexts, for example, there is often limited information about community capacities and resources.
In these situations, decision makers only have partial data and often rely on weak analysis. Decisions must be made without an accurate overview of the situation. Food may be sent to destinations based on pre-crisis maps
that do not mark washed-out or inaccessible roads. Information is sporadic, and decisions can be made on the basis of anecdote rather than fact. Media reports can significantly influence allocations, often more than directly transmitted community statements of need, because they are more widely read or better trusted.
Even after access is restored, decision makers must work with limited information. They may know the number of children with malnutrition in a particular area after a crisis has struck. But what was the rate of malnutrition before the disaster? What do the people in the area consider the main problem: malnutrition or the lack of housing? Which of these can be solved through local resources and which require external assistance?
The traditional model for managing information in a crisis revolved around four basic steps: collect, analyse, decide and deliver. Aid workers would try to get as close to the affected area as possible, find out what was happening and transmit that information to their superiors, sometimes by hand, sometimes in person. The information would then be analysed, resources allocated and aid delivered.
As more actors have become involved, and as more people gain access to communications

24
technology, the challenge of managing that process has grown. Different cultures, a lack of shared standards, the absence of operational protocols and competition for resources often make it difficult for diverse humanitarian organizations to work together.24
An analysis of information sharing in evaluations of major emergencies over the last five years demonstrates that poor levels of information sharing and data collection consistently produced ineffective response. For example, the Real-Time Evaluation (RTE) of the 2007 Pakistan floods observed “good quality information, or the lack of it, has been a major feature of this response, mentioned by most actors as a key inhibiting factor.”25 The 2012 RTE of Somalia highlighted multiple, duplicative needs assessments, echoing Pakistan in 2007. The 2011 RTE of Ethiopia similarly noted that “information sharing is… a significant barrier to response and to partnership.”26
Nethope is a collaboration of 35 humanitarian organizations that wishes to improve the use of information technology. It commissioned a detailed evaluation of the response to the Pakistan floods in 2010.27 A brief summary of key findings is reproduced in the case study opposite. In brief, it confirmed that international humanitarians have not embraced the network age. Information remains quarantined and in silos, and affected communities, while consulted, are not involved in a two-way process that verifies and validates decisions. There is little, if any, evidence of communities being placed at the centre of decision-making.
In recent years, efforts to address these shortfalls have included establishing the humanitarian cluster system, initiatives like
Key findings from the Nethope Report: Information and Communication Technology Usage in the 2010 Pakistan Floods
• A comprehensive common operational picture of the Pakistan response did not exist.
Lack of standards:
• Information was not standardized and different methodologies were used to gather and format data.
• Each organization performed its own assessment. Communities were consulted multiple times without getting what they needed, and without an explanation for why certain needs were met and others were not.
Poor information sharing:
• Many clusters operated in silos, not sharing information.
• There was a critical disconnect between INGOs and district authorities when it came to information sharing.
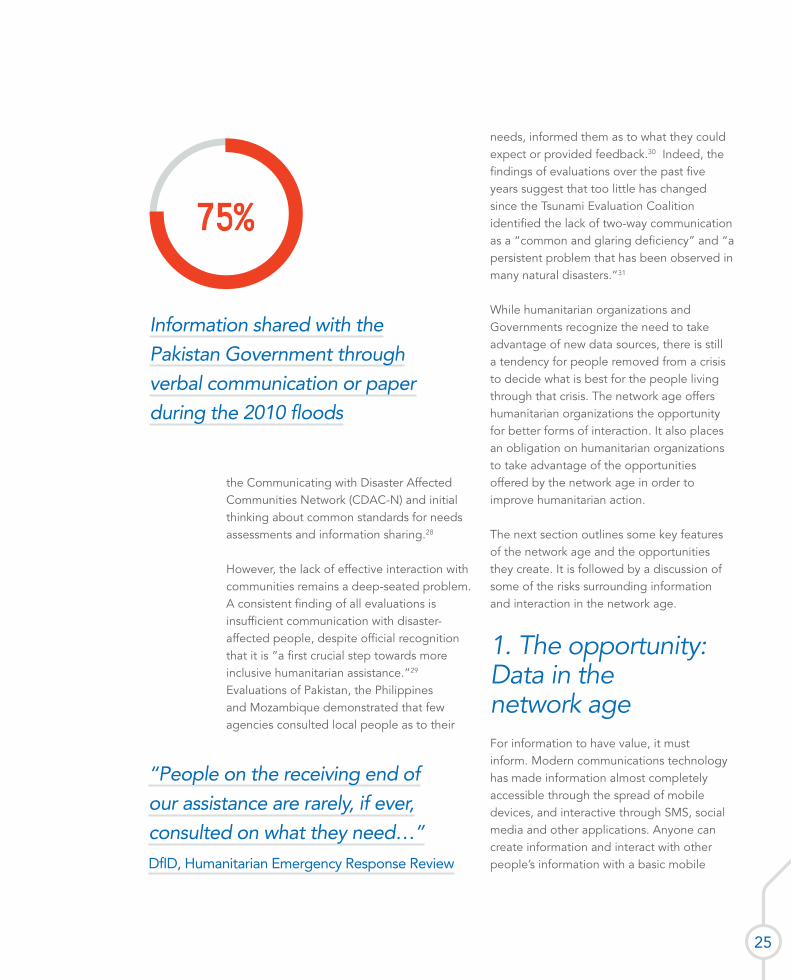
• Seventy-five per cent of information shared with the Pakistan Government was through verbal communication (40 per cent) or paper (35 per cent).
25
“People on the receiving end of our assistance are rarely, if ever, consulted on what they need…” DfID, Humanitarian Emergency Response Review
Information shared with the Pakistan Government through verbal communication or paper during the 2010 floods
75%
the Communicating with Disaster Affected Communities Network (CDAC-N) and initial thinking about common standards for needs assessments and information sharing.28
However, the lack of effective interaction with communities remains a deep-seated problem. A consistent finding of all evaluations is insufficient communication with disaster-affected people, despite official recognition that it is “a first crucial step towards more inclusive humanitarian assistance.”29 Evaluations of Pakistan, the Philippines and Mozambique demonstrated that few agencies consulted local people as to their
needs, informed them as to what they could expect or provided feedback.30 Indeed, the findings of evaluations over the past five years suggest that too little has changed since the Tsunami Evaluation Coalition identified the lack of two-way communication as a “common and glaring deficiency” and “a persistent problem that has been observed in many natural disasters.”31
While humanitarian organizations and Governments recognize the need to take advantage of new data sources, there is still a tendency for people removed from a crisis to decide what is best for the people living through that crisis. The network age offers humanitarian organizations the opportunity for better forms of interaction. It also places an obligation on humanitarian organizations to take advantage of the opportunities offered by the network age in order to improve humanitarian action.
The next section outlines some key features of the network age and the opportunities they create. It is followed by a discussion of some of the risks surrounding information and interaction in the network age.
1. The opportunity: Data in the network ageFor information to have value, it must inform. Modern communications technology has made information almost completely accessible through the spread of mobile devices, and interactive through SMS, social media and other applications. Anyone can create information and interact with other people’s information with a basic mobile

26
phone. Coupled with the opportunities of big data and GIS technology (Figure 5), a true partnership is possible in which citizens, communities and humanitarian actors collect data from a wide array of sources; transform raw data, through analysis, into useful information; freely share information with one another; and act on that information to save lives and prevent suffering.
This is a startlingly complex task. Each consumer of information has different needs. In a crisis, people and Governments may not know what options are available and what information to demand. Nonetheless, early evidence demonstrates that the effective application of new communications technologies and systems is helping to better meet these different needs and provide more people with information to make better decisions.
Figures 7 and 8 (page 33) provide a snapshot of how the network age can contribute to better humanitarian action. It incorporates several key ideas that have emerged from recent humanitarian practice, which are
explored in detail in the following sections. Three particular features of data in the modern age offer significant opportunity for better humanitarian decision-making. They are also outlined in detail in the following sections..
A. Big Data
As the reach of communications technologies has increased, so has the quantity of data generated. It has become so large that the data exhaust (passively generated data from transactions or devices, such as GPS data from active cell phones) requires vast, parallel systems to store and analyse it. The massive volume of data stored by Governments, the private sector and individuals is known as big data. Finding ways to make big data useful to humanitarian decision makers is one of the great challenges, and opportunities, of the network age.
On offer is the chance to use and correlate these enormous data sets, generating sometimes surprising information about the nature and activities of affected communities.
Big Data
IndividualsData “exhausts” from devices
Social mediaSMS
AnalysisandDecisions
GovernmentCensus and geo-data
Tax informationPublic indicators (e.g. health)
Private sectorTransaction data
Spending informationGSM aggregate data
BIG DATAFigure 5
The big-data ecosystem32
27
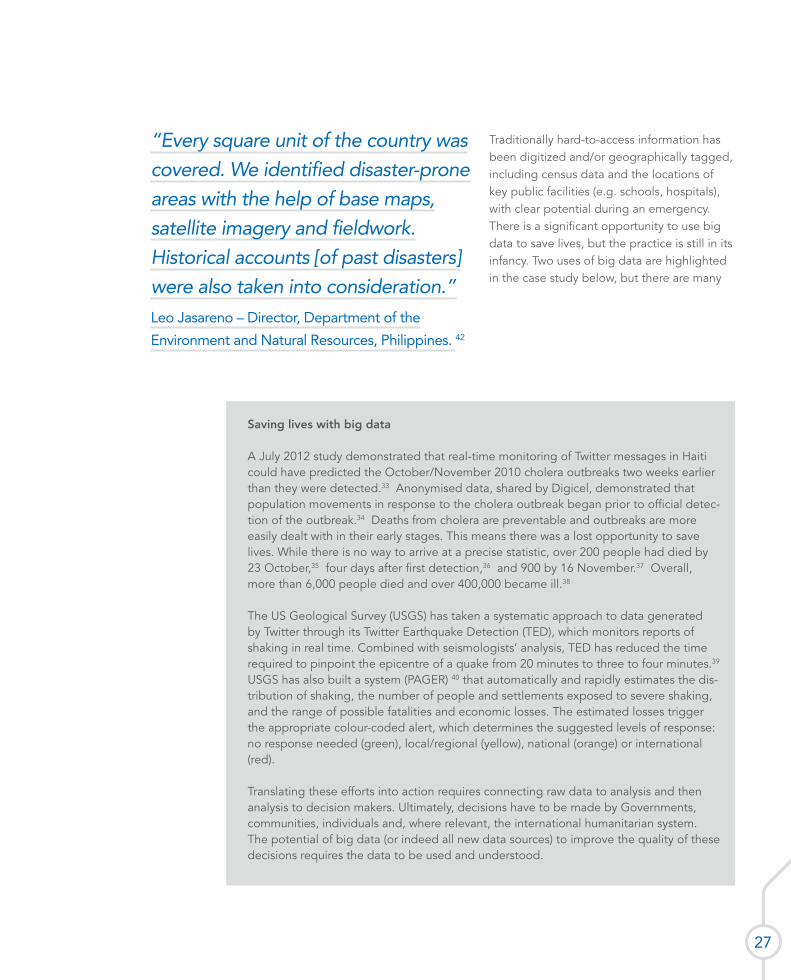
Saving lives with big data
A July 2012 study demonstrated that real-time monitoring of Twitter messages in Haiti could have predicted the October/November 2010 cholera outbreaks two weeks earlier than they were detected.33 Anonymised data, shared by Digicel, demonstrated that population movements in response to the cholera outbreak began prior to official detec-tion of the outbreak.34 Deaths from cholera are preventable and outbreaks are more easily dealt with in their early stages. This means there was a lost opportunity to save lives. While there is no way to arrive at a precise statistic, over 200 people had died by 23 October,35 four days after first detection,36 and 900 by 16 November.37 Overall, more than 6,000 people died and over 400,000 became ill.38
The US Geological Survey (USGS) has taken a systematic approach to data generated by Twitter through its Twitter Earthquake Detection (TED), which monitors reports of shaking in real time. Combined with seismologists’ analysis, TED has reduced the time required to pinpoint the epicentre of a quake from 20 minutes to three to four minutes.39 USGS has also built a system (PAGER) 40 that automatically and rapidly estimates the dis-tribution of shaking, the number of people and settlements exposed to severe shaking, and the range of possible fatalities and economic losses. The estimated losses trigger the appropriate colour-coded alert, which determines the suggested levels of response: no response needed (green), local/regional (yellow), national (orange) or international (red).
Translating these efforts into action requires connecting raw data to analysis and then analysis to decision makers. Ultimately, decisions have to be made by Governments, communities, individuals and, where relevant, the international humanitarian system. The potential of big data (or indeed all new data sources) to improve the quality of these decisions requires the data to be used and understood.
Traditionally hard-to-access information has been digitized and/or geographically tagged, including census data and the locations of key public facilities (e.g. schools, hospitals), with clear potential during an emergency. There is a significant opportunity to use big data to save lives, but the practice is still in its infancy. Two uses of big data are highlighted in the case study below, but there are many
“Every square unit of the country was covered. We identified disaster-prone areas with the help of base maps, satellite imagery and fieldwork. Historical accounts [of past disasters] were also taken into consideration.”Leo Jasareno – Director, Department of the
Environment and Natural Resources, Philippines. 42

28
Opening Government data to the public
In 2011, Kenya became the first country in Africa to begin systematically putting national data online for access and use by citizens. The Kenya Open Data Initiative (KODI) includes data sets in categories such as health, water and sanitation, poverty and energy hosted on a dedicated website (https://www.opendata.go.ke). It is open to all users to create interactive charts and tables, or to download the data for their own initiatives. One year on, the platform has been widely used by developers and activist groups, and has considerable potential to improve response in crises.46
Open-data policies have spread far and wide. The cities of Lima, Peru,47 and Dalian, China,48 have open-data portals, as do the Governments of India49 and Brazil.50 Just as Governments have adopted open-data policies, transparency standards have been embraced for international aid programming. The UN Office for the Coordination of Humanitarian Affairs (OCHA), the World Food Programme, the United Nations Children’s Fund and the United Nations Development Programme have all signed up to the International Aid Transparency Initiative standard, as have major donors (Australia, Canada, Denmark, Finland, Germany, Ireland, Netherlands, New Zealand, Norway, Sweden, Switzerland, the UK and the USA). Large NGOs are increasingly publishing data to the standard without becoming signatories (e.g. CAFOD, Oxfam GB51).
opportunities yet to be discovered.
B. Rich data through Geographical Information Systems
Widespread access to Global Positioning System information through mobile phones, coupled with the increased availability of satellite imagery, allows for unprecedented geographic precision to be added to raw data. This offers significant opportunities for crisis responders. Geographical Information Systems (GIS), which combine hardware and software used for the storage, retrieval, mapping and analysis of geographic data, have long been an essential component of effective crisis response.41 But today, technology once limited to experts and institutions is available to anyone. This has allowed groups of self-organizing volunteers to place SMS messages and social media postings on dynamic maps, highlighting clusters of cries for help in an earthquake, or identifying where roads have been washed away after a flood.
The use of spatial data in humanitarian action is not new. It is, however, starting to trickle down to the community level. To reduce community vulnerability to crisis, the Philippines Government has publicly distributed geo-hazard maps that outline disaster-prone areas. These maps colour code areas as low, moderate or high in their susceptibility to floods, flash floods and landslides, mark areas that are prone to riverbank erosion, and superimpose these codes onto an easy-to-read topographic map. The extent of the use of these maps is unclear. It is reasonable to assume that a greater knowledge of potential risks can help communities to prepare for and mitigate their

29
effects.
C. Open data
Unlocking the potential value of big and rich data requires the data to be accessible for analysis, or “open”. The case study from Kenya (page 28) shows how more institutions are embracing open-data initiatives. Other notable cases include the World Bank with its 2010 Open Data Initiative, the Open Government Initiative launched by the USA, Indonesia, Brazil and others in 2011, and Google Trends. The United Nations Global Pulse, a digital innovation initiative, has championed the idea of “data philanthropy” to convince corporations to make anonymized versions of their data available for use in crises and emergencies. The benefits of open-data policies are largely unrealized in humanitarian action, as there is still limited adoption. However, initial feedback from development initiatives demonstrates the potential. AidData, an initiative that aims to increase the impact of development assistance by making information more transparent and accessible, in December 2011, combined newly open World Bank data with information on the spatial distribution of violence in Afghanistan. It found, surprisingly, that areas with lower violence saw poorer project performance.
For value to emerge from data, it must be truly open. The standard definition is that data is only open when “anyone is free to use, reuse, and redistribute it — subject only, at most, to the requirement to attribute and/or share-alike.” But to be usable in practice, data must also be technically open, i.e. available in standard, editable file formats, easy to access and download, searchable and catalogued. Ideally, data should be well
documented to make it easier to use. To be most effective, data collections need a point of contact with whom researchers and analysts can work.
2. New techniques for the network age As the opportunities of the network age have started to crystallize, some new techniques and partnerships have begun to exploit them. Three ideas in particular, namely crowdsourcing, crowdseeding and mobile cash, have received attention and are explored in detail below.
These new techniques have generated a lot of enthusiasm as the first manifestations of a new business model, but there is reason to be cautious. Humanitarian assistance operates within limited resources. As the Dadaab case, on page 20, illustrated, low-technology approaches may often be the most effective.
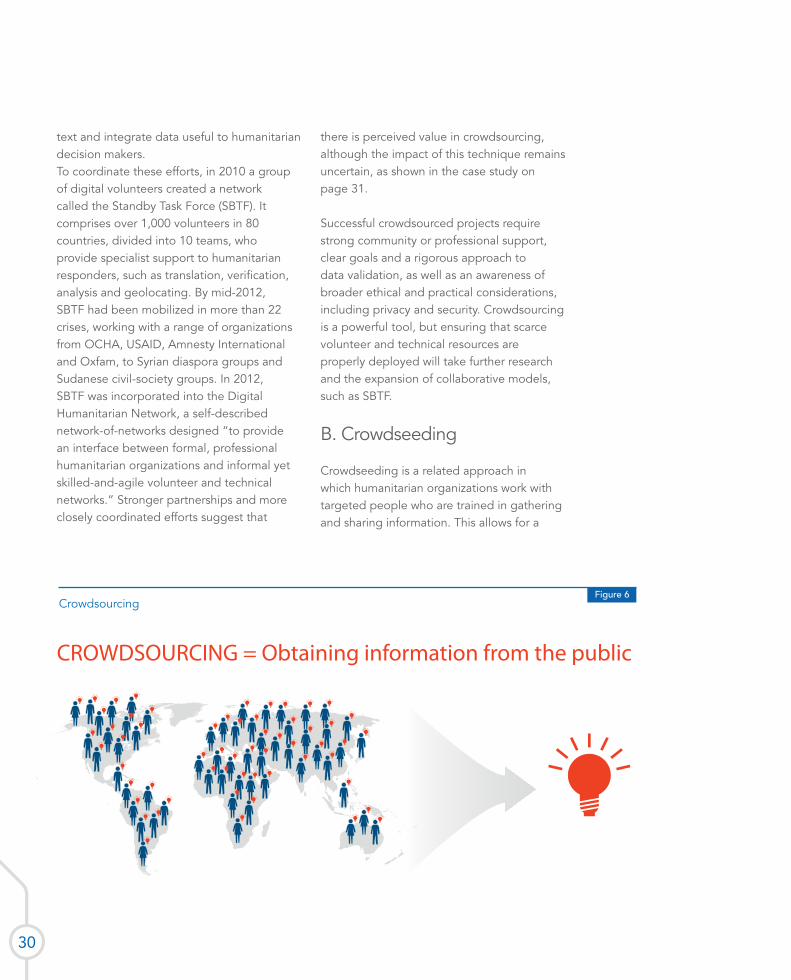
A. Crowdsourcing
Crowdsourcing can be used to solve problems and produce information by asking a distributed group of people, often volunteers, to perform certain tasks. In the case of humanitarian work, it has been used to refer to two distinct models: one in which information is sought directly from affected communities, such as in the Somalia Speaks case on page 19, and another in which technical or information management tasks, such as mapping or geo-tagging, are outsourced to a “crowd” of volunteers that can live anywhere. The potential applications are diverse. Crowdsourcing has been used to validate information, map events, translate
30
text and integrate data useful to humanitarian decision makers. To coordinate these efforts, in 2010 a group of digital volunteers created a network called the Standby Task Force (SBTF). It comprises over 1,000 volunteers in 80 countries, divided into 10 teams, who provide specialist support to humanitarian responders, such as translation, verification, analysis and geolocating. By mid-2012, SBTF had been mobilized in more than 22 crises, working with a range of organizations from OCHA, USAID, Amnesty International and Oxfam, to Syrian diaspora groups and Sudanese civil-society groups. In 2012, SBTF was incorporated into the Digital Humanitarian Network, a self-described network-of-networks designed “to provide an interface between formal, professional humanitarian organizations and informal yet skilled-and-agile volunteer and technical networks.” Stronger partnerships and more closely coordinated efforts suggest that
there is perceived value in crowdsourcing, although the impact of this technique remains uncertain, as shown in the case study on page 31.
Successful crowdsourced projects require strong community or professional support, clear goals and a rigorous approach to data validation, as well as an awareness of broader ethical and practical considerations, including privacy and security. Crowdsourcing is a powerful tool, but ensuring that scarce volunteer and technical resources are properly deployed will take further research and the expansion of collaborative models, such as SBTF.
B. Crowdseeding
Crowdseeding is a related approach in which humanitarian organizations work with targeted people who are trained in gathering and sharing information. This allows for a
CROWDSOURCING = Obtaining information from the public
Figure 6 Crowdsourcing

31
Crowdsourcing – Certain potential, uncertain impact
The Ushahidi (“testimony” in Kiswahili) Platform was introduced to track post-electoral violence in Kenya in 2008. It allows users to mark events on a map that changes in near real time, and which is accessible online. This creates a picture of what is happening, when and where, which can help responders make decisions.
The Ushahidi Platform has become one of the most commonly used and discussed tools for crisis mapping. Nonetheless, a recent study determined that out of 12,757 crowd maps that used Ushahidi, 93 per cent had fewer than 10 reports. Of the 585 crowd maps that had more than 21 reports, the average was 814 reports, which is still low for providing statistically relevant data over a large geographical area.52 Even with more frequently used maps, the impact is not always clear. A crisis map following the March 2011 tsunami in Japan saw nearly 9,000 reports in the first few weeks, and it was still getting updates in October 2012. This was a success story in terms of engagement, but there was no evaluation of the impact of the map in terms of more rescues or more efficient resource allocation.
Other types of crowdsourced projects have generated further concerns. During the nuclear crisis that followed the tsunami in Japan, crowdsourcing was used to collect data on radiation levels.53 The creators of www.rdtn.org stressed that this was not intended to replace Government data, but suggested that “datasets from various sources can provide additional context to the official word in these rapidly changing events.”
However reliable these projects were, the potential for inaccurate or manipulated data on radiation levels or similarly fraught areas—and the possibility for resulting panic—raised many challenging ethical questions.
It is a mistake to think of crowdsourcing and volunteer time as “free”. Both are rare and valuable resources that require careful preparation and coordination to produce value. A 2012 SBTF deployment to produce data sets for South Sudan saw volunteers produce 15,271 unique information records in three days. But hours before the end of the deployment, they received the Information Management Working Group Digital Atlas for South Sudan, which already contained much of the information required.54
While recognizing the limitations, it is clear that in the proper context, crowdsourcing can be remarkably effective. A particularly promising area is outsourcing data processing to a distributed team of volunteers.
In June 2012, USAID, SBTF, GISCorps and several private-sector companies launched an exercise that compared the work of volunteers with the results of an automated process.
Their task was to clean and map data highlighting the locations of loans made by private banks in developing countries. The data set had originally been mapped at the national level, but more detailed geographic information was available. The aim was to create a more precise map—a common need in humanitarian response, where a few miles can make all the difference.
The volunteers succeeded. According to the USAID case study of the process, the automated geocoding process “refined 66,917 records at 64 per cent accuracy”, while the crowdsourcing process “refined an additional 7,085 records at 85 per cent accuracy.”55 It was also fast: the entire project was completed in just 16 hours, which is 44 hours earlier than projected.
The questions now are how and when to leverage the comparative advantage of crowdsourced approaches? If automation can produce 64 per cent accuracy, then perhaps the best use of scarce resources would be to target those issues or areas that cannot be automated—in bringing the accuracy from 64 to 85 per cent rather than doing the entire process. Identifying the best uses of crowdsourcing and how to blend automated and crowdsourced approaches is a critical area for study.56
Accuracy of crowdsourcing for a geocoding process,
compared to 64% for automation
85%

32
deeper relationship between the aid agency and the data source. Information is often transmitted through the use of SMS short-codes, in which pre-agreed codes are used to relay critical information.
The Voix des Kivus57 project in Eastern DRC launched an SMS-based crowdseeding58 effort to test whether accurate, systematic and representative data could be collected from a conflict zone over time. Researchers from Columbia University distributed cell phones and solar chargers to a representative of a local women’s organization, a representative elected by the community and a traditional leader.59 These leaders were asked to collect data on daily events and needs using a system of shorthand codes. To prevent retribution from local rebel groups,60 issues around privacy and security were carefully addressed and leaders were able to self-classify their messages. Over 18 months, Voix des Kivus received more than 4,000 pre-coded messages and 1,000 text messages,61 a rate that remained stable over time. As the project was a pilot, no direct action was launched as a result. But this does provide evidence that crowdseeding could furnish useful information to decision makers. Users expect access to their finances anytime and anywhere, and they expect automated systems to track and organize their transactions. At the click of a button, information is available about what people spend, when and where. This demonstrates a demand for information sharing between communities.
C. Mobile cash
Nowhere is the transformation to the network age more visible than in the banking industry. From a world driven by cheques and in-
person transactions, banking has gone digital.
Mobile money, i.e. the use of cell phones as digital wallets, has advanced faster in developing countries than in the OECD. Three quarters of the countries that use mobile money most frequently are in Africa.62 Kenya has almost 20 million mobile-money users. They conducted 1.2 trillion Kenyan Shillings ($14.2 billion) of mobile transactions in 2011.63 Diaspora communities and remittances are helping to boost the importance of mobile money, particularly where their financial and banking systems have limited reach.64 For example, in Somalia, 34 per cent of adults use mobile money, often to receive remittances from family members overseas.65
Mobile money has significant implications for humanitarian assistance. It offers a simple and secure method of transferring funds to people in need and a potentially rich source of information about how that money flows. In 2008, Concern Worldwide worked with Safaricom’s M-PESA system to transfer cash to people affected by post-electoral
Adults using mobile money in Somalia
34%

33
POTENTIAL IMPACT OF NETWORK AGEduring humanitarian programme cycle phases
Preparedness• Faster access to accurate data in
emergencies• Common baseline; no need to
re-gather basic information
Needs assessment & analysis• Reduced duplication, faster
assessments• Greater involvement of
communities in process
Joint planning• Response better meets needs• Real-time feedback from
communities
Resource mobilization & allocation• More accurate budgeting and e�cient
use of resources• Response better meets needs
Implementation• Faster, better response• Real-time feedback from
communities
Monitoring & evaluation• Greater understanding of what
works, what doesn't & how to improve action
• Greater involvement of communities in process
Figure 7Potential impact of the network age across the humanitarian programme cycle
Figure 8Potential impact of the network age on humanitarian action
Stage Opportunities Impact
Preparedness
Agreements to enable automatic access to key data Faster access to accurate data in emergencies
Shared, standard country profiles Common baseline; no need to re-gather basic information
Needs assessment & analysis
Easy sharing of information across needs assessments; access to underserved populations Reduced duplication, faster assessments
Real-time verification of analysis through two-way communication Greater involvement of communities in process
Joint planningDecisions based on more robust analysis using more accurate data Response better meets needs
Real-time feedback from communities; Real-time feedback from communities
Resource mobilization & allocation
Greater ability to access and track sources of funding
More accurate budgeting and efficient use of resources
Dynamic re-allocation in response to changing circumstances Response better meets needs
ImplementationNew partners and new models of delivery Faster, better response
Real-time feedback from communities; Real-time feedback from communities;
Monitoring & evaluation
Better cross-case comparison of data Greater understanding of what works, what doesn't & how to improve action
Real-time feedback from communities Greater involvement of communities in process

34
violence in remote areas of Kenya. Since then, mobile-money transfers have been used in diverse situations, from reaching famine-affected communities in Somalia to supporting housing reconstruction in Haiti.66
The Cash Learning Partnership, a group of five global NGOs and IFRC, supported by VISA and ECHO, has highlighted how electronic payment-and-registration systems can improve aid accountability by providing a clear data trail from funding to recipients.67
Mobile money and the data exhaust from modern banking technology have the potential for use in crisis prevention. UN Global Pulse has hypothesized that tracking aggregate trends in savings, defaults on microloans and other types of electronic payments could produce useful early warning indicators of income reductions.68
In many ways, mobile money highlights the opportunities and challenges of using network-age technologies. The potential is for faster, more accountable delivery of aid and the ability to better prevent crises. At the same time, the limited, albeit increasing, amount of quantitative evidence and the lack of baseline data make it difficult to identify how mobile money can deliver all that it promises. The Cash Learning Partnership is trying to address this knowledge deficit and offers a potentially powerful model for other efforts to learn from innovation.69
3. Challenges and risks The story of the network age is not only about opportunity—it also involves a complex set of challenges. The discussion
below highlights a number of these. More will become evident over time.
A. Accuracy and utility
The accuracy of a piece of information is the probability that it is a true representation of the situation at that moment in time. Its utility is the degree to which that information can guide effective action. Is this malnutrition statistic reliable? Is there a functioning health centre where this map specifies? When dealing with the vast volume and complexity of information available in the network age, understanding how to assess the accuracy and utility of any data source becomes critical.
As the automated extraction of data from big open-data systems becomes incorporated into humanitarian response, the risk of compound error grows and humanitarian organizations need to be on constant guard. If the basic data is wrong, decisions based on the analysis of that data will reflect those errors and can lead to incorrect results.
Using crowdsourcing techniques, or any open source mechanism, also involves risks.70 While new technology increases individuals’ ability to organize and promote change outside of formal structures, it also increases the capacity of Government or violent groups who oppose their interests to communicate and organize against them.71
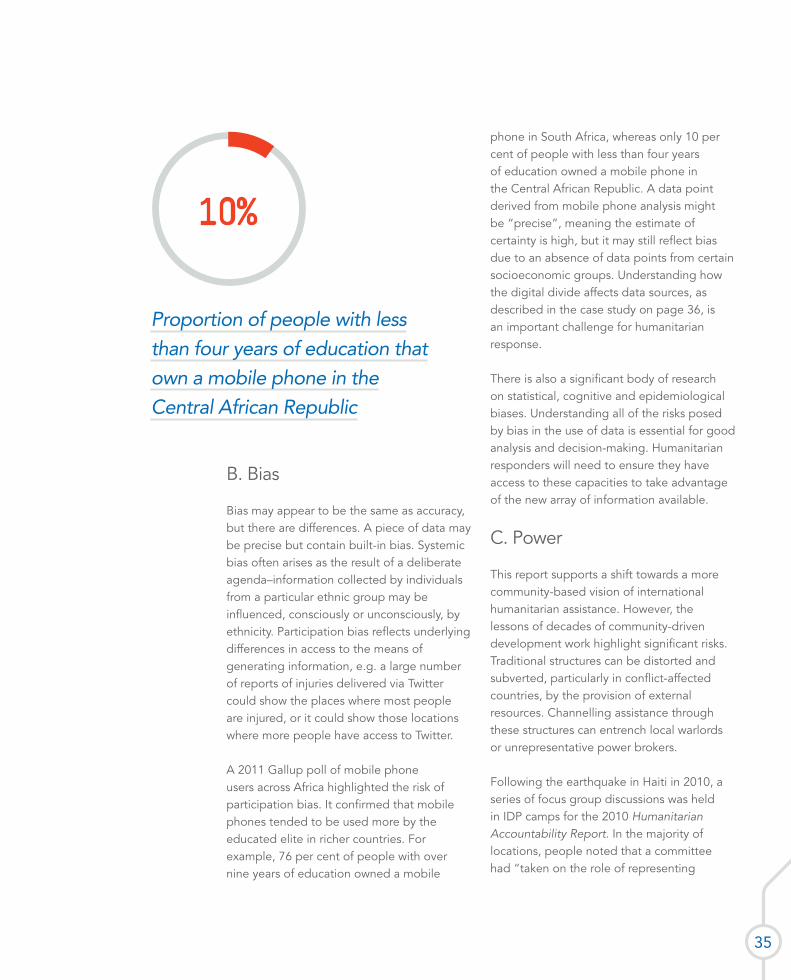
35
B. Bias
Bias may appear to be the same as accuracy, but there are differences. A piece of data may be precise but contain built-in bias. Systemic bias often arises as the result of a deliberate agenda–information collected by individuals from a particular ethnic group may be influenced, consciously or unconsciously, by ethnicity. Participation bias reflects underlying differences in access to the means of generating information, e.g. a large number of reports of injuries delivered via Twitter could show the places where most people are injured, or it could show those locations where more people have access to Twitter.
A 2011 Gallup poll of mobile phone users across Africa highlighted the risk of participation bias. It confirmed that mobile phones tended to be used more by the educated elite in richer countries. For example, 76 per cent of people with over nine years of education owned a mobile
phone in South Africa, whereas only 10 per cent of people with less than four years of education owned a mobile phone in the Central African Republic. A data point derived from mobile phone analysis might be “precise”, meaning the estimate of certainty is high, but it may still reflect bias due to an absence of data points from certain socioeconomic groups. Understanding how the digital divide affects data sources, as described in the case study on page 36, is an important challenge for humanitarian response.
There is also a significant body of research on statistical, cognitive and epidemiological biases. Understanding all of the risks posed by bias in the use of data is essential for good analysis and decision-making. Humanitarian responders will need to ensure they have access to these capacities to take advantage of the new array of information available.
C. Power
This report supports a shift towards a more community-based vision of international humanitarian assistance. However, the lessons of decades of community-driven development work highlight significant risks. Traditional structures can be distorted and subverted, particularly in conflict-affected countries, by the provision of external resources. Channelling assistance through these structures can entrench local warlords or unrepresentative power brokers.
Following the earthquake in Haiti in 2010, a series of focus group discussions was held in IDP camps for the 2010 Humanitarian Accountability Report. In the majority of locations, people noted that a committee had “taken on the role of representing
Proportion of people with less than four years of education that own a mobile phone in the Central African Republic
10%
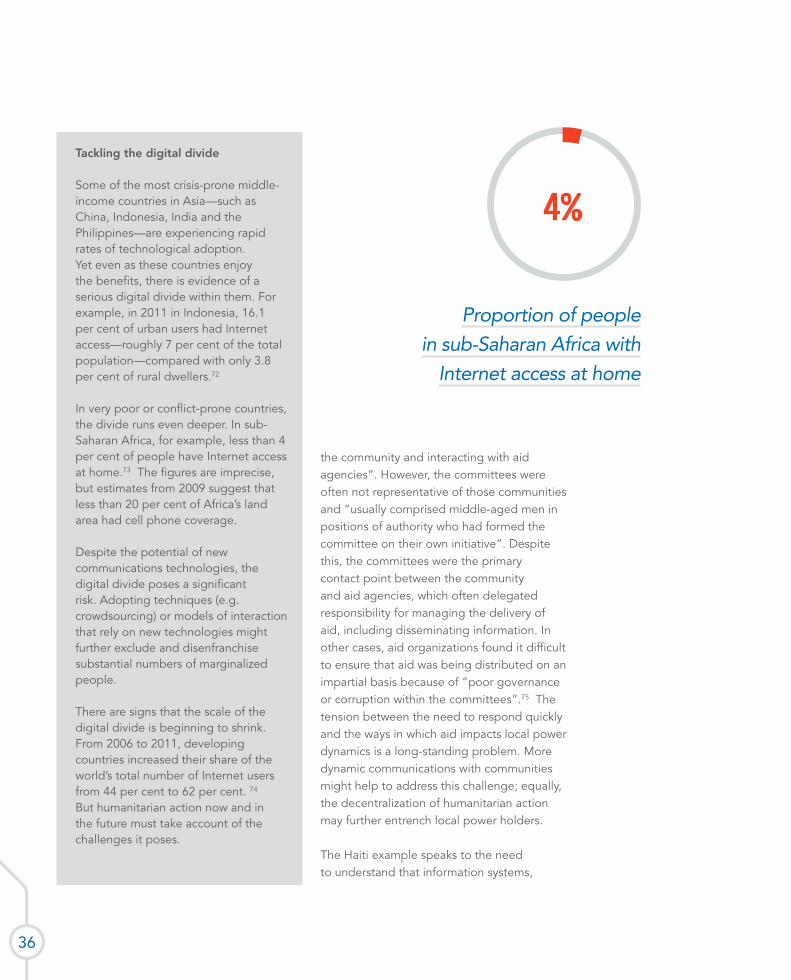
36
Tackling the digital divide
Some of the most crisis-prone middle-income countries in Asia—such as China, Indonesia, India and the Philippines—are experiencing rapid rates of technological adoption. Yet even as these countries enjoy the benefits, there is evidence of a serious digital divide within them. For example, in 2011 in Indonesia, 16.1 per cent of urban users had Internet access—roughly 7 per cent of the total population—compared with only 3.8 per cent of rural dwellers.72
In very poor or conflict-prone countries, the divide runs even deeper. In sub-Saharan Africa, for example, less than 4 per cent of people have Internet access at home.73 The figures are imprecise, but estimates from 2009 suggest that less than 20 per cent of Africa’s land area had cell phone coverage.
Despite the potential of new communications technologies, the digital divide poses a significant risk. Adopting techniques (e.g. crowdsourcing) or models of interaction that rely on new technologies might further exclude and disenfranchise substantial numbers of marginalized people.
There are signs that the scale of the digital divide is beginning to shrink. From 2006 to 2011, developing countries increased their share of the world’s total number of Internet users from 44 per cent to 62 per cent. 74 But humanitarian action now and in the future must take account of the challenges it poses.
the community and interacting with aid agencies”. However, the committees were often not representative of those communities and “usually comprised middle-aged men in positions of authority who had formed the committee on their own initiative”. Despite this, the committees were the primary contact point between the community and aid agencies, which often delegated responsibility for managing the delivery of aid, including disseminating information. In other cases, aid organizations found it difficult to ensure that aid was being distributed on an impartial basis because of “poor governance or corruption within the committees”.75 The tension between the need to respond quickly and the ways in which aid impacts local power dynamics is a long-standing problem. More dynamic communications with communities might help to address this challenge; equally, the decentralization of humanitarian action may further entrench local power holders.
The Haiti example speaks to the need to understand that information systems,
Proportion of people in sub-Saharan Africa with
Internet access at home
4%
37
communications and data are expressions of power, and access to information is often a contested space. Humanitarian responders need to understand the potential impact of information controls and ensure that their systems can function in a range of information environments. An essential part of this work is developing agreements with Governments before an emergency so that relevant information can flow freely when it is most needed.
Power, information and access
Information is power and information systems are carefully controlled. An OpenNet Initiative survey of 75 countries showed that at least half filtered or blocked political-, social- or security-related content, or they limited access to tools such as Voice-over Internet Protocol telephone services. This matters for humanitarian action: of the 25 surveyed countries that have had a humanitarian consolidated appeal since 2005, 11 had some degree of technical filtering. Several more had regulatory frameworks that allowed for monitoring of e-mails and other communications, or other media restrictions.
An increasing number of countries are passing laws that make “Internet intermediaries legally liable for the content posted through their services”,76 including anonymized posts, which could have a legal impact on crowdsourced platforms and information. Authorities are also becoming more sophisticated in monitoring the Internet. Communications companies may be controlled wholly or partly by national authorities. Even when in private hands, Governments have often responded to conflicts or popular demonstrations by selectively disabling them. In January 2011 the Egyptian Government cut off nearly all Internet access and shut down cell phone service.77 This is not an isolated incident. A recent report, Freedom on the Net 2012, found that nationwide and localized shutdowns are becoming more common.78 Similarly, aid agencies’ use of satellite images and detailed maps may be considered to have security implications. Yet even though treaties, such as the International Charter on Space and Major Disasters, are supposed to provide a framework for the rapid release of data in an emergency, too often this process is delayed.
This might urge international humanitarian responders to ensure that their systems and plans still support rapid response in an information-restricted environment.
“The Internet is no longer a free realm, but neither has it fulfilled the Orwellian prophecy. It is a contested terrain, where the new, fundamental battle for freedom... is being fought.”Manuel Castells, founding member,
USC Center on Public Diplomacy.79

38
D. Information overload
People are struggling to manage increasing amounts of information. The amount of available digital data at the global level grew from 150 exabytes in 2005 to 1,200 exabytes in 2010,80 and the McKinsey Global Institute projects that it will continue to grow by 40 per cent per year. 81 This scale is staggering. One petabyte is equivalent to 20 million four-door filing cabinets full of paper. One exabyte is 1,000 petabytes. Understanding which bits of information are valuable to saving lives is a challenge when faced with this ocean of data. More data may not always be the right answer. In time-constrained situations, decision makers can only process a certain amount of information, and in situations where there is limited understanding of the nature of a problem, the search for more data can obscure the need for more analysis. Each additional unit of data that requires analysis has a transaction cost. In a resource-limited environment, the cost of analysis can easily be overwhelming. Individuals and data-processing systems need to know how to value differing pieces of data in a way that supports necessary decisions at the appropriate scale. A member of a sub-national disaster management committee will find limited value in the aggregate analysis of national cell phone top-up data, while a national disaster management office may find limited value in an individual story of need. Sector-specific analysis is necessary to transform general data into action that can, for example, restore water-and-sanitation services.
E. Increased expectations
As people increasingly adopt new communications technologies, Governments and humanitarian aid agencies are learning to recognize these technologies as legitimate channels. They are also recognizing that people expect their communications to generate action. Recent Red Cross research found that three out of four Americans expect help within three hours of posting a request on social media, demonstrating a pattern of year-on-year increases in expectations.84 Governments and responders will soon need answers to the questions: “Where were you? We Facebooked/tweeted/texted for help, why didn’t someone come?” The opening story from the Philippines suggests that middle-income countries will soon face similar questions.
?
DATA OVERLOADmore data is not the right answer
Figure 9Data overload

39
Tweeting after the earthquake
Recent emergencies have shown the scale and speed with which data from new sources is produced following a sudden-onset disaster. The day after the 12 March 2011 earthquake in Japan, 572,000 new Twitter accounts were created and 177 million tweets were sent, including 1,200 tweets a minute, from Tokyo. Shortly after the 2011 earthquake in Christchurch, New Zealand, 7,500 tweets per hour (or just over two tweets per second) were posted on the dedicated hashtag #nzeq. The figure below, from the Chilean earthquake of 2010, shows how rapidly Twitter can register a spike in a trending topic.
The Haiti earthquake also generated massive amounts of information using old and new technologies. Over 80,000 text messages were sent to the 4636 short code, set up to receive aid requests. Of these, some experts estimated that 90 per cent were “repetition, or ‘white noise’, meaning useless chatter.82 Information management systems were overwhelmed. Two weeks after the earthquake, an OCHA mission was receiving one informational e-mail per minute, which needed to be classified, analysed and then directed to the relevant sectoral team.83 Without adequate capacity to manage and filter information, overload can become a serious problem.
Increased interaction is also likely to increase the pressure on humanitarian responders to define what they can and cannot provide. The extent of communities’ desires may exceed their immediate life-saving needs, raising expectations beyond those that humanitarian responders can meet. This can have dangerous consequences. Expectation management has always been important; it will become more so in the network age.
F. Privacy, ethics and security
Much new data is public. This raises significant concerns around traceability. Can information be tracked back to the individual, community, village or any other unit of analysis? Could it compromise their lives, dignity or livelihoods? Mechanisms for collecting anonymous information can protect individuals and communities from reprisal, but also increase the incentives for
Viña del Mar FestivalChilean earthquake
Hours (local time)
Num
ber o
f Tw
eets
22:0
0
0
1000
2000
3000
4000
5000
6000
7000
8000
23:0
0
00:0
0
01:0
0
02:0
0
(*)0
3:00
04:0
0
05:0
0
06:0
0
Two trending topics with different fates during the earthquake.

40
“Behind the scenes they have certain intentions, but on the face they are talking of relief and help. No relief
is reaching the affected people, and when the victims are not receiving
help, then this horde of foreigners is not acceptable to us at all… when we say something is unacceptable to us,
one can draw his own conclusion.” Pakistani Taliban spokesman Azam Tariq on aid
workers responding to the 2010 Pakistan floods.
misreporting. This is a particular concern in conflict settings, where there are parties willing to use violence to pursue their goals.
Information that identifies people who report on acts of violence can be used by Governments or armed groups for retribution. Humanitarian workers can become targets. In 2010, as highlighted in the quote opposite the Taliban threatened to target foreign aid workers responding to the floods in Pakistan. Even seemingly innocent information, such as the location of food distribution points and clinics, can attract violence. Targeting can extend to communications infrastructure: the Islamist group Boko Haram destroyed 24 mobile phone towers in northern Nigeria in September 2012.
New technologies can also create new threats, such as a greater risk of surveillance or manipulation. According to the Electronic Frontier Foundation, a San Francisco-based organization that protects rights in the digital world, Syrian activists, journalists and Government-opposition groups have been consistently targeted by surveillance malware, building on a series of counter-information efforts using fake revolutionary documents and a fake Skype-encryption tool.85
Privacy issues around the use of data exhaust, or around the posting of personal information on social media websites, have prompted urgent debates around the world. But while private-sector organizations and Government regulators have been grappling with this issue for almost a decade, humanitarian organizations appear further behind. Who is liable if a security breach allows data to be used in a harmful way? Who “owns” data and resulting information products if the original source is citizens, and who is responsible if that data is misused?
The Satellite Sentinel Project (SSP) case study on page 41 highlights some of these concerns. The questions it raises are as applicable to the use of Twitter, or SMS short codes, as satellite data. Ensuring data security, developing robust guidelines for informed consent and tackling the ethical questions raised by open data are an essential task for the new humanitarian partnership.
4. The need to adaptDespite these risks, the tools and techniques of the network age offer a significant opportunity to reduce human suffering. There is no single answer and no technological standard or application that will, by itself, save more lives. Technology can only be as effective as the system it supports. What is clear is the need for Governments and the

41
Satellites over Sudan
In December 2010, the actor George Clooney and Enough Project co-founder John Prendergast brought together a coalition of research, advocacy and technical organizations to form SSP. Over the next 18 months, the project analysed more than 300,000 km2 of high-resolution imagery of the border between what is now Sudan and South Sudan. The analysis highlighted patterns of violence, identifying changes in the location of armed forces and evidence of possible war crimes, such as razed villages or mass graves. The project has raised profound ethical and legal questions around private spy satellites and concerns over private actors making charges such as war crimes.86
While strongly defending their methodology and approach, SSP members have acknowledged a range of questions. What information should be shown publicly? What is the potential to unintentionally provide hostile or malicious actors with useful intelligence? Does sharing information endanger at-risk people? What happens to vulnerable civilians if crisis-mapping data is wrong? What happens if it is right? What responsibility do humanitarian organizations have to report and share mistakes transparently? If aid agencies are the first to spot an emerging threat, what is the most ethical and effective way to alert people in danger? How can sensitive data be kept more secure from hackers? How can evidence of war crimes and crimes against humanity best be documented and preserved for possible use in future domestic and international prosecutions?
The questions are not only operational. SSP members recognize that there is a fundamental ethical issue, observing: “…it is yet to be formally determined whether vulnerable populations have an inalienable right to certain forms of information from NGOs, governments and corporations about threats to their lives and livelihoods…. Even if there is no ‘right to the Internet,’ access to information—leading to decisive action in order to mitigate these threats—can be a question of life or death.”87
To respond to these questions, SSP called for the creation of “shared mechanisms for monitoring and evaluation, guidelines for guaranteeing the safety of informants, and frameworks to hold practitioners responsible for adherence to ethical and technical standards”. Correspondingly, they maintain that Governments, donors and corporations, who control access to satellites, cell phone grids and servers, “must understand and comply with any binding legal obligations, either to protect or release crisis data, especially individually identifiable information”. Without these types of protections, they caution that recent “triumphs may quickly turn into tragedies in the months and years ahead”.88
international humanitarian system to open themselves to new approaches.
The following chapter looks further at how humanitarian action is already changing. It
also identifies basic principles essential for effective action in the network age.
We are not in [Sudan’s] airspace. We have not violated their sovereignty. We have not violated international law.”Nathaniel A. Raymond,
SSP Director of Operations89

Network age – KenyaCustomers make money transfers at an
M-Pesa counter in Nairobi, Kenya in August
2011. M-Pesa is a mobile phone banking
service that allows people without a bank
account to transfer money between phones
instantly anywhere in the country. Kenyans
used M-Pesa to make donations to support
people affected by the drought in 2011.

43
CHAPTER 3
Adaptation and change
The previous chapters focused on the changes that characterize the network age, and how new ideas and technologies can improve communications among the increasing array of humanitarian actors. Against this backdrop of change, humanitarian action is already adapting. Three forms of adaptation outlined below can help humanitarian organizations take advantage of the opportunities available.
First, humanitarian aid organizations must adapt to work with new data sources. With sophisticated analysis layered over big open data, and techniques such as crowdsourcing and crowdseeding, they could access more accurate, relevant, timely and reliable information. To do so, they must embrace these sources and lose the fear of being overwhelmed. They must understand how to incorporate these sources into decisions and invest in building analytic capacity across the entire humanitarian network.
Second, humanitarians must adapt to work with new partners and new techniques. This is an ongoing process, and the ethos of this report is that the adaptation should take place based on open two-way communications between traditional humanitarians and a wider array of actors—including those communities they aim to assist. This will play out over the next decade and beyond, but there are many basic steps
that can be taken today that empower vulnerable and crisis-affected people to manage their risks and shape their recoveries.
Third, humanitarians must adapt to the idea of information as a basic need in humanitarian response. This may require a reordering of priorities and a revision of roles, particularly by international humanitarian organizations. The evidence in this report suggests that in the network age, access to accurate, consistent information by a wide range of response actors provides the foundation for life-saving interventions and helping people recover from a crisis.
These adaptations are not optional. Communities and Governments are demanding more information transparency and more effective performance from humanitarian actors. The network age creates value when information is shared. The failure
“Never has it been so easy to expose an error, check a fact, crowdsource and bring technology to bear in service of verification.” Craig Silverman, Truth in Social Media91

44
to share is no longer a matter of institutional recalcitrance: it can cost lives.
1. Adapting to new data sources, tools and techniques Improving the quality of humanitarian decisions requires the effective use of data. To exploit the opportunity of the network age, humanitarians must understand how to use the new range of available data sources and have the capacity to transform this data into useful information.
The case of the Ushahidi platform in Haiti, which has been extensively studied elsewhere, demonstrates that there is a readiness to adapt, but also a need to better understand the nature of new data sources and collection techniques.90 This includes the adoption of better and faster tools to verify the accuracy of real-time data.
The evidence suggests that new information sources are no less representative or reliable than more traditional sources, which are also imperfect in crisis settings. But there is a need to develop shared principles and guidelines to ensure new partners have a better understanding of how decisions are made and what information is useful to improve humanitarian action.
How an intern galvanised action in West Africa
After the devastating 2007 floods in West Africa, IFRC developed a partnership with Columbia University’s International Research Institute for Climate and Society (IRI) to interpret weather forecasts. The May 2008 Seasonal Climate Outlook Forum for West Africa forecast floods for the July-to-September rainy season. The initial map, however, was incomprehensible to IFRC regional disaster managers because of the “technical language used, the absence of detailed and clear commentary, and the lack of clarity on how the forecast information might be relevant to their humanitarian work.” Fortunately, through the IRI partnership, an intern who had been placed with IFRC understood the map and acted as an “in-house translator” of the forecast. That intern was asked to explain the map in a briefing to the IFRC West Africa office. This simple step—a face-to-face explanation by an individual with a technical background—was enough to convince IFRC to act on the early warning signals.92
A second source of guidance came from the Red Cross/Red Crescent Climate Centre, created in 2002 to “integrate knowledge of climate risks into Red Cross/Red Crescent strategies, plans, and activities.”93 The Climate Centre incorporated 14 national IFRC offices in Africa into a programme designed to understand how to link climate forecasts with decision-making.94
IFRC issued an emergency appeal for funding and increased staff numbers. It also warned potentially affected communities of the danger. Although donors did not make external funding available until the crisis was under way in August, internal funding enabled bottles, tents, blankets, mosquito nets and soap to be pre-positioned in three countries, ready to help up to 9,500 people. Twelve Regional Disaster Response team leaders were trained to be deployable within 24 hours of a flood, enabling a swifter and better response.95

45
To adapt to the network age, humanitarians need to work together and with new partners to develop clear and shared standards, best practices and guidance to help analysts verify raw data and transform it into useful information for decision-making.
New technologies are providing access to new data sources and new methods of interaction that did not previously exist. Humanitarians have engaged seriously with crowdsourcing, but the appreciation for how to use big data and the technical capacity required to transform data into useful information exist only in small pockets. This is not only a humanitarian problem: The McKinsey Global Institute estimates that the US private sector requires 140,000 to 190,000 more data analysts and 1.5 million more “data-savvy” managers in order to take advantage of the potential gains of big data. But the gap is even more acute for humanitarian and donor-funded organizations that have not prioritized these disciplines. If given the attention it deserves, the potential to save lives is significant, as illustrated by the case on page 44 from West Africa.
Number of “data-savvy”managers the US private sectorneeds to take advantageof big data
1.5 million
How decentralized decision-making saved lives in Japan
The key actors during the March 2011 Fukushima nuclear crisis were technical experts, national agencies, the plant’s private management firm and the Prime Minister’s office, where ultimate authority lay. On the evening of 12 March, the Prime Minister’s office argued that TEPCO, the plant-management firm, should stop pumping salt water into the nuclear reactors. Plant Manager Masao Yoshida publicly avowed compliance, but secretly disobeyed the instruction. During the videoconference, Yoshida whispered to another employee that he would loudly order a halt to the seawater injections, but that everyone on the site should ignore that order. Experts agree that this decision almost certainly averted a more serious meltdown.96
Two days later, according to then Prime Minister Kan, TEPCO’s President proposed a withdrawal from the plant, raising the spectre of an uncontained meltdown. According to multiple reports, a senior official contacted Yoshida, the Plant Manager, who demurred, saying: “We can still hold on, but we need weapons, like a high-pressure water pump.”98 According to TEPCO, their intent was only to withdraw non-essential workers. Because of this confusion, many valuable hours were spent debating a non-decision.
Information flowing from the on-site technical experts to decision makers can help to ensure the right decisions are being discussed. The Fukushima case highlights that the lack of such links can increase the risk of a grave disaster.99
46
Perhaps most striking about this example is the influence of an intern. Translating real-time, sophisticated analysis into action requires technical capacity, which may not always be present at the managerial level. To adapt, organizations must recognize, value and nurture the capacity to translate data into actionable information. It is all too easy to see a scenario where the intern would have been ignored.
The review of the decision-making process for the 2011 tsunami and nuclear crisis in Japan further underlines the value of enabling decentralized, technical leadership.
A. Ethical issues around new sources of information
Traditional forms of data collection, such as surveys, can be managed to make sure information cannot be linked to individuals. New data sources may make it easier for data points to be traced to their origin. Even if anonymity is preserved in publication, the possibility exists that data points can be linked to personal details through social media, through pressure applied to data holders or through technological means.
In conflict situations or other highly polarized environments, privacy concerns can become paramount. Information can be used by authorities or non-state actors to target those who provide it, or other individuals. Governments often seek to monitor online dissent and information sharing.
Concern over the protection of information and data is not a sufficient reason to avoid using new communications technologies in emergencies, but it must be taken into account. To adapt to increased ethical risks, humanitarian responders and partners
need explicit guidelines and codes of conduct for managing new data sources. Some of this work has begun (IFRC is issuing an update to its “Professional Standards for Protection Work on Data Management and New Technologies”), but much more attention is required. This is an area where humanitarian aid organizations could learn from private-sector organizations that are engaging with these issues.
2. Adapting to new partnerships and techniques in humanitarian action The use of new technology by people in crises can help them to take a greater role in making decisions about their future. Much of this happens within a community and can range from the provision of a phone to call for help, to using pre-arranged short codes to inform neighbours of flood risks. The cases below demonstrate the value of participatory processes in risk reduction and early warning.
A. Participatory mapping for preparedness and risk reduction
Satellite data and GIS systems can produce a remarkably detailed picture of a specific area, but the raw pictures can miss vital pieces of contextual information. How well maintained is a floodwall? Who lives in that house and how easily could they evacuate along a particular route? Participatory mapping techniques blend technology and community outreach to improve the quality of information.
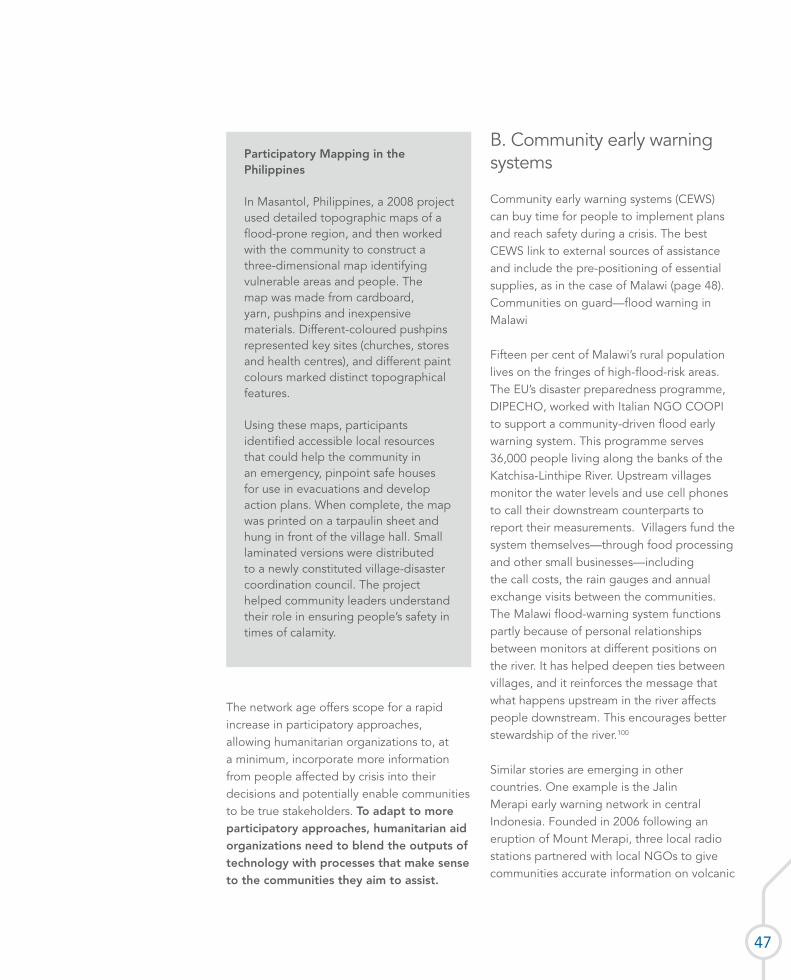
47
Participatory Mapping in the Philippines
In Masantol, Philippines, a 2008 project used detailed topographic maps of a flood-prone region, and then worked with the community to construct a three-dimensional map identifying vulnerable areas and people. The map was made from cardboard, yarn, pushpins and inexpensive materials. Different-coloured pushpins represented key sites (churches, stores and health centres), and different paint colours marked distinct topographical features.
Using these maps, participants identified accessible local resources that could help the community in an emergency, pinpoint safe houses for use in evacuations and develop action plans. When complete, the map was printed on a tarpaulin sheet and hung in front of the village hall. Small laminated versions were distributed to a newly constituted village-disaster coordination council. The project helped community leaders understand their role in ensuring people’s safety in times of calamity.
The network age offers scope for a rapid increase in participatory approaches, allowing humanitarian organizations to, at a minimum, incorporate more information from people affected by crisis into their decisions and potentially enable communities to be true stakeholders. To adapt to more participatory approaches, humanitarian aid organizations need to blend the outputs of technology with processes that make sense to the communities they aim to assist.
B. Community early warning systems
Community early warning systems (CEWS) can buy time for people to implement plans and reach safety during a crisis. The best CEWS link to external sources of assistance and include the pre-positioning of essential supplies, as in the case of Malawi (page 48).Communities on guard—flood warning in Malawi
Fifteen per cent of Malawi’s rural population lives on the fringes of high-flood-risk areas. The EU’s disaster preparedness programme, DIPECHO, worked with Italian NGO COOPI to support a community-driven flood early warning system. This programme serves 36,000 people living along the banks of the Katchisa-Linthipe River. Upstream villages monitor the water levels and use cell phones to call their downstream counterparts to report their measurements. Villagers fund the system themselves—through food processing and other small businesses—including the call costs, the rain gauges and annual exchange visits between the communities.The Malawi flood-warning system functions partly because of personal relationships between monitors at different positions on the river. It has helped deepen ties between villages, and it reinforces the message that what happens upstream in the river affects people downstream. This encourages better stewardship of the river.100
Similar stories are emerging in other countries. One example is the Jalin Merapi early warning network in central Indonesia. Founded in 2006 following an eruption of Mount Merapi, three local radio stations partnered with local NGOs to give communities accurate information on volcanic

48
activity. By the time the volcano erupted again in October 2010, the early warning network had grown to 800 volunteers and had a presence on Facebook and Twitter. After the October eruption, the system was heavily used. Volunteers sorted incoming information, cross-referenced it and checked for veracity. In one example, cited by the BBC, a request for food for 6,000 displaced people was verified and re-tweeted by Jalin Merapi followers. Within 30 minutes, local volunteers confirmed that enough food had been supplied, and the team shared this message widely.101
Substantial work is being done to strengthen and expand these types of systems. The Swedish Civil Contingencies Agency (MSB), in conjunction with IFRC, is launching a Strategic Guide and Toolkit package for CEWS. This package brings to light
Communities on guard – flood warning in Malawi
Fifteen per cent of Malawi’s rural population lives on the fringes of high-flood-risk areas. The EU’s disaster preparedness programme, DIPECHO, worked with Italian NGO COOPI to support a community-driven flood early warning system. This programme serves 36,000 people living along the banks of the Katchisa-Linthipe River. Upstream villages monitor the water levels and use cell phones to call their downstream counterparts to report their measurements. Villagers fund the system themselves—through food processing and other small businesses—including the call costs, the rain gauges and annual exchange visits between the communities.
Figure 10The Jalin Merapi early warning network provides accurate information to communities on volcanic activities
MerapiEruption
2006
MerapiEruption
+Lava Flow
2010Affected
population
Assessments
TwitterSms
JalinMerapi
Public
one waycommunication
unreliable
sensationaljournalism
more accurate
efffective
community-based
Radiocommunity
TwitterFacebook
WebSMS
validation
validationMedia Integration
x
x
x
Public
Affectedpopulation
Assessments
Mainstream media
RadioTv
Newspaper
JALIN MERAPI − EARLY WARNING NETWORKthat provides accurate information to communities on volcanic activities

49
community-level experiences from across the globe and offers a set of guiding principles. MSB aims to create a roster of trained professionals from developing countries to promote CEWS.
The work on CEWS shows how communities do not need to wait for information to come from outside sources, but they can monitor local hazards and vulnerabilities themselves and then shape the response. To adapt, international humanitarian organizations must embrace the shift of warning systems to the community level, and help Governments and communities to prepare for, react and respond to emergencies using their own resources and networks.
C. Standards as a basis for communications
Investing in new partnerships to make aid more effective is common sense. But partnerships can only work if there are common standards that allow data to be freely exchanged between participants. Currently, common standards for information exchange within the international humanitarian system have not seen widespread implementation. This is concerning. If the division of information into institutional and sectoral silos continues, more actors will make more decisions based on incomplete information. This wastes money and costs lives.
The private and public sectors have invested considerably in common standards and transparent, sharable, scalable information flows. Humanitarian organizations lag behind. To adapt, humanitarian organizations must develop and implement common standards for information exchange.
3. Information as a basic need in humanitarian responseThe network age empowers people to manage their own information and make decisions accordingly. The cases above highlight techniques that help humanitarian organizations to use a wider variety of information and ensure that this information is shared. But to truly adapt to the network age, humanitarians must recognize that information and communications enable communities to act on their right to influence, shape and direct humanitarian assistance.
The freedom to seek, receive and impart information is enshrined in the Universal Declaration of Human Rights. This means that Governments and aid agencies, particularly well-resourced international actors, have an operational obligation to help communities, local authorities and NGOs to generate, access and use information. This elevates information to the level of a basic need in humanitarian response. Information is not water, food or shelter, but in the list of priorities, it must come shortly after these.
To elevate information to this level requires investment in initiatives to build and support this capacity before, during and after emergencies. Doing so would mandate the restoration of ICT infrastructure as a post-crisis priority and ensure its inclusion in preparedness and contingency plans. Adaptation also means recognizing that information is a system-wide commodity that must be shared and jointly owned and used before, during and after a crisis. This is not

50
Mobilizing communities in post-earthquake Haiti
Following the earthquake in 2010, Haitians used an innovative mix of technologies to mobilize communities. Radio One, a local radio station, set up a reunification service that blended social media, radio and face-to-face contact. Teams took messages from people who came to the station, monitored computers and catalogued requests. Once verified, information was posted to Facebook and broadcast live, serving an audience across Haiti as well as in the diaspora. Radio One was only one of many stations that provided an ad hoc reunification service; all of these stations subsequently reported their need for basic assistance, such as fuel and cell phone credits.102
Figure 11Radio One reunification systemRADIO ONE − REUNIFICATION SYSTEM2010 earthquake in Haiti
TwitterSms
RadioOne
verifiedinformation
Requests and names logged by Radio One team
Diffusion of verified informa-tion
People searching for missing family or friends contact Radio One
Reunification
Information given to Radio’s motorbike courier for ground verification
via Facebook
face-to-facecontact
via Twitter
via Facebook
radiobroadcast
via Twitter

51
only about aid agencies. They are beginning to develop common needs assessments and data standards to ensure that information sharing becomes common humanitarian practice. Rather, it is about Governments and communities, who must work together to find ways that work for their societies to ensure information can flow.
Effective support of community-driven information systems also recognizes the need to use appropriate levels of technology, as the story below from the Philippines explains.
Despite increasing mobile phone and
Internet penetration, people do not always have access to the same communications technologies as the organizations helping them. In fact, the people most at risk are often the least likely to have access to that technology. Systems for communicating with affected people have to be rooted in
technology they can use, and be sustainable and appropriate to the environment where they are being deployed. Hybrid approaches can blend high technology with more community-friendly mechanisms, as in the case below from the Central African Republic (CAR):
Internews and the Central African Republic – blending radio with online solutions104
Over the past decade, CAR has experienced a series of crises, causing hundreds of thousands of people to seek help. But CAR’s weak communications infrastructure has made it difficult for humanitarian organizations to find out what is happening. Internews, with local partners, identified a network of local radio stations that could work with humanitarian responders to improve the quality of information.105 Local journalists acted as an intermediary, visiting communities, reporting on needs and on humanitarian activities.106 Their stories were broadcast through the radio network and uploaded to a website run by Ushahidi, which mapped and tracked the evolving situation.107 To cope with CAR’s limited Internet connectivity, Ushahidi also offered low-bandwidth and offline versions of the site and a more flexible interface.108 This provided a full range of options for locals and humanitarian workers with differing levels of Internet access.
“I was not informed of last week’s floods, nor [of] today’s floods. I do not know why they are letting us wade into dirty water when all they need to do is, for example, put up a loud siren. Not all of us have Internet…I have yet to hear from my wife and two sons. I hope they are safe.” Marcos Bonete, 49, from Manila in August 2012,
as he jumped onto a truck that would
take him to safety.103

52
To adapt to the network age, programming must ensure that communities can access information irrespective of their level of technological development. Those with access to advanced technology and access to power need to work with crisis-affected communities to understand what systems work best for them. Older technologies, such as radio, can be used innovatively, as in the CAR example on page 51. Cell phones or other technologies can be provided as part of crowdseeding initiatives, such as in the Voix des Kivus project, on page 32. The 3D-mapping exercise (page 47) in the Philippines demonstrated that strings and paint can work alongside satellite mapping. Communities know best what works for them; external actors need to listen and model their response accordingly.
Early steps to improve communications with affected communities may not always produce an immediate transformation in humanitarian decision-making. But effective communication can also be seen as an end itself in promoting human dignity. More than 3,000 Somalis responded to the Somalia Speaks project, and they seemed to feel that speaking out was a worthwhile activity.
4. A holistic approachThe three sections above lay out demanding requirements for humanitarian agencies to adapt to the network age. They describe the need to work with new data sources and address the ethical complexities they generate; to use technical expertise that can help make better decisions; to blend modern technology with effective outreach and ensure that communities can access information; and to build standards that allow information to flow freely. Can this be done?
It can, according to the case study on page 53 of the American Red Cross’s efforts to adapt to this new age.
Many humanitarian organizations—and indeed many Governments—can only dream of the funding that ARC was able to bring to this initiative, and having Dell as a technology partner might be out of most agencies’ reach. But there are many steps they can take to adapt without significant cost. The Kenyan Red Cross, for example, has launched its iVolunteer initiative, which uses social media to increase outreach into communities, improve the speed of information flows to the Kenyan Red Cross and thereby improve the society’s response time.113
The next chapter offers a series of organizing principles that can help readers adapt to the network age. These are linked to a series of goals with measurable targets and concrete operational steps.
“They say that history is written by the victors. But now, before the victors win, there is a chance to scream out with a text message
that will not vanish.” Anand Giridharas, New York Times,
14 March 2010109
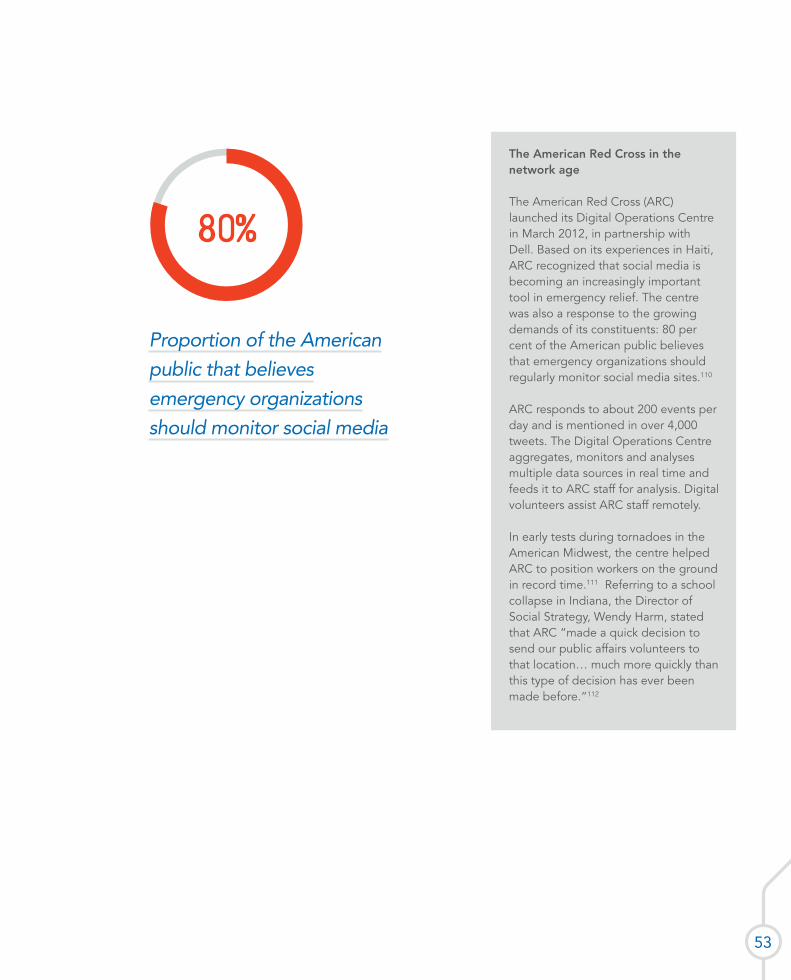
53
The American Red Cross in the network age
The American Red Cross (ARC) launched its Digital Operations Centre in March 2012, in partnership with Dell. Based on its experiences in Haiti, ARC recognized that social media is becoming an increasingly important tool in emergency relief. The centre was also a response to the growing demands of its constituents: 80 per cent of the American public believes that emergency organizations should regularly monitor social media sites.110
ARC responds to about 200 events per day and is mentioned in over 4,000 tweets. The Digital Operations Centre aggregates, monitors and analyses multiple data sources in real time and feeds it to ARC staff for analysis. Digital volunteers assist ARC staff remotely.
In early tests during tornadoes in the American Midwest, the centre helped ARC to position workers on the ground in record time.111 Referring to a school collapse in Indiana, the Director of Social Strategy, Wendy Harm, stated that ARC “made a quick decision to send our public affairs volunteers to that location… much more quickly than this type of decision has ever been made before.”112
Proportion of the American public that believes emergency organizations should monitor social media
80%

Looking to the futureA volunteer works at the Red Cross
Digital Operations Center monitoring
Social media in real time. In early tests
during tornadoes in the American
Midwest, the center helped ARC to
position workers on the ground in
record time.

55
CHAPTER 4
Conclusions and recommendations
The previous chapter highlighted changes made by Governments and humanitarian responders to adapt to the network age. But there is a need for more concerted action to build on these early ideas and to build partnerships that deliver results.
Affected people’s needs must be the starting point. Everyone in the humanitarian system exists to meet those needs. Ensuring that responders listen to affected people and find ways to respond to their priorities will require a mindset change. But placing communities front and centre, working together and sharing information will deliver a better humanitarian response.
Putting the vision into practice requires an understanding of three basic principles:
1. Information is a basic need.
2. Anyone can generate valuable information.
3. Information creates most value when it can be shared widely and freely.
This report does not aim to be exhaustive. The terrain is continually shifting, and people are finding new and brilliant ways to cope with crises every day. But this vision and these basic principles can guide humanitarians through a changing landscape and help them adapt to a new way of doing business.
It will not be easy. While valuable information can be generated anywhere, detecting the value of a given piece of data requires analysis and understanding. Information can be shared freely, but current systems are a long way from being open and accessible. And while information can be used by anyone, power remains concentrated in the hands of a limited number of decision makers. If they do not use this information to make decisions in the interests of the people they serve, its value is lost.
By embracing the first principle listed above—that information is a basic need—humanitarian organizations can adapt to the next two principles.
“People need information as much as water, food, medicine or shelter. Information can save lives, livelihoods and resources. Information bestows power.”IFRC World Disaster Report, 2005

56
The premise that information is a right, and therefore a basic need in humanitarian response, may continue to be debated. It should not be. Humanitarian organizations have an operational and moral obligation to incorporate information into their work. It is demanded by the communities and individuals that humanitarian organizations serve. The freedom to seek, receive and impart information is part of the Universal Declaration of Human Rights.
The recommendations below outline four essential steps that, if implemented, will help to make these principles a reality. They lay out major objectives and propose tracking criteria for monitoring progress. The major objectives are accompanied by specific operational suggestions in annex A. Progress against these recommendations should be reviewed in two years’ time, by 2015.
These proposals are only a beginning. To move into the network age, humanitarians will have to embrace constant adaptation. Much of this adaptation will occur outside traditional humanitarian assistance forums. The most efficient ways to use technology to support communities will be found in their use of technology. If aid organizations are willing to listen, learn and encourage innovation on the front lines, they can play a critical role in building a more inclusive and more effective humanitarian system.
“…organizations that make their boundaries porous to external ideas and human capital outperform those
that rely solely on their internal resources and capabilities and outmoded ways of working.”
Don Tapscott, author of Wikinomics:
How Mass Collaboration Changes Everything
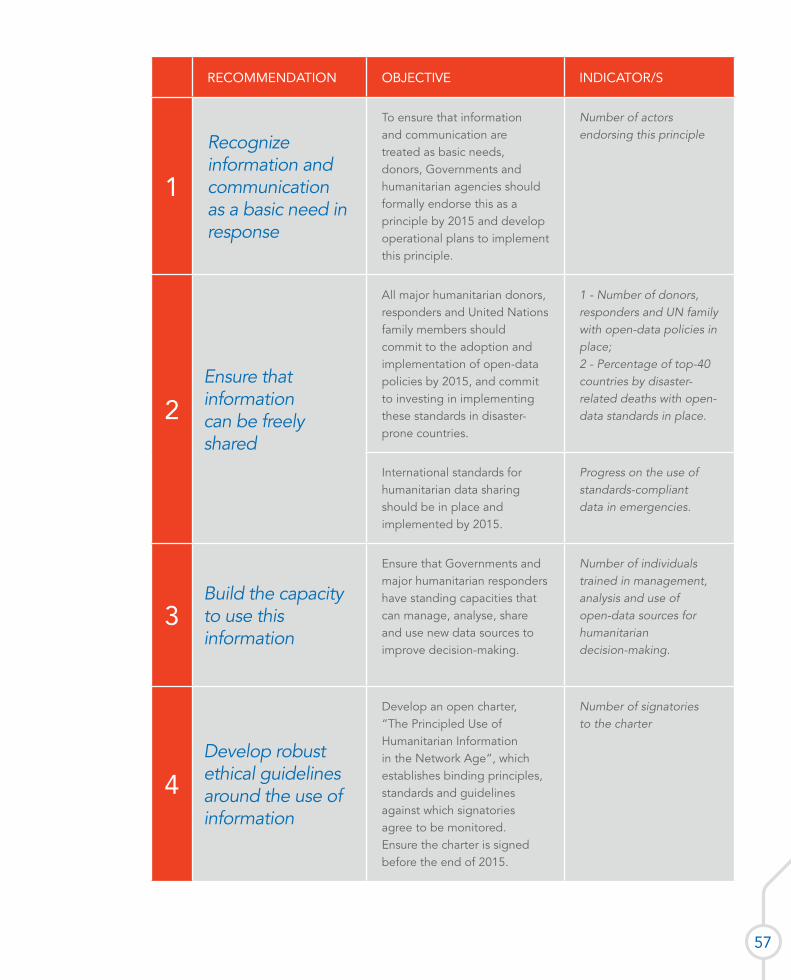
57
RECOMMENDATION OBJECTIvE INDICATOR/S
1
Recognize information andcommunication as a basic need in response
To ensure that information and communication are treated as basic needs, donors, Governments and humanitarian agencies should formally endorse this as a principle by 2015 and develop operational plans to implement this principle.
Number of actors endorsing this principle
2Ensure that information can be freely shared
All major humanitarian donors, responders and United Nations family members should commit to the adoption and implementation of open-data policies by 2015, and commit to investing in implementing these standards in disaster-prone countries.
1 - Number of donors, responders and UN family with open-data policies in place; 2 - Percentage of top-40 countries by disaster-related deaths with open-data standards in place.
International standards for humanitarian data sharing should be in place and implemented by 2015.
Progress on the use of standards-compliant data in emergencies.
3Build the capacity to use this information
Ensure that Governments and major humanitarian responders have standing capacities that can manage, analyse, share and use new data sources to improve decision-making.
Number of individuals trained in management, analysis and use of open-data sources for humanitarian decision-making.
4Develop robust ethical guidelines around the use of information
Develop an open charter, “The Principled Use of Humanitarian Information in the Network Age”, which establishes binding principles, standards and guidelines against which signatories agree to be monitored. Ensure the charter is signed before the end of 2015.
Number of signatories to the charter

58
1. Recognize information and communication as a basic need in responseSpecific operational recommendations:
Governments
• Incorporate in existing disaster management legislation, and/or other relevant guidelines, a commitment to restore and support communications networks as a humanitarian priority.
• Codify standard operating procedures for working with private-sector information and communications companies in emergencies.
Inter-Agency Standing Committee
• Develop guidelines and standards for the inclusion of information projects, including community early warning systems and other community-level projects, in the Central Emergency Response Fund and all consolidated appeals by 2014.
• By 2014, clarify that support for restoring communications networks in a crisis is a critical task, particularly in sudden-onset emergencies. Ensure there is accountability for restoring and maintaining communications networks, when appropriate.
• Develop a Communications Marker, along the lines of the Gender Marker, to identify which projects fully incorporate two-way communications and other elements deemed critical. Ensure that CAP guidelines encourage the funding of projects that score a high mark, and actively lobby donors to do so.
• Commit to including evaluations of communication and information issues as a key pillar in all evaluations of humanitarian action. Ensure that such evaluations have begun by 2015.
Humanitarian organizations
• Include communication tools, such as wind-up radios, cell phones or other tools, in basic non-food item kits and aid packages as appropriate.
• Fully incorporate information and communications needs into revised needs-assessment methodologies, including developing standards and best practices for communication mapping in emergency response, no later than 2015.
ANNEx A
Further operational recommendations

59
Donors
• Commit to including evaluations of communication and information issues in all funded projects and in any major review of humanitarian action.
• Commit to funding projects that score highly on the Communications Marker, and to rapidly and adequately funding the restoration of communications in emergencies.
2. Ensure that information can be freely sharedSpecific operational recommendations:
Governments
• Ensure that national data essential for humanitarian response is accessible and usable, including through legislation to allow for limited release of restricted information, such as high-resolution maps, in emergencies.
• Ensure inter-operability between public networks and networks dedicated to emergency communications.
Inter-Agency Standing Committee
• Develop and agree on common data standards for sharing and collection by 2014.
• Ensure full implementation by all members by 2016.
Humanitarian organizations
• Recognize that sharing information is a core task and part of the mandate of international humanitarian organizations. Define how information will be used in emergencies and how it will be shared with communities, Governments and other partners.
• Share data collected and generated by humanitarian organizations (surveys, assessments, reports) on open platforms for anyone to use and review, particularly where this can fill gaps in national data.
Donors
• Provide resources to help Governments and humanitarian organizations to adopt shared data standards and move to open-data systems.
• Withhold funding from organizations that do not comply with open-data standards.
Private sector
• Develop a charter or framework for the rapid release of anonymized proprietary data in humanitarian emergencies, with transparent criteria for sharing data.

60
3. Build the capacity to use this informationSpecific operational recommendations:
Governments/Inter-Agency Standing Committee
• Develop open-source and free training standards for the management and use of information in emergencies.
Humanitarian organizations
• Develop standards for technical capacity; invest in training and upgrading of skills to meet these standards.
• Develop communications and outreach units with the goal of supporting community interaction.
4. Develop robust ethical guidelines around the use of informationSpecific operational recommendations:
Humanitarian organizations
• No later than 2014, develop “Do No Harm” standards for the ethical use of new forms of data, including protocols for protecting privacy and guaranteeing informants’ safety, and develop frameworks to hold practitioners responsible for adherence to ethical and technical standards. Ensure that these clearly address the separate issues of liability, privacy and security.
• Adopt information management principles as a source of guidance for adapting to the network age.
• Ensure that all projects include complaint and accountability mechanisms that can rapidly respond to issues of concern, abuse, exploitation, etc.

61
3W (Who’s doing what where)/4W (Who’s doing what where when)Information collection and exchange matrices for humanitarian agencies to report on their activities. This is intended to provide humanitarian actors with a clear picture of who’s doing what where (3W) and when (4W).
Crisis mappingA process of sourcing, visualizing and analysing data from a humanitarian, political, ecological, financial or other crisis, often in real time, on a dynamic, interactive map.
Early warning systems Tools that predict the onset of a natural disaster or conflict. Data is collected and analysed ahead of a crisis to forecast events accurately. Most often, a set of time-bound and geographically specific determinants are consistently used for prediction (e.g. weather patterns, local inequality).
Geographic information systemsGeographic information systems (GIS) identify, store, manipulate, analyse and structure geographical data, such as locations of evacuation centres, food distribution points and violent incidents, to enable responders to locate and map events and places during crises. GIS, combined with SMS and open-source data-sharing platforms, have facilitated the phenomenon of crisis mapping popularized by groups such as Ushahidi.
GeolocatingIdentifying the geographic location of an object or place. In disaster management, it often refers to sharing an online map of calamities that have taken place, or people in distress at a certain location.
HashtagsA word or phrase preceded by a hash mark (#), used within a message to identify a keyword or topic of interest and facilitate a search for it. Most commonly used on social networking platforms, such as Twitter.
Information communication technology Information communication technology (ICT) refers to technologies that provide access to information through telecommunications. It is similar to Information technology (IT), but focuses primarily on communication technologies. This includes the Internet, wireless networks, cell phones and other communication mediums.
Real-time evaluationAn evaluation in which the primary objective is to provide feedback in a participatory way in real time (i.e. during the evaluation fieldwork) to people executing and managing the humanitarian response. The Inter-Agency Standing Committee conducts real-time evaluations of major humanitarian emergencies with the other objectives of providing real-time feedback to the Humanitarian Country Teams, lesson learning for the future and seeking out the
gLOSSARY

62
views of affected people on the quality of a humanitarian response.
Short code Special telephone numbers that are significantly shorter than full telephone numbers, and which can be used to address SMS and MMS messages. Short codes can be used to organize incoming information, such as the 4636 code that was used to collect information in Haiti for disaster response. This is distinct from pre-determined codes that can be sent as text messages (such as in the Voix des Kivus project where different types of events were identified by short numeric codes), often to help overcome illiteracy or language barriers.
SMS (Short Message Service)The text-communication service component of phone, web or mobile communication systems, using standardized communications protocols that allow the exchange of short text messages between devices.
Social mediaSocial media platforms facilitate real-time interaction between individuals, communities and organizations on the web. These include Facebook, Twitter, blogs and unique interfaces created for specific missions. Social media allows information to be transmitted through networks, amplifying the depth that information penetrates and the speed by which it travels between individuals.
TrendingWithin social media or other Internet platforms that allow, when a word, phrase or topic is tagged at a greater rate than other tags, indicating its increasing popularity.
TweetA 140-character message sent using the
online platform Twitter. Alternatively, a verb referring to the act of posting a message on Twitter.
UN Cluster SystemClusters are groups of humanitarian organizations, both UN and non-UN, in each of the main sectors of humanitarian action: Protection; Camp Coordination and Management; Water, Sanitation and Hygiene; Health; Emergency Shelter; Nutrition; Emergency Telecommunications; Logistics; Early Recovery; Education; and Agriculture. They are designated by the Inter-Agency Standing Committee and have clear responsibilities for coordination. The United Nations Resident Coordinator and/or Humanitarian Coordinator and the Humanitarian Country Team manage a humanitarian response through the clusters. The Cluster System was introduced in 2005 following a major reform of humanitarian coordination.
Volunteer and Technical Community (V&TC) Individuals and groups outside the humanitarian community who use their expertise to collect, collate and disseminate useful information in a humanitarian response, for example in crisis mapping. V&TCs can range from untrained volunteers participating in crowdsourced exercises, to professional organizations or companies that devote resources to supporting humanitarian action or disaster response.

63
1 TED Blog. Welcome to the open world: Don Tapscott at TEDGlobal. Available from http://blog.ted.com/2012/06/26/welcome-to-the-open-world-don-tapscott-at-tedglobal-2012/.
2 ITU. Key statistical highlights: ITU data release. Available from http://www.itu.int/ITU-D/ict/statistics/material/pdf/2011%20Statistical%20highlights_June_2012.pdf.
3 ITU. The World in 2011 Facts and Figures. Available from http://www.itu.int/ITU-D/ict/facts/2011/material/ICTFactsFigures2011.pdf. Aid recipient data taken from the Global Humanitarian Assistance report 2012. Available from: http://www.globalhumanitarianassistance.org/report/gha-report-2012.
4 Statistic from the GSM, see http://www.ibm.com/smarterplanet/global/share/19jan2012/mobile_africa/ or example, http://www.bbc.com/future/story/20120906-how-tech-democratised-development.
5 World Economic Forum. The Global Information Technology Report 2012.Available from http://reports.weforum.org/global-information-technology-2012/.
6 ITU. The World in 2011 Facts and Figures. Available from http://www.itu.int/ITU-D/ict/facts/2011/material/ICTFactsFigures2011.pdf.
7 See http://www.un.org/en/documents/udhr/index.shtml.
8 “SIDPABB - A community-based flood warning system in the Buzi River Basin, Mozambique” – Video, http://www.youtube.com/watch?v=2oBqJ7csSO0; GIZ “Disaster Risk Management – Effective Early Warning”, http://www.giz.de/themen/en/21071.htm; WMO. Flood Management in Mozambique, WMO Case study, http://www.wmo.int/pages/prog/dra/documents/CDSCaseStudy_Mozambique_V2_Withpictures.pdf; “Managing Floods In Mozambique : The Role Of Recent Institutional Reforms” and “Mozambique Flood Management, The Buzi Warning System”, presentations by Xavier Agostinho Chavana, Ministry of Planning and Development, Mozambique at the Regional Policy Workshop for Humanitarian Partnership - Southern and Eastern Africa, Stellenbosch, South Africa.
9 See USIP Haiti: A Republic of NGOs? Available from http://www.usip.org/events/haiti-republic-ngos. Journalistic estimates range from 343 to 20,000, see http://www.esquire.com/blogs/politics/haiti-ngo-coordination-bill-clinton or http://www.huffingtonpost.com/vijaya-ramachandran/haiti-relief-ngos_b_1194923.html.
10 ALNAP (2012). The State of the Humanitarian System. Available from http://www.alnap.org/ourwork/current/sohs.aspx.
11 Group Speciale Mobile Association – a body that represents the interests of mobile operators worldwide.
12 See http://education.starafrica.com/en/detail-news/view/orange-launches-data-4-development-conte-254295.html.
13 Global Pulse. Data for Development. Available from http://www.unglobalpulse.org/MobileD4DChallenge.
14 See http://www.itu.int/telecom-wt99/press_service/information_for_the_press/press_kit/speeches/annan_ceremony.html.
15 Infoasaid. Endline study preliminary findings from ActionAid and infoasaid project in Isiolo, Kenya. Available from http://infoasaid.org/research/endline-study-preliminary-findings-actionaid-and-infoasaid-project-isiolo-kenya.
16 Alertnet. World could have prevented Horn of Africa famine, aid groups say. Available from http://www.trust.org/alertnet/news/world-could-have-prevented-horn-of-africa-famine-aid-groups/.
17 Webster, P.J., Toma, V.E., and Kim, H.-M. (2011). Were the 2010 Pakistan Floods Predictable? Geophysical Research Letters, Vol. 38.
18 American Geophysical Union. Pakistan floods last summer could have been predicted. Available from http://www.agu.org/news/press/pr_archives/2011/2011-04.shtml.
19 American Geophysical Union. Pakistan floods last summer could have been predicted. Available from http://www.agu.org/news/press/pr_archives/2011/2011-04.shtml.
20 See http://ec2-46-51-135-144.eu-west-1.compute.amazonaws.com/reports/view/3098.
21 See http://ec2-46-51-135-144.eu-west-1.compute.amazonaws.com/reports/view/3102.
22 See http://www.aljazeera.com/indepth/spotlight/somaliaconflict/somaliaspeaks.html.
23 See http://ec2-46-51-135-144.eu-west-1.compute.amazonaws.com/reports/view/3074.
24 For more details on these issues, please see Harvard Humanitarian Initiative (HHI) (2011). Disaster Relief 2.0: The Future of Information Sharing in Humanitarian Emergencies. Washington, D.C. and Berkshire, UK: UN Foundation and Vodafone Foundation Technology Partnership. Available from http://www.unfoundation.org/assets/pdf/disaster-relief-20-report.pdf.
25 Inter-Agency Real Time Evaluation of the Pakistan Floods/Cyclone Available from http://ochanet.unocha.org/p/Documents/RTE11107final.pdf
REfERENCES
64
26 Inter-Agency Standing Committee. Real-Time Evaluation of the Humanitarian Response to the Horn of Africa Drought Crisis – Ethiopia. Available from http://reliefweb.int/report/somalia/iasc-real-time-evaluation-humanitarian-response-horn-africa-drought-crisis-somalia .
27 Olafsson, Gisli. Program in Action: Emergency Response. Available from http://nethope.org/blog/2011/08/program-in-action-emergency-response.
28 See http://www.unocha.org/what-we-do/coordination-tools/cluster-coordination.
29 HelpAge. International Humanitarian response for older people in Haiti: three months on. Available from http://www.helpage.org/download/4cbec81f1ec4c/.
30 RTE of Pakistan, supra note 25; Inter-Agency Real Time Evaluation of the Humanitarian Response to Typhoons Ketsana and Parma in the Philippines, at http://ochanet.unocha.org/p/Documents/IA_RTE_PHI_Final_Report.pdfp.; Inter-agency real-time evaluation of the response to the February 2007 floods and cyclone in Mozambique, at http://ochanet.unocha.org/p/Documents/MZ_RTE_Report_Final[1].pdf
31 Alnap (2006), TEC Synthesis Report 2006, p. 48. Available from http://www.alnap.org/ourwork/tec/synthesis.aspx.
32 World Economic Forum. Big Data, Big Impact: New possibilities for international development. Available from http://www3.weforum.org/docs/WEF_TC_MFS_BigDataBigImpact_Briefing_2012.pdf.
33 Hirschfeld, D. Twitter data accurately tracked Haiti cholera outbreak. Available from http://www.nature.com/news/twitter-data-accurately-tracked-haiti-cholera-outbreak-1.9770.
34 Bengtsson, L., Lu, X., Thorson, A., Garfield, R. and von Schreeb, J. (2011). Improved Response to Disasters and Outbreaks by Tracking Population Movements with Mobile Phone Network Data: A Post-Earthquake Geospatial Study in Haiti data sheet. Available from http://www.mobileactive.org/research/improved-response-disasters-and-outbreaks-tracking-population-movements-mobile-phone-networ.
35 MSNBC. Cholera cases found in Haiti capital. Available from http://www.msnbc.msn.com/id/39787756/ns/health-infectious_diseases/#.UFjD-hh2BVU.
36 Center for Disease Control and Prevention. Haiti Cholera Outbreak - Cholera in Haiti: One Year Later. Available from http://www.cdc.gov/haiticholera/.
37 Aljazeera. Haiti cholera protest turns violent. Available from http://www.aljazeera.com/news americas/2010/11/20101115165524154228.html.
38 New York Times. Haiti’s Needless Cholera Deaths. Available from http://www.nytimes.com/2011/09/07/opinion/haitis-needless-cholera-deaths.html.
39 Department of the Interior Recovery Investments. U.S. Geological Survey: Twitter Earthquake Detector (TED). Available from http://recovery.doi.gov/press/us-geological-survey-twitter-earthquake-detector-ted.
40 USGS. PAGER–Rapid Assessment of an Earthquake’s
Impact. Available from http://earthquake.usgs.gov/research/pager.
41 See http://egsc.usgs.gov/isb/pubs/gis_poster/ or http://www.esri.com/what-is-gis/overview.html or http://www.nwgis.com/gisdefn.htm – which offer variants of the same definition.
42 Irinnews. Philippines: Geo-hazard maps go public. Available from http://www.irinnews.org/Report/94761/PHILIPPINES-Geo-hazard-maps-go-public.
43 Kirkpatrick, R. Data Philanthropy: Public & Private Sector Data Sharing for Global Resilience. Available from http://www.unglobalpulse.org/blog/data-philanthropy-public-private-sector-data-sharing-global-resilience.
44 AidData. Mapping World Bank Project Success Patterns in Afghanistan: Does the Spatial Distribution of Violence Matter? Available from http://blog.aiddata.org/2011/12/mapping-world-bank-project-success.html.
45 See http://opendefinition.org/.
46 See http://www.guardian.co.uk/global-development/poverty-matters/2011/jul/13/kenya-open-data-initiative, http://www.ihub.co.ke/blog/2012/07/increasing-the-consumption-of-open-data-in-kenya/ and http://www.socrata.com/.
47 See http://www.munlima.gob.pe/datos-abiertos.html.
48 See http://zwgk.dl.gov.cn/default.jse.
49 See http://data.gov.in/.
50 See http://beta.dados.gov.br/.
51 See http://www.aidtransparency.net/about/whos-involved.
52 DemocracySpot. Ushahidi in (Sobering) Numbers. Available from http://democracyspot.net/2012/08/29/ushahidi-in-sobering-numbers/.
53 Aljazeera. Crowdsourcing Japan’s radiation levels. Available from http://www.aljazeera.com/news/asia/2011/04/201142317359479927.html.
54 SBTF. OCHA South Sudan Deployment: Curating Data for Disaster Preparedness. Available from http://blog.standbytaskforce.com/ocha-south-sudan-deployment-curating-data-for-preparedness/.
55 USAID. Crowdsourcing to Geocode Development Credit Authority Data: A Case Study. Available from http://transition.usaid.gov/our_work/economic_growth_and_trade/development_credit/pdfs/2012/USAIDCrowdsourcingCaseStudy.pdf.
56 USAID. Crowdsourcing to Geocode Development Credit Authority Data: A Case Study. Available from http://transition.usaid.gov/our_work/economic_growth_and_trade/development_credit/pdfs/2012/USAIDCrowdsourcingCaseStudy.pdf.
57 Columbia Center for the Study of Development Strategies. Event Mapping in the Congo. Available from http://cu-csds.org/projects/event-mapping-in-congo/.
58 Bott, M., Gigler, B. and Young, G. (2010). The Role of Crowdsourcing for Better Governance in Fragile State Contexts, KfW Entwicklungsbank, Open Development

65
Technology Alliance. Wigger, A. (2011) ‘Protection of Civilian Populations in Conflicts and Other Situations of Violence: The Challenges of Using ICTs’ in Stauffacher, D., Weekes, B., Gasser, U., Maclay, C., and Best, M. (ed.) Peacebuilding in the Information Age: Sifting hype from reality, ICT4Peace Foundation.
59 Voix des Kivus Leaflet. Use cell phones to obtain high-quality, verifiable, and real-time information about events that take place in hard-to-reach areas. Available from http://cu-csds.org/wp-content/uploads/2009/10/Voix-des-Kivus-Leaflet.pdf.
60 Van der Windt, P. International Conference on Crisismapping 2009. Available from http://crisismappers.net/video/iccm-2009-voix-des-kivus.
61 Van der Windt, P. and Macartan, H. (2012). Voix des Kivus: Reflections on a Crowdseeding Approach to Conflict Event Data Gathering.Available from http://cu-csds.org/wp-content/uploads/2012/07/Voix-des-Kivus-UBC.pdf.
62 The Economist. Press 1 for modernity. Available from http://www.economist.com/node/21553510 .
63 Telecompaper. Kenya mobile money transfers hit KES 1.2 trillion in 2011. Available from http://www.telecompaper.com/news/kenya-mobile-money-transfers-hit-kes-12-trillion-in-2011--858478.
64 UN Global Pulse. Big Data for Development. Available from http://www.unglobalpulse.org/sites/default/files/BigDataforDevelopment-UNGlobalPulseJune2012.pdf.
65 The Economist. The bank of SMS. Available from http://www.economist.com/blogs/graphicdetail/2012/04/daily-chart-12.
66 ALNAP INNOVATIONS. “Cash Transfers through Mobile Phones: An Innovative Emergency Response in Kenya.” August 2009.
67 CALP. New Technologies in Cash Transfer Programming and Humanitarian Assistance. Available from http://www.cashlearning.org/downloads/resources/calp/CaLP_New_Technologies.pdf.
68 UN Global Pulse. Big Data for Development. Available from http://www.unglobalpulse.org/sites/default/files/BigDataforDevelopment-UNGlobalPulseJune2012.pdf.
69 See http://www.cashlearning.org/.
70 Bott, M., Gigler, B. and Young, G. (2010). The Role of Crowdsourcing for Better Governance in Fragile State Contexts, KfW Entwicklungsbank, Open Development Technology Alliance.
71 Ibid.
72 ITU. Measuring the Information Society. Available from http://www.itu.int/net/pressoffice/backgrounders/general/pdf/5.pdf.
73 World Economic Forum. The Global IT Report 2012. Available from http://www3.weforum.org/docs/Global_IT_Report_2012.pdf.
74 World Bank. Media (R)evolutions: Global Internet Use. Available from blogs.worldbank.org/publicsphere/media-revolutions-global-internet-use.
75 Humanitarian Practice Network. Local perspectives of the Haiti earthquake response. Available from http://www.odihpn.org/humanitarian-exchange-magazine/issue-52/local-perspectives-of-the-haiti-earthquake-response.
76 See http://www.freedomhouse.org/sites/default/files/resources/FOTN%202012%20-%20Full%20Report.pdf.
77 New York Times. Egypt Cuts Off Most Internet and Cell. Available from www.nytimes.com/2011/01/29/technology/internet/29cutoff.html?_r=0.
78 See http://www.freedomhouse.org/sites/default/files/resources/FOTN%202012%20-%20Full%20Report.pdf.
79 Castells, M. (2003). The Internet galaxy: Reflections on the Internet, business, and society, p. 171 Oxford [u.a]: Oxford Univ. Pr.
80 Helbing, D., and Balietti, S. (2011). From Social Data Mining to Forecasting Socio-Economic Crises. European Physical Journal Special Topics, 195, pp. 3-68. Available from http://arxiv.org/pdf/1012.0178v5.pdf.
81 Manyika, J., Chui, M., Brown, B., Bughin, J., Dobbs, R., Roxburgh, R. and Hung Byers, A. (2011). Big data: The next frontier for innovation, competition, and productivity. McKinsey Global Institute, p. vi. Available from http://www.mckinsey.com/insights/mgi/research/technology_and_innovation/big_data_the_next_frontier_for_innovation.
82 Gujer, E. (2011) ‘Intelligence of the Masses or Stupidity of the Herd?’, in Stauffacher, D., Weekes, B., Gasser, U., Maclay, C., and Best, M. (ed.) Peacebuilding in the Information Age: Sifting hype from reality, ICT4Peace Foundation.
83 Harvard Humanitarian Initiative (HHI) (2011). Disaster Relief 2.0: The Future of Information Sharing in Humanitarian Emergencies. Washington, D.C. and Berkshire, UK: UN Foundation and Vodafone Foundation Technology Partnership. Available from http://www.unfoundation.org/assets/pdf/disaster-relief-20-report.pdf.
84 American Red Cross. More Americans Using Mobile Apps in Emergencies. Available from http://www.redcross.org/news/press-release/More-Americans-Using-Mobile-Apps-in-Emergencies.
85 Electronic Frontier Foundation. Pro-Syrian Government Hackers Target Activists With Fake Anti-Hacking Tool. Available from https://www.eff.org/deeplinks/2012/08/syrian-malware-post.
86 Beckhusen, R. Sudan’s Dictator Wants Satellites to Stop Spying on His Crimes. Available from http://www.wired.com/dangerroom/2012/09/sudan-satellites/.
87 Raymond, N., Howarth, C. and Hutson, J.Crisis Mapping Needs an Ethical Compass. Available from http://globalbrief.ca/blog/2012/02/06/crisis-mapping-needs-an-ethical-compass/.
88 Raymond, N., Howarth, C. and Hutson, J.Crisis Mapping Needs an Ethical Compass. Available from http://globalbrief.ca/blog/2012/02/06/crisis-mapping-needs-an-ethical-compass/.
89 All Africa. Sudan: The Man On the Inside. Available

66
from http://allafrica.com/stories/201110050782.html.
90 Harvard Humanitarian Initiative (HHI) (2011). Disaster Relief 2.0: The Future of Information Sharing in Humanitarian Emergencies. Washington, D.C. and Berkshire, UK: UN Foundation and Vodafone Foundation Technology Partnership. Available from http://www.unfoundation.org/assets/pdf/disaster-relief-20-report.pdf.
91 The Nieman Foundation. A New Age for Truth. Available from http://nieman.harvard.edu/reportsitem.aspx?id=102762.
92 Tall, A., Mason, S., van Aalst, M., Suarez, P., Ait-Chellouche, Y., Diallo, A. and Braman, L (2012). Using Seasonal Climate Forecasts to Guide Disaster Management: The Red Cross Experience During the 2008 West African Floods, p.6.
93 Tall, A., Mason, S., van Aalst, M., Suarez, P., Ait-Chellouche, Y., Diallo, A. and Braman, L (2012). Using Seasonal Climate Forecasts to Guide Disaster Management: The Red Cross Experience During the 2008 West African Floods, p. 5.
94 Tall, A., Mason, S., van Aalst, M., Suarez, P., Ait-Chellouche, Y., Diallo, A. and Braman, L (2012). Using Seasonal Climate Forecasts to Guide Disaster Management: The Red Cross Experience During the 2008 West African Floods, p. 5.
95 Tall, A., Mason, S., van Aalst, M., Suarez, P., Ait-Chellouche, Y., Diallo, A. and Braman, L (2012). Using Seasonal Climate Forecasts to Guide Disaster Management: The Red Cross Experience During the 2008 West African Floods, p. 7.
96 New York Times. In Nuclear Crisis, Crippling Mistrust. Available from http://www.nytimes.com/2011/06/13/world/asia/13japan.html?pagewanted=all&_moc.semityn.www.
97 See http://tech.fortune.cnn.com/2012/04/20/fukushima-daiichi/. According to the final report of the Investigation Committee on the Accident at the Fukushima Nuclear Power Station, the TEPCO President had not clearly stated that essential personnel for plant control would remain at the NPS. Therefore, the cabinet was under the impression that the TEPCO President was calling for a complete evacuation of all personnel from the plant. See the final report of the Investigation Committee on the Accident at the Fukushima Nuclear Power Stations, English version, pp. 230-237 found at http://icanps.go.jp/eng/04IIIfinal.pdf.
98 See http://tech.fortune.cnn.com/2012/04/20/fukushima-daiichi/. According to the final report of the Investigation Committee on the Accident at the Fukushima Nuclear Power Station, the TEPCO President had not clearly stated that essential personnel for plant control would remain at the NPS. Therefore the cabinet was under the impression that the TEPCO President was calling for a complete evacuation of all personnel from the plant. See the final report of the Investigation Committee on the Accident at the Fukushima Nuclear Power Stations, English version, pp. 230-237 found at http://icanps.go.jp/eng/04IIIfinal.pdf.
99 CNNMoney. Fukushima Daiichi: Inside the debacle. Available from http://tech.fortune.cnn.com/2012/04/20/fukushima-daiichi/.
100 For basic information, please see http://high-reliability.org/pages/hro-models.
101 De Ville de Goyet, Claude, Lezlie Morinière, Peter Ngoma, Ginna Rakotoarimanana, and Paulo Sithoe (with Helio Moises). 20 Dec 2011. “Evaluation of DG ECHO’s disaster preparedness and DRR actions in Southern Africa & Indian Ocean. Final Report.” European Commission Directorate General for Humanitarian Aid and Civil Protection. See also, Morinière, Lezlie. 2012. “Global Guide: Community Early Warning Systems (CEWS).” International Federation of the Red Cross.
102 BBC Media Action. Still left in the dark? Available from downloads.bbc.co.uk/mediaaction/policybriefing/bbc_media_action_still_left_in_the_dark_policy_briefing.pdf.
103 Ann Kite Yo Pale (Let Them Speak) – best practice and lessons learned in communication with affected communities, Haiti 2010. Chery, Y-G and Wall, I for infoasaid. infoasaid.org/research/ann-kite-yo-pale-best-practice-and-lessons-learned-communication-disaster-affected-communit.
104 PHILIPPINES: Storms test early warning system, IRIN. Available from http://www.irinnews.org/printreport.aspx?reportid=96042.
105 Internews. Humanitarian Innovations Fund Large Grants. Integrating Local Media and ICTs into Humanitarian Response in CAR. Available from http://www.humanitarianinnovation.org/projects/large-grants/internews.
106 This is referred to as “bounded crowdsourcing”.
107 Internews Blog. This is How the Crisis Map Car Works. Available from http://www.humanitarianinnovation.org/blog/internews/how-our-map-works.
108 Internews. Crisis Map of the Central African Republic. Available from https://www.cartehumanitaire-rca.org/.
109 Lacucci, Anahi Ayala. Integrating Local Media and ICTs into Humanitarian Response in Central African Republic. Available from http://www.cdacnetwork.org/public/resource/internews-integrating-local-media-and-icts-humanitarian-response-central-african-republic/.
110 New York Times. Africa’s Gift to Silicon Valley: How to Track a Crisis. Available from http://www.nytimes.com/2010/03/14/weekinreview/14giridharadas.html.
111 Forbes. How Social Media is shaping disaster response. Available from http://www.forbes.com/sites/dell/2012/03/07/how-social-media-is-shaping-disaster-response/.
112 Dell. Dell and the American Red Cross Launch Digital Operations Center. Available from http://content.dell.com/us/en/corp/d/corp-comm/red-cross-digital-operations.
113 Dell. The American Red Cross and Dell collaborate on first-ever digital operations centre focused on humanitarian efforts. Available from i.dell.com/sites/doccontent/corporate/case-studies/en/Documents/2012-red-cross-10011336.pdf.
114 Standard Digital. Twitter rescue: Red Cross iVolunteer saves lives. Available from http://www.standardmedia.co.ke/?articleID=2000058407.

wORLD HUmANITARIAN DATA AND TRENDS 2012

Introduction World Humanitarian Data and Trends presents global and country-level data and trend analysis relevant to humanitarian assistance. Its purpose is to bring this information together in one place and present it in an accessible way. It is intended to establish a common baseline of humanitarian data that can be built on in future years and allow for comparisons across time. This data can be used to help support humanitarian policy decisions and provide country-level context that can support operational decision-making.
The information presented covers three main areas: 1) humanitarian needs in 2011; 2) humanitarian response in 2011; 3) humanitarian trends. It is intended to provide as comprehensive a picture as possible of global humanitarian needs and response and to highlight major, indicative trends in the nature of humanitarian crises, their drivers and the actors that participate in crisis prevention, response and recovery.
There are many gaps in the information available. These arise from the inherent complexity of humanitarian crises and the chaotic environment in which humanitarian assistance is provided. Even what constitute humanitarian needs and assistance are flexible concepts that vary from place to place. There are also inherent biases in the information available. For example, humanitarian assistance provided by communities and by local and national governments is less likely to be reported or comparable. Funding data is more likely to be reported than other types of information. Therefore, information collected by international organizations and information on funding is over-represented in this report. There are also limitations on the availability and quality of data, including insufficient sharing of data by humanitarian organizations and other actors, as well as problems concerning common data standards and protocols. Further information on limitations is provided in the User’s guide (page 106).
The data presented comes from a variety of source organizations with the mandate, resources and expertise to collect and compile relevant data, as well as processes and tools facilitated or managed by OCHA, such as the inter-agency appeal process and the Financial Tracking Service (FTS). Further information on data sources is provided in the User’s guide.
Interpreting the visuals and dataA number of different visual representations of humanitarian data and trends are used in this report. There is also some limited narrative text, which is intended to provide basic orientation to the reader and guide individual interpretation. The User’s guide contains more detailed methodological information and any specific technical notes for each figure. A reference table showing selected humanitarian indicators by country is provided on pages 100-105. Together, these indicators are intended to provide a minimum set of country-level information on humanitarian needs and response, as well as the country-level context for humanitarian assistance.
A number of country groupings are used in this report. Selected humanitarian indicators are presented for a group of 79 ‘Focus Countries’. Countries meeting at least one of the following criteria since 2005 are included in this group: 1) inter-agency appeal issued; 2) cluster approach implemented; 3) OCHA presence. See the User’s guide for further information.
The most recent year for which complete data is available at the time of publication is 2011. For the latest information on needs and funding requirements for current inter-agency appeals see www.unocha.org/cap/ or fts.unocha.org/.
Accessing the dataThe data presented in this report is available for download at http://www.unocha.org/about-us/publications/policy-studies.
68
ContentsHumanitarian needs in 2011 70Figure 1 Humanitarian needs in 2011 70Figure 2 Key indicators for countries with Consolidated Appeals and 71 similar concerted humanitarian action plans in 2011 Humanitarian response in 2011 72Figure 3 Humanitarian response in 2011 73Figure 4 Distribution of total humanitarian aid by country 2011 74Figure 5 Humanitarian funding within and outside inter-agency appeals in 2011 75Figure 6 Proportion of funding requirements met in inter-agency appeals in 2011 76Figure 7 Proportion of funding requirements met in inter-agency appeals by sector in 2011 77Figure 8 Quantifying humanitarian response 78Trends – appeals 80Figure 9 Funding requirements of selected Consolidated Appeals 2005-2012 80Trends – disasters 82Figure 10 Total number of natural disasters reported and number of people affected by region 1990-2011 82Figure 11 Total number of people killed by disaster type 1990-2011 83Figure 12 Total number of people affected by disaster type 1990-2011 83Trends – conflict and refugees 84Figure 13 Number of active conflicts 1990-2011 84Figure 14 Number of active conflicts by region 1990-2011 84Figure 15 Population of concern to UNHCR by category 2011 85Figure 16 Population of concern to UNHCR by region 2000-2011 85Trends – drivers of vulnerability 86Figure 17 Global food and energy price indices 1990-2011 86Figure 18 Number of undernourished people by region 1991-2011 86Figure 19 Proportion of population using improved drinking water sources 1990-2010 87Figure 20 Proportion of population living below US$1.25 per day 1990-2025 87Figure 21 Number of people living below US$1.25 per day by region 2005-2015 88Figure 22 Number of people living below US$2 per day in fragile and non-fragile states 1990-2025 88Figure 23 Population growth by region 1990-2025 89Figure 24 Global population growth by economic and geographic context 1990-2020 89Trends – funding 90Figure 25 Humanitarian funding flows in 2011 90Figure 26 Amount of funding requested and received in inter-agency appeals 2000-2011 91Figure 27 Proportion of funding requirements met in inter-agency appeals 2000-2011 91Figure 28 Progression of funding of inter-agency appeals for selected crises 92Figure 29 Concentration of humanitarian aid among recipient countries 2001-2010 92Figure 30 Humanitarian aid financing from government donors 2001-2011 93Figure 31 Humanitarian aid financing from governments outside of OECD DAC 2000-2011 93Figure 32 Reported private voluntary humanitarian aid financing by first level recipient 2006-2011 94Figure 33 Reported private voluntary humanitarian aid financing by source 2006-2010 94Figure 34 Reported funding for humanitarian response channelled via foreign military actors 2007-2011 95Figure 35 Global remittance inflows by income group 1990-2011 96Trends – prevention 97Figure 36 Proportion of global Official Development Assistance spent 97 on disaster preparedness and risk reduction 2006-2010 Figure 37 Global Official Development Assistance investments in food aid, 98 agriculture and basic nutrition 2002-2010 Figure 38 Global Official Development Assistance investments in state- and peacebuilding 2002-2010 98Selected humanitarian indicators 100User’s guide 106
69
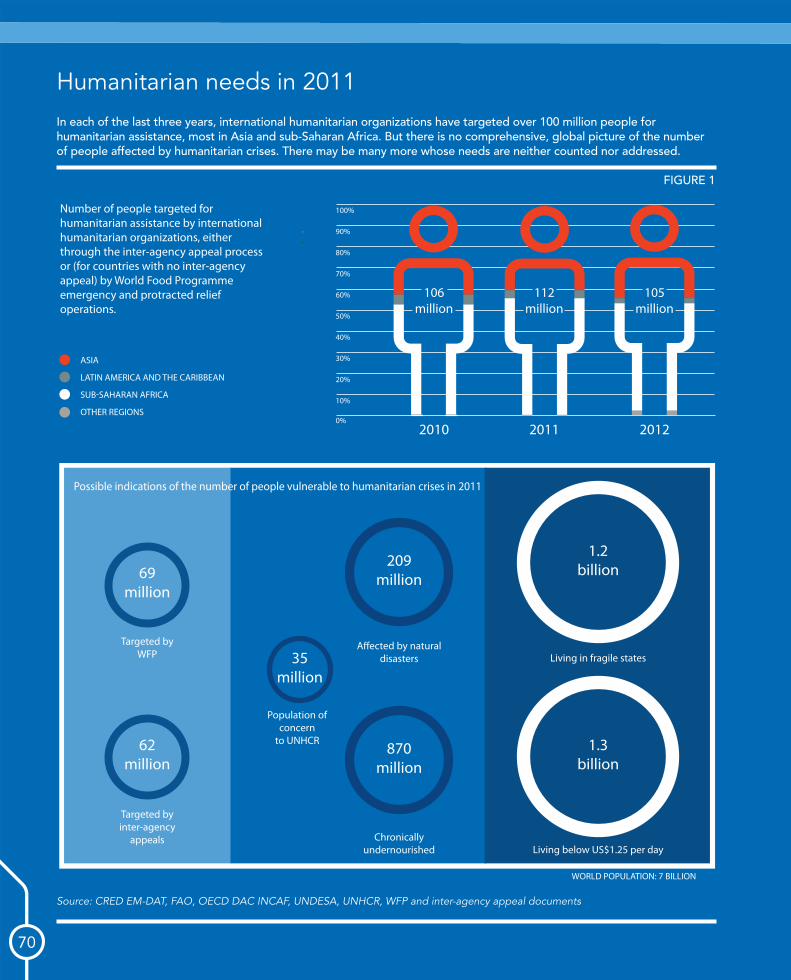
Number of people targeted for humanitarian assistance by international humanitarian organizations, either through the inter-agency appeal process or (for countries with no inter-agency appeal) by World Food Programme emergency and protracted relief operations.
ASIA
LATIN AMERICA AND THE CARIBBEAN
SUB-SAHARAN AFRICA
OTHER REGIONS
2010 2011 2012
100%
90%
80%
60%
70%
50%
40%
30%
20%
10%
0%
A�ected by natural disasters
Targeted by WFP
Targeted by inter-agency
appeals
Population of concern
to UNHCR
Chronically undernourished
Living in fragile states
Living below US$1.25 per day
Possible indications of the number of people vulnerable to humanitarian crises in 2011
WORLD POPULATION: 7 BILLION
106 million
112 million
105 million
209million
35million
69million
62million
870million
1.2billion
1.3billion
70
Humanitarian needs in 2011
Source: CRED EM-DAT, FAO, OECD DAC INCAF, UNDESA, UNHCR, WFP and inter-agency appeal documents
FIGURE 1
In each of the last three years, international humanitarian organizations have targeted over 100 million people for humanitarian assistance, most in Asia and sub-Saharan Africa. But there is no comprehensive, global picture of the number of people affected by humanitarian crises. There may be many more whose needs are neither counted nor addressed.

Number of people targeted for humanitarian assistance by international humanitarian organizations, either through the inter-agency appeal process or (for countries with no inter-agency appeal) by World Food Programme emergency and protracted relief operations.
ASIA
LATIN AMERICA AND THE CARIBBEAN
SUB-SAHARAN AFRICA
OTHER REGIONS
2010 2011 2012
100%
90%
80%
60%
70%
50%
40%
30%
20%
10%
0%
A�ected by natural disasters
Targeted by WFP
Targeted by inter-agency
appeals
Population of concern
to UNHCR
Chronically undernourished
Living in fragile states
Living below US$1.25 per day
Possible indications of the number of people vulnerable to humanitarian crises in 2011
WORLD POPULATION: 7 BILLION
106 million
112 million
105 million
209million
35million
69million
62million
870million
1.2billion
1.3billion
71
The number of people targeted for humanitarian assistance in inter-agency appeals provides one measurement of humanitarian needs. Current or recent conflict and high levels of absolute poverty and child malnutrition are common features of countries that had Consolidated Appeals or similar concerted action plans in 2011.
4.1
1.6
3.9
7.5
0.1
3.0 3.64.3
2.53.2 3.3
11.5
2.5
9.0
Country
Afg
hani
stan
Cen
tral
Afr
ican
Re
pub
lic
Cha
d
Dem
ocra
tic R
epub
lic
of t
he C
ong
o
Djib
outi
Hai
ti
Ken
ya
Nig
er
occu
pie
d P
ales
tinia
n te
rrito
ry
Som
alia
Sout
h Su
dan
Sud
an
Yem
en
Zim
bab
we
Number of people affected by natural disasters (thousands) 20
11
EM-D
AT
1,753 4.9 18.1 34.8 0 6.93 4,396 3,015 - 2.8 - - - 1.1
Proportion of the population affected annually by natural disasters (10 yr average %)
2002
-20
11
EM-D
AT
1.5 0.1 2.4 0.1 9.2 4.8 3.7 8.9 0.0 8.6 - 1.3 0.0 3.1
Number of last 10 years experiencing active conflict 20
02-
2011
UC
DP
10 6 7 10 1 2 7 2 10 10 10 10 3 1
Total population of concern to UNHCR (millions) 20
11
UN
HC
R
1.5 0.2 0.5 2.7 0.0 0.0 0.9 0.0 -* 1.4 0.7 2.9 0.6 0.1
Malnutrition prevalence, weight for age (% of children under 5)
Late
st y
ear
2000
-201
0
WH
O
32.9 - 33.9 28.2 29.6 18.9 16.4 39.9 2.2 32.8 - 31.7 43.1 14.0
Number of people living below US$1.25 per day (millions) La
test
ye
ar
Wor
ld
Ban
k
- 2.8 7.0 57.9 0.2 6.2 17.6 6.8 0.002 - - 8.6 4.2 -
Humanitarian aid per crisis-affected person targeted in inter-agency appeal (US$)
2011
OC
HA
FT
S
221 52 97 73 350 165 180 41 176 419 144 77 117 26
Number of people targeted for humanitarian assistance in inter-agency appeal (millions)
Inte
r-ag
ency
ap
pea
l doc
umen
ts
2011
Source: CRED EM-DAT, UCDP, UNHCR, UN OCHA FTS, World Bank, WHO and inter-agency appeal documents. Note: The Consolidated Appeal for West Africa is not included. * See technical notes.
Key indicators for countries with Consolidated Appeals and similar concerted humanitarian action plans in 2011Figure 2
Humanitarian needs in 2011

Domestic governments
Domestic civil society
and private sector
PROTECTION
MATERIAL ASSISTANCE
INFORMATION COORDINATION COMMUNICATIONS LOGISTICS
PREVENTION PREPAREDNESS RECOVERY
A�ectedcommunities and diaspora
International humanitarian
aid
Government donors
US$12.5 billion
US$17.1 billion
in 2011 in international humanitarian aid
Private donors
US$4.6 billion
Humanitarian response in 2011
72
Humanitarian response is the sum of actions by communities, civil society, the private sector and governments. Sometimes, it also involves international humanitarian aid and actors. It can include material assistance (e.g. food, water, shelter, health), as well as efforts to protect people’s welfare and rights and to promote crisis prevention and recovery.

Domestic governments
Domestic civil society
and private sector
PROTECTION
MATERIAL ASSISTANCE
INFORMATION COORDINATION COMMUNICATIONS LOGISTICS
PREVENTION PREPAREDNESS RECOVERY
A�ectedcommunities and diaspora
International humanitarian
aid
Government donors
US$12.5 billion
US$17.1 billion
in 2011 in international humanitarian aid
Private donors
US$4.6 billion
FIGURE 3
73
Humanitarian response in 2011
Source: Based on OECD DAC and UN OCHA FTS
The contributions of different actors to humanitarian response are difficult to quantify. International humanitarian aid, which includes financial contributions from governments and private donors, is much more likely to be consistently reported than assistance from national and local sources. International humanitarian aid was US$17.1 billion in 2011.

Humanitarian response in 2011
74
Distribution of total humanitarian aid by country 2011Figure 4
Somalia
Afghanistan
8%
Sudan 8%
Ethiopia
8%
Japan
7%
Kenya
6%
Democratic Republic of the Congo
Haiti
5% Pakistan
4% South Sudan
4%
119 other recipient countries
33%
12%
5%
Source: UN OCHA FTS
International humanitarian aid is concentrated in just a few countries. Two thirds of humanitarian aid provided by official and private international donors in 2011 went to 10 countries. However, communities and local and national governments in the affected country are often the main providers of humanitarian assistance.
Humanitarian response in 2011

75
FUNDING PER PERSON WITHIN INTER-AGENCY APPEAL
TOTAL FUNDING PER PERSON
Afghanistan 103 221
Haiti 70 165
Kenya 148 180
Libya Regional Crisis 168 311
El Salvador 20 49
Democratic Republic of the Congo 65 73
Djibouti 161 350
Central African Republic 41 52
Chad 81 97
271 419 Somalia
66 77 Sudan
21 130 Sri Lanka
78 117 Yemen
24 26 Zimbabwe
27 41 Niger
29 89 Pakistan
122 176 occupied Palestinian territory
114 144 South Sudan
13 23 Namibia
33 56 Nicaragua
Humanitarian funding within and outside inter-agency appeals in 2011Figure 5
Source: UN OCHA FTS and inter-agency appeal documents. Note: Total humanitarian funding figures are based on funds reported within a calendar year.
Humanitarian response in 2011
Funding per affected person varies considerably between crises. This may be due to differences in international profile, domestic response capacity and response cost. There is also wide variation in how much funding flows through appeals. Approximately US$5.7 billion (or 33%) of international humanitarian aid flowed through inter-agency appeals in 2011.

76
Proportion of funding requirements met in inter-agency appeals in 2011
10-YEAR AVERAGE
PROPORTION OF FUNDING REQUIREMENTS MET
AVERAGE 2011
Kenya
Afg
hani
stan
Cen
tral
Afri
can
Repu
blic
Chad
Democratic
Republic
of the C
ongo
Djibouti
El Salvador Flash Appeal
Haiti
Namibia Flash Appeal
Nicaragua Flash A
ppeal
Niger
occu
pied
Pal
estin
ian
terr
itory
Paki
stan
Regi
onal
Flash
App
eal
for t
he Li
byan
Cris
is
South Sudan
Somalia
Sri Lanka FloodsFlash Appeal
Sudan
West Africa
Yemen
Zimbabw
e
10%
20%
30%
40%
50%
60%
70%
80%
90%
Source: UN OCHA FTS
Figure 6
Humanitarian response in 2011
Funding of inter-agency appeals in 2011 was below the 10 year average. High profile emergencies, such as Somalia and Libya, were well-funded. Appeals for countries in the Sahel region received below-average funding. The humanitarian situation in the region deteriorated through 2011 and into 2012.

77
Proportion of funding requirements met in inter-agency appeals by sector in 2011
Agr
icul
ture
Coor
dina
tion
and
Supp
ort S
ervi
ces
Economic Recovery
and Infrastructure
Education
Food
Health Mine A
ction
Mul
ti-se
ctor
Protection/Human Rights/
Rule of Law
Safety and Security of Sta�and Operations
Shelter and Non-food Items
Water and Sanitation
20%
40%
60%
80%
100%
10-YEAR AVERAGE
PROPORTION OF FUNDING REQUIREMENTS MET 2011
Agr
icul
ture
Coor
dina
tion
and
Supp
ort S
ervi
ces
Economic Recovery
and Infrastructure
Education
Food
Health Mine A
ction
Mul
ti-se
ctor
Protection/Human Rights/
Rule of Law
Safety and Security of Sta�and Operations
Shelter and Non-food Items
Water and Sanitation
20%
40%
60%
80%
100%
10-YEAR AVERAGE
PROPORTION OF FUNDING REQUIREMENTS MET 2011 Source: UN OCHA FTS
Figure 7
Humanitarian response in 2011
As in previous years, food was the best-funded sector against requirements in inter-agency appeals in 2011. In comparison to the 10-year average, safety and security of staff operations was also well-funded. This may reflect recognition by donors of the increased violence faced by aid workers in recent years.

870
MIL
LIO
N69 M
ILLION
WFP delivered 3.6 million metric tons of food assistance to 99.1 million people in 75 countries in 2011
MSF provided 8.4 million outpatient consultations in 2011 and vaccinated 5 million people for measles in response to an outbreak
UNICEF responded to 292 humanitarian situations in 80 countries in 2011
UNHCR deployed 620 sta� members and standby partner sta� to emergency operations in over 40 countries in 2011
Oxfam GB reached 15 million people in 55 countries in 2011/12 including providing information about disaster preparedness and climate change to 1 million people and access to clean water and health promotion to 5.7 million people
In 2011, more than 20,800 weapon-wounded and 114,600 non-weapon wounded (surgical) patients were admitted to ICRC-supported hospitals in 30 countries. ICRC provided more than 4.9 million people with food aid and 3.1 million people with essential household and hygiene items
62 MILLION
209 MILLION35 MILLION
The following are a sample of response outputs captured in the annual reports of various humanitarian organizations. These demonstrate the diversity in how di�erent organizations measure and report their activities and results. They are shown here against some di�erent examples of assessments currently used to quantify humanitarian needs and coverage of services.
NUM
BER O
F PEOPLE TARGETED FOR
ASSI
STANCE I
N INTER-AGENCY APPEALS
Humanitarian response is often measured financially, rather than in terms of outputs delivered. The outcomes for affected people are not measured consistently and the longer term impact of assistance is understood even less. This is partly due to the difficulty of issues of causality and attribution and the short duration of relief operations.
78
FIGURE 8
Source: CRED EM-DAT, FAO, ICRC, MSF, Oxfam GB, UNICEF, WFP, UNHCR, World Bank and inter-agency appeal documents
Quantifying humanitarian response

870
MIL
LIO
N
69 MILLIO
N
WFP delivered 3.6 million metric tons of food assistance to 99.1 million people in 75 countries in 2011
MSF provided 8.4 million outpatient consultations in 2011 and vaccinated 5 million people for measles in response to an outbreak
UNICEF responded to 292 humanitarian situations in 80 countries in 2011
UNHCR deployed 620 sta� members and standby partner sta� to emergency operations in over 40 countries in 2011
Oxfam GB reached 15 million people in 55 countries in 2011/12 including providing information about disaster preparedness and climate change to 1 million people and access to clean water and health promotion to 5.7 million people
In 2011, more than 20,800 weapon-wounded and 114,600 non-weapon wounded (surgical) patients were admitted to ICRC-supported hospitals in 30 countries. ICRC provided more than 4.9 million people with food aid and 3.1 million people with essential household and hygiene items
62 MILLION
209 MILLION
35 MILLION
The following are a sample of response outputs captured in the annual reports of various humanitarian organizations. These demonstrate the diversity in how di�erent organizations measure and report their activities and results. They are shown here against some di�erent examples of assessments currently used to quantify humanitarian needs and coverage of services.
NUM
BER O
F PEOPLE TARGETED FOR
ASSI
STANCE I
N INTER-AGENCY APPEALS
79
HUmANITARIAN TRENDS

80
Zim
babw
e
Yem
en
Wes
t Afr
ica
Uga
nda
Suda
n
Som
alia
Repu
blic
of C
ongo
Paki
stan
occu
pied
Pal
estin
ian
terr
itory
Libe
ria*
Keny
a
Hai
ti
Djib
outi
Dem
ocra
tic R
epub
lic o
f the
Con
go
Côte
d'Iv
oire
*
Chad
Cent
ral A
fric
an R
epub
lic
Afg
hani
stan
2005
20
06
2007
20
08
2009
20
10
2011
20
12
38 193
44 696
89 145
395
27 352
1,59
5
263
246
426
91 277
55 687
110
19 426
43 384
22
1,36
8
392
361
396
150
775
544
828
1,50
2
59604
1,96
3
603
596
1,84
3
184
775
186
478
119
318
58 737
44121
208
452
663
2,00
5
374
459 5 583
100
665
401
37 946
581
680
805
852
2,11
1
247
404
23 722
205
189
1,91
0
163
243017220
36227
2814
2
582
535
33722
382
742
357
537
1,00
3
1,13
3
712
292
479
124
448
572
161
79791
128
795
98 415
1,16
5
1,05
2
585
238
Fund
ing
req
uire
men
ts o
f se
lect
ed C
ons
olid
ated
Ap
pea
ls 2
005-
2012
(US$
mill
ion)
Fig
ure
9
Trends – appealsTrends in humanitarian needs at the global level are very difficult to measure. The presence and size of appeals can give some indication. This chart shows the funding requirements of the most frequent inter-agency appeals since 2005. It shows the protracted and recurrent nature of most humanitarian crises.

81
Zim
babw
e
Yem
en
Wes
t Afr
ica
Uga
nda
Suda
n
Som
alia
Repu
blic
of C
ongo
Paki
stan
occu
pied
Pal
estin
ian
terr
itory
Libe
ria*
Keny
a
Hai
ti
Djib
outi
Dem
ocra
tic R
epub
lic o
f the
Con
go
Côte
d'Iv
oire
*
Chad
Cent
ral A
fric
an R
epub
lic
Afg
hani
stan
2005
20
06
2007
20
08
2009
20
10
2011
20
12
38 193
44 696
89 145
395
27 352
1,59
5
263
246
426
91 277
55 687
110
19 426
43 384
22
1,36
8
392
361
396
150
775
544
828
1,50
2
59604
1,96
3
603
596
1,84
3
184
775
186
478
119
318
58 737
44121
208
452
663
2,00
5
374
459 5 583
100
665
401
37 946
581
680
805
852
2,11
1
247
404
23 722
205
189
1,91
0
163
243017220
36227
2814
2
582
535
33722
382
742
357
537
1,00
3
1,13
3
712
292
479
124
448
572
161
79791
128
795
98 415
1,16
5
1,05
2
585
238
Sour
ce: U
N O
CH
A F
TS .
* Se
e te
chni
cal n
otes
.
Trends – appeals
Six crises have had appeals in every year since 2005. Few crises show consistent signs of improvement by this measure. Increased attention to recovery, prevention and working to address the root causes of crises can help offer more sustainable solutions.

82
1999
2000
2001
2002
2003
2004
2005
2006
2007
2008
2009
2010
2011
1990
1991
1992
1993
1994
1995
1996
1997
1998
82
279
64
171
265
217 213
67
314
275
172
106
659
252
157 154 120
211 218 199
254
209
0
100
200
300
400
500
600
700
0
100
200
300
400
500
600
700
Tota
l num
ber o
f nat
ural
dis
ater
s re
port
ed
Peop
le a
�ect
ed (m
illio
ns)
ASIA
EUROPE
LATIN AMERICA AND THE CARIBBEAN
NORTH AMERICA
NORTHERN AFRICA
OCEANIA
SUB-SAHARAN AFRICA
TOTAL NUMBER OF NATURAL DISATERS REPORTED
Total number of natural disasters reported and number of people affected by region 1990-2011Figure 10
Source: Based on CRED EM-DAT
Trends – disastersThe number of reported disasters has increased significantly in recent years. Although some of this increase may be attributable to better reporting, the increasing exposure of people and property to natural hazards is playing a major role. The vast majority of people affected by disasters live in Asia.

83
Source: Based on CRED EM-DAT
Earthquake
Storm
Storm
Flood Flood
Epidemic
Extreme temperature
Mass movement wet 14.8Drought 4.3Wild�re 1.6Volcano 1.5Mass movement dry 1.0
158
164
164
388
805 2,649
641
Earthquake 97
Extreme temperature 95
Drought 1,141
Epidemic 20Wild�re 5 Volcano 3Mass movement wet 2 Mass movement dry 0.010Insect infestation 0.002
KILLED AFFECTED
1990-2011 Number of people killed
% of total 1990-2011 Number of people affected
% of total
Earthquake 804,893 47.3 Flood 2,649,066,012 56.9
Storm 387,986 22.8 Drought 1,140,824,275 24.5
Flood 164,099 9.6 Storm 641,363,678 13.8
Epidemic 163,936 9.6 Earthquake 96,962,020 2.1
Extreme temperature 158,007 9.3 Extreme temperature 94,855,527 2.0
Mass movement wet 14,788 0.9 Epidemic 20,004,722 0.4
Drought 4,272 0.3 Wildfire 5,447,486 0.1
Wildfire 1,639 0.1 Volcano 3,469,624 0.1
Volcano 1,537 0.1 Mass movement wet 1,928,984 0.0
Mass movement dry 992 0.1 Mass movement dry 10,300 0.0
Insect infestation 2,200 0.0
Total number of people killed by disaster type 1990-2011 (thousands)
Total number of people affected by disaster type 1990-2011 (millions)
Figure 11 Figure 12
Trends – disasters
Earthquakes kill more people than any other kind of disaster, but account for a small proportion of the total number affected by disasters. Floods, droughts and storms are responsible for the vast majority of people affected, as well as of those that subsequently require humanitarian assistance.

84
1990
1991
1992
1993
1994
1995
1996
1997
1998
ONE-SIDED NON-STATE-BASED GOVERNMENT
Num
ber o
f inc
iden
ts o
f vio
lent
con
�ict
20
0
40
60
80
100
120
1999
2000
2001
2002
2003
2004
2005
2006
2007
2008
2009
2010
2011
1990
1991
1992
1993
1994
1995
1996
1997
1998
ONE-SIDED NON-STATE-BASED GOVERNMENT
Num
ber o
f inc
iden
ts o
f vio
lent
con
�ict
20
0
40
60
80
100
120 19
99
2000
2001
2002
2003
2004
2005
2006
2007
2008
2009
2010
2011
1990
1991
1992
1993
1994
1995
1996
1997
1998
ONE-SIDED NON-STATE-BASED GOVERNMENT
Num
ber o
f inc
iden
ts o
f vio
lent
con
�ict
20
0
40
60
80
100
120
1999
2000
2001
2002
2003
2004
2005
2006
2007
2008
2009
2010
2011
1990
1991
1992
1993
1994
1995
1996
1997
1998
Num
ber o
f inc
iden
ts o
f vio
lent
con
�ict
1999
2000
2001
2002
2003
2004
2005
2006
2007
2008
2009
2010
2011
0
10
20
30
40
50
60
70
80
SUB-SAHARAN AFRICA NORTHERN AFRICAOCEANIA
ASIAEUROPE
LATIN AMERICA AND THE CARIBBEANNORTH AMERICA
1990
1991
1992
1993
1994
1995
1996
1997
1998
Num
ber o
f inc
iden
ts o
f vio
lent
con
�ict
1999
2000
2001
2002
2003
2004
2005
2006
2007
2008
2009
2010
2011
0
10
20
30
40
50
60
70
80
SUB-SAHARAN AFRICA NORTHERN AFRICAOCEANIA
ASIAEUROPE
LATIN AMERICA AND THE CARIBBEANNORTH AMERICA
Number of active conflicts by region 1990-2011
Number of active conflicts 1990-2011
Source: Based on UCDP
Source: Based on UCDP
Trends – conflict and refugees
Figure 13
Figure 14
Incidences of conflict are roughly equally divided between those involving at least one government, those between non-state armed groups, and those involving the use of force against civilians by a government or armed group. Most incidences of conflict occur in Asia and sub-Saharan Africa.
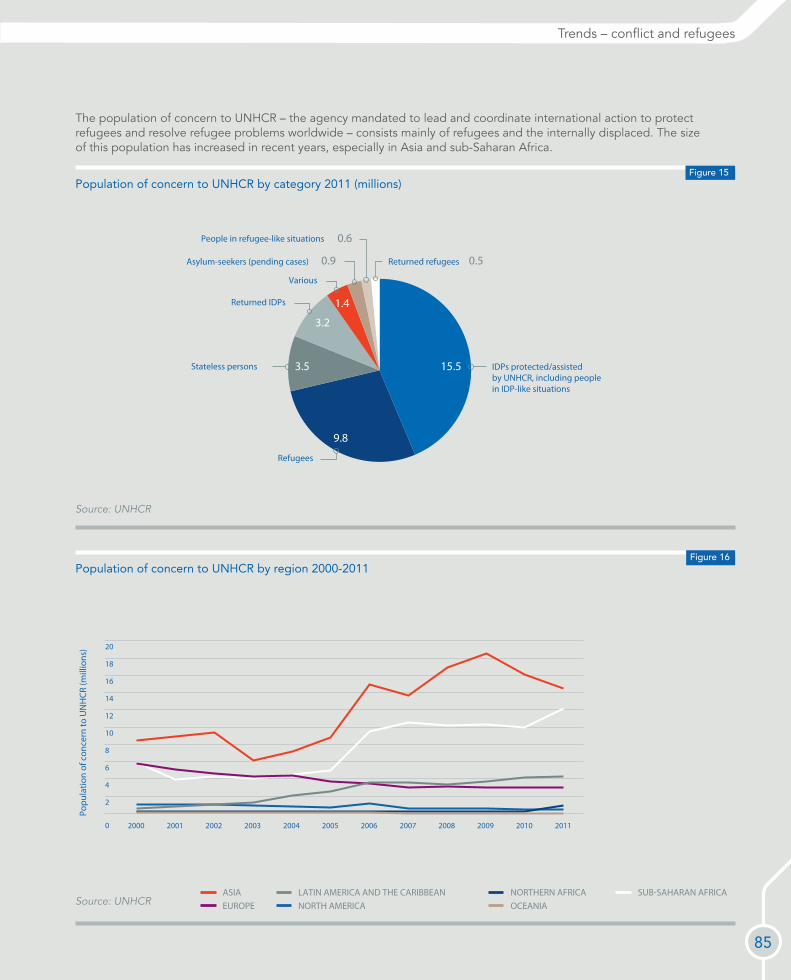
85
0
2
4
6
8
10
12
14
16
18
20
2000 2001 2002 2003 2004 2006 2007 2008 2009 2010 2011
Popu
latio
n of
con
cern
to U
NH
CR (m
illio
ns)
ASIAEUROPE
LATIN AMERICA AND THE CARIBBEANNORTH AMERICA
NORTHERN AFRICAOCEANIA
SUB-SAHARAN AFRICA
2005
0
2
4
6
8
10
12
14
16
18
20
2000 2001 2002 2003 2004 2006 2007 2008 2009 2010 2011
Popu
latio
n of
con
cern
to U
NH
CR (m
illio
ns)
ASIAEUROPE
LATIN AMERICA AND THE CARIBBEANNORTH AMERICA
NORTHERN AFRICAOCEANIA
SUB-SAHARAN AFRICA
2005
Population of concern to UNHCR by region 2000-2011
Population of concern to UNHCR by category 2011 (millions)
Figure 16
Source: UNHCR
Source: UNHCR
Figure 15
Trends – conflict and refugees
The population of concern to UNHCR – the agency mandated to lead and coordinate international action to protect refugees and resolve refugee problems worldwide – consists mainly of refugees and the internally displaced. The size of this population has increased in recent years, especially in Asia and sub-Saharan Africa.
Stateless persons
Returned IDPs
Various
Asylum-seekers (pending cases)
People in refugee-like situations
Returned refugees
9.8
Refugees
3.5 15.5
3.2
1.4
0.9
0.6
0.5
IDPs protected/assisted by UNHCR, including people in IDP-like situations

86
0
20
40
60
80
100
120
140
160
180
0
50
100
150
200
250
300
FAO
Inde
x (2
002-
2004
=100
)
Wor
ld B
ank
Indi
ces
(200
5=10
0)
1999
2000
2001
2002
2003
2004
2005
2006
2007
2008
2009
2010
2011
1990
1991
1992
1993
1994
1995
1996
1997
1998
FAO FOOD PRICE INDEXWORLD BANK ENERGY PRICE INDEX
WORLD BANK FOOD PRICE INDEX
0
20
40
60
80
100
120
140
160
180
0
50
100
150
200
250
300
FAO
Inde
x (2
002-
2004
=100
)
Wor
ld B
ank
Indi
ces
(200
5=10
0)
1999
2000
2001
2002
2003
2004
2005
2006
2007
2008
2009
2010
2011
1990
1991
1992
1993
1994
1995
1996
1997
1998
FAO FOOD PRICE INDEXWORLD BANK ENERGY PRICE INDEX
WORLD BANK FOOD PRICE INDEX
Global food and energy price indices 1990-2011Figure 17
Source: World Bank and UN FAO
1999
2000
2001
2002
2003
2004
2005
2006
2007
2008
2009
2010
2011
1991
1992
1993
1994
1995
1996
1997
1998
100
200
300
400
500
600
700
800
900
Und
erno
uris
hed
peop
le (m
illio
ns)
NORTHERN AFRICASUB-SAHARAN AFRICA
ASIALATIN AMERICA AND THE CARIBBEAN
1999
2000
2001
2002
2003
2004
2005
2006
2007
2008
2009
2010
2011
1991
1992
1993
1994
1995
1996
1997
1998
100
200
300
400
500
600
700
800
900
Und
erno
uris
hed
peop
le (m
illio
ns)
NORTHERN AFRICASUB-SAHARAN AFRICA
ASIALATIN AMERICA AND THE CARIBBEAN
Number of undernourished people by region 1991-2011
Source: UN FAO
Trends – drivers of vulnerabilityHigh and volatile food and energy prices exacerbate the food and nutrition insecurity of poor households and increase the cost of providing humanitarian assistance. While the proportion of the population that is undernourished is falling globally, the actual number of undernourished people in sub-Saharan Africa is increasing.
Figure 18
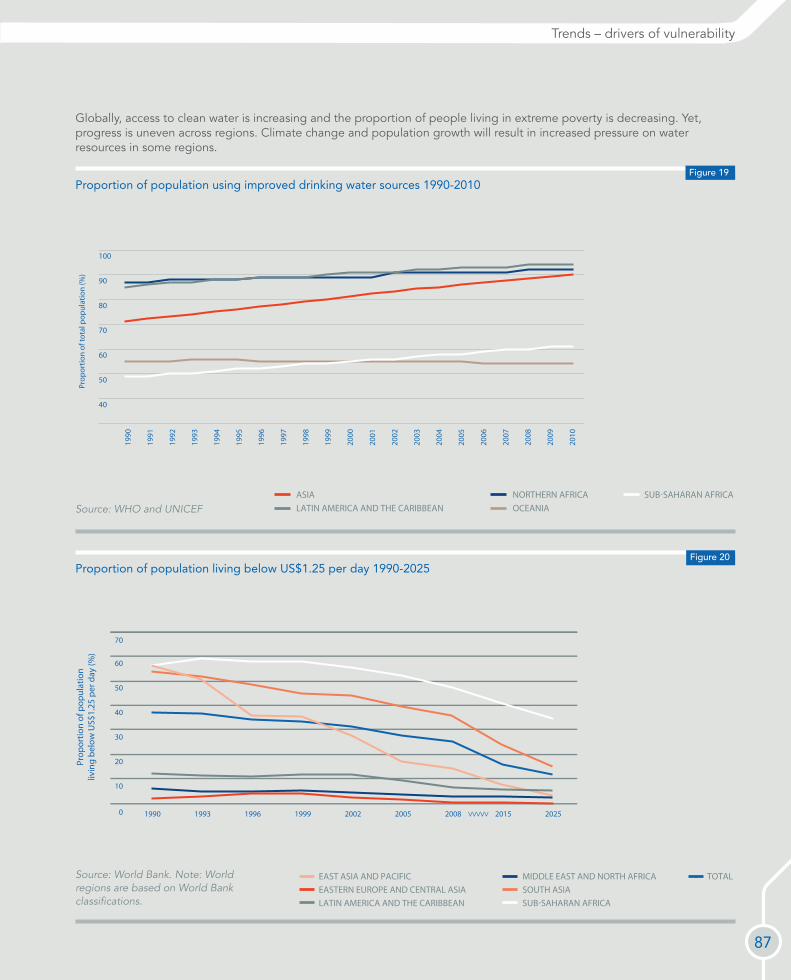
87
1999
2000
2001
2002
2003
2004
2005
2006
2007
2008
2009
2010
1990
1991
1992
1993
1994
1995
1996
1997
1998
40
50
60
70
80
90
100
Prop
ortio
n of
tota
l pop
ulat
ion
(%)
SUB-SAHARAN AFRICA NORTHERN AFRICAOCEANIA
ASIALATIN AMERICA AND THE CARIBBEAN
1999
2000
2001
2002
2003
2004
2005
2006
2007
2008
2009
2010
1990
1991
1992
1993
1994
1995
1996
1997
1998
40
50
60
70
80
90
100
Prop
ortio
n of
tota
l pop
ulat
ion
(%)
SUB-SAHARAN AFRICA NORTHERN AFRICAOCEANIA
ASIALATIN AMERICA AND THE CARIBBEAN
Proportion of population using improved drinking water sources 1990-2010Figure 19
Source: WHO and UNICEF
VVVVV0
10
20
30
40
50
60
70
1990 1993 1996 1999 2002 2005 2008 2015 2025
Prop
ortio
n of
pop
ulat
ion
livin
g be
low
US$
1.25
per
day
(%)
EAST ASIA AND PACIFICEASTERN EUROPE AND CENTRAL ASIALATIN AMERICA AND THE CARIBBEAN
MIDDLE EAST AND NORTH AFRICASOUTH ASIASUB-SAHARAN AFRICA
TOTAL
VVVVV0
10
20
30
40
50
60
70
1990 1993 1996 1999 2002 2005 2008 2015 2025
Prop
ortio
n of
pop
ulat
ion
livin
g be
low
US$
1.25
per
day
(%)
EAST ASIA AND PACIFICEASTERN EUROPE AND CENTRAL ASIALATIN AMERICA AND THE CARIBBEAN
MIDDLE EAST AND NORTH AFRICASOUTH ASIASUB-SAHARAN AFRICA
TOTAL
Proportion of population living below US$1.25 per day 1990-2025Figure 20
Source: World Bank. Note: World regions are based on World Bank classifications.
Trends – drivers of vulnerability
Globally, access to clean water is increasing and the proportion of people living in extreme poverty is decreasing. Yet, progress is uneven across regions. Climate change and population growth will result in increased pressure on water resources in some regions.

88
0
100
200
300
400
500
600
700
2005 2010 2015
Num
ber o
f peo
ple
livin
g be
low
US$
1.25
per
day
(mill
ions
)
MIDDLE EAST AND NORTH AFRICA
SUB-SAHARAN AFRICA
EUROPE AND CENTRAL ASIA
LATIN AMERICA AND THE CARIBBEAN
EAST ASIA
SOUTH ASIA
0
100
200
300
400
500
600
700
2005 2010 2015
Num
ber o
f peo
ple
livin
g be
low
US$
1.25
per
day
(mill
ions
)
MIDDLE EAST AND NORTH AFRICA
SUB-SAHARAN AFRICA
EUROPE AND CENTRAL ASIA
LATIN AMERICA AND THE CARIBBEAN
EAST ASIA
SOUTH ASIA
0
200
400
600
800
1,000
1,200
1,400
1,600
1,800
2,000
Num
ber
of p
eop
le li
ving
b
elow
US$
2 p
er d
ay (m
illio
ns)
NON-FRAGILE FRAGILE
1999
2000
2001
2002
2003
2004
2005
2006
2007
2008
2009
2010
2011
2012
2013
2014
2015
2016
2017
2018
2019
2020
2021
2022
2023
2024
2025
1990
1991
1992
1993
1994
1995
1996
1997
1998
Number of people living below US$2 per day in fragile and non-fragile states 1990-2025
Number of people living below US$1.25 per day by region 2005-2015
Figure 22
Figure 21
Source: ODI
Source: World Bank. Note: World regions are based on World Bank classifications.
Trends – drivers of vulnerability
The absolute number of sub-Saharan Africans living in extreme poverty has decreased only slightly, despite global advances. Poverty reduction in fragile states has also been limited. Poverty will be increasingly concentrated in sub-Saharan Africa and fragile states in the future.

89
Africa
136% 68%Oceania
Focus Countries
97% 58%
Latin America and the Caribbean
38%
Northern America
2%Europe
52%Asia
0
1,000
2,000
3,000
4,000
5,000
6,000
7,000
8,000
9,000
1990 1995 2000 2005 2010 2015 2020
Pop
ulat
ion
(mill
ions
)
DEVELOPING COUNTRIES-SLUMDEVELOPING COUNTRIES-OTHER URBAN
DEVELOPED COUNTRIESDEVELOPING COUNTRIES-RURAL
0
1,000
2,000
3,000
4,000
5,000
6,000
7,000
8,000
9,000
1990 1995 2000 2005 2010 2015 2020
Pop
ulat
ion
(mill
ions
)
DEVELOPING COUNTRIES-SLUMDEVELOPING COUNTRIES-OTHER URBAN
DEVELOPED COUNTRIESDEVELOPING COUNTRIES-RURAL
Population growth by region 1990-2025
Global population growth by economic and geographic context 1990-2020
Figure 23
Figure 24
Source: UNDESA
Source: UNDESA and UN-HABITAT
Trends – drivers of vulnerability
Population growth and other demographic changes, including rapid urbanisation, will continue to put pressure on resources for humanitarian assistance and will require changes to the way it is provided. Population in humanitarian ‘Focus Countries’ is projected to nearly double between 1990 and 2025.

in humanitarian aid �nancing was captured in the UN OCHA FTS in
2011. Tracing these funds through the network of response actors gives
a partial indication of their relative sizes and relationships.
International governments
Governments of a�ected states Civil society organizations
Red Cross/Crescent US$2.8bn
NGOs US$8.4 billion
UN agencies and fundsUS$6.8bn
CHFs US$348m
US$296m
US$29m
US$142m
US$133m
US$6m
US$1m
US$0.5m
US$147m
US$44m
US$602m
ERFs US$30m
CERF US$423m
Other pooled funds
US$0.3m
Total pooled funds
US$801m
US$543m
of which national NGOs US$95m
of which national societies US$725m
DAC donorsUS$10.3bn
Non-DAC donorsUS$570m Private funding US$954m
Private sector
US$13 billion
US$2.2bn
US$5.8bn
US$991m
FIGURE 25
90
Humanitarian funding follows a number of different channels from donor to intended recipient. There may be multiple transactions as it passes from donors through funds and implementing organizations to people affected by crisis. Tracking funding through this complex network remains problematic and acts as a barrier to transparency in humanitarian aid.
Humanitarian funding flows in 2011
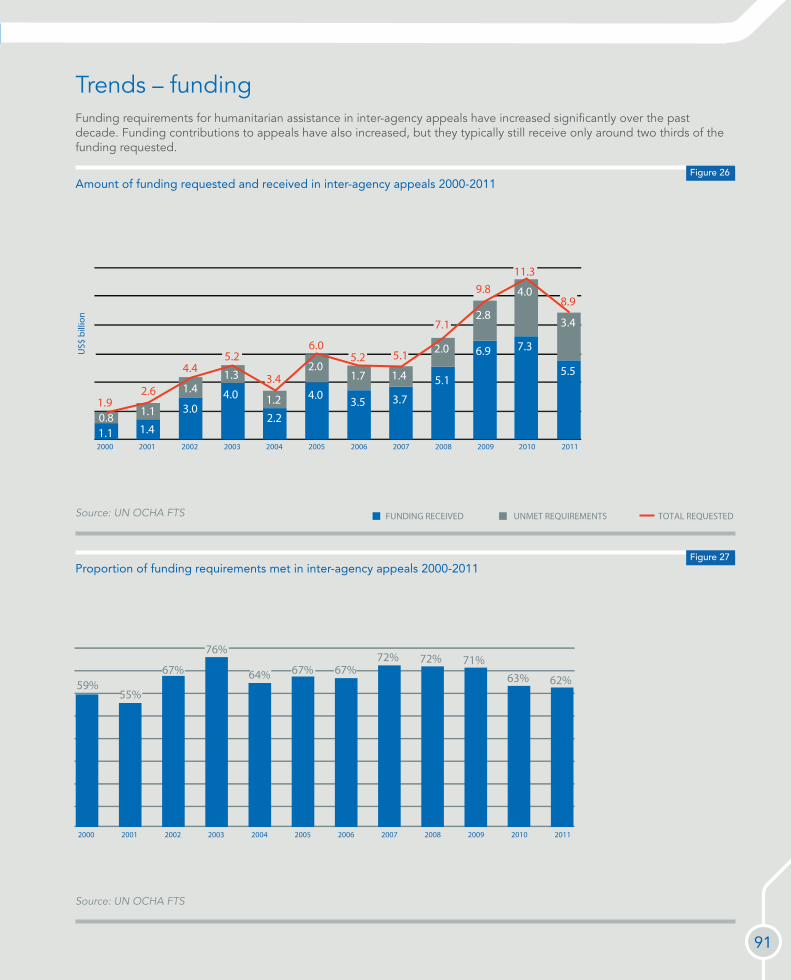
91
US$
bill
ion
UNMET REQUIREMENTS FUNDING RECEIVED TOTAL REQUESTED
2000
1.1 0.8 1.9
2001
1.4 1.1
2.6
2002
3.0
1.4
4.4
2003
4.0
1.3
5.2
2004
2.2 1.2
3.4
2005
4.0
2.0
6.0
2006
3.5
1.7
5.2
2007
3.7
1.4
5.1
2008
5.1
2.0
7.1
2009
6.9
2.8
9.8
2010
7.3
4.0
11.3
2011
5.5
3.4
8.9
US$
bill
ion
UNMET REQUIREMENTS FUNDING RECEIVED TOTAL REQUESTED
2000
1.1 0.8 1.9
2001
1.4 1.1
2.6
2002
3.0
1.4
4.4
2003
4.0
1.3
5.2
2004
2.2 1.2
3.4
2005
4.0
2.0
6.0
2006
3.5
1.7
5.2
2007
3.7
1.4
5.1
2008
5.1
2.0
7.1
2009
6.9
2.8
9.8
2010
7.3
4.0
11.3
2011
5.5
3.4
8.9
64%
2004
59%
2000
55%
2001
76%
2003
67%
2005
67%
2006 2007
72% 71%
2009 2010
63%
72%
2008
67%
2002 2011
62%
Amount of funding requested and received in inter-agency appeals 2000-2011
Proportion of funding requirements met in inter-agency appeals 2000-2011
Figure 26
Figure 27
Source: UN OCHA FTS
Source: UN OCHA FTS
Trends – fundingFunding requirements for humanitarian assistance in inter-agency appeals have increased significantly over the past decade. Funding contributions to appeals have also increased, but they typically still receive only around two thirds of the funding requested.

92
20
40
60
80
100
2001
%
2002 2003 2004 2005 2006 2007 2008 2009 2010
ALL OTHER RECIPIENTS NEXT 10 RECIPIENTS TOP 3 RECIPIENTS
20
40
60
80
100
2001
%
2002 2003 2004 2005 2006 2007 2008 2009 2010
ALL OTHER RECIPIENTS NEXT 10 RECIPIENTS TOP 3 RECIPIENTS
Progression of funding of inter-agency appeals for selected crises
Concentration of humanitarian aid among recipient countries 2001-2010
Figure 28
Figure 29
Prop
ortio
n of
fund
ing
re
qui
rem
ents
met
(%)
10
20
30
40
50
60
70
80
90
100
Jan Feb Mar Apr May Jun Jul Aug Sep Oct Nov Dec
HAITI FLASH APPEAL 2010INDIAN OCEAN EARTHQUAKE-TSUNAMIFLASH APPEAL 2005
SOUTH SUDAN 2011SOMALIA 2011
SUDAN 2011WEST AFRICA 2011
Prop
ortio
n of
fund
ing
re
qui
rem
ents
met
(%)
10
20
30
40
50
60
70
80
90
100
Jan Feb Mar Apr May Jun Jul Aug Sep Oct Nov Dec
HAITI FLASH APPEAL 2010INDIAN OCEAN EARTHQUAKE-TSUNAMIFLASH APPEAL 2005
SOUTH SUDAN 2011SOMALIA 2011
SUDAN 2011WEST AFRICA 2011
Source: Based on OECD DAC and UN OCHA FTS
Source: UN OCHA FTS
Trends – funding
Appeals receive funding at different rates. Sudden disasters receive most initial funding. Funding can increase when the profile of a crisis rises, while other appeals are consistently under-funded. Massive disasters may displace funding from other crises – as in 2010, when the funds received by the top three recipients grew to almost half the total.

93
0
2
4
6
8
10
12
14
US$
bill
ion
2001 2002 2003 2004 2005 2006 2007 2008 2009 2011 2010
TOTAL FROM OECD DAC MEMBERSTOTAL FROM OTHER GOVERNMENTS
PROVISIONAL
7.1 6.8 8.1 8.5
11.4 10.2
9.3
12.4 11.812.5 13.0
0
2
4
6
8
10
12
14
US$
bill
ion
2001 2002 2003 2004 2005 2006 2007 2008 2009 2011 2010
TOTAL FROM OECD DAC MEMBERSTOTAL FROM OTHER GOVERNMENTS
PROVISIONAL
7.1 6.8 8.1 8.5
11.4 10.2
9.3
12.4 11.812.5 13.0
2000 2001 2002 2003 2004 2005 2006 2007 2008 2009 2011 2010
98
619
311
941
509
738
0
100
200
300
400
500
600
700
800
900
1000
US$
mill
ion
GULF STATES BRICS EU 12 ALL OTHER DONORS
35
664
155 192287
582
2000 2001 2002 2003 2004 2005 2006 2007 2008 2009 2011 2010
98
619
311
941
509
738
0
100
200
300
400
500
600
700
800
900
1000
US$
mill
ion
GULF STATES BRICS EU 12 ALL OTHER DONORS
35
664
155 192287
582
Humanitarian aid financing from government donors 2001-2011
Humanitarian aid financing from governments outside of OECD DAC 2000-2011
Figure 30
Figure 31
Source: Based on UN OCHA FTS
Source: Based on OECD DAC and UN OCHA FTS
Humanitarian aid financing from governments has remained stable since the global financial crisis of 2007-8. Emerging donors, such as the Gulf States and BRICS, are playing an increasingly important role in humanitarian aid. However, their combined contribution is quite variable between years.
Trends – funding
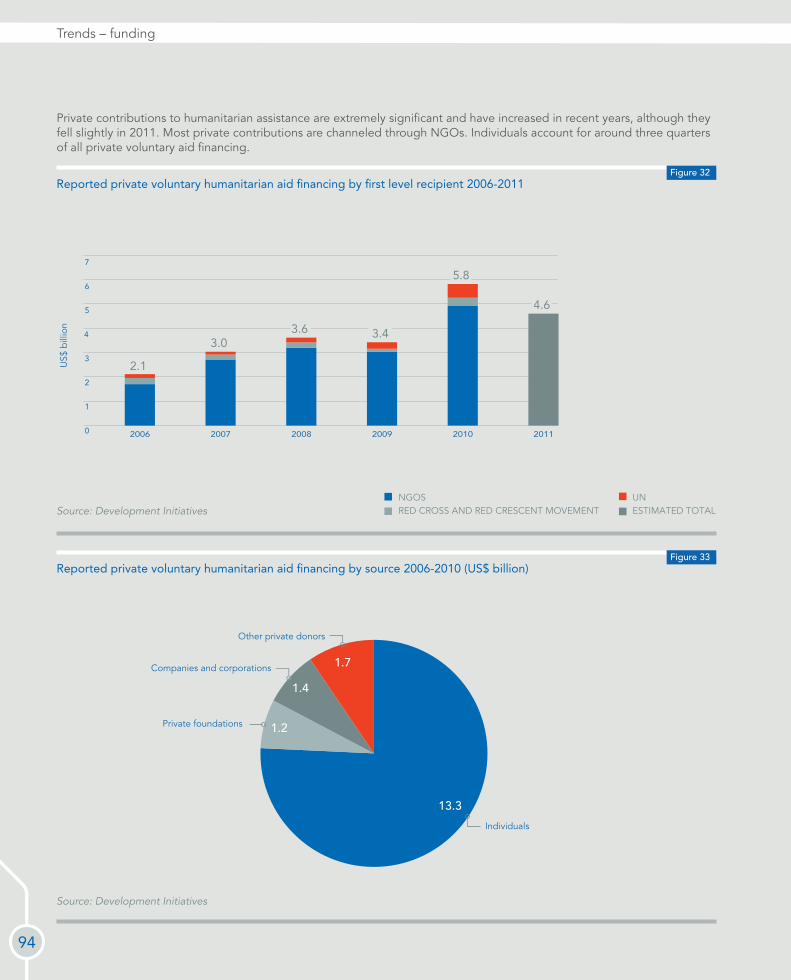
94
2006
2.1
2007
3.0
2008
3.6
2009
3.4
2010
5.8
2011
4.6
0
1
2
3
4
5
6
7
US$
bill
ion
UNESTIMATED TOTAL
NGOSRED CROSS AND RED CRESCENT MOVEMENT
2006
2.1
2007
3.0
2008
3.6
2009
3.4
2010
5.8
2011
4.6
0
1
2
3
4
5
6
7
US$
bill
ion
UNESTIMATED TOTAL
NGOSRED CROSS AND RED CRESCENT MOVEMENT
Individuals
Private foundations
Companies and corporations
1.7
1.4
1.2
13.3
Other private donors
Reported private voluntary humanitarian aid financing by first level recipient 2006-2011
Reported private voluntary humanitarian aid financing by source 2006-2010 (US$ billion)Figure 33
Figure 32
Source: Development Initiatives
Source: Development Initiatives
Trends – funding
Private contributions to humanitarian assistance are extremely significant and have increased in recent years, although they fell slightly in 2011. Most private contributions are channeled through NGOs. Individuals account for around three quarters of all private voluntary aid financing.

France
17.0
685.9
19.8Germany
4.8Spain
4.6China
3.2Greece
2.0Indonesia
2.0Russia
1.0Suriname
0.6Turkey
0.5Brazil
0.4Switzerland
0.1Sweden
United States
95
Reported funding for humanitarian response channelled via foreign military actors 2007-2011 (US$ million)Figure 34
Source: Based on UN OCHA FTS
Trends – funding
Humanitarian assistance provided by the military can be important, particularly in large natural disasters, but it is inconsistently reported and not often quantified. The majority of funds represented in this figure (69%) relate to the response to the earthquake in Haiti in 2010, in which militaries played a significant role.

96
64 68 76 76 86 99 103 117 117 125 131
146 172
208
240
277
321
394
457 429
453
501
0
100
200
300
400
500
600
US$
bill
ion
HIGH-INCOME: OECDFOCUS COUNTRIES
UPPER-MIDDLE INCOMEHIGH-INCOME: NON-OECD
LOW-INCOMELOWER-MIDDLE INCOME
1999
2000
2001
2002
2003
2004
2005
2006
2007
2008
2009
2010
2011
1990
1991
1992
1993
1994
1995
1996
1997
1998
Global remittance inflows by income group 1990-2011Figure 35
Source: World Bank. Note: Values for 2011 are estimated.
Trends – funding
Remittances – transfers of money by foreign workers to their home country – are growing, but remittances for humanitarian purposes are not quantified. Remittances to Haiti surged after the 2010 earthquake and 10% of remittances to Somalia (estimated between US$1.3 and US$2 billion per year) are thought to be for humanitarian and development purposes.

97
Proportion of global Official Development Assistance spent on disaster preparedness and risk reduction 2006-2010
Humanitarian disaster prevention and preparedness
All other o�cial humanitarian aid
Disaster risk reduction
All other development assistance
99%
1% 3%
97%
Figure 36
Source: Based on OECD DAC
Trends – preventionDisaster prevention saves lives and livelihoods and has been proven to be more cost effective than humanitarian response. Despite this, spending on disaster preparedness and risk reduction remains a very small proportion of humanitarian aid and development assistance.

98
DEVELOPMENT FOOD AIDEMERGENCY FOOD AID
AGRICULTUREBASIC NUTRITION
2
4
6
8
10
12
14
US$
bill
ion
(con
stan
t 201
0 pr
ices
)
2002 2003 2004 2005 2006 2007 2008 2009 2010
DEVELOPMENT FOOD AIDEMERGENCY FOOD AID
AGRICULTUREBASIC NUTRITION
2
4
6
8
10
12
14
US$
bill
ion
(con
stan
t 201
0 pr
ices
)
2002 2003 2004 2005 2006 2007 2008 2009 2010
2002
7.0
2003
7.7
2004
9.8
2005
13.3
2006
12.6
2007
14.2
2008
15.5
2009
17.4
2010
16.9
0
2
4
6
8
10
12
14
16
18
20
US$
bill
ion
(con
stan
t 201
0 pr
ices
)
ALL OTHER RECIPIENTS PAKISTANOTHER FOCUS COUNTRIES
AFGHANISTANIRAQ
2002
7.0
2003
7.7
2004
9.8
2005
13.3
2006
12.6
2007
14.2
2008
15.5
2009
17.4
2010
16.9
0
2
4
6
8
10
12
14
16
18
20
US$
bill
ion
(con
stan
t 201
0 pr
ices
)
ALL OTHER RECIPIENTS PAKISTANOTHER FOCUS COUNTRIES
AFGHANISTANIRAQ
Global Official Development Assistance investments in food aid, agriculture and basic nutrition 2002-2010
Global Official Development Assistance investments in state- and peacebuilding 2002-2010
Figure 37
Figure 38
Source: OECD DAC
Source: OECD DAC
Trends – prevention
Spending on food aid has steadily increased since 2002. However, investments in agriculture and basic nutrition, which can increase the resilience of vulnerable people, have grown more slowly. Spending on state- and peacebuilding has increased steadily, particularly in humanitarian ‘Focus Countries’.

SELECTED HUmANITARIAN INDICATORS
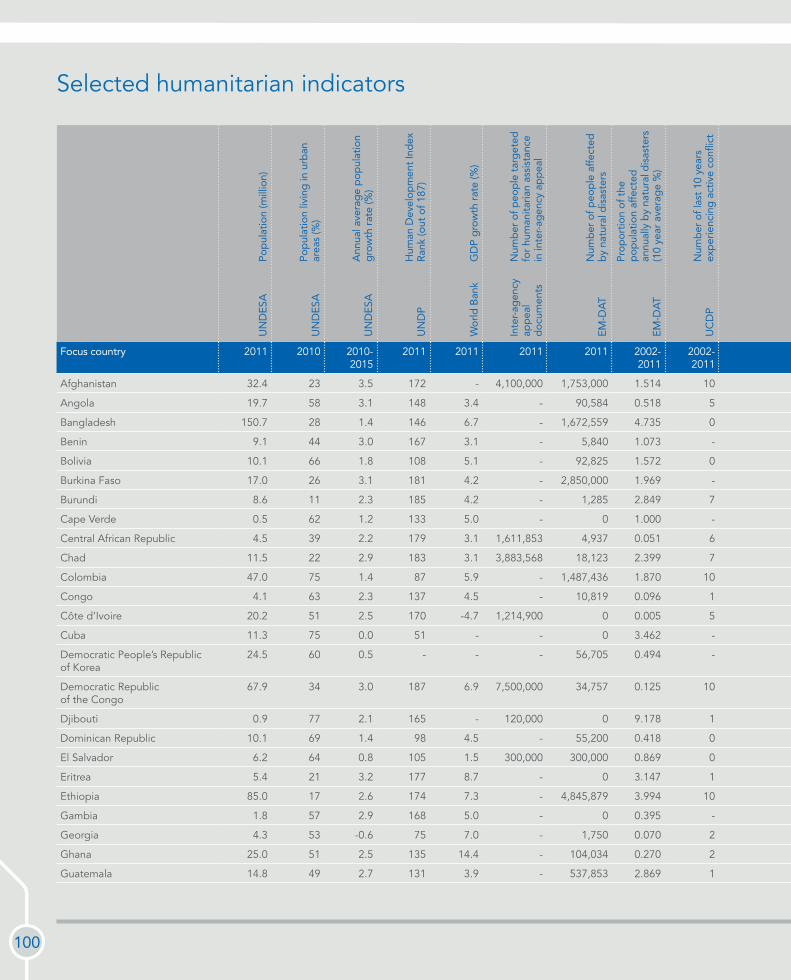
100
Selected humanitarian indicators
Focus country 2011 2010 2010-2015
2011 2011 2011 2011 2002-2011
2002-2011
2011 Latest year Latest year Latest year 2000-2010
2011 2010 Latest year 2010 2011 2011 2010 2011
Afghanistan 32.4 23 3.5 172 - 4,100,000 1,753,000 1.514 10 1,548,374 - - 32.9 48.7 149 0.21 50 54.26 114.35 202.76 906.15
Angola 19.7 58 3.1 148 3.4 - 90,584 0.518 5 23,357 54.31 10.36 15.6 51.1 161 0.08 51 48.38 1,889.97 12.02 0.88
Bangladesh 150.7 28 1.4 146 6.7 - 1,672,559 4.735 0 229,671 43.25 64.31 41.3 68.9 48 0.295 81 56.48 85.66 9.51 66.30
Benin 9.1 44 3.0 167 3.1 - 5,840 1.073 - 7,575 47.33 4.19 20.2 56.1 115 0.059 75 85.33 149.24 77.75 4.67
Bolivia 10.1 66 1.8 108 5.1 - 92,825 1.572 0 734 15.61 1.55 4.5 66.6 54 1.22 88 82.80 684.41 66.73 12.44
Burkina Faso 17.0 26 3.1 181 4.2 - 2,850,000 1.969 - 1,211 44.60 7.35 26 55.4 176 0.064 79 45.27 112.34 64.22 38.94
Burundi 8.6 11 2.3 185 4.2 - 1,285 2.849 7 130,202 81.32 6.82 - 50.4 142 0.03 72 14.46 91.88 75.09 40.77
Cape Verde 0.5 62 1.2 133 5.0 - 0 1.000 - - 21.02 0.10 - 74.2 36 0.572 88 79.19 976.99 659.13 1.20
Central African Republic 4.5 39 2.2 179 3.1 1,611,853 4,937 0.051 6 199,903 62.83 2.77 - 48.4 159 0.08 67 25.04 81.95 49.50 83.92
Chad 11.5 22 2.9 183 3.1 3,883,568 18,123 2.399 7 497,735 61.94 6.95 33.9 49.6 173 0.04 51 31.80 190.65 43.22 377.48
Colombia 47.0 75 1.4 87 5.9 - 1,487,436 1.870 10 3,888,684 8.16 3.78 3.4 73.7 22 0.15 92 98.45 1,681.78 19.46 64.15
Congo 4.1 63 2.3 137 4.5 - 10,819 0.096 1 145,319 54.10 2.19 11.8 57.4 93 0.095 71 93.84 1,138.86 32.78 7.58
Côte d’Ivoire 20.2 51 2.5 170 -4.7 1,214,900 0 0.005 5 754,508 23.75 4.69 29.4 55.4 123 0.144 80 86.42 213.89 30.09 157.40
Cuba 11.3 75 0.0 51 - - 0 3.462 - 389 - - - 79.1 6 6.72 94 11.69 - 11.47 0.39
Democratic People’s Republic of Korea
24.5 60 0.5 - - - 56,705 0.494 - - - - 18.8 68.8 33 3.29 98 4.09 - 3.24 98.35
Democratic Republic of the Congo
67.9 34 3.0 187 6.9 7,500,000 34,757 0.125 10 2,706,932 87.72 57.87 28.2 48.4 170 0.11 45 23.13 68.36 30.74 546.95
Djibouti 0.9 77 2.1 165 - 120,000 0 9.178 1 22,247 18.84 0.17 29.6 57.9 91 0.229 88 21.32 461.94 148.77 42.03
Dominican Republic 10.1 69 1.4 98 4.5 - 55,200 0.418 0 2,380 2.24 0.22 3.4 73.4 27 1.88 86 87.22 731.05 17.64 3.96
El Salvador 6.2 64 0.8 105 1.5 300,000 300,000 0.869 0 43 8.97 0.56 6.6 72.2 16 1.596 88 125.85 597.81 45.59 14.65
Eritrea 5.4 21 3.2 177 8.7 - 0 3.147 1 4,726 - - 34.5 61.6 61 0.05 - 4.47 78.96 30.10 8.58
Ethiopia 85.0 17 2.6 174 7.3 - 4,845,879 3.994 10 290,212 38.96 32.32 34.6 59.3 106 0.022 44 16.67 65.16 42.42 823.43
Gambia 1.8 57 2.9 168 5.0 - 0 0.395 - 9,554 33.63 0.58 15.8 58.5 98 0.038 89 89.02 105.67 69.54 0.26
Georgia 4.3 53 -0.6 75 7.0 - 1,750 0.070 2 276,068 15.27 0.68 1.1 73.7 22 4.76 98 102.35 813.13 143.65 3.65
Ghana 25.0 51 2.5 135 14.4 - 104,034 0.270 2 26,220 28.59 6.97 14.3 64.2 74 0.085 86 84.78 246.19 69.28 4.81
Guatemala 14.8 49 2.7 131 3.9 - 537,853 2.869 1 159 13.53 1.95 13 71.2 32 0.9 92 140.38 326.65 27.22 10.95
UN
DES
APo
pul
atio
n (m
illio
n)
UN
DES
APo
pul
atio
n liv
ing
in u
rban
ar
eas
(%)
UN
DES
AA
nnua
l ave
rag
e p
opul
atio
n g
row
th r
ate
(%)
UN
DP
Hum
an D
evel
opm
ent
Ind
ex
Ran
k (o
ut o
f 187
)
Wor
ld B
ank
GD
P g
row
th r
ate
(%)
Inte
r-ag
ency
ap
pea
l d
ocum
ents
Num
ber
of p
eop
le t
arg
eted
fo
r hu
man
itaria
n as
sist
ance
in
inte
r-ag
ency
ap
pea
l
EM-D
AT
Num
ber
of p
eop
le a
ffec
ted
b
y na
tura
l dis
aste
rs
EM-D
AT
Prop
ortio
n of
the
p
opul
atio
n af
fect
ed
annu
ally
by
natu
ral d
isas
ters
(1
0 ye
ar a
vera
ge
%)
UC
DP
Num
ber
of l
ast
10 y
ears
ex
per
ienc
ing
act
ive
confl
ict
UN
HC
RTo
tal p
opul
atio
n of
con
cern
to
UN
HC
R
Wor
ld B
ank
Pove
rty
head
coun
t ra
tio
at U
S$1.
25 a
day
(% o
f p
opul
atio
n)
Wor
ld B
ank
Num
ber
of p
eop
le li
ving
b
elow
US$
1.25
per
day
(m
illio
n)
WH
O
Mal
nutr
ition
pre
vale
nce,
w
eig
ht fo
r ag
e (%
of
child
ren
und
er 5
)
UN
DES
ALi
fe e
xpec
tanc
y (y
ears
)
UN
ICEF
Und
er-5
mor
talit
y ra
te (p
er
1,00
0 liv
e b
irths
)
WH
OD
ensi
ty o
f phy
sici
ans
(per
1,
000
pop
ulat
ion)
WH
O /
U
NIC
EFPo
pul
atio
n us
ing
imp
rove
d
drin
king
-wat
er s
ourc
es (%
)
ITU
Mob
ile c
ellu
lar
sub
scrip
tions
per
100
in
hab
itant
s
Wor
ld B
ank
Gov
ernm
ent
reve
nues
p
er c
apita
(US$
)
OEC
D D
AC
Offi
cial
Dev
elop
men
t A
ssis
tanc
e p
er c
apita
(US$
)
OC
HA
FTS
Hum
anita
rian
fund
ing
re
ceiv
ed (U
S$ m
illio
n)

101
Focus country 2011 2010 2010-2015
2011 2011 2011 2011 2002-2011
2002-2011
2011 Latest year Latest year Latest year 2000-2010
2011 2010 Latest year 2010 2011 2011 2010 2011
Afghanistan 32.4 23 3.5 172 - 4,100,000 1,753,000 1.514 10 1,548,374 - - 32.9 48.7 149 0.21 50 54.26 114.35 202.76 906.15
Angola 19.7 58 3.1 148 3.4 - 90,584 0.518 5 23,357 54.31 10.36 15.6 51.1 161 0.08 51 48.38 1,889.97 12.02 0.88
Bangladesh 150.7 28 1.4 146 6.7 - 1,672,559 4.735 0 229,671 43.25 64.31 41.3 68.9 48 0.295 81 56.48 85.66 9.51 66.30
Benin 9.1 44 3.0 167 3.1 - 5,840 1.073 - 7,575 47.33 4.19 20.2 56.1 115 0.059 75 85.33 149.24 77.75 4.67
Bolivia 10.1 66 1.8 108 5.1 - 92,825 1.572 0 734 15.61 1.55 4.5 66.6 54 1.22 88 82.80 684.41 66.73 12.44
Burkina Faso 17.0 26 3.1 181 4.2 - 2,850,000 1.969 - 1,211 44.60 7.35 26 55.4 176 0.064 79 45.27 112.34 64.22 38.94
Burundi 8.6 11 2.3 185 4.2 - 1,285 2.849 7 130,202 81.32 6.82 - 50.4 142 0.03 72 14.46 91.88 75.09 40.77
Cape Verde 0.5 62 1.2 133 5.0 - 0 1.000 - - 21.02 0.10 - 74.2 36 0.572 88 79.19 976.99 659.13 1.20
Central African Republic 4.5 39 2.2 179 3.1 1,611,853 4,937 0.051 6 199,903 62.83 2.77 - 48.4 159 0.08 67 25.04 81.95 49.50 83.92
Chad 11.5 22 2.9 183 3.1 3,883,568 18,123 2.399 7 497,735 61.94 6.95 33.9 49.6 173 0.04 51 31.80 190.65 43.22 377.48
Colombia 47.0 75 1.4 87 5.9 - 1,487,436 1.870 10 3,888,684 8.16 3.78 3.4 73.7 22 0.15 92 98.45 1,681.78 19.46 64.15
Congo 4.1 63 2.3 137 4.5 - 10,819 0.096 1 145,319 54.10 2.19 11.8 57.4 93 0.095 71 93.84 1,138.86 32.78 7.58
Côte d’Ivoire 20.2 51 2.5 170 -4.7 1,214,900 0 0.005 5 754,508 23.75 4.69 29.4 55.4 123 0.144 80 86.42 213.89 30.09 157.40
Cuba 11.3 75 0.0 51 - - 0 3.462 - 389 - - - 79.1 6 6.72 94 11.69 - 11.47 0.39
Democratic People’s Republic of Korea
24.5 60 0.5 - - - 56,705 0.494 - - - - 18.8 68.8 33 3.29 98 4.09 - 3.24 98.35
Democratic Republic of the Congo
67.9 34 3.0 187 6.9 7,500,000 34,757 0.125 10 2,706,932 87.72 57.87 28.2 48.4 170 0.11 45 23.13 68.36 30.74 546.95
Djibouti 0.9 77 2.1 165 - 120,000 0 9.178 1 22,247 18.84 0.17 29.6 57.9 91 0.229 88 21.32 461.94 148.77 42.03
Dominican Republic 10.1 69 1.4 98 4.5 - 55,200 0.418 0 2,380 2.24 0.22 3.4 73.4 27 1.88 86 87.22 731.05 17.64 3.96
El Salvador 6.2 64 0.8 105 1.5 300,000 300,000 0.869 0 43 8.97 0.56 6.6 72.2 16 1.596 88 125.85 597.81 45.59 14.65
Eritrea 5.4 21 3.2 177 8.7 - 0 3.147 1 4,726 - - 34.5 61.6 61 0.05 - 4.47 78.96 30.10 8.58
Ethiopia 85.0 17 2.6 174 7.3 - 4,845,879 3.994 10 290,212 38.96 32.32 34.6 59.3 106 0.022 44 16.67 65.16 42.42 823.43
Gambia 1.8 57 2.9 168 5.0 - 0 0.395 - 9,554 33.63 0.58 15.8 58.5 98 0.038 89 89.02 105.67 69.54 0.26
Georgia 4.3 53 -0.6 75 7.0 - 1,750 0.070 2 276,068 15.27 0.68 1.1 73.7 22 4.76 98 102.35 813.13 143.65 3.65
Ghana 25.0 51 2.5 135 14.4 - 104,034 0.270 2 26,220 28.59 6.97 14.3 64.2 74 0.085 86 84.78 246.19 69.28 4.81
Guatemala 14.8 49 2.7 131 3.9 - 537,853 2.869 1 159 13.53 1.95 13 71.2 32 0.9 92 140.38 326.65 27.22 10.95
UN
DES
APo
pul
atio
n (m
illio
n)
UN
DES
APo
pul
atio
n liv
ing
in u
rban
ar
eas
(%)
UN
DES
AA
nnua
l ave
rag
e p
opul
atio
n g
row
th r
ate
(%)
UN
DP
Hum
an D
evel
opm
ent
Ind
ex
Ran
k (o
ut o
f 187
)
Wor
ld B
ank
GD
P g
row
th r
ate
(%)
Inte
r-ag
ency
ap
pea
l d
ocum
ents
Num
ber
of p
eop
le t
arg
eted
fo
r hu
man
itaria
n as
sist
ance
in
inte
r-ag
ency
ap
pea
l
EM-D
AT
Num
ber
of p
eop
le a
ffec
ted
b
y na
tura
l dis
aste
rs
EM-D
AT
Prop
ortio
n of
the
p
opul
atio
n af
fect
ed
annu
ally
by
natu
ral d
isas
ters
(1
0 ye
ar a
vera
ge
%)
UC
DP
Num
ber
of l
ast
10 y
ears
ex
per
ienc
ing
act
ive
confl
ict
UN
HC
RTo
tal p
opul
atio
n of
con
cern
to
UN
HC
R
Wor
ld B
ank
Pove
rty
head
coun
t ra
tio
at U
S$1.
25 a
day
(% o
f p
opul
atio
n)
Wor
ld B
ank
Num
ber
of p
eop
le li
ving
b
elow
US$
1.25
per
day
(m
illio
n)
WH
O
Mal
nutr
ition
pre
vale
nce,
w
eig
ht fo
r ag
e (%
of
child
ren
und
er 5
)
UN
DES
ALi
fe e
xpec
tanc
y (y
ears
)
UN
ICEF
Und
er-5
mor
talit
y ra
te (p
er
1,00
0 liv
e b
irths
)
WH
OD
ensi
ty o
f phy
sici
ans
(per
1,
000
pop
ulat
ion)
WH
O /
U
NIC
EFPo
pul
atio
n us
ing
imp
rove
d
drin
king
-wat
er s
ourc
es (%
)
ITU
Mob
ile c
ellu
lar
sub
scrip
tions
per
100
in
hab
itant
s
Wor
ld B
ank
Gov
ernm
ent
reve
nues
p
er c
apita
(US$
)
OEC
D D
AC
Offi
cial
Dev
elop
men
t A
ssis
tanc
e p
er c
apita
(US$
)
OC
HA
FTS
Hum
anita
rian
fund
ing
re
ceiv
ed (U
S$ m
illio
n)
Selected humanitarian indicators

102
Selected humanitarian indicators
Focus country 2011 2010 2010-2015
2011 2011 2011 2011 2002-2011
2002-2011
2011 Latest year Latest year Latest year 2000-2010
2011 2010 Latest year 2010 2011 2011 2010 2011
Guinea 10.2 35 2.8 178 3.6 - 16,143 0.133 3 17,215 43.34 4.33 20.8 54.1 130 0.1 74 44.02 78.40 21.16 10.83
Guinea-Bissau 1.5 43 2.3 176 5.3 - 0 1.472 0 7,891 48.90 0.74 17.2 48.1 150 0.045 64 25.98 116.53 82.67 1.49
Guyana 0.8 28 0.3 117 - - 0 5.416 1 8 8.70 0.07 10.8 69.9 30 0.48 94 68.62 877.68 203.06 0.00
Haiti 10.1 52 1.6 158 5.6 3,000,000 6,930 4.769 2 6 61.71 6.17 18.9 62.1 165 0.25 69 41.49 194.09 291.77 494.02
Honduras 7.8 52 2.2 121 3.4 - 69,798 1.170 2 17 17.92 1.36 8.6 73.1 24 0.57 87 103.97 - 75.55 3.25
Indonesia 242.5 50 1.1 124 6.5 - 18,232 0.396 4 4,239 18.06 43.32 17.5 69.4 35 0.288 82 97.72 529.61 5.79 14.79
Iran 74.9 69 1.2 88 - - 0 0.138 7 886,914 1.45 1.07 - 73.0 26 0.89 96 74.93 1,301.73 1.64 15.57
Iraq 32.7 67 3.3 132 9.9 - 0 0.023 9 1,752,466 2.82 0.90 7.1 69.0 39 0.69 79 78.12 2,063.22 68.32 127.07
Kenya 41.6 24 2.8 143 4.5 3,572,000 4,395,692 3.731 7 921,827 43.37 17.57 16.4 57.1 85 0.14 59 64.84 199.34 40.17 642.18
Kyrgyzstan 5.4 35 1.1 126 7.0 - 0 3.770 1 210,803 6.23 0.33 2.7 67.7 38 2.301 90 104.83 286.90 69.73 3.38
Lao People’s Democratic Republic
6.3 33 1.7 138 8.0 - 467,000 1.508 1 0 33.88 2.10 31.6 67.5 54 0.272 67 87.16 214.79 66.73 6.52
Lebanon 4.3 87 0.8 71 3.0 - 0 0.041 2 15,566* - - 4.2 72.6 22 3.54 100 78.65 2,023.55 105.95 43.60
Lesotho 2.2 27 1.3 160 5.8 - 519,000 6.821 0 37 43.41 0.94 13.5 48.2 85 0.05 78 47.91 555.32 117.34 6.64
Liberia 4.1 48 2.9 182 8.5 - 0 1.340 2 132,485 83.76 3.35 20.4 56.8 103 0.014 73 49.17 93.67 122.21 152.02
Libya 6.4 78 1.0 64 - - 0 0.000 1 713,587 - - 5.6 74.8 17 1.9 - 155.70 2,791.81 1.34 97.95
Madagascar 21.3 32 3.0 151 1.0 - 89,297 1.798 2 11 81.29 16.84 36.8 66.7 62 0.161 46 38.28 50.83 22.67 13.32
Malawi 15.4 16 3.2 171 4.5 - 83,586 5.984 - 16,853 73.86 11.01 13.8 54.2 92 0.019 83 25.07 135.88 68.48 0.55
Maldives 0.3 40 1.5 109 7.5 - 1,289 0.466 - - - - 17.8 76.8 15 1.595 98 165.72 1,715.23 350.60 0.00
Mali 15.9 34 3.2 175 2.7 - 2,986,605 2.983 3 18,121 50.43 7.75 27.9 51.4 178 0.049 64 68.32 128.00 70.66 28.18
Mauritania 3.5 41 2.5 159 4.8 - 700,000 4.649 2 28,184 23.43 0.81 15.9 58.6 111 0.13 50 92.71 280.92 107.06 21.24
Mongolia 2.8 68 1.6 110 17.3 - 0 5.190 - 298 - - 5.3 68.5 32 2.763 82 105.08 955.04 109.36 0.28
Mozambique 24.0 31 2.5 184 7.1 - 64,271 2.118 0 13,686 59.58 13.94 18.3 50.2 135 0.03 47 32.83 125.99 83.41 4.90
Myanmar 48.4 32 0.9 149 - - 53,734 0.652 9 1,147,275 - - 29.6 65.2 66 0.457 83 2.57 66.02 7.40 80.72
Namibia 2.3 38 1.9 120 3.8 134,219 500,000 6.121 0 7,018 31.91 0.73 17.5 62.5 40 0.374 93 104.96 1,398.39 112.31 3.40
Nepal 30.5 17 2.0 157 3.9 - 194,686 1.002 6 874,123 24.82 7.44 38.8 68.8 50 0.21 89 43.81 95.45 27.14 44.16
Nicaragua 5.9 57 1.6 129 4.7 133,800 143,000 0.920 0 92 11.91 0.69 5.7 74.0 27 0.37 85 82.15 385.90 107.22 7.55
UN
DES
APo
pul
atio
n (m
illio
n)
UN
DES
APo
pul
atio
n liv
ing
in u
rban
ar
eas
(%)
UN
DES
AA
nnua
l ave
rag
e p
opul
atio
n g
row
th r
ate
(%)
UN
DP
Hum
an D
evel
opm
ent
Ind
ex
Ran
k (o
ut o
f 187
)
Wor
ld B
ank
GD
P g
row
th r
ate
(%)
Inte
r-ag
ency
ap
pea
l d
ocum
ents
Num
ber
of p
eop
le t
arg
eted
fo
r hu
man
itaria
n as
sist
ance
in
inte
r-ag
ency
ap
pea
l
EM-D
AT
Num
ber
of p
eop
le a
ffec
ted
b
y na
tura
l dis
aste
rs
EM-D
AT
Prop
ortio
n of
the
p
opul
atio
n af
fect
ed
annu
ally
by
natu
ral d
isas
ters
(1
0 ye
ar a
vera
ge
%)
UC
DP
Num
ber
of l
ast
10 y
ears
ex
per
ienc
ing
act
ive
confl
ict
UN
HC
RTo
tal p
opul
atio
n of
con
cern
to
UN
HC
R
Wor
ld B
ank
Pove
rty
head
coun
t ra
tio
at U
S$1.
25 a
day
(% o
f p
opul
atio
n)
Wor
ld B
ank
Num
ber
of p
eop
le li
ving
b
elow
US$
1.25
per
day
(m
illio
n)
WH
O
Mal
nutr
ition
pre
vale
nce,
w
eig
ht fo
r ag
e (%
of
child
ren
und
er 5
)
UN
DES
ALi
fe e
xpec
tanc
y (y
ears
)
UN
ICEF
Und
er-5
mor
talit
y ra
te (p
er
1,00
0 liv
e b
irths
)
WH
OD
ensi
ty o
f phy
sici
ans
(per
1,
000
pop
ulat
ion)
WH
O /
U
NIC
EFPo
pul
atio
n us
ing
imp
rove
d
drin
king
-wat
er s
ourc
es (%
)
ITU
Mob
ile c
ellu
lar
sub
scrip
tions
per
100
in
hab
itant
s
Wor
ld B
ank
Gov
ernm
ent
reve
nues
p
er c
apita
(US$
)
OEC
D D
AC
Offi
cial
Dev
elop
men
t A
ssis
tanc
e p
er c
apita
(US$
)
OC
HA
FTS
Hum
anita
rian
fund
ing
re
ceiv
ed (U
S$ m
illio
n)

103
Focus country 2011 2010 2010-2015
2011 2011 2011 2011 2002-2011
2002-2011
2011 Latest year Latest year Latest year 2000-2010
2011 2010 Latest year 2010 2011 2011 2010 2011
Guinea 10.2 35 2.8 178 3.6 - 16,143 0.133 3 17,215 43.34 4.33 20.8 54.1 130 0.1 74 44.02 78.40 21.16 10.83
Guinea-Bissau 1.5 43 2.3 176 5.3 - 0 1.472 0 7,891 48.90 0.74 17.2 48.1 150 0.045 64 25.98 116.53 82.67 1.49
Guyana 0.8 28 0.3 117 - - 0 5.416 1 8 8.70 0.07 10.8 69.9 30 0.48 94 68.62 877.68 203.06 0.00
Haiti 10.1 52 1.6 158 5.6 3,000,000 6,930 4.769 2 6 61.71 6.17 18.9 62.1 165 0.25 69 41.49 194.09 291.77 494.02
Honduras 7.8 52 2.2 121 3.4 - 69,798 1.170 2 17 17.92 1.36 8.6 73.1 24 0.57 87 103.97 - 75.55 3.25
Indonesia 242.5 50 1.1 124 6.5 - 18,232 0.396 4 4,239 18.06 43.32 17.5 69.4 35 0.288 82 97.72 529.61 5.79 14.79
Iran 74.9 69 1.2 88 - - 0 0.138 7 886,914 1.45 1.07 - 73.0 26 0.89 96 74.93 1,301.73 1.64 15.57
Iraq 32.7 67 3.3 132 9.9 - 0 0.023 9 1,752,466 2.82 0.90 7.1 69.0 39 0.69 79 78.12 2,063.22 68.32 127.07
Kenya 41.6 24 2.8 143 4.5 3,572,000 4,395,692 3.731 7 921,827 43.37 17.57 16.4 57.1 85 0.14 59 64.84 199.34 40.17 642.18
Kyrgyzstan 5.4 35 1.1 126 7.0 - 0 3.770 1 210,803 6.23 0.33 2.7 67.7 38 2.301 90 104.83 286.90 69.73 3.38
Lao People’s Democratic Republic
6.3 33 1.7 138 8.0 - 467,000 1.508 1 0 33.88 2.10 31.6 67.5 54 0.272 67 87.16 214.79 66.73 6.52
Lebanon 4.3 87 0.8 71 3.0 - 0 0.041 2 15,566* - - 4.2 72.6 22 3.54 100 78.65 2,023.55 105.95 43.60
Lesotho 2.2 27 1.3 160 5.8 - 519,000 6.821 0 37 43.41 0.94 13.5 48.2 85 0.05 78 47.91 555.32 117.34 6.64
Liberia 4.1 48 2.9 182 8.5 - 0 1.340 2 132,485 83.76 3.35 20.4 56.8 103 0.014 73 49.17 93.67 122.21 152.02
Libya 6.4 78 1.0 64 - - 0 0.000 1 713,587 - - 5.6 74.8 17 1.9 - 155.70 2,791.81 1.34 97.95
Madagascar 21.3 32 3.0 151 1.0 - 89,297 1.798 2 11 81.29 16.84 36.8 66.7 62 0.161 46 38.28 50.83 22.67 13.32
Malawi 15.4 16 3.2 171 4.5 - 83,586 5.984 - 16,853 73.86 11.01 13.8 54.2 92 0.019 83 25.07 135.88 68.48 0.55
Maldives 0.3 40 1.5 109 7.5 - 1,289 0.466 - - - - 17.8 76.8 15 1.595 98 165.72 1,715.23 350.60 0.00
Mali 15.9 34 3.2 175 2.7 - 2,986,605 2.983 3 18,121 50.43 7.75 27.9 51.4 178 0.049 64 68.32 128.00 70.66 28.18
Mauritania 3.5 41 2.5 159 4.8 - 700,000 4.649 2 28,184 23.43 0.81 15.9 58.6 111 0.13 50 92.71 280.92 107.06 21.24
Mongolia 2.8 68 1.6 110 17.3 - 0 5.190 - 298 - - 5.3 68.5 32 2.763 82 105.08 955.04 109.36 0.28
Mozambique 24.0 31 2.5 184 7.1 - 64,271 2.118 0 13,686 59.58 13.94 18.3 50.2 135 0.03 47 32.83 125.99 83.41 4.90
Myanmar 48.4 32 0.9 149 - - 53,734 0.652 9 1,147,275 - - 29.6 65.2 66 0.457 83 2.57 66.02 7.40 80.72
Namibia 2.3 38 1.9 120 3.8 134,219 500,000 6.121 0 7,018 31.91 0.73 17.5 62.5 40 0.374 93 104.96 1,398.39 112.31 3.40
Nepal 30.5 17 2.0 157 3.9 - 194,686 1.002 6 874,123 24.82 7.44 38.8 68.8 50 0.21 89 43.81 95.45 27.14 44.16
Nicaragua 5.9 57 1.6 129 4.7 133,800 143,000 0.920 0 92 11.91 0.69 5.7 74.0 27 0.37 85 82.15 385.90 107.22 7.55
UN
DES
APo
pul
atio
n (m
illio
n)
UN
DES
APo
pul
atio
n liv
ing
in u
rban
ar
eas
(%)
UN
DES
AA
nnua
l ave
rag
e p
opul
atio
n g
row
th r
ate
(%)
UN
DP
Hum
an D
evel
opm
ent
Ind
ex
Ran
k (o
ut o
f 187
)
Wor
ld B
ank
GD
P g
row
th r
ate
(%)
Inte
r-ag
ency
ap
pea
l d
ocum
ents
Num
ber
of p
eop
le t
arg
eted
fo
r hu
man
itaria
n as
sist
ance
in
inte
r-ag
ency
ap
pea
l
EM-D
AT
Num
ber
of p
eop
le a
ffec
ted
b
y na
tura
l dis
aste
rs
EM-D
AT
Prop
ortio
n of
the
p
opul
atio
n af
fect
ed
annu
ally
by
natu
ral d
isas
ters
(1
0 ye
ar a
vera
ge
%)
UC
DP
Num
ber
of l
ast
10 y
ears
ex
per
ienc
ing
act
ive
confl
ict
UN
HC
RTo
tal p
opul
atio
n of
con
cern
to
UN
HC
R
Wor
ld B
ank
Pove
rty
head
coun
t ra
tio
at U
S$1.
25 a
day
(% o
f p
opul
atio
n)
Wor
ld B
ank
Num
ber
of p
eop
le li
ving
b
elow
US$
1.25
per
day
(m
illio
n)
WH
O
Mal
nutr
ition
pre
vale
nce,
w
eig
ht fo
r ag
e (%
of
child
ren
und
er 5
)
UN
DES
ALi
fe e
xpec
tanc
y (y
ears
)
UN
ICEF
Und
er-5
mor
talit
y ra
te (p
er
1,00
0 liv
e b
irths
)
WH
OD
ensi
ty o
f phy
sici
ans
(per
1,
000
pop
ulat
ion)
WH
O /
U
NIC
EFPo
pul
atio
n us
ing
imp
rove
d
drin
king
-wat
er s
ourc
es (%
)
ITU
Mob
ile c
ellu
lar
sub
scrip
tions
per
100
in
hab
itant
s
Wor
ld B
ank
Gov
ernm
ent
reve
nues
p
er c
apita
(US$
)
OEC
D D
AC
Offi
cial
Dev
elop
men
t A
ssis
tanc
e p
er c
apita
(US$
)
OC
HA
FTS
Hum
anita
rian
fund
ing
re
ceiv
ed (U
S$ m
illio
n)
Selected humanitarian indicators
* See technical note for Figure 2.

104
Selected humanitarian indicators
Focus country 2011 2010 2010-2015
2011 2011 2011 2011 2002-2011
2002-2011
2011 Latest year Latest year Latest year 2000-2010
2011 2010 Latest year 2010 2011 2011 2010 2011
Niger 16.1 18 3.7 186 2.3 4,262,000 3,015,130 8.938 2 425 43.62 6.77 39.9 54.7 143 0.019 49 27.01 66.41 47.94 176.52
Nigeria 162.6 49 2.6 156 6.7 - 51,647 0.128 9 10,335 67.98 107.70 26.7 51.9 143 0.395 58 58.58 302.15 12.90 19.84
occupied Palestinian territory 4.2 74 3.1 114 - 2,514,398 - - 10 0* 0.04 0.00 2.2 72.8 22 - 85 45.79 - 623.08 442.05
Pakistan 177.0 36 2.1 145 2.4 5,400,000 5,401,000 2.081 9 2,781,067 21.04 36.52 31.3 65.4 87 0.813 92 61.61 147.10 17.28 482.84
Papua New Guinea 7.0 12 2.4 153 9.0 - 0 0.436 0 9,378 35.79 2.45 18.1 62.8 61 0.05 40 34.22 480.38 74.57 1.11
Peru 29.4 77 1.3 80 6.9 - 837,148 1.931 4 1,638 4.91 1.43 4.5 74.0 19 0.92 85 110.41 1,118.01 - 14.35
Philippines 94.9 49 1.8 112 3.7 375,000 11,723,244 5.777 10 159,716 18.42 17.18 20.7 68.7 29 1.153 92 91.99 370.91 5.68 33.59
Russian Federation 142.8 74 -0.2 66 4.3 - 14,169 0.108 10 221,779 - - - 68.8 12 4.3089 97 179.31 3,855.00 - 2.68
Rwanda 10.9 19 3.0 166 8.6 - 3,588 0.954 5 64,145 63.17 6.71 18 55.4 91 0.024 65 40.63 149.02 97.15 12.61
Samoa 0.2 20 0.6 99 2.1 - 0 0.287 - - - - - 72.4 20 0.48 96 91.43 1,267.74 804.29 0.76
Sao Tome and Principe 0.2 62 2.2 144 4.9 - - - - 0 28.18 0.05 14.4 64.7 80 0.49 89 68.26 476.84 297.83 0.00
Senegal 12.8 42 2.9 155 2.6 - 855,214 1.401 4 22,907 33.50 4.17 14.5 59.3 75 0.059 72 73.25 227.32 74.53 3.26
Seychelles 0.1 53 0.4 52 5.0 - 0 1.958 - 0 0.25 0.00 - 73.6 14 1.51 - 145.71 4,111.58 383.39 0.00
Sierra Leone 6.0 39 2.4 180 6.0 - 0 0.039 0 8,156 53.37 3.13 21.3 47.8 174 0.016 55 35.63 68.31 79.56 12.78
Somalia 9.6 37 2.6 - - 3,200,000 2,800 8.599 10 1,365,183 - - 32.8 51.2 180 0.035 29 6.85 - 53.31 1,340.11
South Sudan - - - - - 3,316,425 - - 10 666,178 - - - - - - - - - - 476.98
Sri Lanka 21.1 15 0.9 97 8.3 1,256,900 294,943 2.150 7 285,735 7.04 1.47 21.6 74.9 17 0.492 91 87.05 379.24 27.80 163.70
Sudan (the) 44.7 33 2.6 169 -4.9 11,544,400 0 1.271 10 2,898,246 19.80 8.62 31.7 61.5 103 0.28 58 56.25 227.99 46.99 887.52
Swaziland 1.2 21 1.7 140 1.3 - 0 3.496 - 759 40.63 0.48 7.3 48.7 78 0.16 71 63.70 777.86 77.10 0.37
Syrian Arab Republic 20.8 56 1.9 119 - - 0 0.625 1 988,275* 1.71 0.35 10.1 75.9 16 1.5 90 63.17 665.72 6.61 37.26
Tajikistan 7.0 27 1.7 127 7.4 - 2,130 4.727 2 7,651 6.56 0.45 15 67.5 63 2.10 64 90.64 - 62.45 8.34
Timor-Leste 1.2 28 3.2 147 10.6 - 0 0.096 0 2 37.44 0.42 45.3 62.5 81 0.1 69 53.23 2,307.15 259.26 0.00
Togo 6.2 38 2.3 162 3.9 - 0 0.468 1 19,723 38.68 2.33 20.5 57.1 103 0.053 61 50.45 112.63 37.82 2.19
Uganda 34.6 15 3.4 161 6.7 - 732,075 1.041 10 288,519 38.01 12.70 16.4 54.1 99 0.117 72 48.38 79.51 51.56 51.75
United Republic of Tanzania 46.2 26 3.1 152 6.3 - 1,059,000 1.513 0 294,204 67.87 30.43 16.2 58.2 92 0.008 53 55.53 107.08 65.95 28.05
Yemen 24.8 32 3.3 154 -10.5 2,500,000 0 0.011 3 573,937 17.53 4.22 43.1 65.5 77 0.3 55 47.05 291.72 27.61 293.61
Zimbabwe 12.8 38 2.4 173 9.3 9,000,000 1,140 3.076 1 59,675 - - 14 51.4 80 0.16 80 72.13 188.49 57.95 229.50
UN
DES
APo
pul
atio
n (m
illio
n)
UN
DES
APo
pul
atio
n liv
ing
in u
rban
ar
eas
(%)
UN
DES
AA
nnua
l ave
rag
e p
opul
atio
n g
row
th r
ate
(%)
UN
DP
Hum
an D
evel
opm
ent
Ind
ex
Ran
k (o
ut o
f 187
)
Wor
ld B
ank
GD
P g
row
th r
ate
(%)
Inte
r-ag
ency
ap
pea
l d
ocum
ents
Num
ber
of p
eop
le t
arg
eted
fo
r hu
man
itaria
n as
sist
ance
in
inte
r-ag
ency
ap
pea
l
EM-D
AT
Num
ber
of p
eop
le a
ffec
ted
b
y na
tura
l dis
aste
rs
EM-D
AT
Prop
ortio
n of
the
p
opul
atio
n af
fect
ed
annu
ally
by
natu
ral d
isas
ters
(1
0 ye
ar a
vera
ge
%)
UC
DP
Num
ber
of l
ast
10 y
ears
ex
per
ienc
ing
act
ive
confl
ict
UN
HC
RTo
tal p
opul
atio
n of
con
cern
to
UN
HC
R
Wor
ld B
ank
Pove
rty
head
coun
t ra
tio
at U
S$1.
25 a
day
(% o
f p
opul
atio
n)
Wor
ld B
ank
Num
ber
of p
eop
le li
ving
b
elow
US$
1.25
per
day
(m
illio
n)
WH
O
Mal
nutr
ition
pre
vale
nce,
w
eig
ht fo
r ag
e (%
of
child
ren
und
er 5
)
UN
DES
ALi
fe e
xpec
tanc
y (y
ears
)
UN
ICEF
Und
er-5
mor
talit
y ra
te (p
er
1,00
0 liv
e b
irths
)
WH
OD
ensi
ty o
f phy
sici
ans
(per
1,
000
pop
ulat
ion)
WH
O /
U
NIC
EFPo
pul
atio
n us
ing
imp
rove
d
drin
king
-wat
er s
ourc
es (%
)
ITU
Mob
ile c
ellu
lar
sub
scrip
tions
per
100
in
hab
itant
s
Wor
ld B
ank
Gov
ernm
ent
reve
nues
p
er c
apita
(US$
)
OEC
D D
AC
Offi
cial
Dev
elop
men
t A
ssis
tanc
e p
er c
apita
(US$
)
OC
HA
FTS
Hum
anita
rian
fund
ing
re
ceiv
ed (U
S$ m
illio
n)
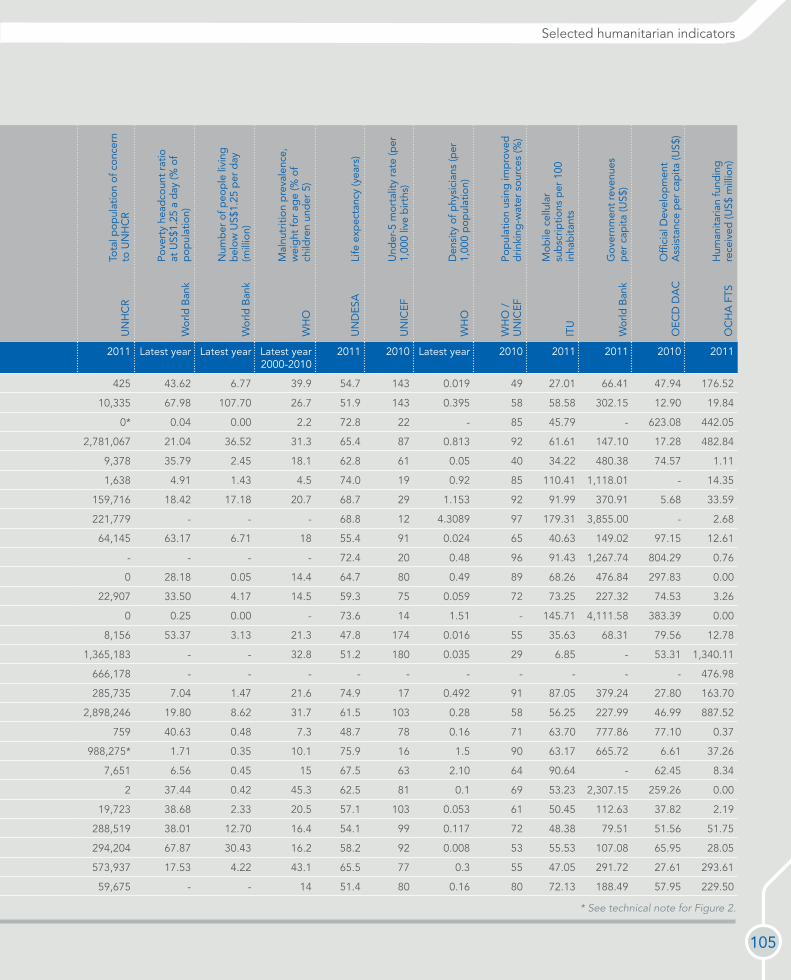
105
Focus country 2011 2010 2010-2015
2011 2011 2011 2011 2002-2011
2002-2011
2011 Latest year Latest year Latest year 2000-2010
2011 2010 Latest year 2010 2011 2011 2010 2011
Niger 16.1 18 3.7 186 2.3 4,262,000 3,015,130 8.938 2 425 43.62 6.77 39.9 54.7 143 0.019 49 27.01 66.41 47.94 176.52
Nigeria 162.6 49 2.6 156 6.7 - 51,647 0.128 9 10,335 67.98 107.70 26.7 51.9 143 0.395 58 58.58 302.15 12.90 19.84
occupied Palestinian territory 4.2 74 3.1 114 - 2,514,398 - - 10 0* 0.04 0.00 2.2 72.8 22 - 85 45.79 - 623.08 442.05
Pakistan 177.0 36 2.1 145 2.4 5,400,000 5,401,000 2.081 9 2,781,067 21.04 36.52 31.3 65.4 87 0.813 92 61.61 147.10 17.28 482.84
Papua New Guinea 7.0 12 2.4 153 9.0 - 0 0.436 0 9,378 35.79 2.45 18.1 62.8 61 0.05 40 34.22 480.38 74.57 1.11
Peru 29.4 77 1.3 80 6.9 - 837,148 1.931 4 1,638 4.91 1.43 4.5 74.0 19 0.92 85 110.41 1,118.01 - 14.35
Philippines 94.9 49 1.8 112 3.7 375,000 11,723,244 5.777 10 159,716 18.42 17.18 20.7 68.7 29 1.153 92 91.99 370.91 5.68 33.59
Russian Federation 142.8 74 -0.2 66 4.3 - 14,169 0.108 10 221,779 - - - 68.8 12 4.3089 97 179.31 3,855.00 - 2.68
Rwanda 10.9 19 3.0 166 8.6 - 3,588 0.954 5 64,145 63.17 6.71 18 55.4 91 0.024 65 40.63 149.02 97.15 12.61
Samoa 0.2 20 0.6 99 2.1 - 0 0.287 - - - - - 72.4 20 0.48 96 91.43 1,267.74 804.29 0.76
Sao Tome and Principe 0.2 62 2.2 144 4.9 - - - - 0 28.18 0.05 14.4 64.7 80 0.49 89 68.26 476.84 297.83 0.00
Senegal 12.8 42 2.9 155 2.6 - 855,214 1.401 4 22,907 33.50 4.17 14.5 59.3 75 0.059 72 73.25 227.32 74.53 3.26
Seychelles 0.1 53 0.4 52 5.0 - 0 1.958 - 0 0.25 0.00 - 73.6 14 1.51 - 145.71 4,111.58 383.39 0.00
Sierra Leone 6.0 39 2.4 180 6.0 - 0 0.039 0 8,156 53.37 3.13 21.3 47.8 174 0.016 55 35.63 68.31 79.56 12.78
Somalia 9.6 37 2.6 - - 3,200,000 2,800 8.599 10 1,365,183 - - 32.8 51.2 180 0.035 29 6.85 - 53.31 1,340.11
South Sudan - - - - - 3,316,425 - - 10 666,178 - - - - - - - - - - 476.98
Sri Lanka 21.1 15 0.9 97 8.3 1,256,900 294,943 2.150 7 285,735 7.04 1.47 21.6 74.9 17 0.492 91 87.05 379.24 27.80 163.70
Sudan (the) 44.7 33 2.6 169 -4.9 11,544,400 0 1.271 10 2,898,246 19.80 8.62 31.7 61.5 103 0.28 58 56.25 227.99 46.99 887.52
Swaziland 1.2 21 1.7 140 1.3 - 0 3.496 - 759 40.63 0.48 7.3 48.7 78 0.16 71 63.70 777.86 77.10 0.37
Syrian Arab Republic 20.8 56 1.9 119 - - 0 0.625 1 988,275* 1.71 0.35 10.1 75.9 16 1.5 90 63.17 665.72 6.61 37.26
Tajikistan 7.0 27 1.7 127 7.4 - 2,130 4.727 2 7,651 6.56 0.45 15 67.5 63 2.10 64 90.64 - 62.45 8.34
Timor-Leste 1.2 28 3.2 147 10.6 - 0 0.096 0 2 37.44 0.42 45.3 62.5 81 0.1 69 53.23 2,307.15 259.26 0.00
Togo 6.2 38 2.3 162 3.9 - 0 0.468 1 19,723 38.68 2.33 20.5 57.1 103 0.053 61 50.45 112.63 37.82 2.19
Uganda 34.6 15 3.4 161 6.7 - 732,075 1.041 10 288,519 38.01 12.70 16.4 54.1 99 0.117 72 48.38 79.51 51.56 51.75
United Republic of Tanzania 46.2 26 3.1 152 6.3 - 1,059,000 1.513 0 294,204 67.87 30.43 16.2 58.2 92 0.008 53 55.53 107.08 65.95 28.05
Yemen 24.8 32 3.3 154 -10.5 2,500,000 0 0.011 3 573,937 17.53 4.22 43.1 65.5 77 0.3 55 47.05 291.72 27.61 293.61
Zimbabwe 12.8 38 2.4 173 9.3 9,000,000 1,140 3.076 1 59,675 - - 14 51.4 80 0.16 80 72.13 188.49 57.95 229.50
UN
DES
APo
pul
atio
n (m
illio
n)
UN
DES
APo
pul
atio
n liv
ing
in u
rban
ar
eas
(%)
UN
DES
AA
nnua
l ave
rag
e p
opul
atio
n g
row
th r
ate
(%)
UN
DP
Hum
an D
evel
opm
ent
Ind
ex
Ran
k (o
ut o
f 187
)
Wor
ld B
ank
GD
P g
row
th r
ate
(%)
Inte
r-ag
ency
ap
pea
l d
ocum
ents
Num
ber
of p
eop
le t
arg
eted
fo
r hu
man
itaria
n as
sist
ance
in
inte
r-ag
ency
ap
pea
l
EM-D
AT
Num
ber
of p
eop
le a
ffec
ted
b
y na
tura
l dis
aste
rs
EM-D
AT
Prop
ortio
n of
the
p
opul
atio
n af
fect
ed
annu
ally
by
natu
ral d
isas
ters
(1
0 ye
ar a
vera
ge
%)
UC
DP
Num
ber
of l
ast
10 y
ears
ex
per
ienc
ing
act
ive
confl
ict
UN
HC
RTo
tal p
opul
atio
n of
con
cern
to
UN
HC
R
Wor
ld B
ank
Pove
rty
head
coun
t ra
tio
at U
S$1.
25 a
day
(% o
f p
opul
atio
n)
Wor
ld B
ank
Num
ber
of p
eop
le li
ving
b
elow
US$
1.25
per
day
(m
illio
n)
WH
O
Mal
nutr
ition
pre
vale
nce,
w
eig
ht fo
r ag
e (%
of
child
ren
und
er 5
)
UN
DES
ALi
fe e
xpec
tanc
y (y
ears
)
UN
ICEF
Und
er-5
mor
talit
y ra
te (p
er
1,00
0 liv
e b
irths
)
WH
OD
ensi
ty o
f phy
sici
ans
(per
1,
000
pop
ulat
ion)
WH
O /
U
NIC
EFPo
pul
atio
n us
ing
imp
rove
d
drin
king
-wat
er s
ourc
es (%
)
ITU
Mob
ile c
ellu
lar
sub
scrip
tions
per
100
in
hab
itant
s
Wor
ld B
ank
Gov
ernm
ent
reve
nues
p
er c
apita
(US$
)
OEC
D D
AC
Offi
cial
Dev
elop
men
t A
ssis
tanc
e p
er c
apita
(US$
)
OC
HA
FTS
Hum
anita
rian
fund
ing
re
ceiv
ed (U
S$ m
illio
n)
Selected humanitarian indicators
* See technical note for Figure 2.
User’s guide Limitations
This report is intended to provide as comprehensive an overview as possible of global humanitarian data and trends. However, there are many gaps and inconsistencies in the information available. There is no single, comprehensive source of humanitarian information and data. There are no widely used standards for measuring humanitarian needs or response, even less so the long term effectiveness of assistance. There are no agreed definitions of humanitarian needs or assistance.
Humanitarian emergencies and their drivers are extremely complex. By definition, crises are chaotic. They arise as a result of the interrelationships between multiple causes, which are not easily measured or understood. Political and practical difficulties can prevent the collection and sharing of information about humanitarian needs and response. Humanitarian assistance involves a plethora of actors, from affected people and communities themselves to local and national governments, civil society and international aid organizations. Different organizations account for what they do in different ways and the efforts of many actors are not reported at all. Some humanitarian actors may not be willing or able to share the information they collect. This often leads to biases in the information available.
In addition to these complexities, there are also technical limitations that affect the availability, consistency, reliability and comparability of data. There is a lack of common standards for data and sharing protocols. Statistical systems in many countries are still weak. Statistical methods, coverage, practices, and definitions differ widely. Comparison between countries and across time involves complex technical and conceptual problems that cannot be easily or unequivocally resolved. Data coverage may not be complete because of special circumstances affecting the collection and reporting of data, such as problems arising from conflicts. These factors are more prominent in countries that are experiencing or vulnerable to major humanitarian emergencies. Because of the limitations described, the data presented in this report should only be interpreted to indicate major trends and characterise major differences between emergencies and countries. Readers should consult the original sources for detailed information on the limitations of the data.
Data sources
This report presents a compilation of data from various sources, which are determined to be the most comprehensive and authoritative available. Much of the information is originally collected by governments and is compiled into global datasets by international organizations. Some is collected directly by international organizations and research institutes, or gathered from other third party sources. The following is a brief description of the source organizations and the data they make available. Readers are directed to those organizations for additional data and information. The exact reference of the specific data presented in this report is given on page 44.
Centre for Research on the Epidemiology of Disasters International Disaster Database (CRED EM-DAT). The EM-DAT disaster database contains data on over 18,000 disasters from 1900. It is compiled from various sources, including United Nations agencies, non-governmental organizations, insurance companies, research institutes and press agencies. Data in this report is based on version v12.07. See http://www.emdat.be/.
Development Initiatives (DI). DI is an independent organization providing information and analysis that supports action on poverty. The Global Humanitarian Assistance programme at DI is a leading centre of research and analysis on international financing flows to situations of humanitarian crisis. See http://www.devinit.org/.
Food and Agriculture Organization of the United Nations (UN FAO). FAO works to raise levels of nutrition, improve agricultural productivity, better the lives of rural populations and contribute to the growth of the world economy. It collates and disseminates a wide range of food and agricultural statistics. See http://www.fao.org/economic/ess/.
Inter-agency appeal documents. The inter-agency appeal process brings aid organizations together to jointly plan, coordinate, implement and monitor their response to natural disasters and complex emergencies. The appeal process results in appeal documents, which contain information on the number of people affected by emergencies, their needs and the funding required
106
to respond to those needs. OCHA facilitates the appeal process. See http://www.unocha.org/cap/.
International Telecommunication Union (ITU). ITU is the United Nations specialized agency for information and communication technologies (ICTs). It collects, manages and disseminates data on ICT infrastructure, access and use. See http://www.itu.int/ITU-D/ict/statistics/.
Organisation for Economic Co-operation and Development Development Assistance Committee (OECD DAC). The OECD’s DAC is a forum for selected OECD member states to discuss issues surrounding aid, development and poverty reduction. OECD DAC provides comprehensive data on the volume, origin and types of aid and other resource flows to over 180 aid recipients. See http://www.oecd.org/dac/stats/idsonline.
Overseas Development Institute (ODI). ODI is an independent think tank on international development and humanitarian issues. It does not systematically collect data but uses quantitative analysis in its various research products. See http://www.odi.org.uk.
United Nations Children’s Fund (UNICEF). UNICEF provides long-term humanitarian and development assistance to children and mothers in developing countries. It tracks progress through data collection and analysis and updates global databases. See http://www.unicef.org/statistics/.
United Nations Department of Economic and Social Affairs (UNDESA). UNDESA works to promote development and works on issues including poverty reduction, population, macroeconomic policy, development finance, and sustainable development. It generates and compiles a wide range of data and information on development issues. See http://unstats.un.org/unsd/.
United Nations Development Programme (UNDP). UNDP supports countries to reach their own development objectives and internationally agreed goals, including the Millennium Development Goals. It collects, analyses and disseminates human development data, including through preparation of the Human Development Index (HDI) and its components. See http://hdr.undp.org/en/statistics/.
United Nations High Commissioner for Refugees (UNHCR). UNHCR is mandated to lead and coordinate
international action to protect refugees and resolve refugee problems worldwide. It provides data and statistics about people of concern to UNHCR, including refugees, asylum-seekers, returned refugees, the internally displaced and stateless people. See http://www.unhcr.org/statistics.
United Nations Human Settlements Programme (UN-HABITAT). UN-Habitat promotes socially and environmentally sustainable towns and cities. It collects, analyses and disseminates human settlements statistics. See http://www.unhabitat.org/stats/.
United Nations Office for the Coordination of Humanitarian Affairs Financial Tracking Service (UN OCHA FTS). FTS is a global, real-time database that records all reported international humanitarian aid – including that for NGOs and the Red Cross/Red Crescent Movement, bilateral aid, in-kind aid, and private donations. FTS features a special focus on Consolidated Appeals and Flash Appeals. All FTS data is provided by donors or recipient organizations. FTS is managed by UN OCHA. See http://fts.unocha.org.
Uppsala Conflict Data Program (UCDP). UCDP collects information on a large number of aspects of violence and conflict. It is one of the most accurate and widely-used data sources on global armed conflicts. See http://www.pcr.uu.se/research/ucdp/.
World Bank. The World Bank provides financial and technical assistance to developing countries. It provides access to a comprehensive set of data about all aspects of development. It also works to help developing countries improve the capacity, efficiency and effectiveness of national statistical systems. See http://data.worldbank.org/.
World Food Programme (WFP). WFP is the United Nations frontline agency mandated to combat global hunger. It publishes data, including on the number of people it targets and reaches with food assistance, food aid flows and food and commodity prices. See http://www.wfp.org/.
World Health Organization (WHO). WHO is the directing and coordinating authority for health within the United Nations system. It provides access to data and analyses for monitoring the global health situation, including through its Global Health Observatory. See http://apps.who.int/gho/data/.
107
Technical notes
CountriesThe term ‘country’ refers to any territory for which authorities or other organizations report separate statistics. It does not necessarily imply political independence. Because of the secession in July 2011 of the Republic of South Sudan from the Republic of the Sudan, and its subsequent admission to the United Nations on 14 July 2011, disaggregated data for Sudan and South Sudan as separate States are not yet available for most indicators. Aggregated data presented are for Sudan pre-secession.
Focus CountriesA group of 79 ‘Focus Countries’ is referenced in various figures throughout the document as a point of comparison against regional groupings. Selected humanitarian indicators are also presented for these countries. Focus Countries have met at least one of the following criteria since 2005: 1) inter-agency appeal issued (excluding countries that met this criterion only as a result of an emergency in a neighbouring country); 2) cluster approach implemented; 3) OCHA presence. The inclusion of a country in the group of Focus Countries does not necessarily indicate that there is a current humanitarian emergency in that country. Conversely, the exclusion of a country from the list does not indicate the absence of humanitarian needs in that country.
Regions and country groupingsRegional groupings are based on the United Nations classification of major world regions – Africa, Americas, Asia, Europe, Oceania (http://unstats.un.org/unsd/methods/m49/m49regin.htm). For the purposes of this report, Africa has been disaggregated into North Africa and sub-Saharan Africa and Americas has been disaggregated into Latin America and the Caribbean and North America. Sub-regions are used in some cases, according to the United Nations classifications. Where the original data source is not a United Nations entity, regional groupings are those of the source organization.
Income groups are based on the World Bank classification (http://data.worldbank.org/about/country-classifications). Countries are divided according to 2011 GNI per capita, calculated using the World Bank Atlas method. The groups are: low income, US$1,025 or less; lower middle income, US$1,026 - US$4,035; upper middle income, US$4,036 - US$12,475; and high income, US$12,476
or more. Low-income and middle-income countries are sometimes referred to as developing countries.
‘Fragile states’ is the term used for countries facing particularly severe development challenges: weak institutional capacity, poor governance, and political instability. Countries are classified as fragile states according to the OECD International Network on Conflict and Fragility (INCAF), based on a compilation of two lists: the 2009 Harmonised List of Fragile Situations (World Bank, African Development Bank, Asian Development Bank) and the 2009 Fund for Peace Failed States Index (“alert” and “warning” categories). In 2011, 45 countries were classified as fragile states according to these criteria.
Humanitarian fundingHumanitarian aid – Includes the aid and actions designed to save lives, alleviate suffering and maintain and protect human dignity during and in the aftermath of emergencies. The characteristics that mark it out from other forms of assistance are: 1) it is intended to be governed by the principles of humanity, neutrality, impartiality and independence; 2) it is intended to be ‘short term’ in nature and provide for activities during and in the immediate aftermath of an emergency. In practice, these phases are difficult to define, especially in protracted emergencies or situations of chronic vulnerability. Humanitarian aid can also include risk reduction and preparedness activities, as well as recovery. Humanitarian aid is given by governments, individuals, NGOs, multilateral organizations, domestic organizations and private companies. Different actors have different definitions of what is ‘humanitarian’ and some may not differentiate humanitarian aid from other forms of assistance. For the purposes of this report, aid is considered to be humanitarian if it is reported as such by the actor that provides it.
Humanitarian aid contributions from governments in this report include:
1) The humanitarian aid expenditure of the 24 OECD DAC members (Australia, Austria, Belgium, Canada, Denmark, Finland, France, Germany, Greece, Ireland, Italy, Japan, Korea, Luxembourg, the Netherlands, New Zealand, Norway, Portugal, Spain, Sweden, Switzerland, the United Kingdom, the United States and the European Commission) as reported to the OECD DAC as part of an annual obligation to report on Official Development
108

Assistance (ODA) flows. Data for members of the OECD DAC includes their bilateral humanitarian aid contributions plus ODA flows to the United Nations High Commissioner for Refugees (UNHCR), UN Relief and Works Agency for Palestine Refugees in the Near East (UNRWA) and the World Food Programme (WFP) up to 2010. Data for 2011 is an estimate based on partial preliminary data releases and estimated core ODA contributions to UNHCR, UNRWA and WFP. Data for OECD DAC members is based on 2010 constant prices;
2) Expenditure by non-OECD DAC member governments, which includes all other government humanitarian aid, as captured by the UN OCHA FTS (current prices).
Official Development Assistance (ODA) – Comprises a grant or loan from an ‘official’ source to a developing country (as defined by the OECD) or multilateral agency (as defined by the OECD) for the promotion of economic development and welfare. It is reported by members of the DAC, along with several other government donors and institutions, according to strict criteria. Humanitarian aid typically accounts for around 10 per cent of total ODA each year.
Humanitarian appealsIn order to raise money for humanitarian activities, humanitarian organizations often issue appeals. Appeals may contain information on the number of people affected by emergencies, the proposed activities of humanitarian organizations to respond to those needs and the funding required. After major new emergencies or to respond to ongoing crises, humanitarian organizations may participate in an ‘inter-agency’ appeal process. This process brings aid organizations together to jointly plan, coordinate, implement and monitor their response to emergencies. The inter-agency appeal process is led at the country level by the Humanitarian Coordinator in collaboration with the Humanitarian Country Team. Types of inter-agency appeals include:
1) Consolidated Appeals, which are used when several organizations appeal together for funds for the same crisis. The Consolidated Appeal Process (CAP) is a tool used by aid organizations to plan, coordinate, fund, implement and monitor their activities. Consolidated Appeals last for as long as necessary. An appeal can be issued for one year or more. Projects included can be planned for more than a year, but their budgets must be broken into 12-month periods.
2) Flash Appeals, which are used for structuring a coordinated humanitarian response for the first three to six months of an emergency. Flash Appeals are issued within one week of an emergency and are triggered by the Humanitarian Coordinator in consultation with all stakeholders. The appeal provides a concise overview of urgent life-saving needs, and may include recovery projects that can be implemented within the appeal’s time frame.
For the purposes of this report, inter-agency appeals that are not termed Consolidated Appeals or Flash Appeals but follow similar principles and processes are also included.
Years, symbols and conventions
The most recent year for which complete data is available at the time of publication is 2011. Where data from 2011 is not available the latest year is shown and this is noted.
The use of a dash ( - ) means that data is not available or that aggregates cannot be calculated because of missing data in the years shown.
0 or 0.0 means zero or small enough that the number would round to zero at the number of decimal places shown.
A billion is 1,000 million.
109

110
Technical notes by figure
Figure 1. Total is based on number of people targeted by inter-agency appeals and by WFP emergency and protracted relief operations. The latter are included in inter-agency appeals so are only used for countries with no inter-agency appeal. Totals include an estimate for the West Africa appeal based on deductions from available appeal documents. Number of people below US$1.25 a day indicator is a calculation based on World Bank poverty headcount ratio at US$1.25 a day and UNDESA population data. Data on people living in fragile states is calculated based on UNDESA population data and OECD DAC International Network on Conflict and Fragility (INCAF) list of fragile states in 2011.
Figure 2. The Consolidated Appeal for West Africa (which covered Benin, Burkina Faso, Cape Verde, Côte d’Ivoire, Gambia, Ghana, Guinea, Guinea-Bissau, Liberia, Mali, Mauritania, Nigeria, Senegal, Sierra Leone, Togo) is not included because indicators could not be aggregated across countries. Key indicators for these countries in 2011 can be found in the appeal document. Number of people below US$1.25 a day indicator is a calculation based on World Bank poverty headcount ratio at US$1.25 a day and UNDESA population data. Prevalence of child malnutrition is the percentage of children under age 5 whose weight for age is more than two standard deviations below the median for the international reference population ages 0-59 months. Conflict data relates to armed conflict incidences between opposing actors (or in the case of one-sided violence, a conflict actor and civilians) resulting in 25 or more battle-related deaths per calendar year. UNHCR does not have a mandate to work with Palestine refugees in Jordan, Lebanon, Syria or the occupied Palestinian territory. UNRWA (the United Nations Relief and Works Agency for Palestine Refugees in the Near East) provides assistance, protection and advocacy for registered Palestine refugees in the above areas. UNWRA maintains statistics about registered refugees in its areas of operations.
Figure 3. Figures presented are calculations based on data from the original source/s.
Figure 5. Total humanitarian funding figures are based on funds reported within a calendar year.
Figure 6. 10-year average is from 2002-2011. Inter-agency appeals include flash and other appeals. Data is compiled by OCHA on the basis of information provided by donors and appealing organizations.
Figure 7. 10-year average is from 2002-2011. Sectors are those designated in the inter-agency appeal process.
Figure 9. Countries listed are those that have participated in the Consolidated Appeals Process in at least four years since 2005. Côte d’Ivoire and Liberia also participated in the West Africa Regional Appeal, including in years when they did not have an individual appeal. Data reflects appeal status as of October 2012.
Figure 10, 11, 12, 13 and 14. Figures presented are calculations based on data from the original source/s.
Figure 15. Categories listed are established by UNHCR.
Figure 16. Regions are based on classifications in the UNHCR dataset.
Figure 18. Undernourishment refers to the condition of people whose dietary energy consumption is continuously below a minimum dietary energy requirement for maintaining a healthy life and carrying out a light physical activity with an acceptable minimum body-weight for attained-height.
Figure 19. An improved drinking-water source is defined as one that, by nature of its construction or through active intervention, is protected from outside contamination, in particular from contamination with faecal matter.
Figure 20. Percentage of people living below US$1.25 a day is at 2005 international prices. Regions are based on World Bank classifications.
Figure 21. Number of people living below US$1.25 indicator is a calculation based on World Bank poverty headcount ratio at US$1.25 a day and UNDESA population data. Regions are based on World Bank classifications.
Figure 23. “Focus Countries” refers to the average of the group of 79 countries of interest to humanitarians, presented in this figure as a point of comparison against regional breakdowns – see the technical note for further information.

111
Figure 25. Tracking humanitarian funding from donor to intended recipient is problematic. It is only possible to track funding to first level recipients so not all funding flows can be quantified. Inflows may not always match outflows due to reporting gaps and inconsistencies and because not all funds received will be disbursed in the same calendar year. The Common Humanitarian Funds (CHFs), Emergency Response Fund (ERFs), Central Emergency Response Fund (CERF) and ‘other pooled funds’ comprise the total set of pooled funding mechanisms used to finance humanitarian projects.
Figure 29. Figures presented are calculations based on data from the original source/s.
Figure 30. Data for members of the OECD DAC includes their bilateral humanitarian aid contributions plus core official development assistance (ODA) to the United Nations High Commissioner for Refugees (UNHCR), UN Relief and Works Agency for Palestine Refugees in the Near East (UNRWA) and the World Food Programme (WFP) up to 2010. Data for 2011 is an estimate based on partial preliminary data releases and estimated core ODA contributions to UNHCR, UNRWA and WFP. Data for OECD DAC members is based on 2010 constant prices. Data for non-OECD DAC member governments includes all other government humanitarian aid, as captured by the UN OCHA FTS (current prices). The distinction between these two groups of government donors is driven entirely by the data. Figures presented are calculations based on data from the original source.
Figure 31. EU12 includes Bulgaria, Cyprus, Czech Republic, Estonia, Hungary, Latvia, Lithuania, Malta, Poland, Romania, Slovakia and Slovenia. BRICS includes Brazil, Russian Federation, India, China and South Africa. Gulf States includes Kuwait, United Arab Emirates, Saudi Arabia and Qatar. Figures presented are calculations based on data from the original source/s.
Figures 32 and 33. Figures for 2006-2010 are based on research of a study set of NGOs, UN agencies and Red Cross organizations. The figure for 2011 is a preliminary projection. Private voluntary humanitarian aid financing include contributions from individuals, private foundations, trusts, private companies and corporations. Data is derived from a study set of humanitarian organizations including five UN agencies (UNHCR, UNRWA, WFP, WHO and UNICEF), 62 NGOs, the International Committee of the Red Cross (ICRC), the International Federation of Red
Cross and Red Crescent Societies (IFRC) and seven Red Cross national societies (Belgium, Canada, Colombia, Denmark, France, Sweden and the United Kingdom).
Figure 34. Figures presented are calculations based on data from the original source/s.
Figure 35. “Focus Countries” refers to the average of the group of 79 countries of interest to humanitarians, presented in this figure as a point of comparison against regional breakdowns – see the technical note for further information. The World Bank’s global remittance inflow data used in this report is based on data from IMF Balance of Payments Statistics Yearbook 2011 and data releases from central banks, national statistical agencies, and World Bank country desks. Values for 2011 are estimated.
Figure 36. Figures presented are calculations based on data from the original source/s.
Figures 37 and 38. “Focus Countries” refers to the average of the group of 79 countries of interest to humanitarians, presented in this figure as a point of comparison against regional breakdowns – see the technical note for further information.
References
Centre for Research on the Epidemiology of Disasters – CRED (2011). EM-DAT: The OFDA/CRED International Disaster Database, version 12.07. Available from: http://www.emdat.be/.
Food and Agriculture Organization of the United Nations – UN FAO (2011). FAO Food Price Index. Available from: http://faostat3.fao.org/.
Food and Agriculture Organization of the United Nations – UN FAO (2012). FAO Food Security Indicators in State of Food Insecurity in the World 2012. Available from: http://www.fao.org/.
International Bank for Reconstruction and Development – IBRD / The World Bank (2012). Global Monitoring Report 2012. Available from: http://go.worldbank.org/B8CQ09GOZ0.
Organisation for Economic Co-operation and Development Development Assistance Committee – OECD DAC (2011). International Development Statistics (IDS) online databases on aid and other resource flows. Available from: http://www.oecd.org/dac/stats/idsonline.
Overseas Development Institute (2012). Horizon 2025: Creative destruction in the aid industry. Available from: http://www.odi.org.uk/.
United Nations Department of Economic and Social Affairs – UNDESA (2011). World Population Prospects: The 2010 Revision. Available from: http://esa.un.org/wpp/index.htm.
United Nations Department of Economic and Social Affairs – UNDESA (2011). World Urbanization Prospects, the 2011 Revision. Available from: http://esa.un.org/unpd/wup/index.htm.
United Nations High Commissioner for Refugees – UNHCR (2011). UNHCR Statistical Online Population Database. Available from: http://www.unhcr.org/.
United Nations Human Settlements Programme – UN-HABITAT (2010). Global Urban Observatory Urban Indicators. Available from: http://www.unhabitat.org/.
United Nations Office for the Coordination of Humanitarian Affairs Financial Tracking Service – UN OCHA FTS (2011). 2011 Appeal Documents. Available from: http://www.unocha.org/cap/.
Uppsala Conflict Data Program – UCDP (2012). UCDP/PRIO Armed Conflict Dataset v.4-2012, UCDP Non-State Conflict Dataset v. 2.4-2012 and UCDP One-sided Violence Dataset v 1.4-2012. Available from: http://www.pcr.uu.se/.
World Bank (2011). Commodity Markets. Available from: http://econ.worldbank.org.
World Bank (2011). Migration and Remittances Data. Available from: http://go.worldbank.org/092X1CHHD0.
World Bank (Latest year available). World Development Indicators. Available from: http://data.worldbank.org/data-catalog/world-development-indicators.
World Food Programme – WFP (2011). Projected Needs for WFP Projects and Operations (Blue Book). Available from: http://www.wfp.org/operations/projected-needs/2011.
World Health Organization – WHO (Latest year available). Global Health Observatory World Health Statistics. Available from: http://www.who.int/gho/.
World Health Organization – WHO and United Nations Children’s Fund – UNICEF (2010). Joint Monitoring Programme for Water Supply and Sanitation. Available from: http://www.wssinfo.org/data-estimates/table/.
112

Acronyms
CAP – Consolidated Appeal Process
CERF – Central Emergency Response Fund
CRED EM-DAT – Centre for Research on the Epidemiology of Disasters – The International Emergency Disasters Database
DAC – Development Assistance Committee (OECD)
GDP – Gross Domestic Product
FTS – Financial Tracking Service (UN OCHA)
IFRC – International Federation of Red Cross and Red Crescent Societies
INCAF – International Network on Conflict and Fragility (OECD)
ITU – International Telecommunication Union
MYR – Mid-Year Review of Consolidated Appeals
ODA – Official Development Assistance
ODI – Overseas Development Institute
OECD – Organisation for Economic Co-operation and Development
oPt – occupied Palestinian territory
UCDP – Uppsala Conflict Data Program
UNDESA – United Nations Department of Economic and Social Affairs
UNDP – United Nations Development Programme
UN FAO – Food and Agriculture Organization of the United Nations
UNHCR – United Nations High Commissioner for Refugees
UNICEF – The United Nations Children’s Fund
UN OCHA – United Nations Office for the Coordination of Humanitarian Affairs
UNRWA – United Nations Relief and Works Agency for Palestine Refugees in the Near East
WFP – World Food Programme
WHO – World Health Organization
113


