weather forecasting in virtual reality - umd
TRANSCRIPT
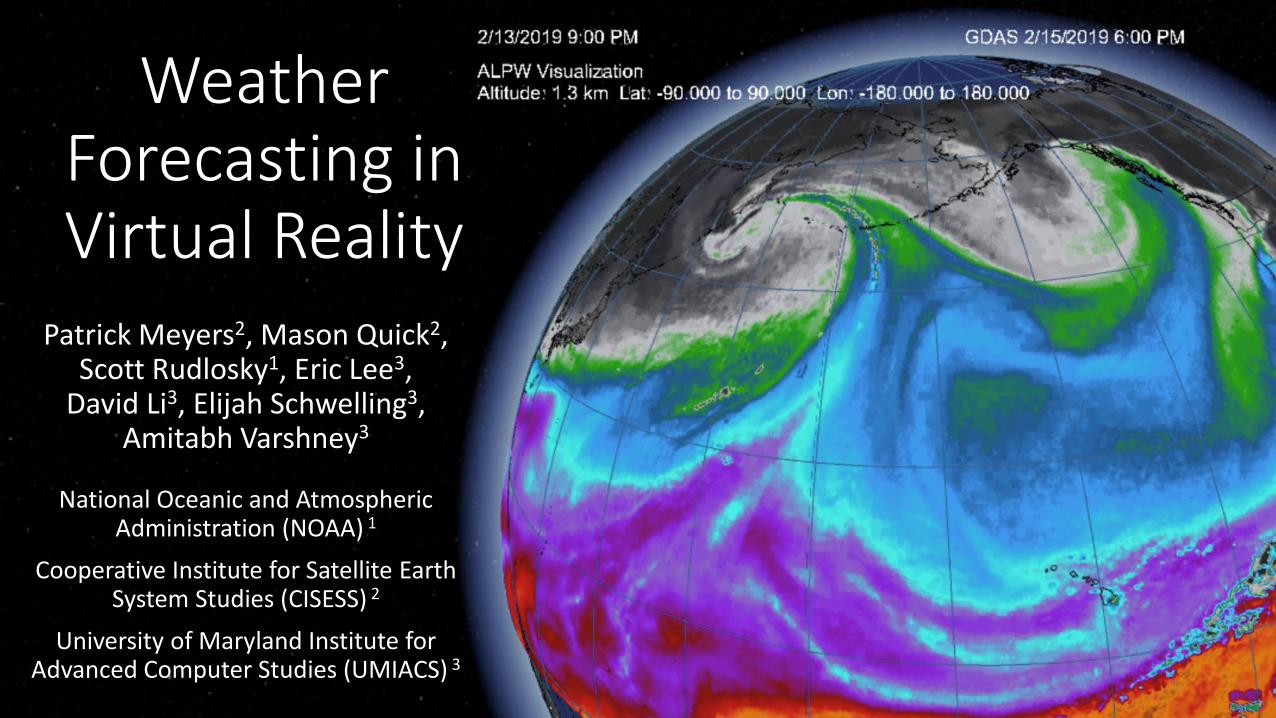
Weather Forecasting in Virtual Reality
Patrick Meyers2, Mason Quick2, Scott Rudlosky1, Eric Lee3,
David Li3, Elijah Schwelling3, Amitabh Varshney3
National Oceanic and Atmospheric Administration (NOAA) 1
Cooperative Institute for Satellite Earth System Studies (CISESS) 2
University of Maryland Institute for Advanced Computer Studies (UMIACS) 3
1

Objectives Identify scenarios where satellite products with enhanced
vertical resolution help address specific forecast challenges
Develop a series of VR demonstrations to gather forecaster feedback on the applicability of satellite products under various operational conditions
Advise on future vertical resolution requirements for 3-D satellite data in anticipation of future NWS forecaster needs
Weather Forecasting in Virtual RealityPI: Scott Rudlosky, NOAA/NESDIS/STAR
Narrated fly through available at https://youtu.be/wgo8RHTTrHc
Approach Begin building a research group focused on future integration
of NESDIS satellite products into NWS operations
Collaborate with NWS forecasters and VR experts at UMD, NASA/GSFC, and UCAR/COMET to demonstrate the value of 3-D satellite information in the warning and forecast process
Integrate UMD students and recent graduates to provide novel perspectives and the latest technology
Key Milestones Acquire and install hardware and software solutions (Dec 2018)
Assemble and formalize VR/AR Team (Feb 2019)
Define scenarios where VR/AR adds value (May 2019)
Develop and evaluate demonstration cases (Jul/Aug 2019)
Report on new 3-D satellite requirements (Sep 2019)
User feedback required before formal recommendations
2

Virtual Reality System• OCULUS Rift
• Headset with 6 DoF• Two 6 DoF Hand controllers
• Designed in Unity software• Visualization Techniques
• 2D texture mapping• 3D Volume Construction
• Layered 2D Data used to Interpolate continuous volume field
• Calculated during runtime• Volume Rendering
• 3D Meshed Volume Surface • Volumetric Raymarching
• Vector Field Simulation
OCULUS Rift
Unity Screen Capture
3

User Interaction• Data Sampling Tools
• Point sampling• Cross sections• Distance ruler• Adjustable thresholding• Text displays
• Navigation• Zoom• Rotation• Fly In (surface mode)• Loop Time Control
4
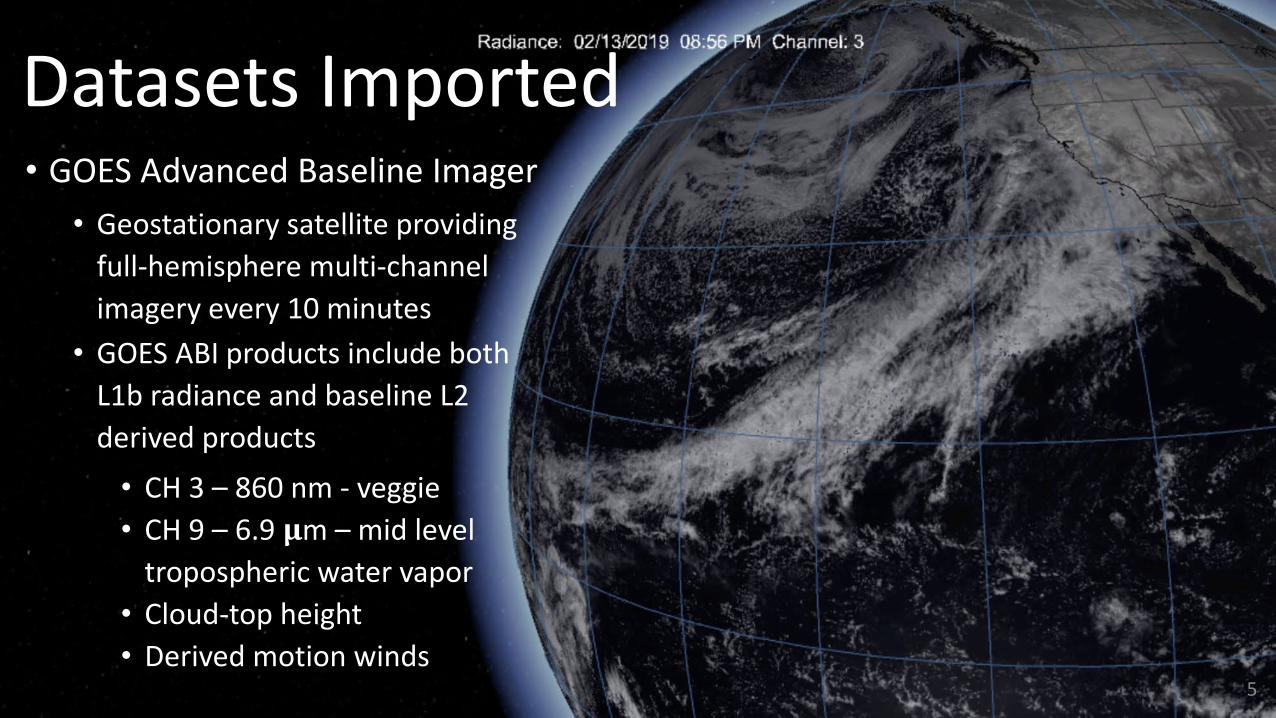
Datasets Imported• GOES Advanced Baseline Imager
• Geostationary satellite providing full-hemisphere multi-channel imagery every 10 minutes
• GOES ABI products include both L1b radiance and baseline L2 derived products
• CH 3 – 860 nm - veggie• CH 9 – 6.9 𝛍𝛍m – mid level
tropospheric water vapor• Cloud-top height• Derived motion winds
5

Datasets Imported• Advected Layered Precipitable
Water (ALPW)• Estimates the vertical distribution
of water vapor in the atmosphere• Produced by CIRA (non-operational,
but used by some NWS offices)• Derived from 7 low-earth orbiting
sounding satellites, using model winds to propagate moisture.
• 4 layers: sfc-850, 850-700, 700-500, 500-300mb
• 3 hourly, 16 km grid
6
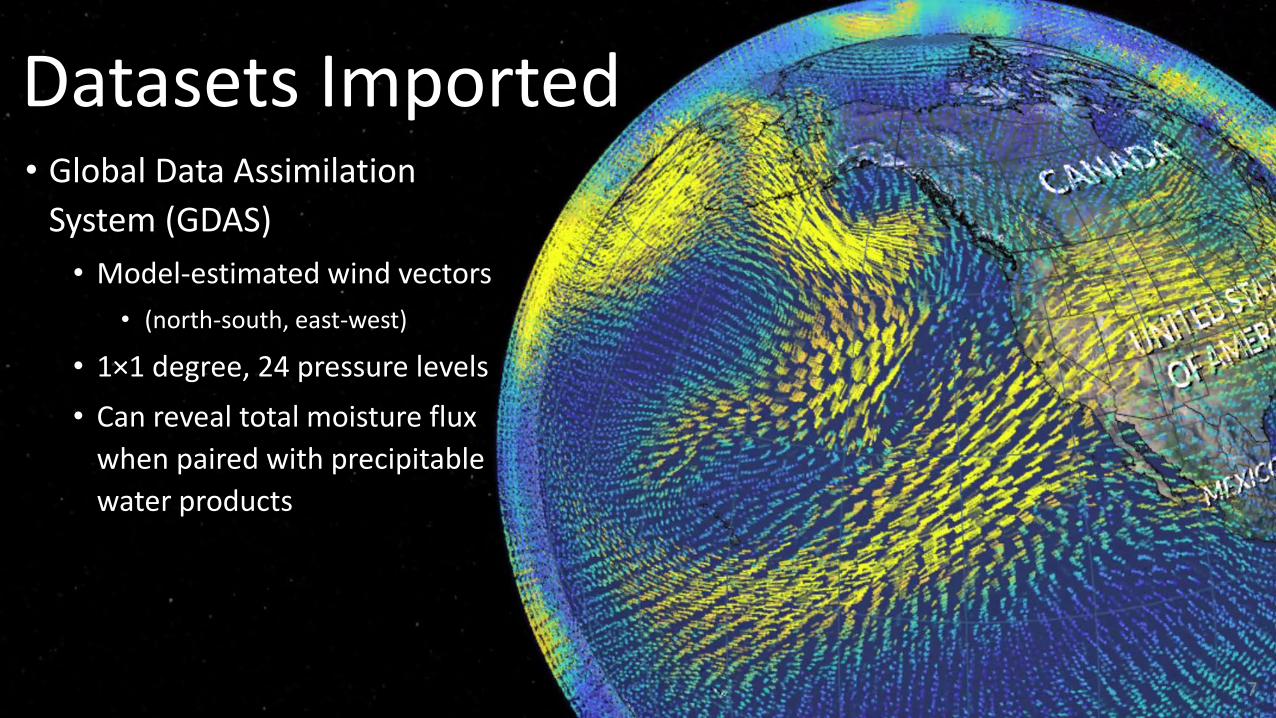
Datasets Imported• Global Data Assimilation
System (GDAS)• Model-estimated wind vectors
• (north-south, east-west)
• 1×1 degree, 24 pressure levels• Can reveal total moisture flux
when paired with precipitablewater products
7
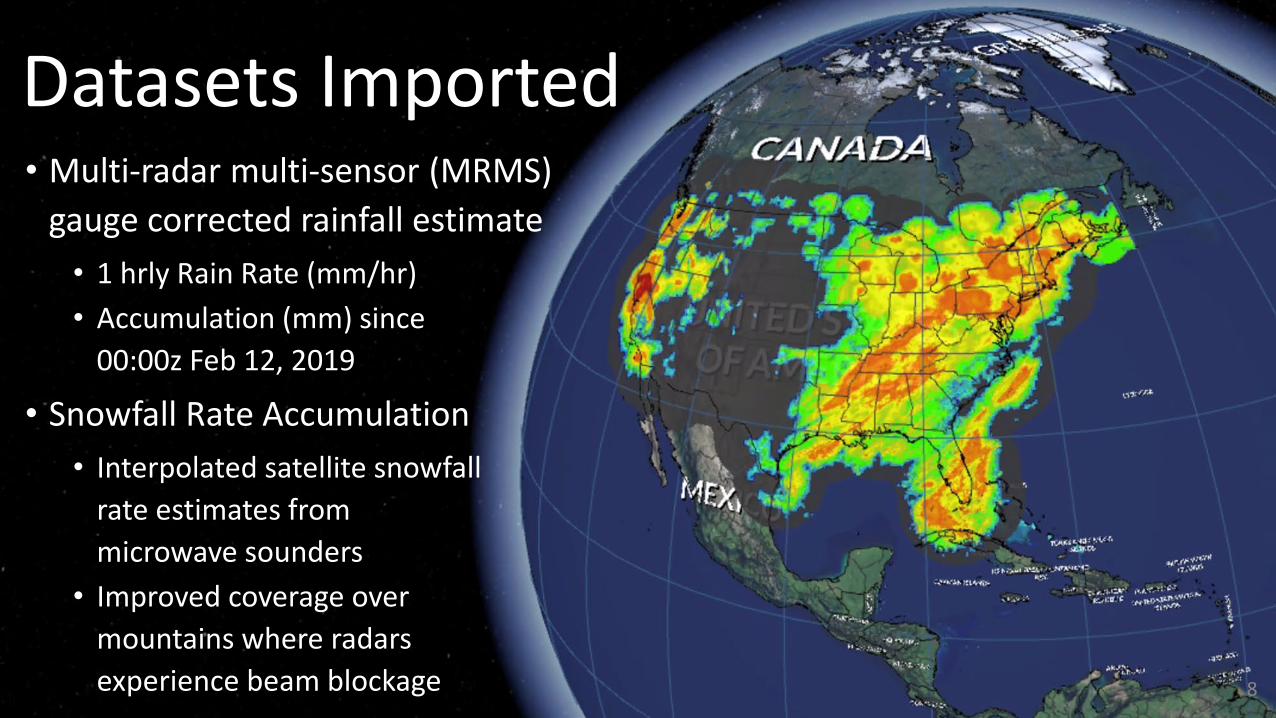
Datasets Imported• Multi-radar multi-sensor (MRMS)
gauge corrected rainfall estimate• 1 hrly Rain Rate (mm/hr)• Accumulation (mm) since
00:00z Feb 12, 2019
• Snowfall Rate Accumulation• Interpolated satellite snowfall
rate estimates from microwave sounders
• Improved coverage over mountains where radars experience beam blockage 8
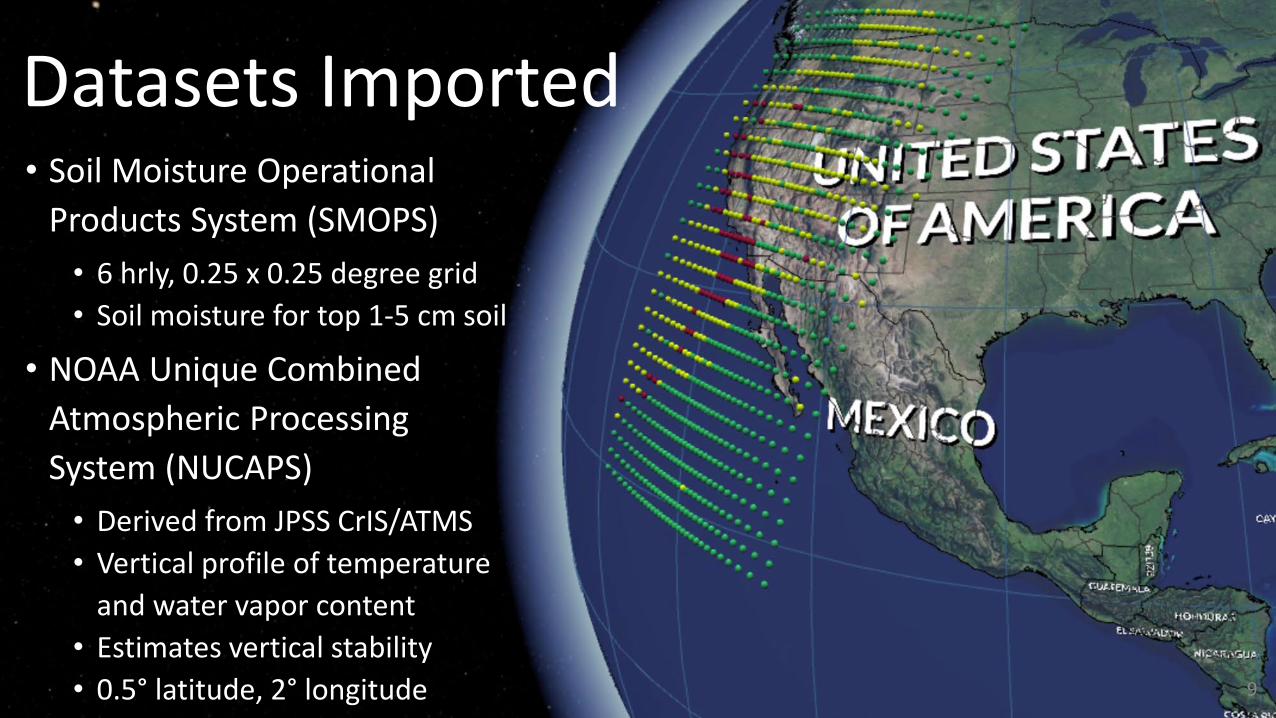
Datasets Imported• Soil Moisture Operational
Products System (SMOPS)• 6 hrly, 0.25 x 0.25 degree grid• Soil moisture for top 1-5 cm soil
• NOAA Unique Combined Atmospheric Processing System (NUCAPS)
• Derived from JPSS CrIS/ATMS• Vertical profile of temperature
and water vapor content• Estimates vertical stability • 0.5° latitude, 2° longitude 9

Atmospheric River Case Study• Corridor of moisture
stretching thousands of km from tropics to west coast of North America
• Atmospheric Rivers are associated with intense precipitation events associated with flooding and landslides
• AR occurred on 12-16 February 2019
• Vertically stacked winds advectmoisture over 4000 kilometers 10
Note: Unsteady screen capture results from the VR headset needing to be worn during video creation, have obtained a “mannequin” to steady future training videos

Atmospheric River Case Study• Winds perpendicular to
orography drive moist air upward over terrain
• Exceptionally high accumulated rainfall driven by this exceptional combination of atmospheric conditions
• Produced more than a foot of snow in Redding, CA
• 10.1 inches of rain at Palomar Observatory, wettest day ever recorded • Palm Springs had 3.68 inches, third heaviest 24-hour rainfall ever recorded• Numerous reports of washed-out and flooded roads and highways 11


Continued Work• Pursue additional funding to maximize impact (likely multi-source)• Build another video highlighting different datasets and tools/features• Perform formal user testing to gather forecaster feedback• Incorporate more datasets (e.g., dropsondes) and develop new case
studies (e.g., Hurricane Dorian)• Develop real time capability for future operational use (explore reading
directly from NWS AWIPS* feeds)• Investigate potential as a user training tool (provides a means for easily
packaging and sharing training simulations)*Advanced Weather Interactive Processing System (AWIPS) is the primary NWS forecasting software to examine satellite, radar, model, and ground observations (exclusively a 2D tool with no 3D rendering i.e., vertical scale/relations are unresolved) 13

Summary• Developed a versatile VR program to ingest and display various Earth
science / satellite datasets• New VR system allows users to view data in its native 3D format• Implemented tools that provide both qualitative and quantitative analysis • Continue working to understand the spatial and temporal resolution
needed from satellites to meet future forecaster needs and fully exploit future analysis capabilities
14