weare - morningstar, inc
TRANSCRIPT

1 9 9 9 A N N U A L R E P O R T
WE ARE
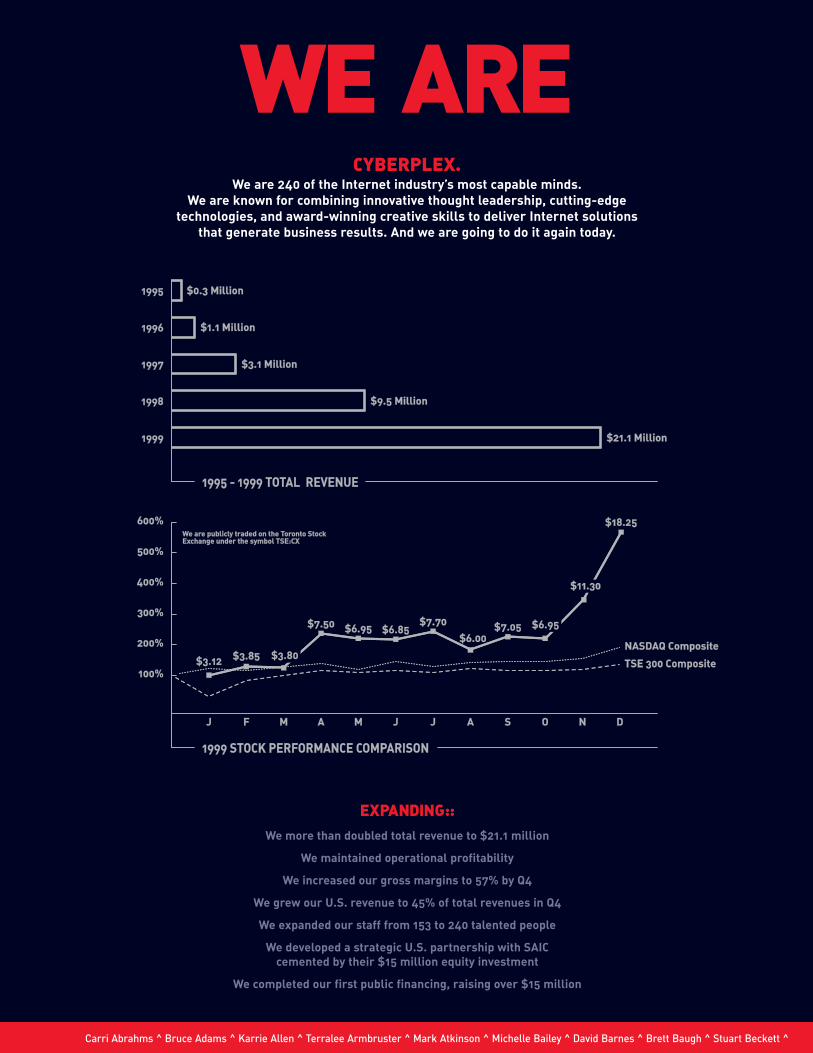
19991999 $21.1 Million$21.1 Million
19981998 $9.5 Million$9.5 Million
19971997 $3.1 Million$3.1 Million
19961996 $1.1 Million$1.1 Million
19951995 $0.3 Million$0.3 Million
1995 - 1999 T1995 - 1999 TOOTTAL REVENUE AL REVENUE
1999 ST1999 STOCK PERFOCK PERFORMANCE CORMANCE COMPOMPARISONARISON
JJ FF MM AA MM JJ JJ AA SS OO NN DD
$3.12$3.12100%100%
200%200%
300%300%
400%400%
500%500%
600%600%
NASDNASDAAQ CompositQ Compositee
TSE 300 CompositTSE 300 Compositee$3.85$3.85
$7.50$7.50 $6.95$6.95 $6.85$6.85$7.70$7.70
$6.00$6.00$7.05$7.05
$3.80$3.80
$6.95$6.95
$11.30$11.30
$18.25$18.25WWe are are publicle publicly try traded on the Taded on the Tororontonto Sto StockockExExchange under the symbol TSE:Cchange under the symbol TSE:CXX
Carri Abrahms ^ Bruce Adams ^ Karrie Allen ^ Terralee Armbruster ^ Mark Atkinson ^ Michelle Bailey ^ David Barnes ^ Brett Baugh ^ Stuart Beckett ^
EXPANDING::We more than doubled total revenue to $21.1 million
We maintained operational profitability
We increased our gross margins to 57% by Q4
We grew our U.S. revenue to 45% of total revenues in Q4
We expanded our staff from 153 to 240 talented people
We developed a strategic U.S. partnership with SAIC cemented by their $15 million equity investment
We completed our first public financing, raising over $15 million
CYBERPLEX.We are 240 of the Internet industry’s most capable minds.
We are known for combining innovative thought leadership, cutting-edge technologies, and award-winning creative skills to deliver Internet solutions
that generate business results. And we are going to do it again today.
WE ARE

Randall Bier ^ Peter Bier ^ Luke Blaikie ^ Andrew Blair ^ Megan Blanchard ^ Jeff Blanding ^ Aleksandar Bojicic ^ Damien Boyes ^ Daryl Brewer ^
FOLLOW US.
<2>
Carol Broderick ^ Rob Brown ^ Faith Buott ^ Aaron Burr ^ Alyssa Burton ^ Warran Butler ^ Tyler Campbell ^ Gil Canare ^ Suzanne Carlaw ^ Kelly Carroll ^
we were happy to spread the good news. Without question,
it was a great year full of fun and excitement. A year rich
with rewards that could not have been achieved without
everyone affiliated with Cyberplex. First, we would like to
thank our own people whose names grace the pages of
this report — you have
earned our respect with
your passion and talent.
And we know that without
your efforts we could not
have reached our goals. We
would also like to
thank the families of
our employees, as
well as our clients,
our partners, our
Board of Directors, and of
course, our shareholders
for the continued encour-
agement and support. With
pride and gratitude, we say
thank you all.
FOCUSED:: We started early
in 1999 on our U.S. expansion
goal by exploring locations in the U.S. — but not just any
locations. We studied the cities known for technology and
strong client opportunities. As a result, we opened a num-
ber of strategically located offices. In Austin, Texas, we
targeted and acquired Saper Media Group; they had the
talent, reputation, and major clients such as 3M, Dell and
Tivoli. Using that acquisition and the Charlotte office
opening as springboards, we established similar strategic
locations in Boston and San Francisco to create a viable
infrastructure from which to
grow our U.S. business. In
1998, we had almost no
U.S. revenues. In the fourth
quarter of 1999, 45% of our
revenues were U.S. based.
Partnerships were also a
big part of our success in
1999. We locked arms with
U.S.-based Science
Applications International
Corporation (SAIC) who
solidified our alliance
with a $15-million equity
investment. SAIC is a 39,000
person, US $6-billion private-
technology services firm with
one of the best reputations in
the world for delivering complex,
mission-critical applications. We
further enhanced our solution set and partner program by
investing in relationships with top technology companies,
such as Oracle, Microsoft, Hewlett-Packard, Sun|Netscape
Alliance, Kana, Vignette, and many others.
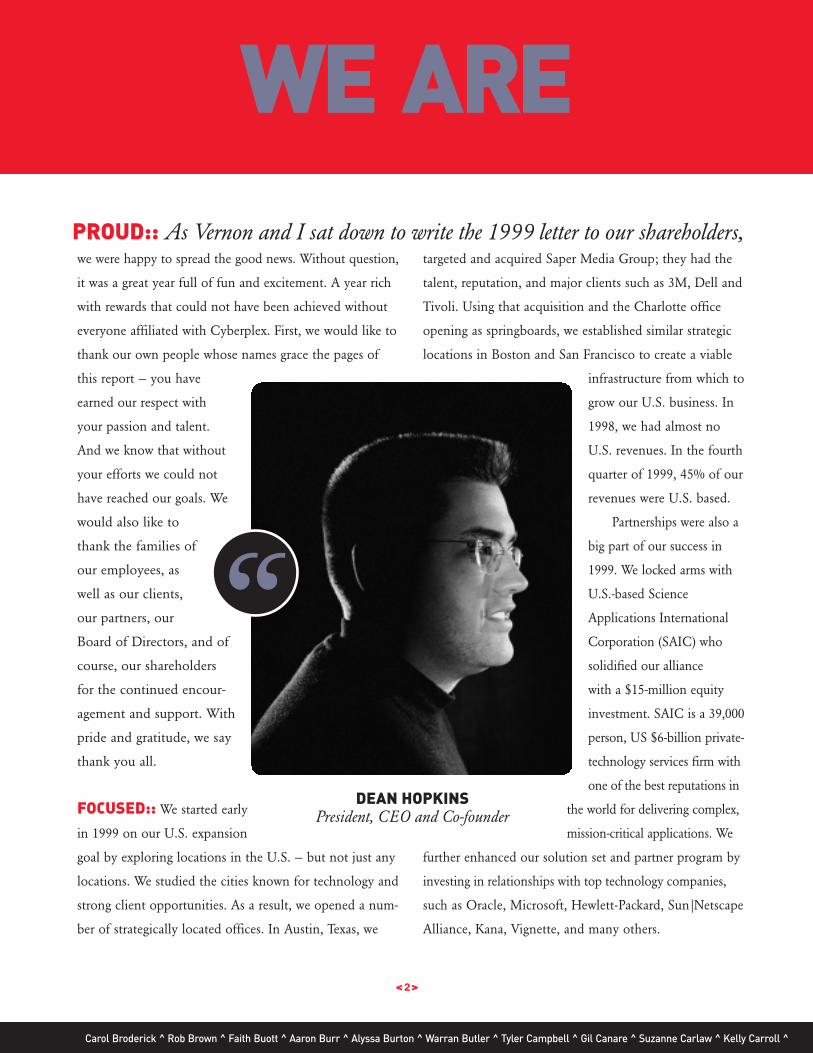
DEAN HOPKINSPresident, CEO and Co-founder
PROUD:: As Vernon and I sat down to write the 1999 letter to our shareholders,
“
WE ARE
<3>
Raina Chamberlain ^ Jason Chase ^ Ada Cheung ^ Jameson Cheung ^ Elena Chronis ^ Michael Coll ^ John Collinson ^ Shahid Constantino ^ Jennifer Conway ^
These relationships not only advanced our skills and capa-
bilities, but also created a source of new business.
Throughout the year, we delivered key business
benefits to our clients that focused on revenue generation,
cost reduction, time to market, and customer care applications.
We developed a cost-saving e-billing application for
Nova Scotia Power; an online customer-care solution for
Air Miles®; and a robust e-commerce system to generate
sales for Handspring.™ We also streamlined internal train-
ing programs for Dell Computers. We were awarded high-
profile accounts such as Ford Motor Company of
Canada and “Agency of
Record” for 3M Company’s
Customer Centers world-
wide. These wins not only
enhanced our leadership
position, but also continue
to provide opportunities to
display our innovation
through superior technology
and design capabilities.
We made great
strides with our brand
development in 1999. We
positioned ourselves as the
company determined to
deliver sustainable
business results through
Internet technology,
further differentiating
ourselves from our competitors.
With our brand as our backbone, and clients as our
focus, we built relationships with key media and
analysts and are now regularly sought out for our
expertise and thought leadership.
As the Internet industry continues to
evolve at a phenomenal pace, it is our ability to listen
that helps set us apart from our competition. The industry’s
growth, fueled by the realization that Web-based
solutions dramatically change the competitive landscape,
continues to create opportunity for record expansion levels.
International Data Corporation (IDC) forecasts that the
worldwide demand for Internet services will grow from
US $16.2 billion in 1999 to US $99.1 billion in 2004.
Furthermore, according to IDC, business-to-business electronic
commerce is expected to grow from US $80 billion in 1999 to
over US $1 trillion in 2003.
At Cyberplex, we plan to
continue to gather fresh
information, create new tech-
nologies, and seek out addi-
tional opportunities to deliver
the client results that
grow our
business.
Using our
insight, teamed with
our hands-on experience, we
established these objectives
for 2000:
1) Expand in the United States
and outside North America
2) Build brand recognition
3) Pursue strategic partnerships
to complement our profes–
sional services offering
4) Pursue strategic acquisitions to expand our professional
services offering
5) Develop complementary revenue models
6) Attract and retain talented professionals
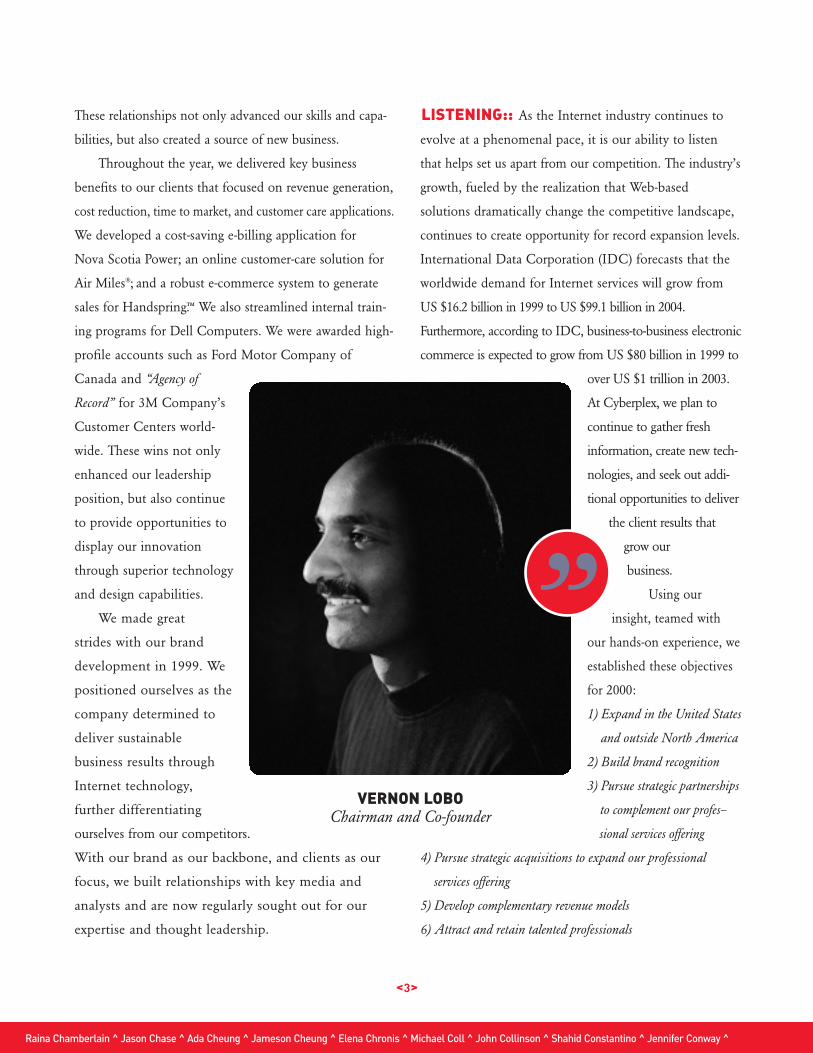
”VERNON LOBO
Chairman and Co-founder
LISTENING::
Chris Cook ^ Jody Corbin ^ Kristin Corkum ^ Paul Cousineau ^ Lisa Cowan ^ David Crumrine ^ Duane Currie ^ Chad Currie ^ Charla Cusinato ^ Jeremy Daly ^
DRIVEN:: On the heels of a successful 1999, we are prepared to move
our success forward in 2000. Here’s how we intend to do just that:
Expand in the United States and outside North America— We have already
started further expansion of our U.S. operations with the acquisition of
Sausalito, California’s i-Socket Web Creative, a full-service Web development
company in Silicon Valley. As we drive client solutions outside North
America, we are building a strategic European presence. We are currently
working on major European engagements, involving complex multi-
lingual, multi-currency applications.
Build Brand Recognition — We are already a recognized industry leader
in Canada. As we move forward in 2000, our expansion will continue,
our skills will further evolve, and our brand will reflect our progress and
position us as one of the world’s leading Internet professional services
firms. In the second half of 2000, we will launch an advertising and public
relations campaign to raise our profile in the United States. A powerful,
recognized brand will improve our access to the best opportunities, to
the best talent, and to new markets.
Pursue Strategic Partnerships to Complement Our Professional Services Offering —
Our strategic alliance with SAIC gives us access to a vast talent pool and
additional world-class research and development. Our combined capabilities
allow both companies to compete for new, more complex engagements.
We intend to develop additional strategic relationships with other leading
companies that complement our service offering — helping us to attract
new clients, gain early access to new technologies, create cross-selling
and up-selling opportunities, and more.
Pursue Strategic Acquisitions to Expand Our Professional Services Offering—
We are continuing to carefully pursue strategic acquisitions that allow us to
expand into new geographic markets while enhancing our service capabilities
and technologies. These acquisitions broaden our client base and provide
access to additional qualified professionals. We recently acquired
ProCure.com Inc., an application service provider (ASP) that designs,
builds and operates a suite of Internet-based, business-to-business order
management solutions targeted to suppliers. Through this acquisition we
<4>
PROGRESS::
We strengthened client partnerships
with several aggressive dot com
companies by exchanging fees for equity
We gained “Agency of Record” status for
3M’s Customer Centers worldwide
We attracted a strong, entrepreneurial,
Internet-experienced management team
We established a highly scalable,
distributed management and economic
model for the company
We opened an Austin, Texas office with
the acquisition of Saper Media Group —
a leading Internet firm
We opened new U.S. offices in
Charlotte, San Francisco, and Boston
WE ARE
OUR CLIENTS::
We’d like to thank our clients for helping us achieve another
great year. To see the Web sites of these plus other blue-chip and
Internet start-up clients, visit www.cyberplex.com:
3COM
3M
AGILLION
AIR MILES®
AUTOTRADER.CA
BA MORTGAGE SECURITIES INC.
BELL MOBILITY
BOARD DÖKTER
CHAPTERS.CA
CHAPTERSGLOBE.COM
CHARLES SCHWAB
CISCO SYSTEMS, INC.
DECIDE.COM, INC.
DELL COMPUTERS
DHC SKINCARE
DVD EXPRESS, INC.
E-ROUTE INC.
FIC INSURANCE GROUP
FORD MOTOR COMPANY OF CANADA
FOUR SEASONS RESORT CLUBS
GAP INC.
GRAND AND TOY
HANDSPRING, INC.
HEART AND STROKE FOUNDATION OF CANADA
MEALS.COM
MIRVISH PRODUCTIONS
MSHOW.COM
MSLIDE, INC.
NOVA SCOTIA POWER
QUESTLINK TECHNOLOGY
SAMSUNG AUSTIN SEMICONDUCTOR
SAN FRANCISCO INT’L FILM FESTIVAL
SKULOGIX
SPRINT CANADA
THE STOCKROOM
TICKETKING
TIVOLI SYSTEMS INC.
Jean Dams ̂Rizwan Dar ̂Yvonne Darnell ̂Robert Dawson ̂Shelley Dawson ̂Alex de Paz ̂Tim Deagan ̂Chris DeGrace ̂Debbie Degutis ̂Caroline Dobison ^
are gaining a comprehensive understanding of the ASP model and enhancing
our ability to provide ASP services to our clients. In addition, we will leverage
our own expertise and industry insight to grow ProCure.com into the leading
order management ASP platform for suppliers.
Develop Complementary Revenue Models— We are developing complementary
revenue models in several ways. We are increasing the percentage of our
business derived from retainer-based engagements with our key clients.
We will endeavor to increase our share of transaction-based, recurring
revenue from ASPs. Selectively, we will take equity in some of our start-
up clients as part of a fee structure. Also, by continuing to build and
enhance our libraries of repeatable code, we intend to deliver solutions
more efficiently and more profitably.
Attract and Retain Talented Professionals— Nothing is more essential to
our success than our people. Without them, we don’t have the talent to
reach out to our clients. So we will continue to offer a distinctive work-
place that encourages and awards creativity, initiative and teamwork. We
will give our employees access to a sophisticated environment, cutting-
edge projects, and competitive compensation packages that include stock
options and bonus plans for all employees. With commitments such as
these we not only retain our valued professionals, but also attract the
industry’s best and brightest talent.
LEADERSHIP:: It is initiative such as we’ve outlined here that has
allowed us to build skills and applications ahead of our clients’ demands.
In 1999 the Internet industry was beginning to see us as a new-breed
company with balance among mission-critical technology development,
superior creative solutions, and innovative thought leadership. This year
they’ll see more.
— Sincerely,Dean Hopkins & Vernon Lobo
<5>

Patricia Dominguez ^ Kevin Dougan ^ Marty Doupe ^ Michael Duda ^ George Dunphy ^ Ayman El Dah ^ Scott Elliott ^ Jennifer Elliott ^ Michael Erlindson ^
INNO
David Erwin ^ Andrew Evrovski ^ Alan Farquhar ^ Paul Fleming ^ Nick Foisy ^ Neil Follett ^ Myra Forsyth ^ Graham Forsyth ^ Keith Fraser ^ Chris Frostad ^
WE ARE
VATION.
–
Our aptitude to see beyond traditional solutions proved profitable for Handspring.™ To generate online
sales of the Handspring revolutionary Visor™ handheld computer, our group designed and built their
second generation e-commerce system. The strength of the system lies in an Internet-enabled supply chain
that links the digital storefront to fulfillment partners and a customer service extranet. The system gives
Handspring customer service representatives real-time Web access to customer data. Now Handspring can
support high transaction volumes, meet customer demands, and use technology as a competitive advantage
all of which work in unison to improve the bottom line. But revenue generation isn’t the only benefit of
innovative planning. The technology combined with an intuitive user-focused interface design creates a
powerful experience that delivers on Handspring’s vision. Opportunity found.
<7>

Our burning desire to produce the best online
solutions available supplied answers for Meals.com.
We provided over 40 of our motivated professionals
to help design, develop, and link a complex recipe
database to an easy-to-use interface.The results helped
Meals.com beat their competition to market. Now
their customers can access more than 12,000 recipes,
create their own cookbooks, enjoy personalized recom-
mendations, build weekly shopping lists and print
them using the in-store kiosk at participating partner
stores. But improving time to market was just the
appetizer. Meals.com also leverages co-branding ini-
tiatives for grocers and packaged goods companies to
create new revenue opportunities—including retailer-
branded versions of the site, and the branding of indi-
vidual recipes and ingredients. Ambition rewarded.
<8>
Chris Fuller ^ Marilyn Gary ^ Catherine Gausby ^ Amy Geller ^ Bill Gfroefrer ^ Greg Gibbons ^ Bill Gibson ^ Daniel Gileo ^ Robin Glennie ^ Erica Goddard ^
WE ARE
PASSI

Michael Gonos ^ Donna Gooch ^ Christine Graham ^ Brad Groff ^ Thomas Gross ^ Kristine Hahn ^ Krista Hallam ^ Chester Hamilton ^ Glen Hamilton ^
ON.

PRECISION.Ron Harwood ^ Jim Henderson ^ Aimee Hernandez ^ Hillary Hewson ^ Cleon Hill Wood-Salomon ^ Norma Hislop ^ Neil Honig ^ Dean Hopkins ^

It is our expertise in gathering strategic business insight
that helped us pinpoint opportunities for Air Miles.®
We united back-end legacy systems with multi-partner
information and served it to customers through a first-
class interface design. The result is an integrated system
that consistently reduces the traditional customer service
costs that Air Miles had been incurring. Today, Air
Miles customers get a paperless connection to records of
billing statements, account balances, and rewards information
around the clock and in a matter of seconds. Yet there is more
than reduced costs on the itinerary. With convenient 24-hour
access, Air Miles customer loyalty is being increased via
immediate online customer service. Target acquired.
<11>
Steve Hornett ^ Jun Hua ^ Patrick Hung ^ Leslie Hunter ^ Joseph Ierullo ^ Marco Imperatore ^ Adrian Inness ^ Richard Irving ^ Michele James ^
WE ARE
Our ability to exchange ideas and work together
brought focus to MSHOW.com™—an Interactive
Broadcasting Service for sales presentations, product
demonstrations, and more. MSHOW.com needed a
site to clearly deliver the benefits of their easy-to-use
service and provide a strong channel for generating
sales leads. We worked side by side to deliver incisive,
effective interface design and site development that
improved their online positioning and increased
customer requests for service demonstrations.
Additionally, our team brought a user-focused view to
the MSHOW.com development process through usability
consulting of the current service while guiding future
service enhancements. However, enhanced customer
care isn’t all that’s on the agenda. Working closely with
the people at MSHOW.com, we launched these site
enhancements in an accelerated timeframe to secure their
competitive stance in the marketplace. Puzzle solved.
<12>
Jeffrey Janssen ^ Evan Jennings ^ Deborah Jessop ^ Michael Jobes ^ Nicola Johnson ^ Nikolai Joukov ^ Yossi Kaplan ^ Steve Kellock ^ Pamela Kelly ^
WE ARE
TEAMW

Robert Kemp ^ David Kenyon ^ Brian Kim ^ Kenneth Kumar-Misir ^ Tiago Kunzendorff ^ Terra Landry ^ Scott Lane ^ Stephen Larocque ^ John Lascurettes ^
ORK.
James Latimer ^ Jack Lee ^ Donald Legge ^ Marcus Leon ^ Mike Leung ^ Talya Lev-Mor ^ David Lewis ^ Daniel Liebster ^ Jody Little ^ Kate Littleboy ^
<14>
The following discussion and analysis of the financial conditionand results of operations of Cyberplex Inc. (which is also known asand referred to as “Cyberplex”) should be read in conjunction withthe Company’s consolidated financial statements (including notes)that appear later in this document.
The following discussion contains forward-looking statementsabout matters that involve risks and uncertainties, such as statementsof Cyberplex’s plans, objectives, expectations and intentions, as wellas financial trends. The discussion also includes cautionary statementsabout these matters. You should read the cautionary statements madebelow as being applicable to all related forward-looking statementswherever they appear in this document. Cyberplex’s actual resultscould differ materially from those discussed below. Factors that couldcause or contribute to such differences include those discussed in“Risk Factors,’’ as well as those discussed elsewhere herein.
OVERVIEWCyberplex is an Internet professional services firm that
combines strategic consulting with application developmentand interface design to build Internet-based solutions thatdeliver business results for clients that range from traditionalbusinesses to venture-backed dot com enterprises. Ourconsultants work to acquire the information needed tounderstand our clients’ business, the competitive environmentand the opportunities available. With this information, ourbusiness architects, technology experts and design teamsidentify areas where Internet technology and creative marketing can improve our clients’ existing business. Wethen offer a comprehensive range of services to deliver thesesolutions, which includes project management, user-centeredinterface design, application development, systems integration,application maintenance, and audience development.
Cyberplex was founded in 1994 and has experiencedconsistent revenue growth in each of its last 5 years. Weemploy over 240 staff and maintain offices throughout NorthAmerica including facilities in Toronto, Waterloo, Halifax,Charlotte, Boston, Austin, San Francisco and San Diego.
On May 7, 1999, Cyberplex made its first major acquisitionin the United States by acquiring all of the issued and outstanding shares of Saper Media Group Inc. (“Saper”) ofAustin, Texas in exchange for up to 630,000 shares ofCyberplex Common Stock. The shares to be paid out areperformance based and contingent upon the achievement ofsix semiannual financial targets that have been established byCyberplex and Saper.
On May 11, 1999, Cyberplex completed a special warrantfinancing which resulted in an issuance of 2,223,000 specialwarrants convertible to common shares of the Company.Proceeds to Cyberplex, net of underwriting discounts andother offering costs, were approximately $13,802,284.
On October 15, 1999, Cyberplex sold 2,000,000 sharesof common stock and 560,000 warrants with a strike price of$8.50 and a 24 month expiry to SAIC. Proceeds toCyberplex were approximately $14,967,058.
SOURCES OF REVENUES AND REVENUE RECOGNITIONOur revenues are derived primarily from fees for
Internet professional services. The clients we service in thiscapacity tend to hire us on a project-by-project basis, but insome cases, we are appointed as the agency of record for allof their Internet services. We believe that building partnership-type relationships with our clients has been a key componentof our success. However, a client may terminate our serviceson fairly short notice. Since a significant amount of our costsare fixed, a material variation in the number of significantengagements in a period, or early termination of an accounton short notice, can cause significant variations in operatingresults from quarter to quarter.
Most of our projects are priced on a fee-for-servicesbasis. However, as we continue to expand into the U.S. market and our projects become larger and more complex,we are contracting into more fixed price engagements con-sistent with market demands. At the beginning of any fixed-fee engagement, we will estimate the total cost of the projectand recognize revenue on a percentage of completion basis.We will then review the revenue recognized on a quarterlybasis and, to the extent that we discover any inaccuracies inthe estimates or cost overrun due to unforeseen requirements,adjustments will be made in that period.
We also enter into selective engagements where we takean equity interest in a client as part of our compensation. Inthese situations, we have recorded all of the costs as they areincurred; however, due to uncertainty in the value of theequity interest, no amount has been attributed to thispotential asset.
In 1999, our largest client accounted for approximately15% of revenue. No other account exceeded 10%, and our topten customers accounted for just over 52% of our revenue.In the future, it is possible that a few accounts could comprisea significant portion of our revenue, and therefore, anycancellation or variation in the number of accounts couldhave an adverse affect on our financial results.
CLASSIFICATION OF COSTSDirect costs include salaries, bonuses, benefits, payroll
taxes, and other costs associated with the generation of revenue.General and administrative expenses include the costs ofleasing our sales and production facilities as well as the costsof managing and operating those locations. This category ofexpenses also includes all of the other costs associated withrunning an international organization, including travel,accommodation, training, recruiting, finance, and legal.Sales and marketing relate to all costs associated with buildingour brand and reputation. Research and developmentcharges relate to the costs of our knowledge lab and othertechnology initiatives undertaken that are not in conjunc-tion with specific client engagements. Interest on long-termdebt and capital leases results primarily from costs incurredfrom capital leases during the year.
MANAGEMENT’S DISCUSSION AND ANALYSIS OF FINANCIAL CONDITION AND RESULTS OF OPERATIONS
Brian Lough ^ David Lougheed ^ Stephen Louie ^ Allan Lowson ^ Quinn MacDonald ^ Daniel MacDonald ^ David MacKay ^ David MacLaughlin ^
<15>
YEAR ENDED DECEMBER 31, 1999COMPARED TO YEAR ENDED DECEMBER 31, 1998
REVENUERevenue for the year ended December 31, 1999
increased by $11.6 million, or 122%, to $21.1 million from$9.5 million for the year ended December 31, 1998. Thisincrease resulted from the significant growth in billableresources at each of our four production facilities, increasedbilling rates for our professionals, significant U.S. penetrationrealized primarily in the second half of the year, and theoverall increase in project size and scope. In addition, resultsfrom two of our acquisitions were consolidated into our 1999results. It was the first full year in which the results of our July1998 acquisition of Webworks Worldwide Incorporated (nowCyberplex Atlantic Incorporated) were consolidated into ourstatements along with seven months of consolidated revenuefrom our May 1999 acquisition of Saper Media Group Inc.(now Cyberplex U.S.A. Southwest Inc.).
DIRECT COSTSOur direct costs increased by $5.8 million, or 126%, to
$10.4 million in 1999 from $4.6 million in 1998. As a percentage of revenue, direct costs remained fairly constantfrom year to year, accounting for 49% in 1999 and 48% in1998. The increase in absolute dollars was due to the growthof the business and the additional personnel hired to provideprofessional services. The increase in direct costs as a percentage of revenue was the result of additional employeesbeing hired ahead of demand and thus without the proportionate increase in revenue. This increase was offsetsomewhat by the increased gross margin for services providedin the United States or European markets but produced outof our Canadian production facilities.
SALES AND MARKETINGSales and marketing expenses increased by $2.6 million,
or 259%, to over $3.6 million in 1999 from just over $1 millionin 1998. This increase is the result of the additional resourcesthat were hired during the year and the focused effort to continue to build a sales force in Canada and expandaggressively into the United States. Additional branding andadvertising activities were also initiated during 1999 in bothcountries, and as a result, additional costs were also incurredin these areas.
GENERAL AND ADMINISTRATIVE General and administrative expenses increased by $3.4
million, or 108%, to almost $6.5 million in 1999 from justover $3 million in 1998. As a percentage of revenue, this figureremained relatively constant at 31% in 1999 versus 33% in1998. The significant dollar increase in 1999 resulted primarilyfrom the additional facilities that were occupied by the company and the ramp-up of the management team andadditional administrative and specialized resources.Managers were brought on to help grow all of the variousproduction and sales facilities; to support and grow infrastructure; to lead specialized areas of expertise (includinglegal, finance, and mergers and acquisitions); and to add newfunctional areas to the business to expand our offering toclients (including the user-centered design and interactivecommunications departments).
RESEARCH AND DEVELOPMENTResearch and development expenses increased by
$316,000, or 403%, to $395,000 in 1999 from $79,000 in1998. The majority of the work that is performed during anyyear is billable to our clients. However, there are certain initiatives that we choose to experiment with on our own.These experiments are undertaken to ensure that we remainat the forefront of our industry and continue to developleading-edge technologies that will benefit our clients wellinto the future.
NET INCOME (LOSS)For the year ended December 31, 1999, we recorded a
net loss of $1.2 million. Operating income, excluding the$1.4 million associated with amortization, was $172,000 in 1999.Management believes that these results, and our sustainedgross margins throughout the year, indicate the validity ofour business model and strategy of aggressive growth.
BALANCE SHEETOur cash balance of over $26.7 million at December 31,
1999 increased significantly from the $3.4 million on handat the end of 1998. This increase is due to the two financingsthat were completed during the year that together generatedover $28.7 million in net proceeds. Receivables as atDecember 31, 1999 increased significantly from December31, 1998 due to the growth of our business. Prepaid expensesalso increased, resulting from the prepaid rental balances forour new facilities and the up-front lease payments for manyof our technology leases. Work in progress resulted fromfixed-fee projects that were still underway at the end of theyear. Capital assets increased significantly year over year dueto the growth of our business. The increase in goodwill is adirect factor of the Saper acquisition in May 1999.
Accounts payable were the most significant liability atDecember 31, 1999 as they were at the end of 1998. Thepayables increase again resulted from the growth of our business during 1999. Capital leases are used to purchasemost of our technology and the current portion identifies theamount that will be due over the next twelve-month period.Unearned revenue relates to invoices sent out prior to workbeing performed. Unearned revenue increased in 1999 as thesize of our engagements has increased and we have increasingly required retainers prior to the commencementof a project. Long-term capital lease obligations represent thelease payments remaining on the leases.
Capital stock increased significantly in 1999 due to theshares issued as a result of the two financings completed during the year.
AMORTIZATIONThe main components of amortization relate to capital
assets and goodwill. Amortization of capital assets increasedby $611,000, or 374%, to $775,000 in 1999 from $163,000 in1998. This increase is the result of the growth of our business,including the new facilities that were occupied in 1999 andthe additional technology acquired to run our business.
Goodwill amortization increased by $410,000, or 242%,to $580,000 in 1999 from $170,000 in 1998 as a result of ouracquisitions. In 1999 we had the first full year in which thegoodwill from our 1998 acquisition of Webworks was amortized, and the 1999 acquisition of Saper resulted inseven months of goodwill amortization to be recorded. Weanticipate that expenses related to the amortization of
goodwill will increase in future periods as we continue tomake strategic and opportunistic acquisitions in the future.
LIQUIDITY AND CAPITAL RESOURCESWe historically have financed our operations primarily
from funds generated from operations and proceeds fromequity issuances. In addition, Cyberplex has a bank line ofcredit providing for borrowings of up to $5 million, bearinginterest at prime less 2%, and subject to certain covenantsrelating to the maintenance of certain financial ratios.
In 1999 our net operating activities accounted for a useof cash totaling almost $3.5 million, whereas the sameaccounts provide a source of cash of over $0.67 million in1998. The main use of funds in 1999 resulted from theaccounts receivable increasing by $4.5 million and our prepaid expenses increasing by $0.54 million. The source offunds that offset these amounts were the increase in accountspayables and accrued liabilities of $1.6 million.
Two equity financing activities provided net proceeds of$28.8 million in 1999, compared to only $3.5 million in1998. The first financing was a special warrant issue thataccounted for net proceeds of $13.8 million in exchange for2.2 million special warrants, subsequently converted intocommon shares. The second financing was a private placement involving SAIC, which generated net proceeds of$15 million in exchange for a treasury issuance of two million common shares and 560,000 warrants with a strikeprice of $8.50 and an 18 month expiry.
Net cash used for investing activities in 1999 was $2.5million compared with $1.6 million in 1998. The most significant change in 1999 was significant capital asset purchases as we continued to grow and expand. $2.5 millionwas used to purchase assets in 1999, which was up signifi-cantly over 1998. This resulted in building a solid foundationfrom which we believe we can grow well into the future.
Cyberplex believes that its cash provided from operations,additional borrowing capacity, and existing cash and cashequivalents will be sufficient to meet our working capital andcapital expenditures requirements for the next 12 months.
YEAR ENDED DECEMBER 31, 1998 COMPARED TO YEAR ENDED DECEMBER 31, 1997
REVENUERevenue for the year ended December 31, 1998
increased by $6.4 million, or 206%, to $9.5 million from$3.1 million for the year ended December 31, 1997. Thisincrease resulted primarily from significantly greater outputfrom our production centers and from the additional capacityassociated with the acquisition of Cyberplex AtlanticIncorporated that occurred in July 1998.
DIRECT COSTSThe direct costs associated with production increased to
$4.6 million in 1998 from $1.6 million in 1997. Althoughthe absolute dollar value increased, the overall gross marginfigure grew to 52% in 1998 from 50% in 1997. This increaseresulted from the costs of production lowering as a percentageof revenue due to the increased scope and complexity of theengagements delivered.
SALES AND MARKETINGSales and marketing expenses increased to over $1million
in 1998 from $162,000 in 1997 as we took our first steps to
build a brand for ourselves in Canada. Our first managercoordinator was hired, and the Company began to compilecollateral to attract both clients and investors. Being the firstfull year as a public company, the majority of the remainingcosts related to work required for statutory or regulatoryrequirements.
GENERAL AND ADMINISTRATIVE General and administrative expenses increased in 1998
by 236% to over $3 million from $920,000 in 1997. As a percentage of revenue this amount increased to 32% in 1998compared with 29% in 1997. This was primarily the result ofour company investing in indirect, non-revenue-generatingemployees. For example, we recognized a management teamwas needed to guide our future growth. This managementteam included a chief technology officer, a vice president ofmarketing, a vice president of human resources as well asother senior managers. In addition, we expanded our facilitiesahead of demand in anticipation of our future growth.
OTHER EXPENSESResearch and development costs of $78,000 in 1998
relate to initiatives undertaken in the knowledge lab. Intereston long-term debt and capital leases was quite small due tothe fact that all long-term debt was retired by the end of theyear and capital leases were only in place for the latter halfof 1998. The significant increase in capital assets resulted inamortization of $163,000 for 1998, up from $37,000 in 1997.The acquisition of Cyberplex Atlantic Incorporated in July1998 added approximately $4 million of goodwill to our balance sheet. This goodwill is being written off over tenyears and resulted in an additional $169,580 of amortizationin 1998.
QUALITATIVE AND QUANTITATIVE DISCLOSURE OF MARKET RISK
Historically, we have provided our services to customersprimarily in Canada. During the latter part of 1999, our customer base both in the United States and abroad hasincreased significantly. As a result, our financial results couldbe affected by factors such as changes in foreign currencyexchange rates or weak economic conditions in those othermarkets. Significant strengthening or weakening of theCanadian dollar against other major currencies could havean impact on our results of operations. Our company hasbeen structured in a way such that production resources maynot necessarily be located in the same country as the client;however, client billings are usually in either Canadian or U.S. dollars to limit the impact that foreign currencyfluctuations can have on our financial results. Historically,we have not experienced material fluctuations in our resultsof operations due to foreign currency exchange rate changes.
RISKS RELATING TO CYBERPLEX AND THE INTERNET INDUSTRYLike most companies in the technology sector, Cyberplexfaces a number of risk factors associated with its current business and with Internet technology.
RISKS ASSOCIATED WITH EXPANSIONCyerplex’s business has grown very quickly since its
creation, and we anticipate this growth to continue. Thedevelopment of Cyberplex’s business and the expansion ofits customer base have resulted in a corresponding increase
QUALITATIVE AND QUANTITATIVE DISCLOSURE OF MARKET RISK
Andrew MacLean ^ Craig MacMaster ^ Derek MacNeil ^ Justin MacNutt ^ Joe Mahaffey ^ George Mandala ^ Mihai Manoliu ^ Revital Marom ^
<16>
RISKS RELATING TO CYBERPLEX AND THE INTERNET INDUSTRY
Steve Matheson ^ Norrie Matthews ^ Darrell May ^ Wendy Mazet ^ Angela McCarthy ^ Andrew McCartney ^ Maury McCoy ^ Ron McDougall ^
in the demands on the company’s management, operatingsystems, and internal controls. To meet these demands, wemust continuously expand and refine our management controls, reporting systems, and our procedures for accom-modating future growth in multiple offices and countries.
RISKS ASSOCIATED WITH ACQUISITIONSPart of the Cyberplex strategy has always been to
acquire existing businesses. The success of these acquisitionsdepends to a significant extent upon the ability of our management team to: effectively integrate acquired personnel,operations, and technologies into the organization; retain and motivate key new personnel; and retain and grow the existing clientbase of the acquired company.
DEPENDENCE ON KEY PERSONNELCyberplex’s success depends to a significant extent on
the abilities and efforts of its senior management team. Theymust operate and manage effectively, both as individuals andas a team, for the company to flourish.
Competition for talent in our sector is intense. The lossof an executive officer, senior manager, or key employee couldhave a material effect on our business. Although the companyhas non-competition and non-disclosure agreements with allits executive officers and senior managers, any loss of key personnel during growth phases could have negative effects.
DEMAND FOR CYBERPLEX’S PRODUCTS AND SERVICESThe market for interactive products and services is
evolving rapidly. Cyberplex’s growth depends on its abilityto create, develop, and deploy interactive strategies and solutions that service existing clients and attract new ones.
DEPENDENCE ON THE INTERNETA significant portion of the sales of Cyberplex’s products
depends on the growth of the interactive multimedia marketand private intranet networks. But sales of our Internet-related products and services rely, in large part, on the industryand infrastructure that has developed around Internet accessand traffic. Inadequate development of a reliable networkbackbone or the lack of timely delivery of complementaryproducts could affect the overall commercial viability of theInternet marketplace. Global e-commerce and informationexchange is constantly changing and evolving, and it is difficult to predict with any assurance its long-term commercial success.
COMPETITIONThe markets for our services are highly competitive. We
face intense competition from other Internet professionalservices firms, advertising agencies, system integrators, andinternal IT/IS organizations. As we continue to expand, thiscompetition will become more severe and, as a result, will bea significant challenge for the company.
RAPID TECHNOLOGICAL CHANGECyberplex uses many different technologies to develop
and deploy strategic solutions for its customers. These technologies are changing rapidly. While we continuouslyresearch and evaluate the tools we use, there is no assurancethat these technologies and the expertise we build aroundthem will continue to be applicable in the future.
LENGTH OF SALES CYCLEThe development and implementation of interactive
Web sites is often an enterprise-wide decision for prospectiveclients. This usually requires a lengthy sales cycle thatincludes an analysis of customer needs, a written proposal,presentations, and contract negotiations. Because Web sitedevelopment can involve a substantial commitment of capital,there are often delays in approving large expenditures. Thesales cycle varies, but typically it has ranged from one to ninemonths. During that time, the sales cycle can be affected bythe client’s budgetary constraints and internal acceptancereviews–factors over which Cyberplex has little or no control.
OUTLOOKThe following paragraphs are based on current expectations of the
company and the actual results may differ from those discussed below.The fourth quarter of 1999 showed a significant
increase in the amount of business being generated outsideof Canada and the resulting increase in gross margin. Thebusiness model that the company was built around started toshow the financial benefits that had been anticipated. Themarket demand for our services is still very high, and weexpect that our industry is going to continue to grow at a significant rate. We believe that the growth of the industrycoupled with our focused move towards a more internationalclient base will provide for even further revenue growth inthe future and improved gross margins. We feel that thesefactors, in addition to the strong team that has been assembled across North America, will allow us to continue togrow aggressively and result in another strong year for 2000.
Through the acquisition of ProCure.com Inc. in March2000, we have entered the Application Service Provider(ASP) market and are now able to offer ASP solutions tobusiness-to-business clients. This acquisition has enhancedthe value proposition that we can offer to our existing clientsand should generate a substantial amount of interest fromnew clients. Even more importantly, this acquisition willenable us to build an ASP platform from which additionalASP opportunities can evolve and is expected to result innew and diversified revenue streams for the company. TheProCure business model results in revenue generated in threeareas: integration work for installation; fixed monthly contracts forthe rentable applications; and recurring transaction revenue.
We expect that ProCure’s early stage of developmentwill result in significant expenditures over the next 12 monthswithout sufficient offsetting revenue and, as a result, will havean adverse material impact on the net income of the company.However, we believe that these short-term factors will benefitthe company significantly over the long term.
<17>
OUTLOOK

Karyn McGillion ^ David McKenzie ^ Erin McNeil ^ Alec Melkonian ^ Michele Mendoza ^ Nestor Menjivar ^ Ljuban Milutinovic ^ Paul Miner ^ Kam Mistry ^

C O N S O L I D AT E D F I N A N C I A L S TAT E M E N T S O F
Y E A R S E N D E D D E C E M B E R 3 1 , 1 9 9 9 A N D 1 9 9 8
Robert Moffat ^ Maria Molek ^ Fernando Mongiat ^ Grace Montemar ^ Andrea Moore ^ Mauricio Morales ^ Adam Morenberg ^ Andrew Muroff ^

AUDITORS’ REPORT TO THE SHAREHOLDERS
To the shareholders of Cyberplex Inc.
We have audited the consolidated balance sheets of Cyberplex Inc. as at December 31, 1999 and 1998 andthe consolidated statements of operations and retained earnings (deficit) and cash flows for the yearsthen ended. These financial statements are the responsibility of the Company's management. Ourresponsibility is to express an opinion on these financial statements based on our audits.
We conducted our audits in accordance with Canadian generally accepted auditing standards. Thosestandards require that we plan and perform an audit to obtain reasonable assurance whether the financialstatements are free of material misstatement. An audit includes examining, on a test basis, evidencesupporting the amounts and disclosures in the financial statements. An audit also includes assessingthe accounting principles used and significant estimates made by management, as well as evaluating theoverall financial statement presentation.
In our opinion, these consolidated financial statements present fairly, in all material respects, the financialposition of the Company as at December 31, 1999 and 1998 and the results of its operations and its cashflows for the years then ended in accordance with Canadian generally accepted accounting principles.
KPMG LLP
Chartered AccountantsToronto, Canada
February 25, 2000, except as to note 11 which is as ofMarch 21, 2000
<20>
Ingrid Nasager de Ortuzar ^ Kathleen Neidert ^ Cauley O`Day ^ Peter Oakes ^ Allison Onishi ^ Martin Ortuzar ^ Jason Otis ^ Chris Ovsenny ^ Cagatay Ozkan ^
MANAGEMENT’S RESPONSIBILITY FOR FINANCIAL REPORTING
Management is responsible for the integrity of the financial statements and operational information presented in this annual report. The financial statements have been prepared in accordance with appropriate and generally accepted accounting principles and reflect management’s best estimates andjudgements. Financial information presented elsewhere in the annual report is consistent with that in thefinancial statements. Management maintains a system of internal controls, consistent with reasonablecosts, to provide reasonable assurances that all assets are safeguarded and to facilitate the preparationof relevant, reliable, and timely financial information. External auditors, appointed by the shareholders,have examined the financial statements. The Audit Committee has reviewed these financial statementswith management and the external auditors and has reported to the Board of Directors, who haveapproved the financial statements.
Geoffrey Rotstein,Chief Financial Officer

Consolidated Balance SheetsDecember 31, 1999 and 1998
1999 1998
ASSETS
Current assets:Cash and cash equivalents $26,721,670 $3,423,994 Accounts receivable, net of allowance for doubtful
accounts of $433,093 (1998 - $181,064) 7,041,965 2,311,779Income taxes recoverable 103,208 32,593Prepaid expenses and sundry assets 603,775 70,990Work in progress 307,666 –TOTAL CURRENT ASSETS 34,778,284 5,839,356
Loan receivable (note 2) – 300,000Capital assets (note 3) 5,217,032 1,505,399Goodwill, net of accumulated amortization
of $749,572 (1998 - $169,580) 5,813,798 3,913,138Software development costs, net of accumulated
amortization of $191,548 (1998 - $129,035) 71,470 133,984
TOTAL ASSETS $45,880,584 $11,691,877
LIABILITIES AND SHAREHOLDERS’ EQUITY
Current liabilities:Accounts payable and accrued liabilities $4,445,690 $1,289,849 Current portion of obligations under capital leases (note 6) 305,963 77,332Unearned revenue 336,776 419,001TOTAL CURRENT LIABILITIES 5,088,429 1,786,182
Deferred income taxes – 9,810Obligations under capital leases (note 6) 554,191 163,806
Shareholders’ equity:Commitment to issue capital stock (note 4) 2,692,486 –Capital stock (note 8):
Authorized:Unlimited common shares
Issued and outstanding:22,114,213 common shares (1998 - 17,672,245) 38,331,268 9,321,129
Retained earnings (deficit) (785,790) 410,950Total shareholders’ equity 40,237,964 9,732,079
Commitments (note 7)Subsequent events (note 11)
TOTAL LIABILITIES AND SHAREHOLDERS’ EQUITY $45,880,584 $11,691,877
See accompanying notes to consolidated financial statements.
<21>
Vernon Lobo,Director
Geoffrey Rotstein,Director
Gina Panza ^ Angela Paton ^ Sonia Pawlowski ^ Robert Payne ^ Kimberly Peck ^ David Pedigo ^ Jeff Pedigo ^ Nelson Pereira ^ Ray Philipose ^ Dan Phillips ^
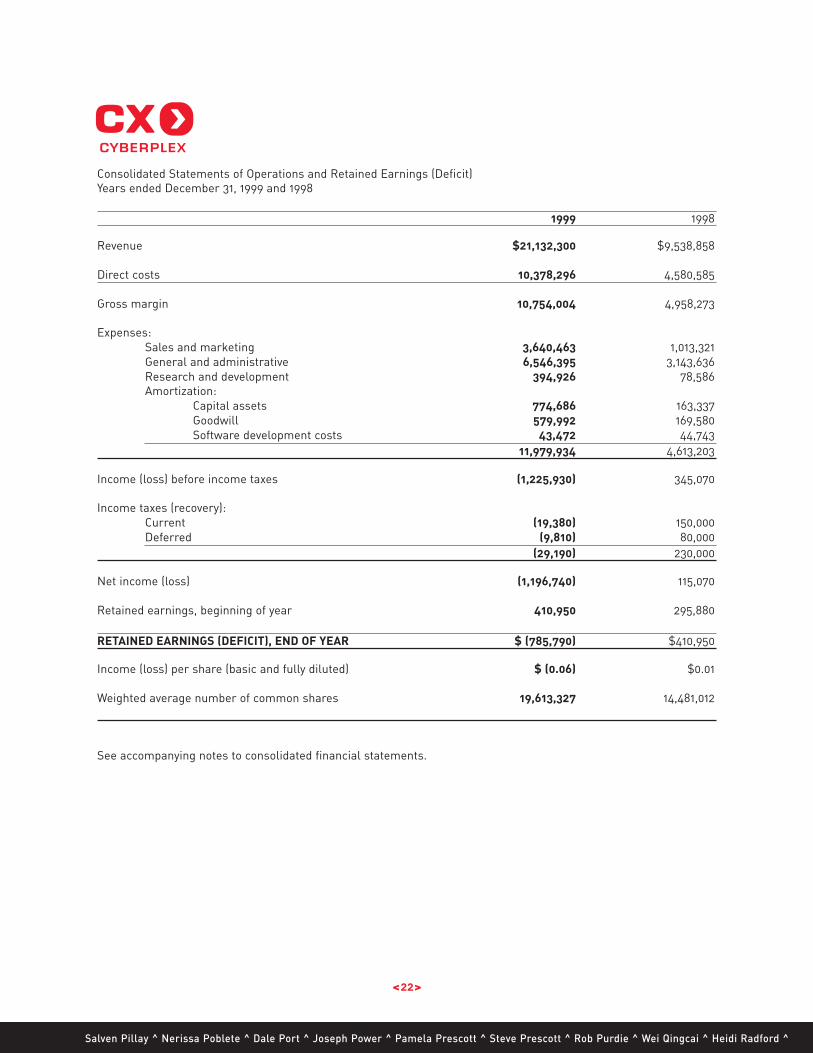
Consolidated Statements of Operations and Retained Earnings (Deficit)Years ended December 31, 1999 and 1998
1999 1998
Revenue $21,132,300 $9,538,858
Direct costs 10,378,296 4,580,585
Gross margin 10,754,004 4,958,273
Expenses:Sales and marketing 3,640,463 1,013,321General and administrative 6,546,395 3,143,636Research and development 394,926 78,586Amortization:
Capital assets 774,686 163,337Goodwill 579,992 169,580Software development costs 43,472 44,743
11,979,934 4,613,203
Income (loss) before income taxes (1,225,930) 345,070
Income taxes (recovery):Current (19,380) 150,000Deferred (9,810) 80,000
(29,190) 230,000
Net income (loss) (1,196,740) 115,070
Retained earnings, beginning of year 410,950 295,880
RETAINED EARNINGS (DEFICIT), END OF YEAR $ (785,790) $410,950
Income (loss) per share (basic and fully diluted) $ (0.06) $0.01
Weighted average number of common shares 19,613,327 14,481,012
See accompanying notes to consolidated financial statements.
<22>
Salven Pillay ^ Nerissa Poblete ^ Dale Port ^ Joseph Power ^ Pamela Prescott ^ Steve Prescott ^ Rob Purdie ^ Wei Qingcai ^ Heidi Radford ^
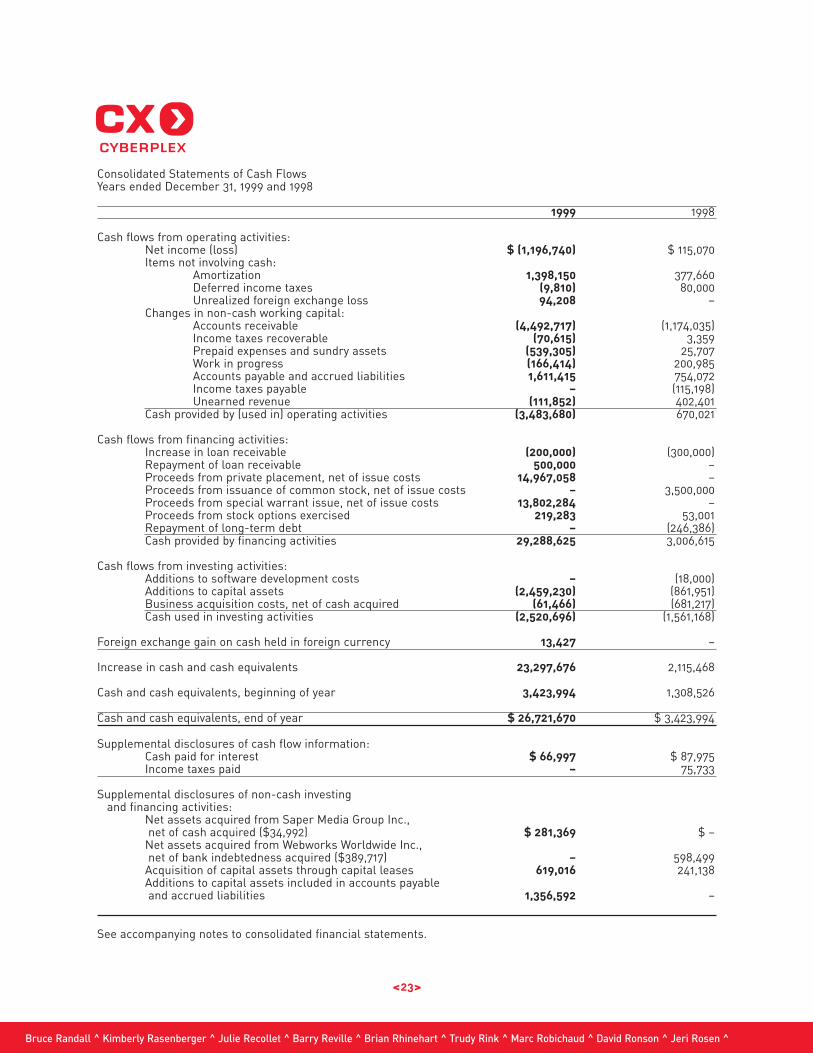
Consolidated Statements of Cash FlowsYears ended December 31, 1999 and 1998
1999 1998
Cash flows from operating activities:Net income (loss) $ (1,196,740) $ 115,070Items not involving cash:
Amortization 1,398,150 377,660Deferred income taxes (9,810) 80,000Unrealized foreign exchange loss 94,208 –
Changes in non-cash working capital:Accounts receivable (4,492,717) (1,174,035)Income taxes recoverable (70,615) 3,359Prepaid expenses and sundry assets (539,305) 25,707Work in progress (166,414) 200,985Accounts payable and accrued liabilities 1,611,415 754,072Income taxes payable – (115,198)Unearned revenue (111,852) 402,401
Cash provided by (used in) operating activities (3,483,680) 670,021
Cash flows from financing activities:Increase in loan receivable (200,000) (300,000)Repayment of loan receivable 500,000 –Proceeds from private placement, net of issue costs 14,967,058 –Proceeds from issuance of common stock, net of issue costs – 3,500,000Proceeds from special warrant issue, net of issue costs 13,802,284 –Proceeds from stock options exercised 219,283 53,001Repayment of long-term debt – (246,386)Cash provided by financing activities 29,288,625 3,006,615
Cash flows from investing activities:Additions to software development costs – (18,000)Additions to capital assets (2,459,230) (861,951)Business acquisition costs, net of cash acquired (61,466) (681,217)Cash used in investing activities (2,520,696) (1,561,168)
Foreign exchange gain on cash held in foreign currency 13,427 –
Increase in cash and cash equivalents 23,297,676 2,115,468
Cash and cash equivalents, beginning of year 3,423,994 1,308,526
Cash and cash equivalents, end of year $ 26,721,670 $ 3,423,994
Supplemental disclosures of cash flow information:Cash paid for interest $ 66,997 $ 87,975Income taxes paid – 75,733
Supplemental disclosures of non-cash investingand financing activities:
Net assets acquired from Saper Media Group Inc.,net of cash acquired ($34,992) $ 281,369 $ –
Net assets acquired from Webworks Worldwide Inc.,net of bank indebtedness acquired ($389,717) – 598,499
Acquisition of capital assets through capital leases 619,016 241,138Additions to capital assets included in accounts payableand accrued liabilities 1,356,592 –
See accompanying notes to consolidated financial statements.
<23>
Bruce Randall ^ Kimberly Rasenberger ^ Julie Recollet ^ Barry Reville ^ Brian Rhinehart ^ Trudy Rink ^ Marc Robichaud ^ David Ronson ^ Jeri Rosen ^
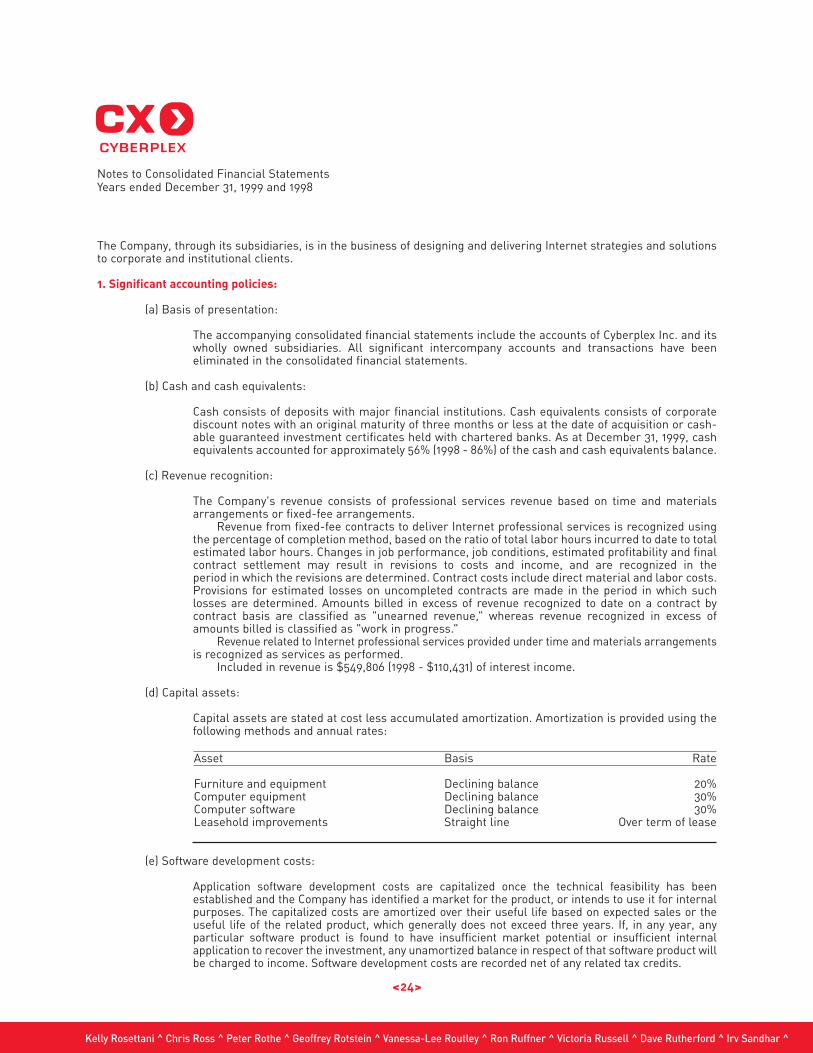
Notes to Consolidated Financial StatementsYears ended December 31, 1999 and 1998
The Company, through its subsidiaries, is in the business of designing and delivering Internet strategies and solutionsto corporate and institutional clients.
1. Significant accounting policies:
(a) Basis of presentation:
The accompanying consolidated financial statements include the accounts of Cyberplex Inc. and itswholly owned subsidiaries. All significant intercompany accounts and transactions have been eliminated in the consolidated financial statements.
(b) Cash and cash equivalents:
Cash consists of deposits with major financial institutions. Cash equivalents consists of corporate discount notes with an original maturity of three months or less at the date of acquisition or cash-able guaranteed investment certificates held with chartered banks. As at December 31, 1999, cashequivalents accounted for approximately 56% (1998 - 86%) of the cash and cash equivalents balance.
(c) Revenue recognition:
The Company's revenue consists of professional services revenue based on time and materialsarrangements or fixed-fee arrangements.
Revenue from fixed-fee contracts to deliver Internet professional services is recognized usingthe percentage of completion method, based on the ratio of total labor hours incurred to date to totalestimated labor hours. Changes in job performance, job conditions, estimated profitability and finalcontract settlement may result in revisions to costs and income, and are recognized in the period in which the revisions are determined. Contract costs include direct material and labor costs.Provisions for estimated losses on uncompleted contracts are made in the period in which suchlosses are determined. Amounts billed in excess of revenue recognized to date on a contract by contract basis are classified as "unearned revenue," whereas revenue recognized in excess ofamounts billed is classified as "work in progress."
Revenue related to Internet professional services provided under time and materials arrangementsis recognized as services as performed.
Included in revenue is $549,806 (1998 - $110,431) of interest income.
(d) Capital assets:
Capital assets are stated at cost less accumulated amortization. Amortization is provided using thefollowing methods and annual rates:
Asset Basis Rate
Furniture and equipment Declining balance 20%Computer equipment Declining balance 30%Computer software Declining balance 30%Leasehold improvements Straight line Over term of lease
(e) Software development costs:
Application software development costs are capitalized once the technical feasibility has been established and the Company has identified a market for the product, or intends to use it for internalpurposes. The capitalized costs are amortized over their useful life based on expected sales or theuseful life of the related product, which generally does not exceed three years. If, in any year, any particular software product is found to have insufficient market potential or insufficient internal application to recover the investment, any unamortized balance in respect of that software product willbe charged to income. Software development costs are recorded net of any related tax credits.
<24>
Kelly Rosettani ^ Chris Ross ^ Peter Rothe ^ Geoffrey Rotstein ^ Vanessa-Lee Routley ^ Ron Ruffner ^ Victoria Russell ^ Dave Rutherford ^ Irv Sandhar ^
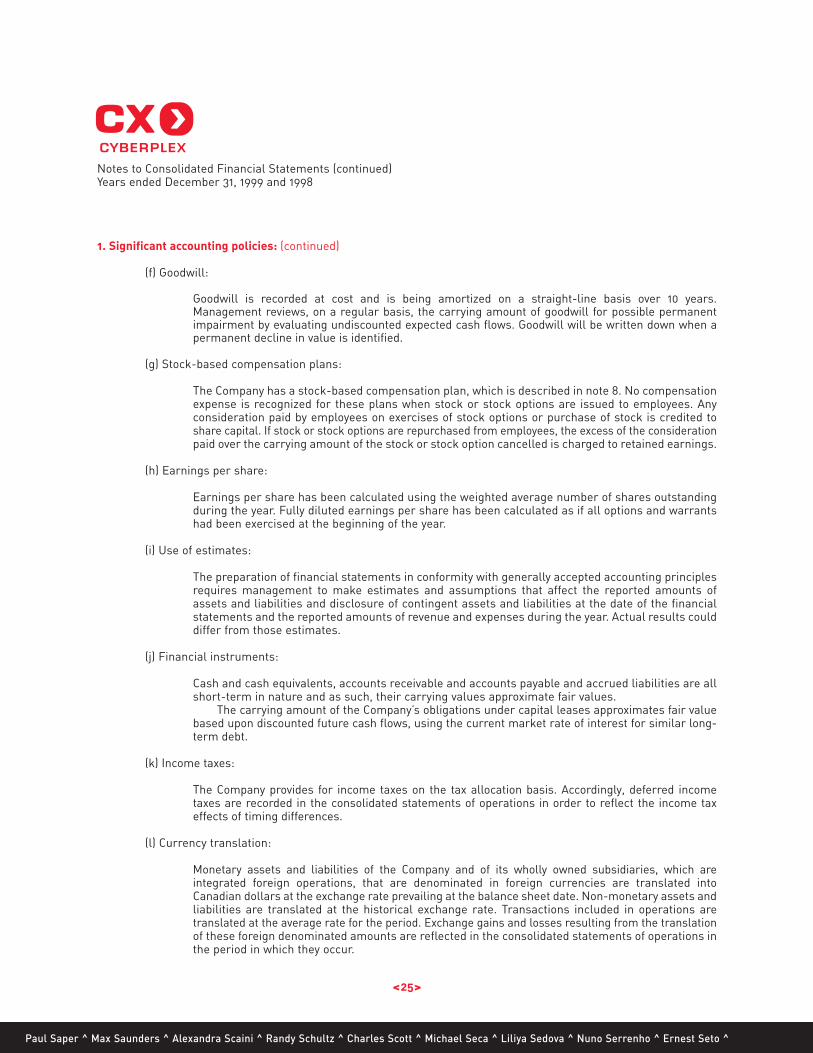
1. Significant accounting policies: (continued)
(f) Goodwill:
Goodwill is recorded at cost and is being amortized on a straight-line basis over 10 years.Management reviews, on a regular basis, the carrying amount of goodwill for possible permanentimpairment by evaluating undiscounted expected cash flows. Goodwill will be written down when apermanent decline in value is identified.
(g) Stock-based compensation plans:
The Company has a stock-based compensation plan, which is described in note 8. No compensationexpense is recognized for these plans when stock or stock options are issued to employees. Anyconsideration paid by employees on exercises of stock options or purchase of stock is credited toshare capital. If stock or stock options are repurchased from employees, the excess of the considerationpaid over the carrying amount of the stock or stock option cancelled is charged to retained earnings.
(h) Earnings per share:
Earnings per share has been calculated using the weighted average number of shares outstandingduring the year. Fully diluted earnings per share has been calculated as if all options and warrantshad been exercised at the beginning of the year.
(i) Use of estimates:
The preparation of financial statements in conformity with generally accepted accounting principlesrequires management to make estimates and assumptions that affect the reported amounts ofassets and liabilities and disclosure of contingent assets and liabilities at the date of the financialstatements and the reported amounts of revenue and expenses during the year. Actual results coulddiffer from those estimates.
(j) Financial instruments:
Cash and cash equivalents, accounts receivable and accounts payable and accrued liabilities are allshort-term in nature and as such, their carrying values approximate fair values.
The carrying amount of the Company’s obligations under capital leases approximates fair valuebased upon discounted future cash flows, using the current market rate of interest for similar long-term debt.
(k) Income taxes:
The Company provides for income taxes on the tax allocation basis. Accordingly, deferred incometaxes are recorded in the consolidated statements of operations in order to reflect the income taxeffects of timing differences.
(l) Currency translation:
Monetary assets and liabilities of the Company and of its wholly owned subsidiaries, which are integrated foreign operations, that are denominated in foreign currencies are translated intoCanadian dollars at the exchange rate prevailing at the balance sheet date. Non-monetary assets andliabilities are translated at the historical exchange rate. Transactions included in operations aretranslated at the average rate for the period. Exchange gains and losses resulting from the translationof these foreign denominated amounts are reflected in the consolidated statements of operations inthe period in which they occur.
<25>
Notes to Consolidated Financial Statements (continued)Years ended December 31, 1999 and 1998
Paul Saper ^ Max Saunders ^ Alexandra Scaini ^ Randy Schultz ^ Charles Scott ^ Michael Seca ^ Liliya Sedova ^ Nuno Serrenho ^ Ernest Seto ^
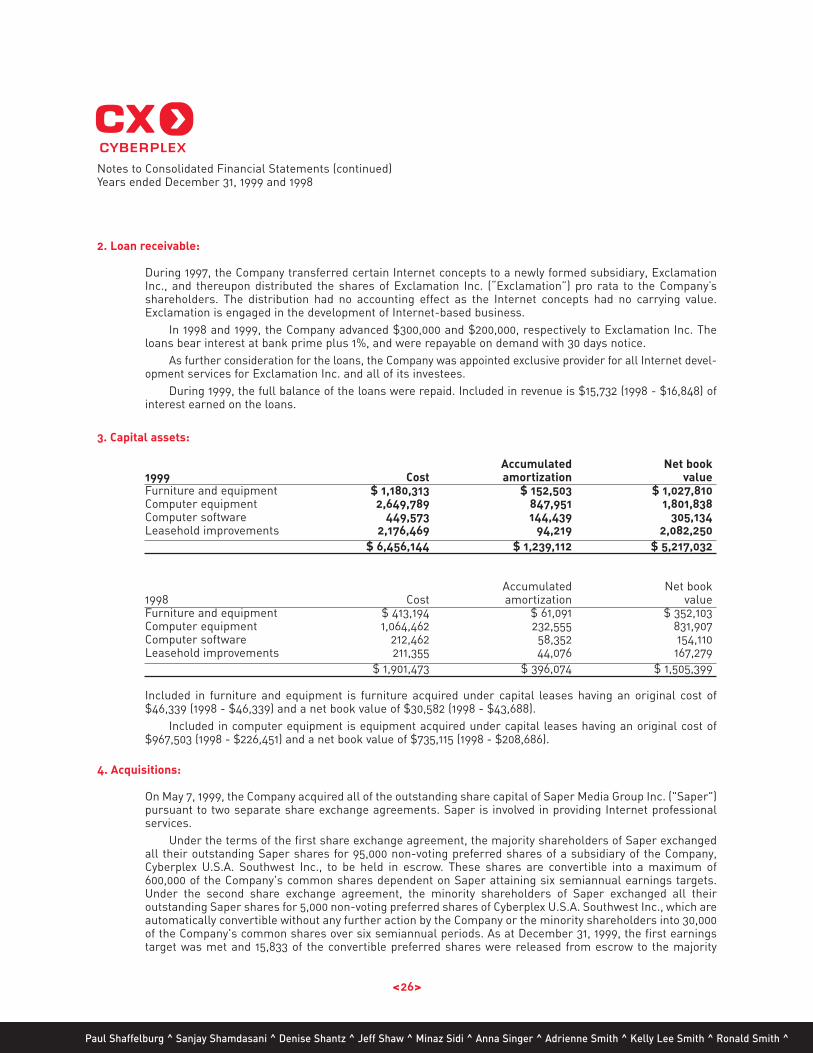
2. Loan receivable:
During 1997, the Company transferred certain Internet concepts to a newly formed subsidiary, ExclamationInc., and thereupon distributed the shares of Exclamation Inc. (“Exclamation”) pro rata to the Company’sshareholders. The distribution had no accounting effect as the Internet concepts had no carrying value.Exclamation is engaged in the development of Internet-based business.
In 1998 and 1999, the Company advanced $300,000 and $200,000, respectively to Exclamation Inc. Theloans bear interest at bank prime plus 1%, and were repayable on demand with 30 days notice.
As further consideration for the loans, the Company was appointed exclusive provider for all Internet devel-opment services for Exclamation Inc. and all of its investees.
During 1999, the full balance of the loans were repaid. Included in revenue is $15,732 (1998 - $16,848) ofinterest earned on the loans.
3. Capital assets:
Accumulated Net book1999 Cost amortization valueFurniture and equipment $ 1,180,313 $ 152,503 $ 1,027,810Computer equipment 2,649,789 847,951 1,801,838Computer software 449,573 144,439 305,134Leasehold improvements 2,176,469 94,219 2,082,250
$ 6,456,144 $ 1,239,112 $ 5,217,032
Accumulated Net book1998 Cost amortization valueFurniture and equipment $ 413,194 $ 61,091 $ 352,103Computer equipment 1,064,462 232,555 831,907Computer software 212,462 58,352 154,110Leasehold improvements 211,355 44,076 167,279
$ 1,901,473 $ 396,074 $ 1,505,399
Included in furniture and equipment is furniture acquired under capital leases having an original cost of$46,339 (1998 - $46,339) and a net book value of $30,582 (1998 - $43,688).
Included in computer equipment is equipment acquired under capital leases having an original cost of$967,503 (1998 - $226,451) and a net book value of $735,115 (1998 - $208,686).
4. Acquisitions:
On May 7, 1999, the Company acquired all of the outstanding share capital of Saper Media Group Inc. ("Saper")pursuant to two separate share exchange agreements. Saper is involved in providing Internet professionalservices.
Under the terms of the first share exchange agreement, the majority shareholders of Saper exchangedall their outstanding Saper shares for 95,000 non-voting preferred shares of a subsidiary of the Company,Cyberplex U.S.A. Southwest Inc., to be held in escrow. These shares are convertible into a maximum of600,000 of the Company's common shares dependent on Saper attaining six semiannual earnings targets.Under the second share exchange agreement, the minority shareholders of Saper exchanged all their outstanding Saper shares for 5,000 non-voting preferred shares of Cyberplex U.S.A. Southwest Inc., which areautomatically convertible without any further action by the Company or the minority shareholders into 30,000of the Company's common shares over six semiannual periods. As at December 31, 1999, the first earningstarget was met and 15,833 of the convertible preferred shares were released from escrow to the majority
<26>
Notes to Consolidated Financial Statements (continued)Years ended December 31, 1999 and 1998
Paul Shaffelburg ^ Sanjay Shamdasani ^ Denise Shantz ^ Jeff Shaw ^ Minaz Sidi ^ Anna Singer ^ Adrienne Smith ^ Kelly Lee Smith ^ Ronald Smith ^
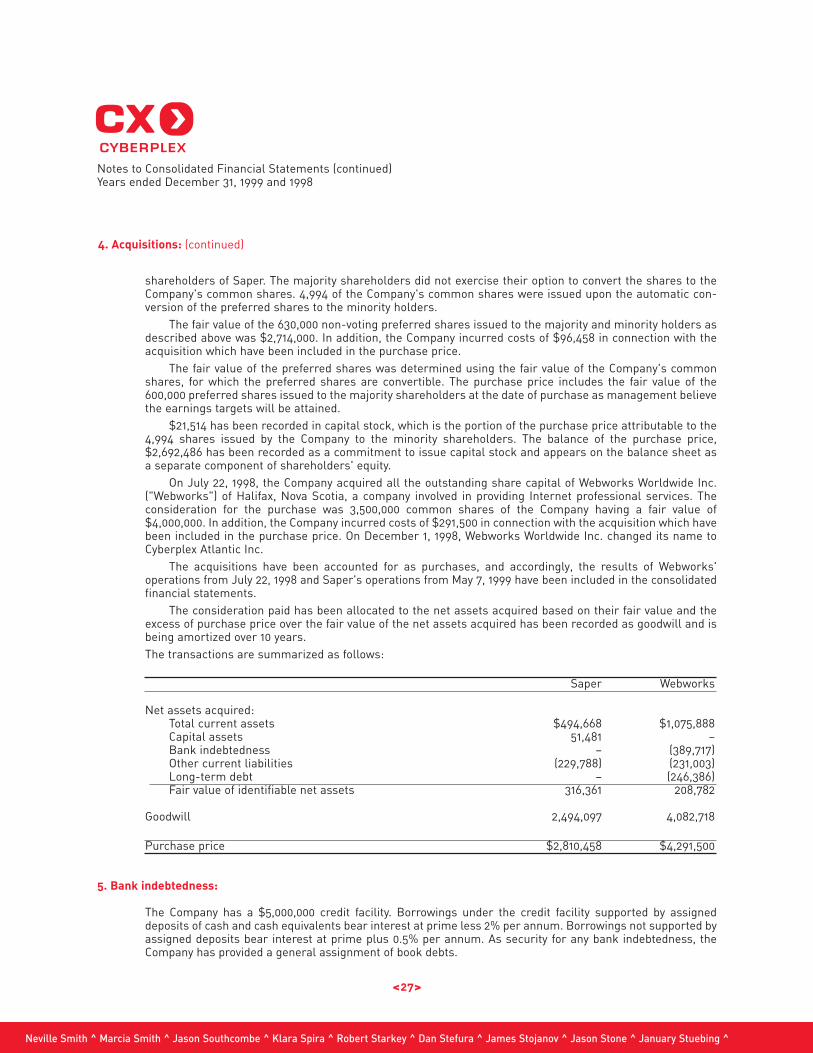
4. Acquisitions: (continued)
shareholders of Saper. The majority shareholders did not exercise their option to convert the shares to theCompany's common shares. 4,994 of the Company's common shares were issued upon the automatic con-version of the preferred shares to the minority holders.
The fair value of the 630,000 non-voting preferred shares issued to the majority and minority holders asdescribed above was $2,714,000. In addition, the Company incurred costs of $96,458 in connection with theacquisition which have been included in the purchase price.
The fair value of the preferred shares was determined using the fair value of the Company's commonshares, for which the preferred shares are convertible. The purchase price includes the fair value of the600,000 preferred shares issued to the majority shareholders at the date of purchase as management believethe earnings targets will be attained.
$21,514 has been recorded in capital stock, which is the portion of the purchase price attributable to the4,994 shares issued by the Company to the minority shareholders. The balance of the purchase price,$2,692,486 has been recorded as a commitment to issue capital stock and appears on the balance sheet asa separate component of shareholders' equity.
On July 22, 1998, the Company acquired all the outstanding share capital of Webworks Worldwide Inc.("Webworks") of Halifax, Nova Scotia, a company involved in providing Internet professional services. Theconsideration for the purchase was 3,500,000 common shares of the Company having a fair value of$4,000,000. In addition, the Company incurred costs of $291,500 in connection with the acquisition which havebeen included in the purchase price. On December 1, 1998, Webworks Worldwide Inc. changed its name toCyberplex Atlantic Inc.
The acquisitions have been accounted for as purchases, and accordingly, the results of Webworks' operations from July 22, 1998 and Saper's operations from May 7, 1999 have been included in the consolidatedfinancial statements.
The consideration paid has been allocated to the net assets acquired based on their fair value and theexcess of purchase price over the fair value of the net assets acquired has been recorded as goodwill and isbeing amortized over 10 years.The transactions are summarized as follows:
Saper Webworks
Net assets acquired:Total current assets $494,668 $1,075,888 Capital assets 51,481 –Bank indebtedness – (389,717)Other current liabilities (229,788) (231,003)Long-term debt – (246,386)Fair value of identifiable net assets 316,361 208,782
Goodwill 2,494,097 4,082,718
Purchase price $2,810,458 $4,291,500
5. Bank indebtedness:
The Company has a $5,000,000 credit facility. Borrowings under the credit facility supported by assigneddeposits of cash and cash equivalents bear interest at prime less 2% per annum. Borrowings not supported byassigned deposits bear interest at prime plus 0.5% per annum. As security for any bank indebtedness, theCompany has provided a general assignment of book debts.
<27>
Notes to Consolidated Financial Statements (continued)Years ended December 31, 1999 and 1998
Neville Smith ^ Marcia Smith ^ Jason Southcombe ^ Klara Spira ^ Robert Starkey ^ Dan Stefura ^ James Stojanov ^ Jason Stone ^ January Stuebing ^
4. Acquisitions: (continued)
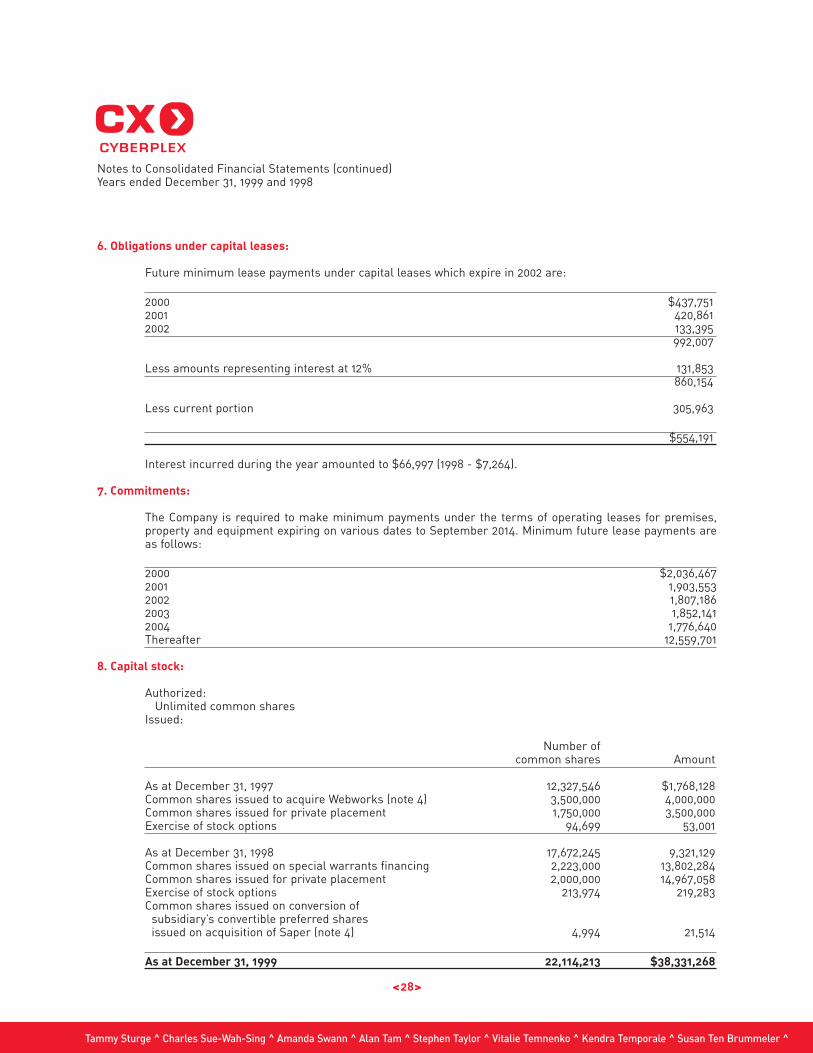
6. Obligations under capital leases:
Future minimum lease payments under capital leases which expire in 2002 are:
2000 $437,751 2001 420,8612002 133,395
992,007
Less amounts representing interest at 12% 131,853860,154
Less current portion 305,963
$554,191
Interest incurred during the year amounted to $66,997 (1998 - $7,264).
7. Commitments:
The Company is required to make minimum payments under the terms of operating leases for premises,property and equipment expiring on various dates to September 2014. Minimum future lease payments areas follows:
2000 $2,036,467 2001 1,903,5532002 1,807,1862003 1,852,1412004 1,776,640Thereafter 12,559,701
8. Capital stock:
Authorized:Unlimited common shares
Issued:
Number ofcommon shares Amount
As at December 31, 1997 12,327,546 $1,768,128 Common shares issued to acquire Webworks (note 4) 3,500,000 4,000,000Common shares issued for private placement 1,750,000 3,500,000Exercise of stock options 94,699 53,001
As at December 31, 1998 17,672,245 9,321,129Common shares issued on special warrants financing 2,223,000 13,802,284Common shares issued for private placement 2,000,000 14,967,058Exercise of stock options 213,974 219,283Common shares issued on conversion of
subsidiary’s convertible preferred sharesissued on acquisition of Saper (note 4) 4,994 21,514
As at December 31, 1999 22,114,213 $38,331,268
Notes to Consolidated Financial Statements (continued)Years ended December 31, 1999 and 1998
Tammy Sturge ^ Charles Sue-Wah-Sing ^ Amanda Swann ^ Alan Tam ^ Stephen Taylor ^ Vitalie Temnenko ^ Kendra Temporale ^ Susan Ten Brummeler ^
<28>
8. Capital stock: (continued)
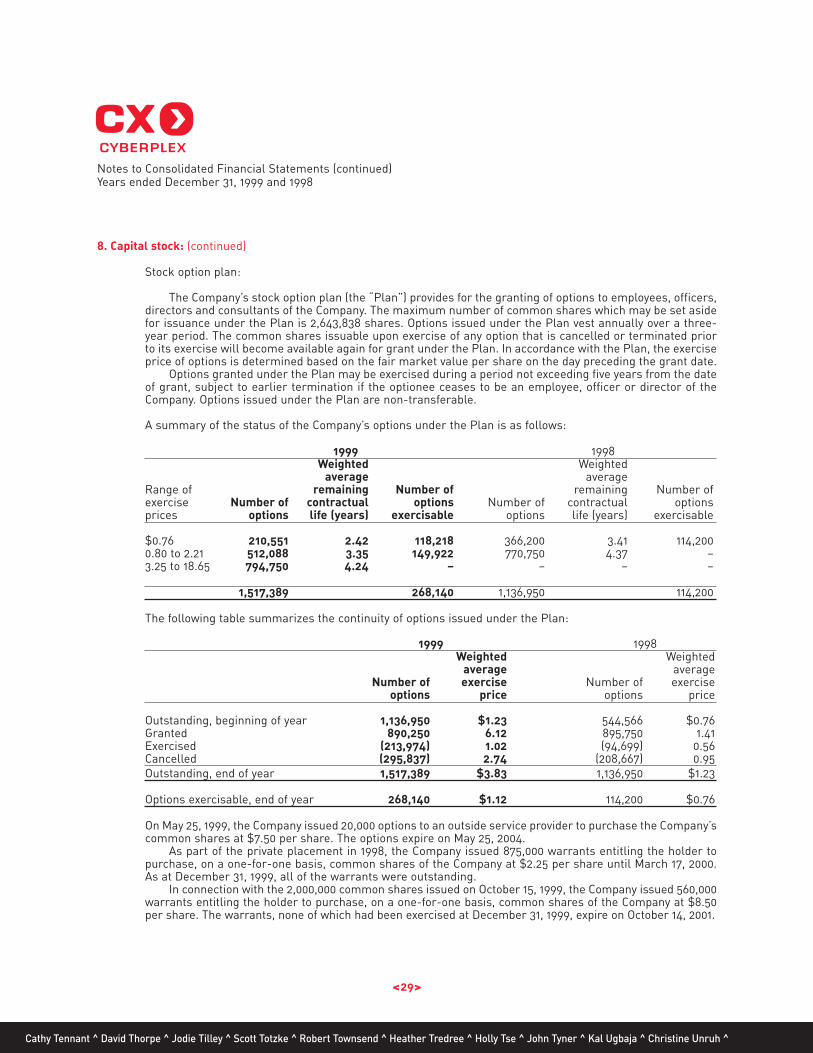
Stock option plan:
The Company’s stock option plan (the “Plan”) provides for the granting of options to employees, officers,directors and consultants of the Company. The maximum number of common shares which may be set asidefor issuance under the Plan is 2,643,838 shares. Options issued under the Plan vest annually over a three-year period. The common shares issuable upon exercise of any option that is cancelled or terminated priorto its exercise will become available again for grant under the Plan. In accordance with the Plan, the exerciseprice of options is determined based on the fair market value per share on the day preceding the grant date.
Options granted under the Plan may be exercised during a period not exceeding five years from the dateof grant, subject to earlier termination if the optionee ceases to be an employee, officer or director of theCompany. Options issued under the Plan are non-transferable.
A summary of the status of the Company’s options under the Plan is as follows:
1999 1998Weighted Weighted
average averageRange of remaining Number of remaining Number ofexercise Number of contractual options Number of contractual optionsprices options life (years) exercisable options life (years) exercisable
$0.76 210,551 2.42 118,218 366,200 3.41 114,2000.80 to 2.21 512,088 3.35 149,922 770,750 4.37 –3.25 to 18.65 794,750 4.24 – – – –
1,517,389 268,140 1,136,950 114,200
The following table summarizes the continuity of options issued under the Plan:
1999 1998Weighted Weighted
average averageNumber of exercise Number of exercise
options price options price
Outstanding, beginning of year 1,136,950 $1.23 544,566 $0.76 Granted 890,250 6.12 895,750 1.41Exercised (213,974) 1.02 (94,699) 0.56Cancelled (295,837) 2.74 (208,667) 0.95Outstanding, end of year 1,517,389 $3.83 1,136,950 $1.23
Options exercisable, end of year 268,140 $1.12 114,200 $0.76
On May 25, 1999, the Company issued 20,000 options to an outside service provider to purchase the Company’scommon shares at $7.50 per share. The options expire on May 25, 2004.
As part of the private placement in 1998, the Company issued 875,000 warrants entitling the holder topurchase, on a one-for-one basis, common shares of the Company at $2.25 per share until March 17, 2000.As at December 31, 1999, all of the warrants were outstanding.
In connection with the 2,000,000 common shares issued on October 15, 1999, the Company issued 560,000warrants entitling the holder to purchase, on a one-for-one basis, common shares of the Company at $8.50per share. The warrants, none of which had been exercised at December 31, 1999, expire on October 14, 2001.
<29>
Notes to Consolidated Financial Statements (continued)Years ended December 31, 1999 and 1998
Cathy Tennant ^ David Thorpe ^ Jodie Tilley ^ Scott Totzke ^ Robert Townsend ^ Heather Tredree ^ Holly Tse ^ John Tyner ^ Kal Ugbaja ^ Christine Unruh ^

<30>
9. Income taxes:
Income taxes reported differs from the amount computed by applying the statutory rates to operating incomebefore income taxes. The reasons are as follows:
1999 1998
Income taxes expense (recovery) based on statutory rates of 45% $ (551,669) $ 155,000
Goodwill amortization 260,996 76,000Utilization of income tax loss – (19,000)Recovery of taxes from prior years 139,000 –Large Corporations Tax 100,000 –Other 22,483 18,000
$ (29,190) $ 230,000
10. Segmented information:
The Company has reviewed its operations and determined that it operates in a single reportable operatingsegment, being the designing and delivering of Internet strategies. As such, amounts disclosed on the financialstatements for revenue, amortization of capital assets and software development costs, and additions to capitalassets also represent segment amounts.
Revenues and assets per geographic location are as follows:
1999 1998
Revenue by geographic locations:Canada $14,952,637 $9,538,858 U.S. 6,179,663 –
$21,132,300 $9,538,858
Capital assets and goodwill by geographic locations:Canada $8,545,993 $5,418,537 U.S. 2,484,837 –
$11,030,830 $5,418,537
In 1999, one customer accounted for 15% of revenue and 14% of accounts receivable. In 1998, one customeraccounted for 38% of revenue and 21% of accounts receivable.
Notes to Consolidated Financial Statements (continued)Years ended December 31, 1999 and 1998
Wendy Varen ̂Rosemary Villalta ̂Daniel Vogel ̂Chris Vulovic ̂Gary Waddell ̂Karen Wade ̂Sean Walker ̂Dennis Wallace ̂Anthony Watts ̂Michelle Weihe ^
<31>
11. Subsequent events:
On February 7, 2000, the Company acquired all the issued and outstanding shares of i-Socket Web CreativeInc. ("i-Socket"), a California company involved in providing Internet professional services, pursuant to twoseparate share exchange agreements. Under the terms of the agreements, 300,000 common shares of theCompany were issued to the vendors on closing and up to a maximum of 2,200,000 common shares of theCompany will be issued, contingent on i-Socket attaining specified sales targets.
In February 2000, the holders of the special warrants issued during 1998 exercised their right to purchase875,000 common shares of the Company for proceeds of $1,968,750.
On March 21, 2000, the Company acquired ProCure.com Inc. for approximately $33,000,000 payable as follows:$3,000,000 in cash; $15,000,000 in a promissory note bearing interest at prime and the balance in commonshares of the Company.
12. Comparative figures:
Certain reclassifications of 1998 amounts have been made to facilitate comparison with the current year.
Notes to Consolidated Financial Statements (continued)Years ended December 31, 1999 and 1998
Andrew White ^ Darin White ^ Matt Wolodarsky ^ Douglas Woodhouse ^ David Woods ^ Edmond Wu ^ Mio Yokoi ^ Breen Young ^ Dejan Zizanovic ^ Lisa Zweig ^
SENIOR MANAGEMENT TEAM::
Dean Hopkins President and CEO An Honors graduate from the University of Waterloo, Mr.Hopkins holds a Bachelor of Applied Science in SystemsDesign Engineering degree. As the co-founder, President andChief Executive Officer of Cyberplex, Hopkins is a recognizedauthority on Internet business strategies and solutions. Inaddition to his hands-on role at Cyberplex, Mr. Hopkinsspeaks regularly to the international business community onthe subject of Internet business strategies. Hopkins has twicebeen a finalist in Ontario’s Entrepreneur of the Year Award.
Christopher Frostad Vice President of Business ArchitectureAfter graduating with an Honors degree in BusinessAdministration from Wilfrid Laurier University in Waterloo,Mr. Frostad spent his next 20 years in a variety of senior rolesin the high-tech industry developing specialized skills inbusiness development, product distribution, and changemanagement. Today, Frostad takes the leadership role inworking with Cyberplex clients to establish their Internetobjectives, define direction, and identify opportunities intheir market.
Geoffrey Rotstein Chief Financial OfficerAfter graduating with his MBA from York University, Mr.Rotstein earned his CA designation in 1993. Prior to joiningCyberplex, Rotstein spent five years with Coopers andLybrand working in General Practice as well as Financial andAdvisory Services. Currently, he is in charge of developing andimplementing financial controls for Cyberplex, which includesestablishing budgets and management policies. He is alsoresponsible for Investor Relations and corporate development.Mr. Rotstein maintains close interaction with shareholders,investment advisors and analysts.
Peter Bier Vice President of ProductionGraduating first in his class, Mr. Bier earned a Master’sDegree in Technology Management from M.I.T. After nearly10 years at Xerox helping build the Xerox ProfessionalServices Organization, Bier brought his valuable management,marketing and strategic skills to Cyberplex in 1998. Hisimpressive background of technology leadership is a tremen-dous asset in the coordination of our production centers tohandle incoming projects and sales forecasts.
Randall Bier Vice President of Client DevelopmentSandwiched between a Computer Science degree from theUniversity of Waterloo, and an MBA from Harvard, are theyears Mr. Bier spent doing large systems engineering workwith IBM. After graduate school, Bier worked at CanadaConsulting, which later became Boston Consulting Group.
Most recently, Bier ran the national sales organization forSteelcase, a multinational office furniture company. WithCyberplex, he assumes leadership for the client-facing organization that is currently composed of our regionaloffices: Toronto, Boston, Charlotte, Austin, San Francisco,Halifax and San Diego, as well as our internal MarketDevelopment Group.
Rob Payne Chief Technology Officer Holding two degrees, a Bachelor of Arts in Economics and aDiploma in Management Studies from Wilfrid LaurierUniversity, Mr. Payne was the co-founder and President ofEmerald Technology Concepts Inc., an Internet software firmacquired by Cyberplex in 1997. Before Cyberplex andEmerald, Payne worked for Clarica Life Insurance Company,one of Canada’s leading financial services firms. As Webmasterand Internet Specialist, Payne launched Clarica’s initial Webpresence and Canada’s first online Group RRSP applicationComfortWEB. Today, he is accountable for the Cyberplextechnical infrastructure, systems and staff, as well as for thetechnology choices, relationships and strategies employed bythe company. Payne is also a member of the Board of Directorsfor vivacare.com, Canada’s first health e-store.
Steve Taylor Vice President of Marketing and Service InnovationAfter earning an Honors Bachelor of Arts degree from theUniversity of New Brunswick, Mr. Taylor spent five years atFuel — a Toronto-based advertising agency. One of the originalemployees at Cyberplex, Taylor not only helped to shape thecompany’s client services approach, but also has been a leadingcontributor in establishing the U.S. Cyberplex presence. Heis also responsible for the development of all brand initiativesand communications as well as fostering, incubating anddriving new service offerings within Cyberplex to ensure asustained competitive advantage.
Tammy Sturge Vice President of Human ResourcesWith an Honors Bachelor of Arts degree from the Universityof Toronto, Ms. Sturge spent 15 years in leading HumanResources roles at Ericsson Communications and Procter andGamble. Now, as the Human Resources leader at Cyberplex,Sturge works closely with senior management to structure anorganization that delivers results. Based on these organiza-tional needs, she works with a team of HR professionals tobuild strong people systems — including recruiting, training,employee relations, compensation, career pathing and succession planning.
BOARD OF DIRECTORS::
Vernon Lobo Chairman of the Board, Managing Director, Mosaic Venture Partners
Dean Hopkins President and Chief Executive Officer of Cyberplex Inc.
Earl I. Rotman Managing Director (Investment Banking) CIBC World Markets Inc.
Geoffrey Rotstein Chief Financial Officer of Cyberplex Inc.
Steve Sadler Chairman and Chief Executive Officer of Eng House Systems Ltd. and Chairman of Helix Investments (Canada) Inc.
Preston Thom Director, Former President of Comdisco Canada Limited from 1988 -1998
Joe Walkush Vice President of Strategy at Science Applications International Corporation (SAIC)
CORPORATE OFFICE:Cyberplex Inc.
267 Richmond Street WestToronto, Ontario M5V 3M6
www.cyberplex.com
PRODUCTION AND SALES OFFICES:
Toronto, Ontario416 597 8889
Waterloo, Ontario519 725 5350
Halifax, Nova Scotia902 429 0805
Austin, Texas512 343 8383
Boston, Massachusetts617 331 9399
Charlotte, North Carolina 704 540 5968
San Francisco, California415 339 1830
SHAREHOLDER INQUIRIES:Cyberplex Inc.
267 Richmond Street WestToronto, Ontario M5V 3M6
Attention: Leslie Hunter, Manager, Public Relations
P: 416 597 8889F: 416 597 2345
TRANSFER AGENTMontreal Trust
600, 530 – 8th Avenue S.W.Calgary, Alberta T2P 3S8
AUDITORSKPMG LLP
Chartered AccountantsYonge Corporate Centre
4120 Yonge StreetSuite 500
Toronto, Ontario M2P 2B8
LAWYERSGowling, Strathy & Henderson
Commerce Court WestSuite 4900
Toronto, Ontario M5L 1J3
