we say price target strategic target buy 0.23 0.33 0 · pdf fileblue ocean equities pty. ltd....
TRANSCRIPT
METALS X LIMITED (MLX)
BLUE OCEAN EQUITIES PTY. LTD.
L39, 88 PHILLIP ST SYDNEY NSW 2000
AFSL 412765 | ABN 53 151 186 935
1
METALS X LIMITED (MLX) INITIATING COVERAGE
Analyst
Phone
Date
Steuart McIntyre
+61 2 8072 2909
3 September 2014
We say Price Target Strategic Target
BUY 0.23 0.33 0.50
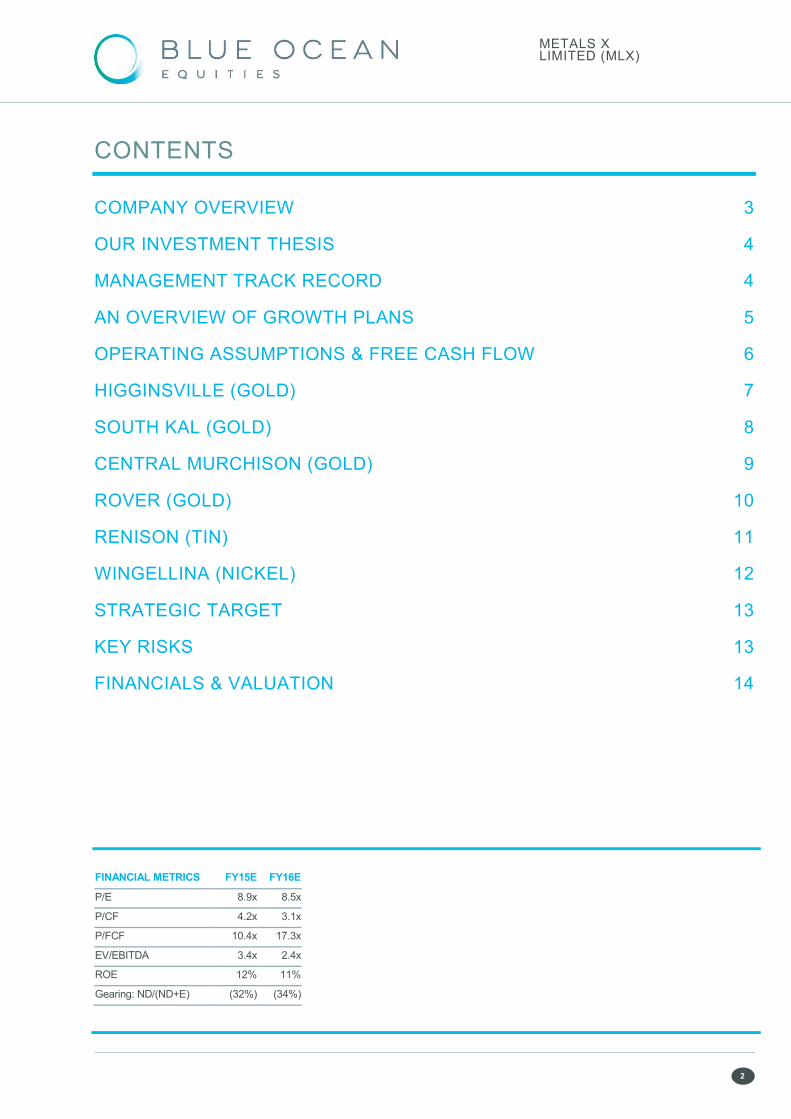
Metals X plans to grow its gold production by over 200% over the next ~4 years
from 150kozpa to ~500kozpa. Importantly, after a series of opportunistic
acquisitions, the capital required to deliver this growth is relatively modest
because the company already has 3 of the 4 process plants in place. On our
forecasts, Metals X will generate $10-15m in free cash flow in FY15 from its
Renison tin mine and has a healthy ~A$62m in cash and bullion and no debt.
MLX SHARE PRICE
PLANNED PRODUCTION GROWTH
COMPANY DATA
Enterprise value A$319m
Diluted market cap A$381m
Diluted shares 1,655m
Free float* 65%
12 month price range 0.10-0.28
GICS sector Materials
* APAC 24.1%, Jinchuan 10.7%, Mgnt 8.4%
IMPLIED RETURN
Capital growth 43%
FY15 dividend 0%
Total expected return 43%
GOLD: STRONG, FULLY FUNDED GROWTH
Metals X has the strongest
planned production growth of any
of the established ASX gold
producers, and on our forecasts
should be able to deliver its
targeted growth plans without the
need for any additional funding.
We assume gold prices close to
current spot and have the
company continuing to build cash
during growth phase over the next
~4 years.
TIN: MOVING TO CASH GENERATION
After significant re-investment
over several years, the
company’s 50%-owned Renison
tin mine in Tasmania, is now at
steady state and expected to
generate A$10-15m in free cash
flow in FY15 and should
continue to generate a similar
cash surplus for the next 8-9
years and potentially
significantly longer.
NICKEL: WINGELLINA THE ‘SLEEPER’
Our Buy call on Metals X is not
reliant on our valuation of Wingellina,
which represents a very modest
A$53m, or A3c, in our NAV. That
said, we see this large nickel laterite
project as a ‘sleeper’ in the portfolio,
which could surprise on the upside at
some future date. Our valuation
assumes a heavy 95% discount to
NPV of the attributable cash flow.
Reducing this discount to 80% adds
~A$150m or A10c to NAV.
$0.10
$0.20
$0.30
Sep-12 Sep-13 Sep-14
MLX
ASX 200 (relative)
ASX Gold Index (relative)
-
100
200
300
400
500
FY15 FY16 FY17 FY18 FY19
kozpa Gold Production
METALS X LIMITED (MLX)
2
CONTENTS
COMPANY OVERVIEW 3
OUR INVESTMENT THESIS 4
MANAGEMENT TRACK RECORD 4
AN OVERVIEW OF GROWTH PLANS 5
OPERATING ASSUMPTIONS & FREE CASH FLOW 6
HIGGINSVILLE (GOLD) 7
SOUTH KAL (GOLD) 8
CENTRAL MURCHISON (GOLD) 9
ROVER (GOLD) 10
RENISON (TIN) 11
WINGELLINA (NICKEL) 12
STRATEGIC TARGET 13
KEY RISKS 13
FINANCIALS & VALUATION 14
FINANCIAL METRICS FY15E FY16E
P/E 8.9x 8.5x
P/CF 4.2x 3.1x
P/FCF 10.4x 17.3x
EV/EBITDA 3.4x 2.4x
ROE 12% 11%
Gearing: ND/(ND+E) (32%) (34%)
METALS X LIMITED (MLX)
3
COMPANY OVERVIEW
Metals X Limited is a ~A$400m miner with plans to substantially grow its gold production from
its mines in WA & NT from 150kozpa to ~500kozpa over the next ~4 years. The company also
has steady state t in production from its 50%-owned Renison mine in Tasmania and the holds
large undeveloped Wingell ina nickel laterite project straddling the borders of WA, NT and SA.
The Metals X team is led by its CEO, Peter Cook and Chairman, Peter Newton, who held the
same posit ions and were the driving force behind the very successful Hil l 50 and Abelle, which
were both acquired by Harmony Gold for A$233m and ~A$200m respectively.
Over the past ~2 years, Metal’s X has undertaken a number of opportunistic acquisit ions of
gold assets in WA & NT, including:
• Reed’s Meekatharra gold assets in WA acquired for $9.8m cash/scrip (June 2014)
o including the refurbished 1.5-2mtpa process plant & supporting infrastructure
o tenements with def ined gold resources of 3.6moz at 1.7g/t (JORC 2004)
o synergies with Central Murchison, removing need to build new plant for $117m
• Alacer’s Australian assets acquired for A$44m cash (October 2013)
o including Higginsvil le (1.3mtpa) & South Kal (1.2mtpa) plants (WA)
o tenements with def ined gold resources of 7.2moz at 2.2g/t (JORC 2004)
o acquisit ion cost repaid from free cash f low within f irst ~6 months
• Westgold acquired in $67m scrip bid for ~73% not already owned (May 2012)
o including the Central Murchison (WA) and Rover (NT) gold projects
o tenements with def ined gold equivalent resources of 3.9moz (JORC 2004)
o Metals X completed a DFS at Central Murchison in Jan 2013
Metals X is also well capitalised with ~$62m in cash and bull ion and no debt at end June 2014.
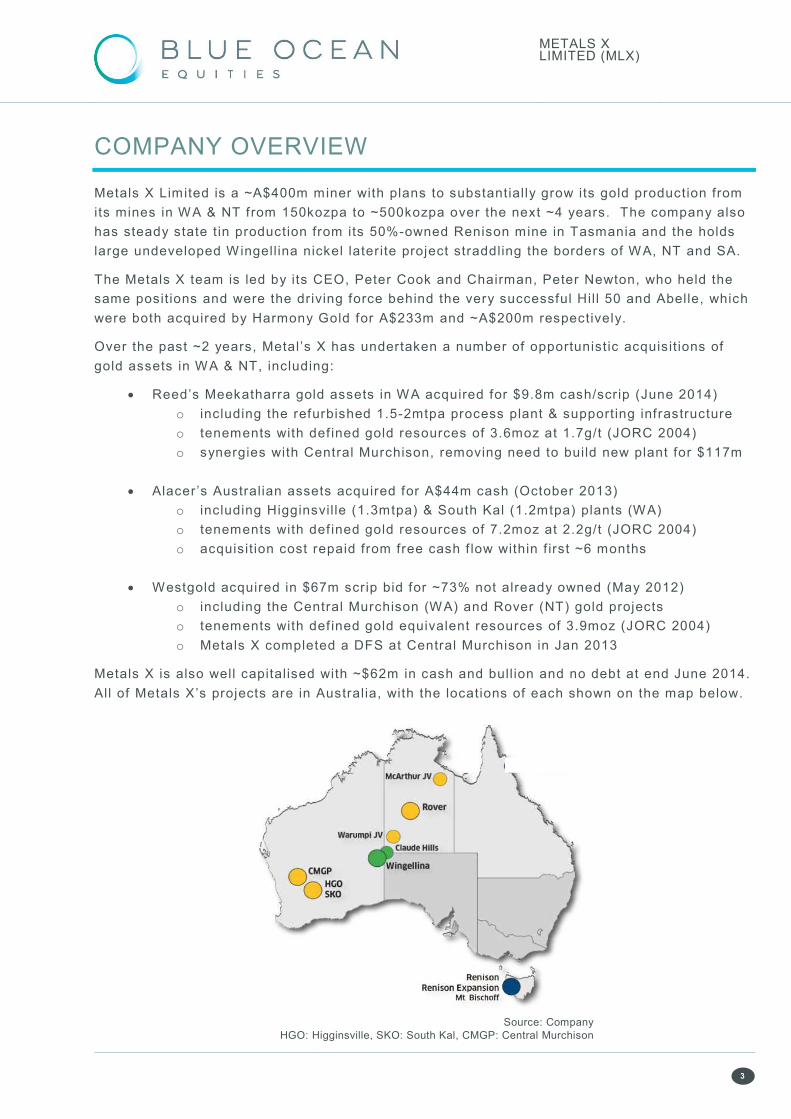
All of Metals X’s projects are in Australia, with the locations of each shown on the map below.
Source: Company
HGO: Higginsville, SKO: South Kal, CMGP: Central Murchison

METALS X LIMITED (MLX)
4
OUR INVESTMENT THESIS
Metals X has the largest planned growth profile in the established ASX gold producers,
coupled with a strong balance sheet . On our forecasts, the company is fully funded and
should be able to fund its growth plans from cash and cash f low, without the need for debt.
After our recent site visit to the company’s WA gold mines we believe the company’s planned
production growth over the next few years should be achievable, and importantly, for relatively
modest init ial capital, given the company already has 3 of 4 required process plants in place.
We believe the market is taking a ‘wait and see’ approach to the company’s growth plans at
present, and with an undemanding FY15 P/E of just 8.9x, in our view Metals X is not
currently priced as a growth stock. We expect the company to steadily undergo a re-rating
as key de-risk ing milestones supporting these growth plans are progressively achieved.
In our view, Metals X also has a number of sleepers in its portfolio, which the market is
currently not ascribing much value, but have potential to deliver a material upside surprise
at some point, namely i ts Wingell ina nickel project and its 50% stake in the Renison tin mine.
MANAGEMENT TRACK RECORD
In recent t imes, in our view, the Metals X team have demonstrated a measured, patient and
opportunistic approach to M&A, which has been a key driver of shareholder value.
Few could argue the company overpaid for its A$44m cash acquisit ion of Alacer’s Australian
assets, where the acquisit ion cost was recovered from free cash f low from these mines within
6-months. After a period of underperformance within the Alacer portfolio, we believe many
investors have an entrenched view that l imited value remains in these assets – however, after
our recent site visits, we don’t agree. In fact, our valuation of Higginsvil le and South Kal is
just shy of A$200m – and we expect the market wil l move towards this valuation in t ime as the
company extends and establishes the high-grade underground reserves at Trident and HBJ.
Similarly, the company’s recent A$9.8m acquisit ion of Reed Resources Meekatharra assets, in
our view demonstrated a patient, prudent and eminently sensible means of acquir ing a
complementary process plant for its Central Murchison project, which only 9-months prior had
estimated init ial development capital of A$117m. Clearly, the cost of bringing the best of these
combined assets into production is now likely to be signif icantly less.
The Metals X team is led by its CEO, Peter Cook and Chairman, Peter Newton, who held the
same posit ions and were the driving force behind the very successful Hil l 50 and Abelle, which
were both acquired by Harmony Gold for A$233m and ~A$200m respectively.
In February 2011, Metals X sold its 19.99% stake in Jabiru to Independence Group for A$48m
in cash and 6.6m IGO shares, result ing in a A$55.3m prof it for Metals X shareholders.
Bottom line, in our view, the Metals X team has a proven track record of successful M&A and
an abil ity to see value that others overlook. The team also has extensive experience operating
and developing mines as well as exploration.

METALS X LIMITED (MLX)
5
AN OVERVIEW OF GROWTH PLANS
Metals X provided the chart below for the f irst t ime in its Diggers & Dealers presentation last
month during which the CEO guided to total group costs of ~A$1,100/oz over this period.
Source: Company. HGO: Higginsville, SKO: South Kal, CMGP: Central Murchison
We visited the company’s WA mines recently and in our view the company’s growth plans
should be achievable. Given a meaningful portion of the company’s growth plans are not yet
underpinned by reserves, our forecasts below assume a slightly slower ramp-up than
company guidance to FY18, predominately at Central Murchison.
We also forecast a drop gold production in FY19 which is a result of our more conservative
view on mine life at Higginsvil le & South Kal, which we assume f inish up in FY18.
In reality we bel ieve it is l ikely both of these mines will continue beyond FY18, but our
forecasts already include ounces from outside reserves (~50koz at Higginsvil le & ~250koz at
South Kal), so for now, until addit ional reserves can be delineated, we assume no production
from these mines in FY19 and beyond.
Source: Company data, Blue Ocean estimates
-
100
200
300
400
500
600
FY15E FY16E FY17E FY18E FY19E
Annual gold production
(koz)
Company Guidance vs. Our Forecasts
Blue Ocean Forecast (koz) MLX Guidance (koz)
METALS X LIMITED (MLX)
6
OPERATING ASSUMPTIONS & FREE CASH FLOW
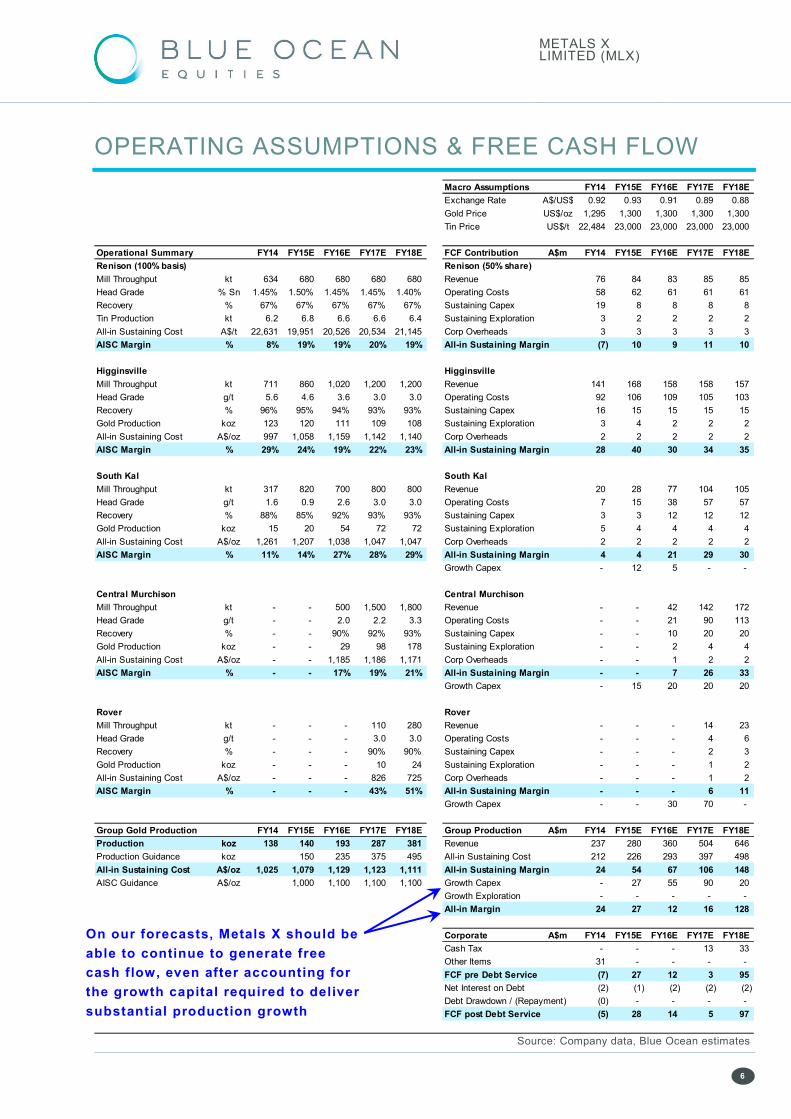
Source: Company data, Blue Ocean estimates
Macro Assumptions FY14 FY15E FY16E FY17E FY18E
Exchange Rate A$/US$ 0.92 0.93 0.91 0.89 0.88
Gold Price US$/oz 1,295 1,300 1,300 1,300 1,300
Tin Price US$/t 22,484 23,000 23,000 23,000 23,000
Operational Summary FY14 FY15E FY16E FY17E FY18E FCF Contribution A$m FY14 FY15E FY16E FY17E FY18E
Renison (100% basis) Renison (50% share)
Mill Throughput kt 634 680 680 680 680 Revenue 76 84 83 85 85
Head Grade % Sn 1.45% 1.50% 1.45% 1.45% 1.40% Operating Costs 58 62 61 61 61
Recovery % 67% 67% 67% 67% 67% Sustaining Capex 19 8 8 8 8
Tin Production kt 6.2 6.8 6.6 6.6 6.4 Sustaining Exploration 3 2 2 2 2
All-in Sustaining Cost A$/t 22,631 19,951 20,526 20,534 21,145 Corp Overheads 3 3 3 3 3
AISC Margin % 8% 19% 19% 20% 19% All-in Sustaining Margin (7) 10 9 11 10
Higginsville Higginsville
Mill Throughput kt 711 860 1,020 1,200 1,200 Revenue 141 168 158 158 157
Head Grade g/t 5.6 4.6 3.6 3.0 3.0 Operating Costs 92 106 109 105 103
Recovery % 96% 95% 94% 93% 93% Sustaining Capex 16 15 15 15 15
Gold Production koz 123 120 111 109 108 Sustaining Exploration 3 4 2 2 2
All-in Sustaining Cost A$/oz 997 1,058 1,159 1,142 1,140 Corp Overheads 2 2 2 2 2
AISC Margin % 29% 24% 19% 22% 23% All-in Sustaining Margin 28 40 30 34 35
South Kal South Kal
Mill Throughput kt 317 820 700 800 800 Revenue 20 28 77 104 105
Head Grade g/t 1.6 0.9 2.6 3.0 3.0 Operating Costs 7 15 38 57 57
Recovery % 88% 85% 92% 93% 93% Sustaining Capex 3 3 12 12 12
Gold Production koz 15 20 54 72 72 Sustaining Exploration 5 4 4 4 4
All-in Sustaining Cost A$/oz 1,261 1,207 1,038 1,047 1,047 Corp Overheads 2 2 2 2 2
AISC Margin % 11% 14% 27% 28% 29% All-in Sustaining Margin 4 4 21 29 30
Growth Capex - 12 5 - -
Central Murchison Central Murchison
Mill Throughput kt - - 500 1,500 1,800 Revenue - - 42 142 172
Head Grade g/t - - 2.0 2.2 3.3 Operating Costs - - 21 90 113
Recovery % - - 90% 92% 93% Sustaining Capex - - 10 20 20
Gold Production koz - - 29 98 178 Sustaining Exploration - - 2 4 4
All-in Sustaining Cost A$/oz - - 1,185 1,186 1,171 Corp Overheads - - 1 2 2
AISC Margin % - - 17% 19% 21% All-in Sustaining Margin - - 7 26 33
Growth Capex - 15 20 20 20
Rover Rover
Mill Throughput kt - - - 110 280 Revenue - - - 14 23
Head Grade g/t - - - 3.0 3.0 Operating Costs - - - 4 6
Recovery % - - - 90% 90% Sustaining Capex - - - 2 3
Gold Production koz - - - 10 24 Sustaining Exploration - - - 1 2
All-in Sustaining Cost A$/oz - - - 826 725 Corp Overheads - - - 1 2
AISC Margin % - - - 43% 51% All-in Sustaining Margin - - - 6 11
Growth Capex - - 30 70 -
Group Gold Production FY14 FY15E FY16E FY17E FY18E Group Production A$m FY14 FY15E FY16E FY17E FY18E
Production koz 138 140 193 287 381 Revenue 237 280 360 504 646
Production Guidance koz 150 235 375 495 All-in Sustaining Cost 212 226 293 397 498
All-in Sustaining Cost A$/oz 1,025 1,079 1,129 1,123 1,111 All-in Sustaining Margin 24 54 67 106 148
AISC Guidance A$/oz 1,000 1,100 1,100 1,100 Growth Capex - 27 55 90 20
Growth Exploration - - - - -
All-in Margin 24 27 12 16 128
Corporate A$m FY14 FY15E FY16E FY17E FY18E
Cash Tax - - - 13 33
Other Items 31 - - - -
FCF pre Debt Service (7) 27 12 3 95
Net Interest on Debt (2) (1) (2) (2) (2)
Debt Drawdown / (Repayment) (0) - - - -
FCF post Debt Service (5) 28 14 5 97
On our forecasts, Metals X should be
able to continue to generate free
cash flow, even after accounting for
the growth capital required to deliver
substantial production growth

METALS X LIMITED (MLX)
7
HIGGINSVILLE (GOLD)
Higginsvil le is located ~125km south of Kalgoorlie and consists of a modern 1.3Mtpa CIP plant
with high grade feed currently sourced from two underground mines, Trident and Chalice,
topped up with lower grade open pit material. Higginsville is expected to produce the lion’s
share of the company’s gold production in FY15, representing 125koz of the group’s
150koz target.
The company provided more detail around its planned ore feed for Higginsvil le in its Diggers &
Dealers presentation last month (see below). The Chalice underground is expected to wind
down by end CY14, but the company is conf ident that the Trident ore body will continue to
deliver ~400-450kt of base-load feed at ~5.5g/t for the next 4-5 years.
Trident has reserves of 279koz at 5.5g/t and resources of 469koz at 5.57g/t. We assume a ~4
year mine life at Higginsvil le ( including 330koz from Trident), but see good potential for mine
life extensions beyond this.
Source: Company
We include a detailed summary of our operational assumptions by mine on page 6 of this
report along with our estimate of free cash f low generation by mine.

METALS X LIMITED (MLX)
8
SOUTH KAL (GOLD)
The South Kal operation consists of the older 1.2mtpa Jubilee plant and surrounding
tenements, which have been mined for the past 25 years. The company plans to continue to
toll treat third party ores as set out in the detailed company guidance below.
Source: Company
The key high-grade ore source for South Kal is the HBJ underground , which is a historic
mine very close to the plant, a long section of which is shown below. While there are no
reserves at South Kal , there is a substantial 3.2moz in resource, and we assume a relatively
modest ~4 year mine life, including 150koz at 4.5g/t f rom the HBJ underground.
The company is in the process of dewatering a refurbishing the historic underground workings
at HBJ with a view to establishing reserves and resuming mining in the June quarter next year.
We estimate dewatering a refurbishing costs of A$13-15m in FY15.
Source: Company

METALS X LIMITED (MLX)
9
CENTRAL MURCHISON (GOLD)
Metals X completed a DFS on its Central Murchison project in January 2013, which estimated
init ial capital of A$117m, predominately to construct a new process plant. Shortly thereafter,
the gold price experienced the sharpest correction in ~30 years and the company elected to
take a more patient approach to development.
In June this year, Metals X acquired Reed Resource’s Meekatharra gold assets to the north
from an administrator for a modest price of $9.8m in cash and scrip, which included a recently
refurbished 1.5-2mtpa processing plant and supporting infrastructure.
The snapshot below shows the combination of these assets alongside the company’s broad
development plan over the next few years.
Source: Company
While the exact details of the development plan are sti l l being f inalised, the broad plan is to
progressively re-open and refurbish 4 historic high-grade underground mines, which will
comprise the base load-feed for the project, supplemented by open pit material.
Given the precise development plan remains a work in progress, we assume a slower ramp up
than company guidance and assume each underground mine costs ~A$20m to re-open and
refurbish over the next few years (for total growth capex of A$80m). We also assume a
relatively modest mine life of 5.5 years until the company can provide more certainty around its
plans and reserve position.
But bottom line at Central Murchison we see significant upside to our forecasts if Metals X
can ramp Central Murchison up to ~250kozpa by FY18, as our forecasts have production
peaking at 187koz in FY19.
METALS X LIMITED (MLX)
1 0
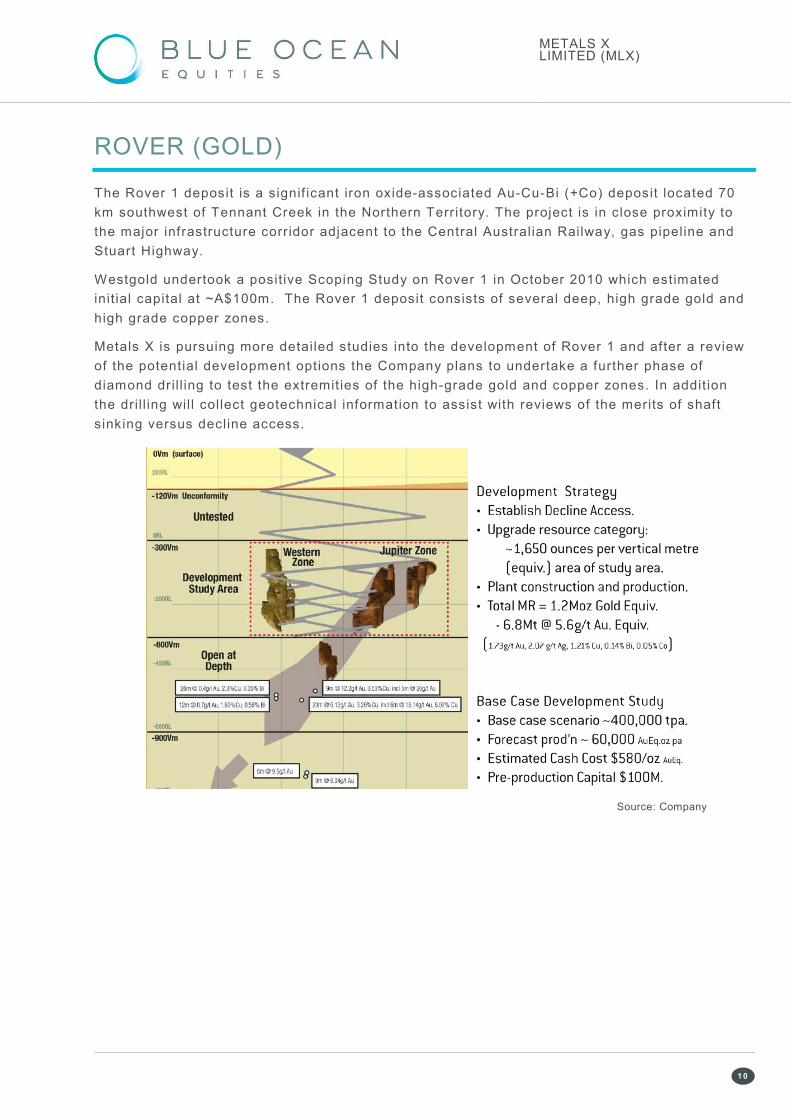
ROVER (GOLD)
The Rover 1 deposit is a signif icant iron oxide-associated Au-Cu-Bi (+Co) deposit located 70
km southwest of Tennant Creek in the Northern Territory. The project is in close proximity to
the major infrastructure corridor adjacent to the Central Australian Railway, gas pipeline and
Stuart Highway.
Westgold undertook a posit ive Scoping Study on Rover 1 in October 2010 which estimated
init ial capital at ~A$100m. The Rover 1 deposit consists of several deep, high grade gold and
high grade copper zones.
Metals X is pursuing more detailed studies into the development of Rover 1 and after a review
of the potential development options the Company plans to undertake a further phase of
diamond dril l ing to test the extremities of the high-grade gold and copper zones. In addit ion
the dril l ing will collect geotechnical information to assist with reviews of the merits of shaft
sinking versus decline access.
Source: Company
METALS X LIMITED (MLX)
1 1
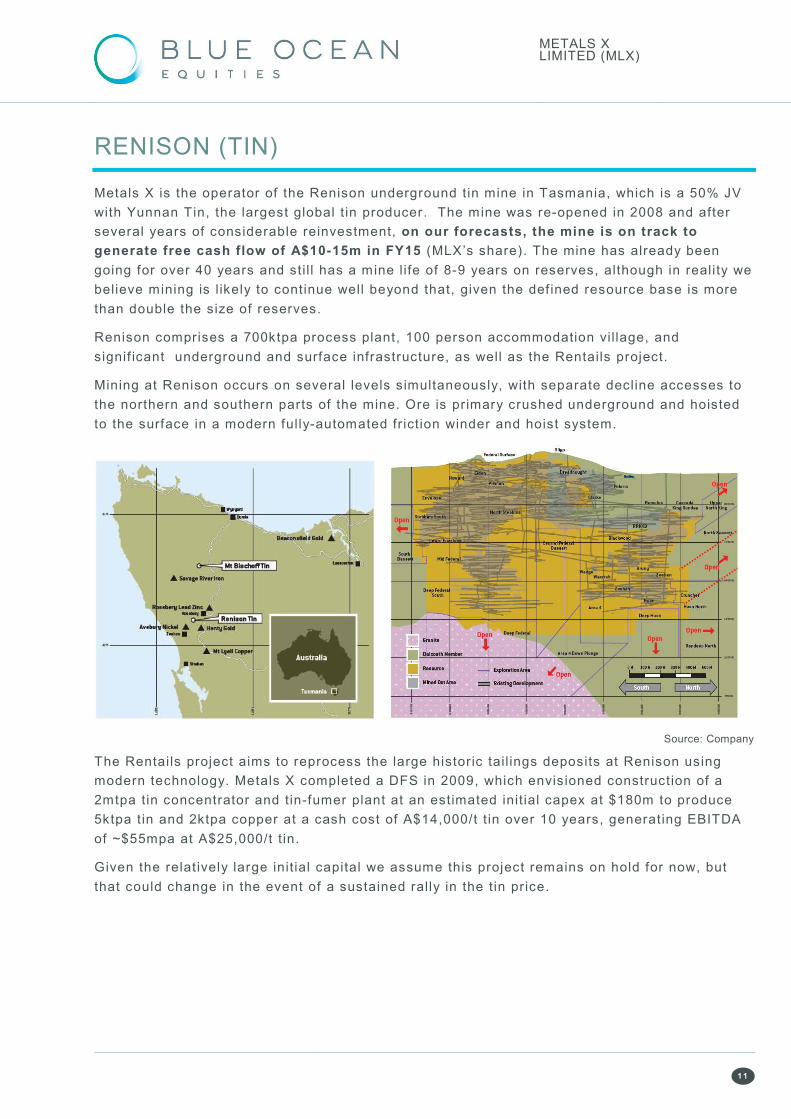
RENISON (TIN)
Metals X is the operator of the Renison underground tin mine in Tasmania, which is a 50% JV
with Yunnan Tin, the largest global t in producer. The mine was re-opened in 2008 and after
several years of considerable reinvestment, on our forecasts, the mine is on track to
generate free cash flow of A$10-15m in FY15 (MLX’s share). The mine has already been
going for over 40 years and sti l l has a mine life of 8-9 years on reserves, although in reality we
believe mining is l ikely to continue well beyond that, given the def ined resource base is more
than double the size of reserves.
Renison comprises a 700ktpa process plant, 100 person accommodation vil lage, and
signif icant underground and surface infrastructure, as well as the Rentails project.
Mining at Renison occurs on several levels simultaneously, with separate decline accesses to
the northern and southern parts of the mine. Ore is primary crushed underground and hoisted
to the surface in a modern fully-automated fr ict ion winder and hoist system.
Source: Company
The Rentails project aims to reprocess the large historic tail ings deposits at Renison using
modern technology. Metals X completed a DFS in 2009, which envisioned construction of a
2mtpa tin concentrator and tin-fumer plant at an estimated init ial capex at $180m to produce
5ktpa tin and 2ktpa copper at a cash cost of A$14,000/t t in over 10 years, generating EBITDA
of ~$55mpa at A$25,000/t t in.
Given the relatively large init ial capital we assume this project remains on hold for now, but
that could change in the event of a sustained rally in the t in price.

METALS X LIMITED (MLX)
1 2
WINGELLINA (NICKEL)
Wingellina is a very large nickel laterite project straddling the borders of WA, NT and SA.
Metals X completed a Feasibil ity Study in September 2008 (+/- 25%, results set out below),
and in September 2012 signed an MOU with Samsung C&T, to collaborate on completing an
updated Detailed Feasibil ity Study (DFS) and to develop the project with Metals X to be diluted
to a 30% stake, but to be free carried to production.
In response to fall ing nickel and cobalt prices and depressed nickel market outlook, a decision
was made in June 2013 to defer further expenditure on the project until economics improve.
Metals X has continued to move forward with the required approvals for Wingell ina, receiving
approval for its updated Environmental Scoping document on 23 May 2014. The f irst draft of
the Public Environmental Review document wil l be submitted by the end of the following
quarter, which is the f inal documentation process step required for EPA approval.
Source: Company
The mineralogy of the Wingell ina ore is a major strength of the project as unlike most
Australian nickel laterite projects, Wingell ina ore has characteristics well suited to High
Pressure Acid Leaching (HPAL), with high iron-oxide grades (resource average 47% Fe2O3)
and a very low concentration of magnesium (resource average 1.6% Mg). Wingell ina is also
one of the largest undeveloped ‘pure oxide’ l imonit ic nickel accumulations in the world.
Bottom Line: We believe Wingellina represents a ‘sleeper’ in the Metals X portfolio and
could be worth several hundred million dollars at some point in the future, and
potentially more.
But given the substantial A$2.5bn required to develop the project, in combination with
complexit ies associated with developing HPAL projects, we ascribe a A$53m valuation for
Wingell ina in our NAV, or A3c a share, based on a very heavy 95% discount of the 30% of the
free cash f low of the project post repayment of init ial capital. Reducing the applied discount
from 95% to 80% would add ~$150m or A10c to our NAV.

METALS X LIMITED (MLX)
1 3
STRATEGIC TARGET
We derive our A$0.50 Strategic Target by increasing production more in l ine with company
guidance and by reducing the discount applied to our valuation of Wingell ina.
Historically many gold stocks traded at a meaningful premium to NAV – typically in the range
of 1.3-1.5x NAV. Our Strategic Target does not factor in a return of this “gold premium”, which
represents further potential upside beyond our Strategic Target.
KEY RISKS
Metals X is exposed to all the normal r isks associated with developing and operating mining
projects. Given a portion of the company’s targeted production is not currently underpinned by
reserves, the abil ity of the company to deliver on these targets remains subject to exploration
success.
Metals X’s revenue is predominately derived from the sale of gold and tin and f luctuations in
these metal prices as well as the Australian dollar could impact the company’s cash f low,
prof itabil ity and share price. All of Metals X’s assets are based in Australia which we regard
as a relatively low-risk jurisdiction.

METALS X LIMITED (MLX)
1 4
FINANCIALS & VALUATION
Source: IRESS, Company data, Blue Ocean estimates
Stock Details Enterprise Value $319m
Recommendation: Buy Diluted MCap $381m
Target $0.33 Share Price $0.23 Diluted Shares 1,655m
NAV $0.33 52 Week High $0.28 Free Float 65%
Implied Return 43% 52 Week Low $0.10 Avg Daily Value $0.4m
Macro Assumptions FY14 FY15E FY16E FY17E FY18E Ratio Analysis FY14 FY15E FY16E FY17E FY18E
Exchange Rate (A$/US$) 0.92 0.93 0.91 0.89 0.88 Diluted Shares m 1,655 1,663 1,663 1,663 1,663
Gold Price (US$/oz) 1,295 1,300 1,300 1,300 1,300 EPS - Diluted Ac 2.4 2.6 2.7 4.0 5.1
Tin Price (US$/t) 22,484 23,000 23,000 23,000 23,000 P/E x 9.7x 8.9x 8.5x 5.7x 4.5x
CFPS - Diluted Ac 4.4 5.5 7.5 9.9 11.4
Profit & Loss (A$m) FY14 FY15E FY16E FY17E FY18E P/CF x 5.2x 4.2x 3.1x 2.3x 2.0x
Revenue 237 280 360 504 646 FCF - Diluted Ac 2.0 2.2 1.3 1.0 6.6
Operating Costs (150) (183) (229) (317) (413) P/FCF x 11.7x 10.4x 17.3x 24.0x 3.5x
Operating Profit 87 97 130 187 233
Corporate & Other (6) (7) (8) (10) (11) Dividends Ac - - - 2.0 2.0
Exploration Expense (7) (4) (4) (5) (5) Dividend yield % - - - 8.7% 8.7%
EBITDA 74 86 119 172 216 Payout Ratio % - - - 50% 39%
D&A (34) (43) (56) (78) (98) Franking % - - - 100% 100%
EBIT 40 43 62 94 119
Net Interest Expense (0) 1 2 2 2 Enterprise Value A$m 324 294 280 292 228
Pre-Tax Profit 40 45 64 96 121 EV/EBITDA x 4.4x 3.4x 2.4x 1.7x 1.1x
Tax (1) (2) (19) (29) (36) ROE % 13% 12% 11% 15% 17%
Minorities - - - - - ROA % 9% 9% 8% 11% 13%
Underlying Profit 39 43 45 67 85 Net Debt / (Cash) (57) (87) (101) (89) (153)
Signficant Items (post tax) (2) - - - - Gearing (ND/(ND+E)) % (22%) (32%) (34%) (25%) (44%)
Reported Profit 37 43 45 67 85 Gearing (ND/E) % (18%) (24%) (25%) (20%) (30%)
Cash Flow (A$m) FY14 FY15E FY16E FY17E FY18E P&P Reserves M&I Resources Inferred
Operating Cashflow 71 90 122 176 221 Gold mt g/t,% moz,kt mt g/t,% moz,kt moz,kt
Tax - - - (13) (33) Higginsville 4.5 3.7 0.5 9.6 3.2 1.0 0.3
Net Interest 2 1 2 2 2 South Kal 1.0 0.7 0.0 33.8 2.0 2.1 1.1
Net Operating Cash Flow 73 91 124 165 190 CMGP/Meek 15.5 2.4 1.2 84.5 2.1 5.6 3.0
Exploration (10) (10) (10) (13) (14) Rover - - - 2.7 2.4 0.2 0.2
Capex (38) (53) (100) (147) (79) 1.7 9.0 4.5
Acquisitions / Disposals (29) - - - - M+I+I (moz): 13.5
Other - - - - - Renison (Tin) 5.9 1.37% 81 8.2 1.58% 130 49
Net Investing Cash Flow (78) (63) (110) (160) (93) Wingellina (Nickel) 167 0.98% 1,645 167 0.98% 1,645 153
Equity Issue 0 2 - - -
Borrowing / Repayments (0) - - - - Earnings Sensitivity FY15E FY16E FY15E FY16E
Dividends - - - (17) (33) A$m A$m % %
Other - - - - - Gold Price US$/oz +10% 11 17 29% 37%
Net Financing Cash Flow 0 2 - (17) (33) Tin Price US$/t +10% 6 6 15% 13%
Change in Cash Position (4) 30 14 (12) 64 Exchange Rate A$/US$ -10% 19 25 48% 56%
FX Adjustments - - - - -
Cash Balance 57 87 101 89 153 Valuation Stake A$m A$/sh
Renison Tin 50% 77 0.05
Balance Sheet (A$m) FY14 FY15E FY16E FY17E FY18E Higginsville Gold 100% 129 0.08
Cash & Cash Equivalents 57 87 101 89 153 South Kal Gold 100% 67 0.04
Other Current Assets 60 60 60 60 60 Central Murchison Gold 100% 126 0.08
PP&E 219 228 272 341 322 Rover Gold 100% 28 0.02
Exploration & Development 95 102 108 117 126 Wingellina Nickel 95% 100% 53 0.03
Other Non Current Assets 1 1 1 1 1 Projects & Exploration 61 0.04
Total Assets 431 478 542 607 662 Corporate & Other (55) (0.03)
Debt 0 0 0 0 0 Debt - -
Other Liabilities 119 121 140 155 158 Cash & Bullion 62 0.04 P/NAV
Net Assets 312 357 402 452 503 Net Asset Value 549 0.33 0.69x

METALS X LIMITED (MLX)
1 5
CONTACTS ANALYST AUTHORITY
Steuart McIntyre
Senior Resource Analyst
P +61 2 8072 2909
Rex Adams
Executive Director
P +61 2 8072 2905
CONTACTS
Rex Adams
Executive Director
P +61 2 8072 2905
Peter Chapman
Senior Resources Analyst
P +61 2 8072 2910
Steuart McIntyre
Senior Resources Analyst
P +61 2 8072 2909
Philip Pepe
Senior Industrials Analyst
P +61 2 8072 2921
Gregg Taylor
Senior Industrials Analyst
P +612 8072 2919
Doc Cromme
Institutional Dealing
P +61 2 8072 2910
Kevin Curran
Institutional Dealing
P +61 2 8072 2914
Tim Potts
Institutional/HNW Dealing
P +61 2 8072 2906
Adam Stratton
Institutional Dealing
P +61 2 8072 2913
Nic van Vliet
Institutional Dealing
P +61 2 8072 2929
HEAD OFFICE
Blue Ocean Equities Pty. Ltd.
P +61 2 8072 2988
www.blueoceanequities.com.au
L 39 Aurora Place
88 Phillip St
Sydney NSW 2000
Australia
AFSL No. 412765
ABN 53 151186935
DISCLAIMER DISCLOSURE This document is a private communication to clients and is not intended for public circulation or for the use of any third party, without the prior approval of Blue Ocean Equities Pty Limited. This is general investment advice only and does not constitute personal advice to any person. Because this document has been prepared without consideration of any specific client’s financial situation, particular needs and investment objectives you should consult your own investment adviser before any investment decision is made on the basis of this document. While this document is based on information from sources which are considered reliable, Blue Ocean Equities Pty Limited has not verified independently the information contained in the document and Blue Ocean Equities Limited and its directors, employees and consultants do not represent, warrant or guarantee, expressly or by implication, that the information contained in this document is complete or accurate. Nor does Blue Ocean Equities Limited accept any responsibility for updating any advice, views opinions, or recommendations contained in this document or for correcting any error or omission which may become apparent after the document has been issued. Except insofar as liability under any statute cannot be excluded. Blue Ocean Equities Pty Limited and its directors, employees and consultants do not accept any liability (whether arising in contract, in tort or negligence or otherwise) for any error or omission in this document or for any resulting loss or damage (whether direct, indirect, consequential or otherwise) suffered by the recipient of this document or any other person.
Blue Ocean Equities Pty Limited, its employees, consultants and its associates within the meaning of Chapter 7 of the Corporations Law may receive commissions, underwriting and management fees from transactions involving securities referred to in this document, and may from time to time hold interests in the securities referred to in this document. Blue Ocean Equities Pty Limited and associates hold 4,527,868 shares in Metals X at the date of this report and this position may change at any time without notice.