»we have made great progress in »we are on the right track for · pdf...
TRANSCRIPT
Annual Report 2001
Siemens Aktiengesellschaft Order No. A19100-F -V055-X-7600
s
»We have made great progress in
networking our internal value
chain electronically and in linking
it to our customers, suppliers and
partners. This is enabling us to
accelerate processes and cut costs.«
s
»We are on the right track for
ensuring our success as the
Global network of innovation.«
An
nu
al R
epor
t 2
001

ImprintDesignations used in this report may be trademarks whose use bythird parties for their own purposes could violate the rights of theirowners.
Concept and coordinationDr. Christoph WegenerCorporate Communicationse-mail [email protected]
LayoutKai Brüninghaus Kommunikationsdesign, Hamburg
PhotographyPeter Rüssmann, Hamburg (pages 4, 7, 8, 11–13, 38–39, 124)Regina Recht, Munich (President and CEO, page 14; Chairman of the Supervisory Board, page 40)All other photos Siemens AG, Munich
ProductionPublicis KommunikationsAgentur GmbH, GWA, Munich
© 2001 by Siemens AG, Berlin and Munich
information on contents
Telephone +49 89 636-33032 (Press Office)
+49 89 636-32474 (Investor Relations)
Fax +49 89 636-32825 (Press Office)
+49 89 636-32830 (Investor Relations)
e-mail [email protected]
address
Siemens AG
Wittelsbacherplatz 2
D-80333 Munich
Federal Republic of Germany
Internet http://www.siemens.com
This Annual Report is also available in French, German
and Spanish.
An abbreviated version has been prepared in Japanese.
for external orders
e-mail [email protected]
Internet http://www.siemens.de/geschaeftsbericht_2001/order
Telephone +49 89 636-32910
Fax +49 89 636-32908
for internal orders
LZF, Fürth-Bislohe
Intranet http://c4bs.spls.de/
Fax +49 911 654-4271
German Order no. A19100-F-V055
English Order no. A19100-F-V055-X-7600
French Order no. A19100-F-V055-X-7700
Spanish Order no. A19100-F-V055-X-7800
Please include postal address and complete company unit
designation (Org-ID) when ordering.
additional reports
Corporate Citizenship Report 2001
Please place external orders at the above address.
Internal orders can be placed at the LZF order center:
German Order no. A19100-F-V091
English Order no. A19100-F-V091-X-7600
Environmental Report 2002 (to be published in May 2002)
Please place external orders at the above address.
Internal orders can be placed at the LZF order center:
German Order no. A19100-F-V015
English Order no. A19100-F-V015-X-7600
Siemens
Siemens is a network encompassing well over 400,000 people in 190 countries.
We take pride in possessing in-depth knowledge of customers' requirements, the
expertise to create innovative solutions in electrical engineering and electronics, and
the experience to successfully navigate even rough economic waters. But our greatest
asset is undoubtedly our people, with their unparalleled motivation and their passion
for outperforming our competitors. Linked via a global network that enables them
to exchange ideas with colleagues around the world, Siemens employees strive
continuously to increase company value.
We at Siemens do not measure value solely in terms of short-term profitability. For
us, it is just as important to be a respected corporate citizen in all the countries in which
we operate. Ever since our company was founded 154 years ago, sustainability has
been a top priority at Siemens. This applies to all our activities – from information and
communications technology to automation, transportation, medical solutions, power
and lighting. Our global network is a network of innovation – a network that draws on
the best of many diverse cultures for the benefit of our customers, our investors, our
employees and our partners.

Table of contents
14 Letter to our shareholders
20 At a glance
24 Corporate structure
27 Business areas
38 Information for shareholders*
40 Report of the Supervisory Board
47 Management’s discussion and
analysis
68 Consolidated statements of income
114 Principal subsidiaries and
associated companies
118 Five-year summary
120 Supervisory Board
121 Managing Board
124 Financial calendar
125 Information resources
* with separate table of contents
Financial highlights
(1) Fiscal year (October 1 – September 30)
(in millions of euros) 2001(1) 2000(1) 1999(1)
New orders 92,528 83,426 69,560
Net sales 87,000 77,484 68,069
Net income 2,088 8,860 1,209
Net cash provided by operating activities 7,016 6,154 3,640
Net cash usedin investing activities (5,886) (435) (2,876)
Research and development expenses 6,782 5,848 5,260
Shareholders’ equity (September 30) 23,812 28,480 19,138
Employees (September 30, in thousands) 484 448 437

“It’s about taking customers to the top.”What do you think our global network of innovation is all about?

Our customers want it all: leading-edge technol-ogies, tailor-made solutions, top-quality services.And, with our global network of innovation,they get it. Our aim is to meet and even exceedour customers’ expectations by continuouslyoptimizing our business processes. To supportthese efforts, we created the top+ businessexcellence program featuring flexible tools thatcan be applied on a business-specific basis world-wide. Our overall goal is to generate the greatestpossible value for our customers. Every time westrengthen a customer, we augment our ownposition as a world leader in the electrical engi-neering and electronics industry.

Wherever people want direct lines of communication andfast access to information, we provide the basics. Fromrapid Internet access, high-performance networks,comprehensive e-business applications and intelligentuser software to electronic supply chains and multi-functional mobile devices – we develop cutting-edgeinformation and communication solutions for today’sfast-paced world. We leverage a wealth of ideas andmarketing expertise to continuously generate innova-tions for use at work, at home and on the road.

“It’s about making connections.”What do you think our global network of innovation is all about?

“It’s about creating new possibilities.”What do you think our global network of innovation is all about?

Innovation is the driver – whetherwe’re developing quality assur-ance software for medicalsolutions or new systems andsolutions for complex infra-structure projects. Every yearwe file more than 5,000 patentapplications, and we currentlyhold more than 120,000 patentrights around the world.We profit every day from theknow-how and initiative of ouremployees – people whoseknowledge and skills we areconstantly upgrading. Thisdynamism is providing our cus-tomers – and us – with moreopportunities than ever beforein our 154 years of operation.

Siemens is one of the most inter-national organizations on earth.Our 484,000 employees in morethan 190 countries are linkedvia a vast network that spans theglobe, providing short paths toour customers and partners andensuring continued internationalgrowth. While Europe is ourhome, we are expanding veryrapidly in the North Americanmarket. And we have a strongposition in Asia, the world’sfastest-growing economic region.

“It’s about global growth.”What do you think our global network of innovation is all about?


“It’s about shaping our future.”
In today’s networked world,ideas emerging from anycorner of the globe canbe rapidly implementedeverywhere. As a global
network of innovation,we aim to initiate, driveand shape key technologi-cal developments. At thesame time, we are fullyaware that our foremostresponsibility is to benefithumankind. Our CorporatePrinciples embody ourcommitment to environ-mental protection and anunderstanding of the vari-ous cultures in which we –as citizens of the world –have made our home.
What do you think our global network of innovation is all about?

“We are facing difficult times. But we know what we have to do.”

15
Letter to our shareholders
Dear Shareholder,
Global economic conditions for our business deteriorated from quar-
ter to quarter throughout the year. We were hit hardest by the fundamen-
tal structural upheaval in the field of information and communications –
primarily attributable to a decreasing willingness to invest on the part of
network operators and enterprise customers. The transition to third-gen-
eration mobile telephony and the associated high license charges, togeth-
er with the shift to Internet protocol-based technologies, often overtaxed
our customers’ financial reserves. Industry was further impacted by the
cooling world economy as well as the direct and indirect repercussions of
the horrifying terrorist attacks on New York and Washington. In a situa-
tion that clearly calls for action, we are confident that we have identified
appropriate responses and will ultimately emerge stronger than ever.
We embarked on fiscal 2001 expecting to further improve on last year’s
record results. And we largely succeeded in the first two quarters. Begin-
ning in the third quarter, however, the costs associated with restructuring
measures and the effects of declining business activity, particularly in the
Information and Communications area and at Infineon Technologies, out-
weighed the excellent earnings achieved by other Groups. As a result, net
income for the year was substantially lower than last year. Nevertheless,
we will propose a dividend of €1.00 per share. Without the special bonus
and adjusted for the effects of the stock split, this would be a slight
increase over last year’s dividend.
Our various operating units are subject to different market cycles:
■ A number of Groups operate in fields whose markets are stable over
extended periods and are currently benefiting from favorable condi-
tions. This applies particularly to power plants, rail systems and med-
ical solutions, which comprise roughly 30 percent of our business.
Our market positions and profitability in these fields are continuing
to improve. An unusually high order backlog indicates that these
successes will be repeated in the coming years.
■ Other Groups – which also contribute about 30 percent of our sales –
are subject to shorter, general business cycles. Two good examples
here are Automation and Drives and Osram. Both units have sustained

16
Letter to our shareholders
high levels of earnings over many years, effectively demonstrating
how a business can cope with economic cycles without significant
declines in income. Their exemplary practice of continually monitor-
ing early market indicators provides the units with early warning of
economic slowdowns, giving them time to take tough and effective
countermeasures.
■ Around 40 percent of our sales depend on industry-specific cycles:
IT markets, automotive electronics and logistics systems. The Groups
involved in these businesses currently face structural problems and
must make adjustments.
■ This is especially true for Infineon Technologies AG, which operates in
an extremely cyclical market. The company is currently facing a mar-
ket slump of unprecedented magnitude. In view of this industry’s
volatility, we decided three years ago to withdraw step-by-step from
the semiconductor business. Since December 2001, Siemens AG holds
less than 50 percent of Infineon.
In my report at the last shareholders’ meeting, I said that the record
results of fiscal 2000 were highly encouraging. At the same time, however,
I stressed that the year was only an intermediate step in our drive to con-
tinue strengthening our Company’s profitability. And we are repeating
this message, even though general business conditions have sharply dete-
riorated. In December 2000 we defined the specific margin target each
Group should reach by fiscal 2003. We are focusing all our efforts on meet-
ing these goals. The five most important action areas comprise our Opera-
tion 2003.
We are giving top priority to implementing measures to increase prof-
itability in our Information and Communications Groups.
■ Information and Communication Mobile is showing the most success
to date. The Group quickly recovered from turbulent market conditions
and adjusted to the new situation. Capacity adjustments in the mobile
phone sector and measures to secure earnings in mobile networks are
taking hold. Earnings from operations have stabilized.

17
Letter to our shareholders
■ Information and Communication Networks has undertaken a basic
reorientation of its business. Drawing on proven tools from our
company-wide top+ program for business excellence, the Group has
defined concrete measures that are monitored and, if needed, fine-
tuned on a monthly basis. These measures include reducing the num-
ber of production sites by half, optimizing sales channels and acceler-
ating development activities in promising innovation fields.
■ The focus at Siemens Business Services is on improving project man-
agement and adjusting capacity in the IT services sector. The necessary
measures have been implemented.
We are making solid progress in our second Operation 2003 action
area, the integration of Dematic and VDO, which we acquired from
Mannesmann Atecs. Siemens Dematic and Siemens VDO Automotive have
launched comprehensive restructuring and integration programs. These
initiatives – based on our experiences with top+ – are expected to generate
productivity gains of one billion euros in each Group within a short time.
■ Siemens Dematic is further extending its global lead as a complete
provider of logistics solutions. While this field has especially strong
growth potential, it is currently undergoing a reorientation phase due
to weaker demand in selected customer segments. Targeted productiv-
ity and growth initiatives aim at ensuring sustainable success.
■ The product portfolio of Siemens VDO Automotive is focused on the
highest-growth fields in the automotive supply industry – primarily,
infotainment, engine management and passenger safety systems.
The merger of Siemens Automotive and VDO has created a leading
company in the field of automotive electronics. Restructuring and
measures to focus the product portfolio are nevertheless unavoidable
due to current problems in the industry and to our integration meas-
ures.
The third action area centers on our U.S. business. As a result of organ-
ic growth and acquisitions, our business volume in the U.S. now exceeds
our level in Germany. Since this is not yet the case for earnings, we have
launched our top+ U.S. Business Initiative to substantially increase profits.
The program covers strategies and business processes at our individual
U.S. operating companies as well as measures for improving company
synergies.
■ We are optimizing our U.S. portfolio and restructuring the operations
of our U.S. companies. The strategy is focused on strengthening some
companies and reevaluating the business potential of others.

18
Letter to our shareholders
■ In addition, we are increasingly successful in our intensified drive to
present one face to key customer groups. We are also making solid
progress in setting up shared services for corporate functions used by
a number of operating companies.
One overriding priority of our top+ program – along with innovation
and quality management – is asset management. The fourth action area of
Operation 2003 is focused on further reducing our employed capital and
improving our cash flow. Notable successes have already been achieved in
a short time. We substantially improved our liquidity in the fourth quarter
of the past fiscal year.
And finally, the fifth action area is aimed at reducing costs at corporate
headquarters. In fiscal 2002 we are targeting cuts of 15 percent, with
reductions of at least this magnitude planned for the following year. Simi-
lar measures are also being carried out at the headquarters of our operat-
ing Groups and in our regional companies.
The difficulties that affected major parts of our business beginning in
the third and fourth quarters were largely caused by external factors. Nat-
urally this is a cause for concern. However, we are meeting the challenges
head-on, and will emerge from this phase stronger than ever. Nothing is
sacred in our drive to strengthen the Company, and we are making sure
that we implement not stop-gap measures but initiatives that will enable
us to thrive in the long term.
In difficult times like these, it is a particular concern of mine that we
don’t just automatically resort to cost-cutting. We will reduce personnel
only after careful consideration and only as part of a future-oriented pro-
gram. Our main focus is on organizational and strategic issues and, above
all, on innovations in products, systems and business processes. In fiscal
2001, our outlays for research and development reached a new high,
reflecting the importance we attach to innovation.

19
Letter to our shareholders
This past year brought many disappointments for the capital markets.
The illusions many harbored about the New Economy have all gone up
in smoke. A creative business idea – preferably linked to the buzzword
dotcom – is just not an adequate basis for the future. Unfortunately, solid
companies like Siemens have also been caught in the backlash. But this
will not deter us.
A year ago, I described how we are melding our industrial competen-
cies with the advantages of e-business to transform Siemens into a New
Economy company with substance. This effort is continuing. We have
made great progress in networking our internal value chain electronically
and in linking it to our customers, suppliers and partners. This is
enabling us to accelerate processes and cut costs. We are consolidating our
competencies in e-business, IT infrastructure and the worldwide stan-
dardization of business processes and combining them in the new Corpo-
rate Information and Operations unit. Our global electronic network
enables us to leverage our Company’s vast synergy potential across all
divisions and regions better than ever before, giving us a decisive compet-
itive advantage.
While structural problems in the field of information and communica-
tions have driven many of our competitors up against the wall, Siemens –
whose competencies extend across several sectors of electronics and elec-
trical engineering subject to different business cycles – is less exposed. As
our response to the great challenges of the day attests, with our broad
business portfolio we have what it takes to weather economic crises and
achieve long-term success – to the benefit of our customers, our share-
holders and our employees. We are poised to show that we can exploit
these advantages once again to improve the bottom line.
Dr. Heinrich v. Pierer
President and Chief Executive Officer
Siemens AG

20
At a glance
At a glance
Other
1%
Germany
52%
North America
8%
Continental Europe(excluding Germany)
29%
Britain
10%
Shareholders by region
As of September 30, 2001, the capital
stock of Siemens AG totaled approximately
€2.7 billion, representing some 888 million no-par value shares in regis-
tered form. Each share has one vote.
The shares of Siemens AG are traded on all German stock exchanges,
the Swiss stock exchange, and stock exchanges in London, Paris and New
York. On the New York Stock Exchange, Siemens shares are traded in the
form of ADRs (American Depositary Receipts), with one ADR corresponding
to one Siemens share.
The Siemens share
The number of Siemens shareholders
increased substantially during the
last fiscal year. More than one million shareholders are currently listed
in our share register. According to the share register, approximately
25% of the capital stock is held by private investors and 27% is owned
by investment companies and insurance companies. Credit institutes
and central securities depositaries are listed in the stock register as
holding 48% of the capital. The majority of these shares are held for
shareholders outside of Germany.
More than half of the capital stock is owned by shareholders in
Germany. Most of the shareholders outside of Germany – roughly
29% – are in other continental European countries, primarily in
Switzerland, Belgium and Luxembourg. Approximately 18% of the
capital is held in North America and Britain.
Shareholder profile
In fiscal 2001, Siemens earned €2.1 billion
in net income including Infineon and
special items as well as restructuring charges and asset write-downs.
This result was considerably below last year’s figure. However, in fiscal
2000 we had substantially higher special gains and lower special
charges.
ebita from Operations (excluding Infineon) was €1.3 billion.
Last year, this figure was €2.8 billion.
Despite the difficult market environment, our net cash provided
from Operations reached €7.0 billion, surpassing last year’s high
figure of €6.2 billion. Our efforts in asset management are paying off.
Earnings trend
www.
Figures reflect the stock split that took effect on April 30, 2001(one additional share issued for every two shares held).(1) Fiscal year (October 1 to September 30)(2) To be proposed at the Annual Shareholders’ Meeting(3) Dividend of €0.93 plus extra dividend of €0.67
Stock market information
(in euros) 2001(1) 2000(1) 1999(1)
Stock price range (xetra closing prices, Frankfurt)
High 105.77 127.67 57.53
Low 37.50 50.65 26.93
Year-end 41.89 97.33 51.60
Number of shares (year-end, in millions) 888 883 892
Market capitalization(year-end, in millions of euros) 37,208 85,939 46,037
Per-share data
Earnings per share 2.36 9.97 1.36
Earnings per share (fully diluted) 2.36 9.96 1.36
Dividend (comparable) 1.00(2) 1.60(3) 0.67

21
At a glance
Stock performance
DAX®Siemens
(indexed)
10/1/2000 9/30/2001
Dow Jones STOXX®
70
90
110
130
150
170
190
210
230
250
Purchasing by region
Other
3%
Germany
30%
Asia-Pacific
8%
TheAmericas
26%
Europe(excluding Germany)
33%
Last fiscal year, our
purchasing volume
totaled approximately €42 billion, or 48% of sales for
the year. Nearly half of this figure is attributable to
production materials, including everything from raw
materials to complete modules. Outlays for products
– such as systems components and software – that
we sell to customers accounted for just over one-
third of the total, while services ranging from mainte-
nance to consulting comprised roughly one-fifth.
In a move to create a worldwide purchasing net-
work, Siemens is reshaping its processes and struc-
tures both within the company and in its dealings
with its more than 7,500 strategic suppliers. The aim
is to join forces on the procurement markets and
optimally exploit existing purchasing know-how
throughout the company. Already last year, this
approach enabled us to bundle purchases worth
€17.1 billion in more than 130 material fields and
service segments.
With 10% of our purchasing volume already
transacted electronically, our goal is to reach the 50-
percent mark in the medium term. To help us reach
this goal, we have established click2procure, a com-
pany-wide electronic purchasing platform. All major
suppliers are currently linked to this platform. More
than 30,000 Siemens users can choose from approxi-
mately one million articles in our catalogs, which
include everything from office supplies to electronic
components. In the next few years, click2procure will
become one of the world’s largest virtual purchasing
marketplaces.
Purchasing network
In fiscal 2001, sales climbed 12% to €87 billion. While sales in
Germany remained virtually unchanged, our business in the other
regions increased 16% to €67.9 billion. Siemens generated 78% of its
sales outside Germany. The U.S. made a key contribution, with sales
in the region climbing nearly 24%. In Asia-Pacific, sales rose 11%, with
a 43% jump in the growing Chinese market. In Europe outside
Germany, sales increased 9%.
12%
31%
27%
68.1
Germany
Europe(excluding Germany)
The Americas
Asia-PacificOther
25%
13%
24%
77.5
27%
13%
30%
22%
87.0
30%
31%
5%
5%
5%
Sales by region (in billions of euros)
siemens.com
1999 2000 2001

22
At a glance
At a glance
Employees worldwide
Germany
41%
Europe(excluding Germany)
25%
Other
1%
Asia-Pacific
11%
The Americas
22%
Our more than 150-year history is a
management success story extend-
ing over generations. The principle
governing all our actions was – and
is – sustainability. By sustainability,
we understand long-term economic
growth coupled with environmental
awareness and social commitment.
Our global social responsibility –
described in detail in our Corporate
Citizenship Report – encompasses
seven areas. Of these, Dialogue is
the central element linking our com-
mitment to our employees (on the
left of the diagram) with our respon-
sibilities to society (on the right of
the diagram).
We are a founding member of
the Econsense Forum for Sustainable
Development, an initiative of the
German business community. The
Forum, to which more than 20 Ger-
man-based multinational companies
belong, is a platform for stakeholder
dialogue on the concept of sustain-
ability and its integration into busi-
Sustainability
ness strategies. At Siemens, responsibility for sustainability is vested in
our Sustainability Strategy Council.
Investors and the general public are also showing increasing interest
in sustainable business development. This is reflected in the growing
importance of the Dow Jones Sustainability Index (DJSI) which evaluates
companies in terms of sustainability criteria. Siemens was listed on the
DJSI for the second time in 2001, due primarily to our environmental
activities, our social commitment and our long-term orientation toward
profitability.
Focuses of our social commitment
Siemens had 484,000 employees
at the end of fiscal 2001 – 36,000
more than a year earlier. This increase is primarily due to the integration of
Mannesmann VDO and Mannesmann Dematic. While women, who make
up 26% of our global workforce, currently fill just 8.5% of our nearly
70,000 management positions, they account for 21% of our new universi-
ty-trained employees.
Our commitment to vocational training and continuing education is
unwavering. About 40% of the €500 million we invested in this area in fis-
cal 2001 flowed into vocational training and 60% into continuing educa-
tion. Our vocational training programs span 35 professions and courses of
study. Some 13,000 young people are currently enrolled in apprenticeship
and work-study programs. More than half of our employees have taken
part in continuing education initiatives. The focus here is on e-business. To
help employees learn to use the Web, we have developed Netracer, an
online training course.
Employees and training
Diversity
Employee-orientedpolicies
Training Learning andresearch
Publicwelfare
Arts andculture
Dialogue

23
At a glance
With investments of €6.8 billion, Siemens maintained its world-lead-
ing position in research and development in the electronics and elec-
trical engineering sector. The lion’s share of these outlays again
flowed into our Information and Communications area, since these
technologies are also vital for all our other business areas. This is
reflected in the high software development costs, which account
for some 60% of our R&D expenditures. Roughly 60,000 Siemens
researchers in over 30 countries are at work on new products, sys-
tems and services.
To help us systematically plan R&D strategies, we have devel-
oped Pictures of the Future, a process for generating holistic visions of
tomorrow’s developments in our various business areas. Proceeding
from these visions, we can derive not only future technology trends
and market potentials but also customer requirements, business
opportunities, new ways of working and changes in value-added
structures.
Investments in research and development
In fiscal 2000, our researchers
turned out 9,060 inventions. Of
this total, 2,430 originated at
Infineon. We filed 6,330 new
patent applications (1,850 of which
came from Infineon). According
to the official records for 2000,
Siemens AG is the largest patent
applicant at both the German
Patent and Trade Mark Office and
the European Patent Office. The
company holds sixth place at
the U.S. Patent and Trademark
Office.
Inventions
Research and development worldwide
Informationand Commu-
nications
R&D expenditures(in billions of euros)
Automationand Control
PowerTransportation
Medical
34%
Lighting
Other 17%
Infineon 14%
36%
9%
18%
38%
18%
5.3
5.8
6.8
1999 2000 2001
7%
8%
13%
6%
9%
10%
12%
13%
R&D centers:
20 locations or more
3 – 6 locations
single location
7% 6%
3%
3%
4%
3%
6%
6%

24
At a glance
Corporate structure
Managing Board
Operations
Heinrich v. Pierer,Dr. jur. Dr.-Ing.E.h. President and ChiefExecutive Officer
Head of CDSpecial responsibilities: CC, ECR
Volker Jung, Dr.Eng.h.c.
Special responsibilities: ICN, ICM, SBS Africa, Middle East,C.I.S.
Edward G. Krubasik,Prof. Dr. rer.nat.
Special responsibilities: SD, SBT, TS, SV CT
Heinz-Joachim Neubürger
Head of CFSpecial responsibilities: SFS, SRE
Peter Pribilla, Prof.
Head of CPSpecial responsibilities: MCP
Jürgen Radomski
Special responsibilities:Med, Osram CIO, GPLEurope
Uriel J. Sharef, Dr. rer.pol.
Special responsibilities: PG, PTDThe Americas
Klaus Wucherer, Dr.-Ing.
Special responsibilities: A&D, I&S Asia, Australia
Thomas Ganswindt
Michael Kutschenreuter Anthony MaherAndy W. MattesAnton Hendrik Schaaf
Information and Communication Networks (ICN)
Rudi Lamprecht
Joe Kaeser Lothar Pauly
Information and CommunicationMobile (ICM)
Paul A. Stodden
Reinhart Bubendorfer Winfried Büttner, Dr.-Ing.
Siemens Business Services GmbH & Co. OHG (SBS)
Information and Communications
Helmut Gierse
Anton S. HuberAlfred Ötsch
Automation and Drives(A&D)
Joergen Ole Haslestad
Bernd Euler Joachim Möller Udo N. Wagner, Dr. rer.oec.
Industrial Solutions and Services(I&S)
Dietmar Straub, Dr. rer.nat.
Peter DrexelAlfred FrankPete James Metros
Siemens Dematic AG (SD)
Oskar K. Ronner
Hubert Ovenhausen Rolf Renz
Siemens Building Technologies AG(SBT)
Automation and Control
Klaus Voges
Andreas KleyNorbert KönigRandy H. Zwirn
Power Generation(PG)
Heinrich Hiesinger, Dr.-Ing.
Hans-Jürgen Schloß, Dr.-Ing.
Power Transmission and Distribution(PTD)
Power
Herbert H. Steffen
Hans-Dieter BottHans M. Schabert
Transportation Systems(TS)
Franz Wressnigg, Dr.-Ing.
Klaus Egger, Dr.-Ing. Günter HauptmannJohann Löttner
Siemens VDO Automotive AG(SV)
Transportation
Regional Offices, Regional Companies, Representative Offices, agencies
Regional organization
Corporate Executive Committee

Financing and Real Estate Corporate Departments Corporate Centers
Erich R. Reinhardt,Prof. Dr.-Ing.
Head of Med
Claus Weyrich,Prof. Dr.phil. Dr.-Ing.E.h.
Head of CT
Rudi Lamprecht
Head of ICM
Erich R. Reinhardt, Prof. Dr.-Ing.
Hermann Requardt, Dr.phil.nat. Götz Steinhardt
Medical Solutions(Med)
Medical
Wolf-Dieter Bopst, Dr.oec.publ.
Jörg Schaefer, Dr.-Ing. Thomas Seeberg, Dr. rer.pol.
Osram GmbH
Lighting
Herbert Lohneiß, Dr. rer.nat.
Siemens Financial Services GmbH (SFS)
Peter Niehaus, Prof.
Dieter BrieseJochen Scharpe, Dr. rer.pol.
Siemens Real Estate(SRE)
Heinz-Joachim Neubürger
Charles HerlingerKarl Heinz MidunskyAlbrecht Schäfer, Dr. jur.
Corporate Finance (CF) Corporate Communications (CC)Eberhard Posner, Dr. rer.oec.
Corporate Information and Operations (CIO)Friedrich Fröschl, Dr. rer.nat.
Global Procurement and Logistics(GPL)Erich Hautz, Dr. rer.comm.
Chief Economist /Corporate Relations(ECR)Bernd Stecher, Dr.sc.pol.
Management Consulting Personnel(MCP)Karl-Heinz Sämann, Dr.-Ing.
as of January 1, 2002
Members of the Supervisory Board arelisted on page 120.
Peter Pribilla, Prof.
Günther G. Goth
Corporate Personnel (CP)
Claus Weyrich, Prof. Dr.phil. Dr.-Ing.E.h.
Horst Fischer, Dr. rer.nat.
Corporate Technology (CT)
Heinrich v. Pierer, Dr. jur. Dr.-Ing.E.h.
Johannes Feldmayer Pamela KnappVolkart P. Matthäus
Corporate Development (CD)
25
At a glance

Siemens’ business portfolio comprises the following business areas:
■ Information and Communications
■ Automation and Control
■ Power
■ Transportation
■ Medical
■ Lighting
The individual Groups within these areas are responsible for their own
worldwide operations, with regional units around the globe supporting
their efforts.
This decentralized structure gives the Groups the greatest degree
of entrepreneurial responsibility and the ability to nurture the closest
possible ties to their customers. Cross-Group and cross-regional cooper-
ation is crucial for the success of our global network of innovation.
At the same time, it enables Siemens to provide comprehensive,
customer-focused products, solutions and services for the global market.
Our portfolio
27
Business areas
Our Group provides communication networks and
solutions for converging conventional voice communi-
cations with Internet Protocol (IP) applications. We
focus on attractive market segments with the greatest
growth potential: Internet-based convergence tech-
nologies for network operators and enterprises, as well
as broadband access technologies. Our expertise in
optical networks and our integration and applications
know-how also enhance our comprehensive array of
solutions.
With 250 million lines installed for service
providers and some 80 million lines for enterprises,
we are the world’s Number 1 supplier of IP conver-
gence solutions. Our unparalleled know-how in voice
communications and real-time applications enables us
to provide advanced, highest-quality technologies to
the IP world. Our U.S. subsidiary Unisphere Networks
is Number 3 worldwide in the field of IP routers for
network operators. ICN currently ranks Number 2 in
infrastructure technology for DSL (Digital Subscriber
Line) broadband networks, and we are world market
leader for DSL equipment for end users.
In our drive to safeguard profitability in a difficult
market environment, we have introduced further ini-
tiatives: We intend to give growth in earnings prece-
dence over growth in sales; strengthen our product
base; optimize our cost structures and sales channels;
improve the efficiency of our value chain; and con-
tinue expanding our leading position as an industry
innovator. These measures are paving the way for our
successful turnaround.
As a provider of end-user devices, network technology
and mobile applications, we cover the entire spectrum
of wireless communications. We also hold a 50% stake
in Fujitsu Siemens Computers. To serve our market
segments faster and more efficiently, we have reorgan-
ized our divisions. While two divisions – Solutions and
Networks – remain unchanged, the former Devices
Division has been divided into Mobile Phones, Cord-
less Products and Wireless Modules.
Our communication devices range from mobile
phones and wireless modules to mobile organizers,
cordless phones and products for wireless home net-
works with broadband Internet access. Our mobile
applications focus on location-based information serv-
ices as well as solutions for mobile Internet access,
mobile portals, mobile shopping, mobile payment and
mobile entertainment. In the infrastructure sector, we
provide all GSM, GPRS and UMTS network technolo-
gies – from base stations and switching systems to
intelligent networks for prepaid services. We are one
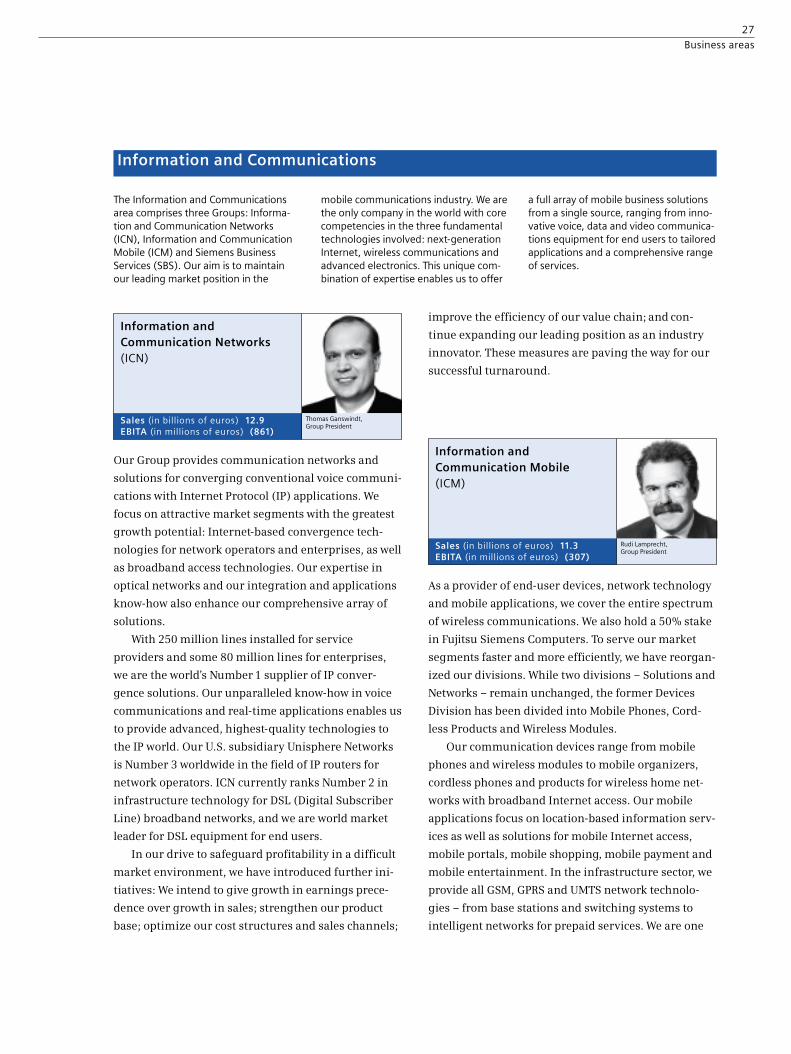
Information and Communications
The Information and Communicationsarea comprises three Groups: Informa-tion and Communication Networks(ICN), Information and CommunicationMobile (ICM) and Siemens BusinessServices (SBS). Our aim is to maintainour leading market position in the
mobile communications industry. We arethe only company in the world with corecompetencies in the three fundamentaltechnologies involved: next-generationInternet, wireless communications andadvanced electronics. This unique com-bination of expertise enables us to offer
a full array of mobile business solutionsfrom a single source, ranging from inno-vative voice, data and video communica-tions equipment for end users to tailoredapplications and a comprehensive rangeof services.
Thomas Ganswindt,Group President
Information and Communication Networks(ICN)
Sales (in billions of euros) 12.9EBITA (in millions of euros) (861)
Rudi Lamprecht,Group President
Information and Communication Mobile(ICM)
Sales (in billions of euros) 11.3EBITA (in millions of euros) (307)

28
Business areas
of the world’s top infrastructure providers. In addition,
we have an excellent setup for the third-generation
mobile market. Together with our partner NEC, we are
supplying Europe’s first commercial UMTS networks.
One of the first UMTS applications is a location-
based service – called Isle of Man on Air – that has
begun operation on the Isle of Man in the Irish Sea.
This service provides UMTS customers on the island
with location-specific texts and videos.
Our focus is on growth through innovation. We are
working intensively on combining greater miniatur-
ization with more features for mobile products, on the
convergence of information and communications
technologies and entertainment, and on making Inter-
net access even more mobile.
As part of the Information and Communications area,
Siemens Business Services offers single-source IT
solutions and services.
The electronic business and mobile business seg-
ments contributed roughly one-fourth of our total
sales in fiscal 2001, and we aim to grow these busi-
nesses faster than our others. Our e-business solu-
tions and services are focused on five core areas: sup-
ply chain management, enterprise resource manage-
ment, business information management, customer
relationship management and electronic commerce.
Mobile business – the next stage in e-business
development – has enormous market potential.
Thanks to our e-business know-how and our close
cooperation with ICM and ICN – specialists in mobile
telephony and next-generation Internet applications –
we are leaders in e-business technology. We have
already implemented numerous innovative mobile
solutions, including Mobile Banking, Mobile Office
and Mobile Travel.
A key strategic aim is to broaden our international
scope. We already generate more than half our sales
outside Germany – and the trend is increasing. In the
strategically vital North American market, we fun-
neled the American IT service provider Entex –
acquired in 2000 with 5,000 employees and sales of
$500 million – into our U.S. business activities to form
SBS Inc. In a milestone for our mobile business activi-
ties, we teamed up with Microsoft in the middle of last
fiscal year to jointly develop and market mobile busi-
ness solutions worldwide.
In the e-business sector, we are working closely
with SAP, Commerce One, Siebel and i2 Technologies –
suppliers of best-in-class technology platforms in their
fields. We are also drawing on these strategic partner-
ships to build up our own e-excellence in areas like
electronic marketplaces, purchasing and supply
chains. In our drive to further enhance our expertise,
we are investing substantially in Siemens’ company-
wide program of knowledge management and e-learn-
ing.
Paul A. Stodden,Group President
Siemens Business Services (SBS)
Sales (in billions of euros) 6.0EBITA (in millions of euros) (259)

29
Business areas
We aim to expand our position as world market leader
and our profitable business in automation, drives,
switchgear and installation technology by focusing
on innovation and growth. To achieve this, we are
strengthening our activities, particularly in process
automation and in software for complex system con-
trols based on the Totally Integrated Automation plat-
form. We expect our switchgear and installation tech-
nology business to be further boosted by innovative
solutions like Safety Integrated and the new product
Totally Integrated Power, which reduces energy costs
by up to 25%.
We are systematically expanding our product spec-
trum and industry know-how and penetrating region-
al markets through strategic acquisitions and business
partnerships. We are working with over 300 external
solutions providers to tailor our comprehensive solu-
tions to the specific needs of a wide variety of industry
sectors. Our key partners within Siemens are the
Automation and Control Groups and the Groups in the
Power area.
To further improve the quality of our earnings, we
are focusing on optimizing all our processes with the
help of the asset management, quality and cost-cut-
ting tools provided by our top+ initiative. Above all, we
are developing e-business applications to substantially
streamline all our internal processes – from purchas-
ing to logistics. We are leaders in electronic business-
to-business applications, with over ten years of experi-
ence in the field.
The pressure of global competition and the rapid pace
of innovation in information technology present new
challenges to suppliers of industrial projects. The
demand today is for service providers who offer inno-
vative ways to link automation “islands” in the systems,
process and manufacturing sectors into intelligent all-
inclusive solutions, thus substantially increasing value
added along the entire production chain. Our reorien-
tation, our improved offerings for the processing
industry, our strengthened IT expertise and the expan-
sion of our technical services (engineering, installa-
tion, logistics and maintenance) to cover entire plant
life cycles are enabling us to join and further this mar-
ket development.
Standardization, modular construction and IT-sup-
ported solutions are not the only keys to success. Our
strategy is to combine these elements with specialized
sector know-how in the process and manufacturing
industries and in infrastructure projects. Our innova-
tions span the entire process chain – beginning with
the receipt of materials and extending beyond delivery
to encompass a plant’s entire life cycle.
Automation and Control
The Automation and Control area com-prises four Groups: Automation andDrives, Industrial Solutions and Services,Siemens Dematic and Siemens BuildingTechnologies. We are the world’s largestsupplier of products, systems, solutions
and services in the industrial and build-ing technology sectors. We help our cus-tomers optimize their business and pro-duction processes, enabling them toimprove their efficiency and profitability.The Groups cooperate closely using the
latest information technology and thusdevelop synergies for their four mainautomation markets: manufacturing,process, building and logistics automa-tion.
Helmut Gierse,Group President
Automation and Drives (A&D)
Sales (in billions of euros) 8.9EBITA (in millions of euros) 981
Joergen Ole Haslestad,Group President
Industrial Solutions andServices (I&S)
Sales (in billions of euros) 4.6EBITA (in millions of euros) 97

30
Business areas
We offer all-inclusive solutions, from the field and
process control levels to the management level. Cus-
tomers can access our solutions and services 24 hours
a day from some 300 locations worldwide. It doesn’t
matter if the products, systems and technologies are
from Siemens or from other suppliers, because our
solutions work in multi-vendor environments. We
have developed e-business solutions for customer
processes as well as for our own global processes.
Our activities focus on many different industries:
metal-working, coal and steel, paper, oil, gas and
petrochemicals, cement, food and beverages, and
water treatment. In the infrastructure sector, we con-
centrate on electrical equipment and energy-efficient
drives for ships as well as on state-of-the-art traffic
control and guidance systems.
business is generated in the U.S., compared to 45% in
Europe.
Knowledge@work – our unmatched knowledge
pool – gives us an invaluable strategic advantage. We
boast extensive knowledge of our industry. We own
5,000 patents, and our installed base includes 1,250
solutions for the automobile industry, 10,000 pick-and-
place systems in electronics production, 380 airport
logistics solutions, 800 warehouse and distribution
logistics systems, and 14,600 letter sorting systems.
To safeguard our future, we are networking our knowl-
edge to create new solutions for our customers.
Siemens Dematic AG – the world’s leading supplier of
logistics and production automation – was formed by
the merger of Siemens Production Logistics Systems
AG with Mannesmann Dematic AG.
The two companies – one a specialist in logistics IT
and controls and the other a leader in mechanical sys-
tems – are an ideal fit. Together, we offer a full range
of comprehensive, integrated solutions – from consult-
ing and implementation to global services, making
Siemens Dematic the world’s only complete provider of
products, systems and solutions for logistics automa-
tion. We have an exceptionally strong market presence
worldwide, with the number of employees reflecting
our strength in the various markets. Siemens Dematic
is especially active in North America, where we have
more employees at our U.S. subsidiaries – 4,800 – than
in Germany. Thanks to our strong presence in the U.S.,
we are the market leader in this crucial region as well.
Our sales figures underscore this success: 42% of our
We cover the systems and service markets for building
security, fire protection, air conditioning and other
comfort features, providing a full range of products for
each of these applications. We’ve made solid progress
in all these areas. A number of strategic acquisitions
have reinforced our status as a market leader in fire
protection systems and strengthened our position in
electronic security solutions.
We have rigorously implemented measures to
enhance performance. Programs to boost productivity,
integrate IT platforms for our application areas and
increase cross-selling between our divisions and other
Siemens Groups are enabling us to offer our cus-
tomers a broader spectrum of products and solutions
while reducing sales costs. Cross-selling is also help-
ing us to expand our regional market share.
Our new Web site for engineering software and
remote access at the systems level offers additional
benefits for our customers in the services market. We
continue to improve our internal manufacturing and
logistics processes by developing additional e-busi-
ness models and joint concepts for leveraging syner-
gies across our divisions.
Dr. Dietmar Straub,Group President
Siemens Dematic AG (SD)
Sales (in billions of euros) 2.5EBITA (in millions of euros) (59)
Oskar K. Ronner,Group President
Siemens Building Technologies AG(SBT)
Sales (in billions of euros) 5.5EBITA (in millions of euros) 132

31
Business areas
Our acquisition of Westinghouse’s fossil fuel power
plant business in 1998 cemented our position as a glob-
al supplier. We are now a strong Number 2 worldwide
in this sector and have expanded our lead over our
nearest competitors. While our business was previously
focused on Germany and Europe, today we are at home
in all the world’s markets. Our global organization
enables us to supply our successful products and serv-
ices to customers everywhere. We establish lasting
partnerships with our customers, accompanying them
as they move around the world. More than 90% of our
orders are from outside Germany.
We have merged our nuclear and hydroelectric pow-
er generation activities into two joint ventures in which
we hold minority stakes. Both new companies are now
Number 1 worldwide. Our new Industrial Applications
Division – formed after the takeover of the Demag
Delaval Group – is a world-leading supplier of industri-
al energy conversion processes. We are rigorously
implementing intelligent IT solutions in our instru-
mentation and control systems for power plants and
exploiting Siemens Westinghouse’s sales channels in
the U.S., where we are already market leader in this
field as well as in catalytic converters. The development
of stationary fuel cells for commercial power genera-
tion has been very promising and marketable products
should be ready within a few years.
To limit risks and again significantly increase
earnings, we are pushing our components and service
business and being very selective in our choice of
major projects. Innovative service offerings and long-
term service contracts with new orders will enable us
to further grow our profitable service business. Strate-
gic alliances and acquisitions will yield additional
growth. Initial, promising e-business applications will
further boost our profitability. For example, all docu-
mentation required for a typical power plant project
can now be administered via a common data manage-
ment system accessible to suppliers on the Internet.
We offer our customers online monitoring and power
plant control via central maintenance stations.
Synergies from the integration of Westinghouse
are taking hold and improving our cost position. Our
Group-wide quality offensive has substantially im-
proved our products and processes and is already hav-
ing a positive effect on our earnings.
Power
The Power area comprises two Groups:Power Generation and Power Transmis-sion and Distribution. These Groups’activities cover the entire array of energysolutions. Power Generation offers effi-
cient, environmentally compatible pow-er generation systems and services, andservices for power plant projects. PowerTransmission and Distribution – as prod-uct supplier, systems integrator and serv-
ice provider – ensures the safe and effi-cient transport of electrical energy frompower plant to consumer.
Klaus Voges,Group President
Power Generation (PG)
Sales (in billions of euros) 8.6EBITA (in millions of euros) 634

32
Business areas
online markets via a newly created e-commerce plat-
form that enables us to offer projects and systems
worldwide around the clock. E-business also supports
our efforts to increase the efficiency of our business
processes, further improving customer satisfaction.
Technical innovations, excellent quality and outstand-
ing reliability in our product and systems business
have given us a strong position. Our goal is now to
grow twice as fast as the market, especially in new
business fields.
Dr. Heinrich Hiesinger, Group President
Power Transmission and Distribution (PTD)
Sales (in billions of euros) 4.1EBITA (in millions of euros) 96
We have further improved our proximity to the market
and to our customers by growing in the key markets of
China and the U.S. and by continuing to build up our
service business. In addition, we have enhanced our
portfolio with products and systems employing a high
proportion of electronics, communications technology
and software. With a strong international orientation,
we now generate over 85% of our sales outside Ger-
many, and half that amount outside Europe.
Our service business focuses on service contracts
for the operation of power grids and independent
meter and energy data services. Examples here include
a contract to provide all maintenance services for New
Zealand’s biggest power distribution grid and a con-
tract to take over metering services for Britain’s Power-
Gen utility, making us the Number 1 independent
provider of metering services there.
We have again improved our market position in
high-voltage, direct-current (HVDC) power transmis-
sion. A world-leading supplier in this field, we provid-
ed the turnkey transformer stations at both ends of the
HVDC power link between Northern Ireland and Scot-
land. The stations are equipped with state-of-the-art
high-performance electronics. We are also providing
this technology for the transformer stations on the
new HVDC link connecting China’s western regions
with cities in its southeast.
The pace of innovation in our so-called conven-
tional business continues to accelerate. Roughly half
of our products are less than five years old. In the next
two to three years, we intend to increase this share to
60%. We provide the power industry with complete
solutions for power transmission and distribution as
well as tailored IT solutions. Partnerships with promi-
nent software houses enable us to offer a complete
portfolio of solutions to deregulated power markets.
We are positioning ourselves in independent
33
Business areas
We have reached our goals of achieving margin-ori-
ented growth and improving EVA results. Today, we are
one of the world’s leading suppliers in all areas of rail
transportation, renowned around the globe as an
innovator, a systems integrator and a service partner.
Our rigorous quality program, our test centers, our
modularization and our IT expertise make us a pre-
ferred business partner for light rail and mainline rail
operators.
We offer our customers innovative solutions and
systems in fields like families of modular vehicles for
light rail and mainline systems, technology for driver-
less subways and computer-controlled electronic inter-
lockings, optical sensor systems and GPS-based serv-
ice and diagnostic concepts. Our expanding service
business confirms that our innovations are meeting
the needs of the market. We are leveraging synergies
throughout Siemens to develop individual products
and provide turnkey solutions. We remain far ahead of
our competitors in the use of e-business applications
for services, maintenance and online marketplaces.
In the past fiscal year, we further developed our
business through well-focused portfolio optimiza-
tions. Our acquisition of parts of the Czech rail vehicle
manufacturer CKD Dopravni Systemy further strength-
ened our position in Eastern Europe. Locomotive
leasing has been transferred to a new company estab-
lished especially for this purpose, Siemens Dispolok
GmbH. Siemens-Duewag-Schienenfahrzeuge GmbH
and Siemens-Krauss Maffei-Lokomotiven-GmbH, both
Siemens subsidiaries, are being integrated into our
Group. The French subsidiary Matra Transport Inter-
national was completely taken over and merged with
our Rail Automation Division.
Southeast Asia’s growing market potential is re-
flected by the geographic distribution of our sales.
Although we are continuing to grow in Europe at the
previous high level, expansion is even faster in Asia-
Pacific and the Americas.
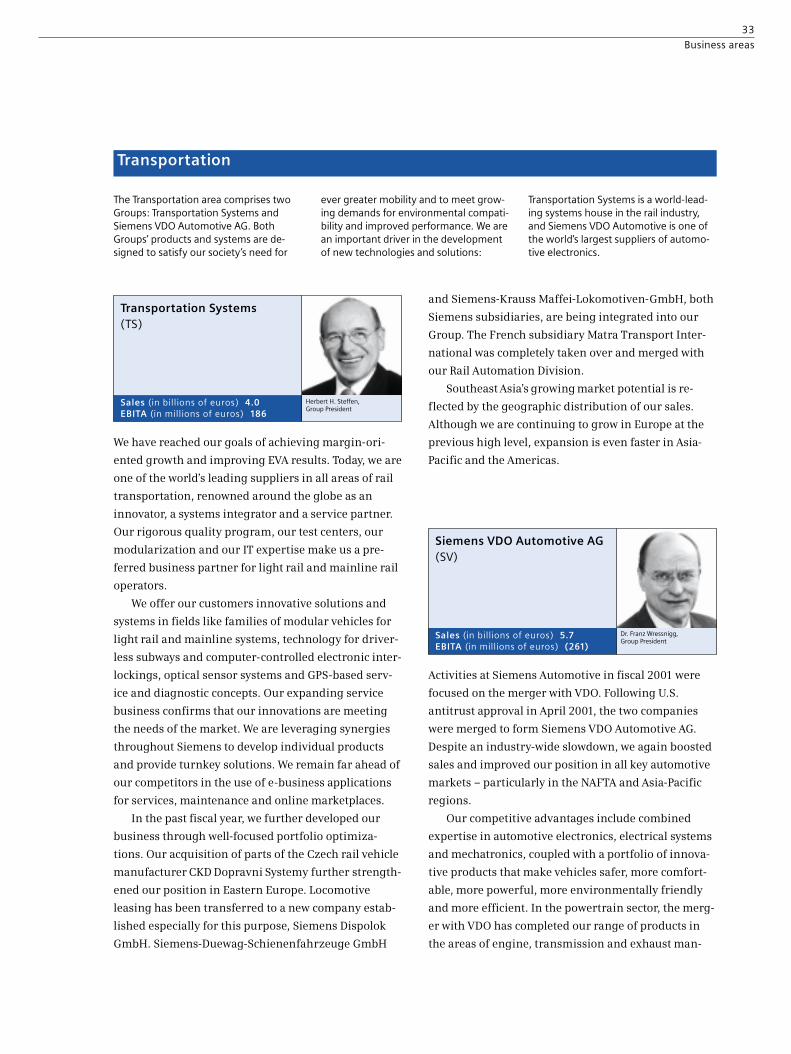
Transportation
The Transportation area comprises twoGroups: Transportation Systems andSiemens VDO Automotive AG. BothGroups’ products and systems are de-signed to satisfy our society’s need for
ever greater mobility and to meet grow-ing demands for environmental compati-bility and improved performance. We arean important driver in the developmentof new technologies and solutions:
Transportation Systems is a world-lead-ing systems house in the rail industry,and Siemens VDO Automotive is one ofthe world’s largest suppliers of automo-tive electronics.
Activities at Siemens Automotive in fiscal 2001 were
focused on the merger with VDO. Following U.S.
antitrust approval in April 2001, the two companies
were merged to form Siemens VDO Automotive AG.
Despite an industry-wide slowdown, we again boosted
sales and improved our position in all key automotive
markets – particularly in the NAFTA and Asia-Pacific
regions.
Our competitive advantages include combined
expertise in automotive electronics, electrical systems
and mechatronics, coupled with a portfolio of innova-
tive products that make vehicles safer, more comfort-
able, more powerful, more environmentally friendly
and more efficient. In the powertrain sector, the merg-
er with VDO has completed our range of products in
the areas of engine, transmission and exhaust man-
Herbert H. Steffen,Group President
Transportation Systems(TS)
Sales (in billions of euros) 4.0EBITA (in millions of euros) 186
Dr. Franz Wressnigg,Group President
Siemens VDO Automotive AG (SV)
Sales (in billions of euros) 5.7EBITA (in millions of euros) (261)

34
Business areas
agement as well as fuel tank systems. The start of
series production for common-rail diesel fuel injectors
was this year’s highlight. With our information, com-
munication and cockpit systems – which enable driv-
ers to manage the flood of data provided in today’s
cars – we have set industry standards. We will contin-
ue to push the strategic reorientation of our develop-
ment and product portfolio in both the injection and
driver information sectors as well as in car body, safety
and chassis electronics, concentrating on products
that put us in Number 1 or Number 2 market positions
worldwide.
A rigorous portfolio review is part of our WIP
(World Class Improvement Program) restructuring
initiative. The program focuses on tapping additional
synergies in research, development and purchasing
and on improving capacity utilization at our world-
wide production facilities. Besides helping us to
achieve a turnaround, WIP will provide the basis for
sustainable profitable growth, enabling us to continue
expanding our leading position on the world market.
Innovations are crucial for success. Two-thirds of
our products are less than three years old. The acquisi-
tion of Shared Medical Services and Acuson has helped
make our spectrum of products and services unique
in the industry. The rigorous implementation of our
P3 Program – People, Processes, Products – is continu-
ing to boost our productivity and profitability.
Information technology is opening up additional
market segments. Our e.health programs are being
extended into the home care sector. At our processing
center in Malvern, Pennsylvania, we manage the data
of some 1,500 customers and handle over 100 million
transactions a day – making us the largest application
service provider in the world market.
We have undergone a major transformation – from
a product-oriented to a process-oriented enterprise.
We now do over 90% of our business outside Germany,
gaining substantial market share especially in imag-
ing systems like computed and magnetic resonance
tomography and angiography as well as in hearing
instruments.
New orders have doubled in the past three years,
increasing 60% in fiscal 2001 alone. Our goal is to be
the world’s most successful solutions provider in the
health care industry.
Current trends demand more efficient health care
systems. To improve the quality of patient care and
reduce costs, we are creating integrated solutions
combining innovative products, state-of-the-art infor-
mation technology and process-oriented services. This
strategy is reflected in our new name: Siemens Med-
ical Solutions.
Medical
The Medical area offers a broad spec-trum of products, solutions and servicesfor integrated health care. Its offerings
range from innovative technologies foraccurate diagnoses and therapies whichminimize patient discomfort to services
that optimize processes and increaseefficiency in hospitals and doctors’offices.
Prof. Dr. Erich R. Reinhardt,Group President
Medical Solutions (Med)
Sales (in billions of euros) 7.2EBITA (in millions of euros) 808

35
Business areas
With our lamps, electronic control gear and opto-
semiconductors, we have captured a leading position
in the world lighting market. We focus on innovative
products because – despite higher up-front costs –
they generate above-average earnings. Our drive for
innovation includes a well-focused expansion of our
business in opto-semiconductors, which led us to
acquire Infineon Technologies’ stake in our joint ven-
ture Osram Opto Semiconductors in August 2001. We
see the greatest growth potential for light-emitting
diodes (LEDs) in the fields of automotive lighting and
mobile communications, where miniaturization and
long product life are key factors. We have high expecta-
tions for the low-power, light-weight organic LEDs
used for tiny, easy-to-read displays. Since the special
features of most innovative lamps require customized
electronic control devices, our systems business –
which combines both elements – is strategically vital
for us.
Through strong expansion, we have captured a sol-
id position in all regional markets. We are now focus-
ing on further building up our business in Asia-Pacific
and Eastern Europe, where we expect the biggest mar-
ket growth. At the same time, we are continuing to
improve our structures in our traditional markets.
We see e-business as an opportunity to optimize our
business processes and adapt them to the technical
requirements of the Internet. Our North American
subsidiary OSRAM Sylvania* is the trailblazer for our
e-business activities, already transacting roughly one-
third of its business electronically.
Ongoing productivity programs and restructuring
measures in manufacturing are the result of our
efforts to achieve cost leadership in all product areas
via benchmarking. To help optimize our cost struc-
tures, we will continue to expand our production activ-
ities in China, India, Indonesia, Mexico, Brazil and
Eastern Europe. Our acquisition of the Czech compo-
nents manufacturer HMZ in the fall of 2000 is part of
this strategy.
* In the areas of automobile lamps and special products, OSRAM hasworldwide rights to the Sylvania trademark. In the area of generallighting solutions, OSRAM owns the rights to the Sylvania trade-mark in the U.S., Canada and Mexico. SLI, in Europe, owns thetrademark rights in all other countries.
Lighting
The Lighting area specializes in lightingsources and the associated electroniccontrol gear. We focus on general light-
ing solutions, automotive lighting, spe-cial photo-optic lamps and display light-ing. Owing to our international orienta-
tion, we now generate nearly 90% of oursales outside Germany.
Dr. Wolf-Dieter Bopst,President
Osram GmbH
Sales (in billions of euros) 4.5EBITA (in millions of euros) 462

36
Business areas
With 1,500 employees in 30 countries, we specialize
in innovative offerings for corporate financing as well
as in related risk management. We offer customers an
extensive spectrum of financing solutions, including
sales and investment financing, treasury and financial
services, fund management and insurance services.
While our customers are chiefly international indus-
trial and service companies and clients in the public
sector, we also serve private customers, especially
company employees.
As an international service Group at Siemens, our
main focus is on profitable growth with an emphasis
on expanding our business with customers outside of
Siemens, as well as providing financial services for the
Siemens Groups.
Our strategy is based on five key elements: creating
and expanding a balanced portfolio of financing and
consulting services; concentrating on completely Web-
based processes; focusing on existing competencies;
emphasizing profitability and efficient risk manage-
ment; and rigorously orienting ourselves toward cus-
tomers.
E-finance is one of our most important growth
drivers. The focus here is on cash flow in payment
transactions, in payment processing and in financing.
In factoring, too, we have established SFS as a leading
company in the e-finance solutions market with our
first integrated B2B financing solution. In addition,
we now provide a finance portal for the private invest-
ments of Siemens employees.
In early 2001, we reorganized our activities into three
business fields. Our services now comprise real estate
development and utilization, portfolio management,
and leasing and real estate services. With our new,
customer-oriented organization, we intend to achieve
sustainable growth in profitability by concentrating
more strongly on the external real estate market.
Siemens locations in Frankfurt, Munich and Berlin
provide good examples of our special focus on real
estate development. With our redesign of these loca-
tions, we have initiated major urban construction
projects.
Our earnings, which reflect our dynamic develop-
ment, were once again fueled primarily by asset reduc-
tions. Our portfolio comprises offices and commercial
property covering 47 million square meters of land as
well as 19 million square meters of floor space at more
than 800 locations. As part of the top+ U.S. Business
Initiative, we are implementing a consolidation project
in the U.S. with two primary objectives: to concentrate
locations in major urban business areas and to raise
our market profile.
We are also exploring new approaches to leasing.
We have responded to growing demand for short-term
property leases by providing flexible lease contracts,
offering such arrangements, for example, at our new
Siemens Real Estate Office Center near Munich Air-
port. We are focusing on e-business-supported solu-
tions in the service sector. With our wide range of
offerings, we rank among the world’s leading corpo-
rate real estate companies.
Real EstateFinancing
Prof. Peter Niehaus, Managing Director
Siemens Real Estate (SRE)
Sales (in billions of euros) 1.5Earnings before taxes (in millions of euros) 213
Dr. Herbert Lohneiß, President and CEO
Siemens Financial ServicesGmbH (SFS)
Sales (in billions of euros) 0.5Earnings before taxes (in millions of euros) 158

The strongly cyclical semiconductor industry is cur-
rently facing an extremely difficult market situation.
Global market volume has declined roughly 30% since
last year. The precipitous slump in all technology
industries also impacted sales at Infineon in fiscal
2001, resulting in a negative EBITA.
Nevertheless, Infineon remains a company with
substance. We were more successful at further cutting
costs than our international competitors. We continue
to be a leading innovator in many technologies. Cur-
rent examples of our innovations include the fastest
xDSL products on the market, the smallest chips for
mobile phones, the most secure smart card ICs, the
first switches for 42-volt automotive electrical systems
and the most cost-effective memory chips.
During the past fiscal year, we acquired two devel-
opment companies for network components and sold
three non-core businesses. We maintained our market
share in memory chips and gained market share in
individual segments of the communications and auto-
motive industries.
Our primary focus is now on safeguarding our li-
quidity and competitiveness through a sweeping cost-
saving and restructuring program. Measures will
inevitably include workforce reductions and cuts in
our investment budget. However, our future-oriented
investments in 300-millimeter silicon wafer technolo-
gy will continue. We will remain focused on our core
competencies and are prepared to expand our strate-
gic partnerships if necessary. Our goal is to have
Infineon in good shape for the next upswing in the
chip market and the future that follows.
37
Business areas
Despite a difficult market environment, BSH Bosch
und Siemens Hausgeräte GmbH had a good year. Rig-
orous cost management, productivity-boosting pro-
grams and innovative products helped us increase
sales and earnings and gain market share in many
European countries. Outside Europe, we profited from
strong growth in demand for household appliances,
particularly in China and Southeast Asia.
Thanks to its highly innovative and extremely reli-
able products, BSH is a pacesetter in the household
appliance industry. We will continue expanding our
business on this basis, with a focus on Internet-ready
appliances for the smart house of the future. Many of
our products have electronic controls which make pos-
sible a greater array of features while substantially
cutting operating costs. We will further increase the
share of electronics in our products, particularly since
our Electronics, Drives and Systems unit gives us a sol-
id position in this sector.
The development of advanced communications
technologies is a further focus of our activities. Our
e-commerce platform is enabling us to accelerate and
optimize communication processes with our commer-
cial partners in Europe.
With a worldwide network of sales and customer
service companies, 39 production facilities in 14 coun-
tries, and some 36,000 employees, BSH is market
leader in Germany and Europe. We also rank among
the world’s leading suppliers in our market. As the
benchmark in our industry, we intend to consolidate
and expand this position.
Affiliates
Dr. Kurt-Ludwig Gutberlet, President
BSH Bosch und Siemens Hausgeräte GmbH
Dr. Ulrich Schumacher,President and CEO
Infineon Technologies AG
Sales (in billions of euros) 5.7EBIT (in billions of euros) (1.0)

38
Information for shareholders
40 Report of the Supervisory Board46 Statement of the Managing Board
46 Independent auditors’ report
47 Management’s discussion and analysis47 Highlights
49 Joint ventures and acquisitions
50 EVA performance
51 Segment information
57 Consolidated statements of income
59 Dividend
60 Liquidity and capital resources
63 Customer financing
64 Stock option plans
64 Risk management
67 Outlook

39
Information for shareholders
68 Consolidated statements of income 70 Consolidated balance sheets72 Consolidated statements of cash flow74 Consolidated statements of changes
in shareholders’ equity76 Segment information78 Notes
114 Principal subsidiaries and associated companies
118 Five-year summary120 Positions held by Supervisory Board members121 Positions held by Managing Board members122 Glossary

“The world has changed. It has seldom been so difficult to makereliable statements about the future.”

41
Report of the Supervisory Board
41
Dear Shareholder,
The Supervisory Board’s main task this past year was to focus
intensively on the effects the structural and economic changes taking
place in the world electrical markets were having on the Company. At five
meetings during the course of the year, the Managing Board informed us
about the Company’s general situation, its key events and corporate plans.
Between these meetings, the Managing Board kept us informed about
important developments. In addition, as Chairman of the Supervisory
Board, I was always kept up-to-date on major topics and decisions.
Upheaval in Information and Communications
Since sales in the Information and Communications segment account
for a high percentage of the Company’s total sales, we concentrated on
these activities at all our meetings. The Information and Communication
Networks Group and the Information and Communication Mobile Group,
which were earnings leaders in fiscal 2000, were especially hard hit by tur-
bulence on the markets. As a result, the Groups initiated comprehensive
reorganization programs, key portions of which have already been imple-
mented.
At our meeting in November 2001, we received a report summarizing
once again the current trends on the I&C markets as well as concrete
measures to increase profitability and the Managing Board’s strategic
plans. We are convinced that the correct steps have been taken.
Integration of Atecs Mannesmann underway
We also reviewed the Siemens-Bosch takeover of Atecs Mannesmann
AG on several occasions. Following regulatory approval, implementation
of the deal was begun in April 2001:
■ Bosch is responsible for the Atecs company Rexroth.
■ To round off its own activities, Siemens has funneled Dematic into
Siemens Dematic AG and VDO into Siemens VDO Automotive AG, and
integrated Demag Delaval into the Power Generation Group.

42
Report of the Supervisory Board
■ Zahnradfabrik Friedrichshafen has acquired Sachs. The contractually
agreed-upon sale of Mannesmann Plastics Machinery to the invest-
ment firm APAX could not be implemented.
■ With new partnerships outside of Siemens being sought for
the remaining Atecs activities, there are still some items on the
agenda.
We are convinced that the companies held by Bosch and Siemens have
a promising future despite current problems in their sectors and that part-
ners offering good perspectives will be found for the remaining
companies and minority holdings.
Additional areas of focus
At our meeting in November 2000, we received a report on progress at
the Transportation Systems Group, previously a loss-maker. Due to favor-
able market developments but, above all, to an outstanding management
performance, a “classic” turnaround has been achieved. Measures at
the Group have focused on improving project management, optimizing
processes along the entire value chain, significantly reducing costs and,
above all, concentrating on innovative projects. Today, Transportation
Systems is one of the Siemens Groups with a stable market cycle and
prospects for increased profitability.
At our meetings in December 2000 and April 2001, we focused on the
development of Siemens Financial Services and Siemens Real Estate. Both
units, which were spun off from Corporate Departments to form separate
legal entities, are showing solid growth and making increasing contribu-
tions to Siemens’ earnings.
In July 2001, the president of Automation and Drives presented an
overview of this Group’s activities, which are highly contingent on sector
developments. Nevertheless, Automation and Drives has captured an
excellent market position in the area of industrial automation through its
rigorous innovation initiatives and the successful restructuring of weak
divisions. The Group is now better positioned than most of its competitors
to weather an economic slowdown.
43
Report of the Supervisory Board
Company-wide topics and other major issues
The electronic networking of the Company and the full-scale leverage
of e-business opportunities were examined at the meeting in November
2000. Substantial progress in these areas has resulted in faster processes
and reduced costs.
At our meeting in November 2001, the Managing Board reported on
the consolidation of corporate responsibility for e-business, IT infrastruc-
ture and the standardization of worldwide business processes in the new
Corporate Information and Operations unit.
At our meeting in Budapest in April 2001, we received a report on the
outlook in the Central and Eastern European markets. Firmly anchored in
these markets, Siemens is participating in their generally positive devel-
opment with increasing success.
The U.S. is the Company’s most important regional market. The
Managing Board has launched a sweeping initiative to strengthen the
profitability of our American activities. In view of the information pre-
sented at our meeting in July 2001, we are convinced that systematic
efforts are being made to transform our market success in the U.S. into
an earnings success. Due to the recessionary trends in the American
economy and the uncertainties arising from the recent terrorist attacks
in New York and Washington, further efforts will be required. We will
continue to monitor developments closely.
At our meeting in November 2000, we examined the documents pro-
vided to the SEC in preparation for listing Siemens stock on the New York
Stock Exchange. The conversion of the Company’s accounting procedures
to the U.S. GAAP standard, the listing in New York in March 2001 and the
subsequent adaptation of Siemens’ financial reporting were prepared and
implemented with a high degree of professionalism.

44
Report of the Supervisory Board
Supervisory Board meetings
We held five regular Supervisory Board meetings during the fiscal
year. Between these meetings, the Presidency of the Supervisory Board
maintained close contact with the Managing Board. As one of the three
constituted committees on our Board, the Presidency met four times to
address matters involving Managing Board personnel and remuneration,
Group personnel, corporate strategy and business development, key
processes and major issues relating to the final audit and the appointment
of independent auditors.
Last fiscal year marked the first time that the Supervisory Board has
dealt extensively with quarterly reporting. At our meetings in November
and December 2001, we also reviewed in detail the Company’s economic
development and – together with the independent auditors – the financial
statements for fiscal 2001.
The mediation committee, formed pursuant to Article 27, paragraph 3,
of the German Codetermination Act, had no occasion to meet during
the year. The committee responsible for exercising participation rights,
defined in Article 32 of the Act, voted on resolutions circulated to each
member and notified the Board of the outcome at subsequent meetings.
Financial statements
Siemens’ accounting principles, the annual financial statements of
Siemens AG and the consolidated financial statements as of September 30,
2001, as well as the management’s discussion and analysis of Siemens AG
and of Siemens worldwide consolidated, have been audited and approved
without qualification by KPMG Deutsche Treuhand-Gesellschaft AG
Wirtschaftsprüfungsgesellschaft, Berlin and Frankfurt am Main. The
financial statements were prepared according to U.S. GAAP. The independ-
ent auditor has confirmed that the financial statements and the manage-
ment’s discussion and analysis fulfill the conditions for exemption from
compliance with the rules of reporting stipulated by German law.
We received and examined the above-mentioned documents and the
Managing Board’s proposal for the use of the net income available for dis-
tribution. The KPMG audit reports were presented to all members of the
Supervisory Board, and we – together with the auditors, who reported on

key results of the audit – discussed them thoroughly at our balance sheet
meeting. At this meeting, the Managing Board presented a comprehensive
report on the scope and cost of the audit. We approved the results of the
audit. In view of our approval, the financial statements are accepted as
submitted.
We endorse the Managing Board’s proposal that the net income avail-
able for distribution be used to pay a dividend of €1.00 per share. In
addition, we approve the proposals that the amount attributable to treas-
ury stock be carried forward and the remainder be transferred to other
retained earnings. Adjusted for the stock split in April 2001 (one
additional share issued for every two shares held), last year’s dividend was
€0.93.
Changes in the Supervisory Board and Managing Board
There were no changes in the Supervisory Board’s composition in
fiscal 2001, since its members had been elected to a five-year term at
the Annual Shareholders’ Meeting in 1998. In July 2001, Roland Koch,
President of the Information and Communication Networks Group and
Member of the Managing Board of Siemens AG, left the Company after
nearly 30 years of service. We acknowledged his work in an increasingly
difficult environment. At our meeting on November 14, 2001, Prof. Dr.
Erich R. Reinhardt, head of the Medical Solutions Group, was appointed to
the Managing Board of Siemens AG.
Berlin and Munich, December 5, 2001
For the Supervisory Board
45
Report of the Supervisory Board
Dr. Karl-Hermann Baumann
Chairman

46
Preliminary Note
The accompanying consolidated financial statements
were prepared for the first time in accordance with United
States Generally Accepted Accounting Principles (U.S.
GAAP).
In order to comply with § 292a German Commercial
Code (HGB), the consolidated financial statements were
supplemented with management’s discussion and analy-
sis on a consolidated basis and additional explanations.
Therefore, the consolidated financial statements, which
have to be filed with the Commercial Register and pub-
lished in the Federal Gazette (Bundesanzeiger), comply
with the Fourth and Seventh Directives of the European
Community. For the interpretation of these directives we
relied on the German Accounting Standard No. 1 of the
German Accounting Standards Committee.
The consolidated financial statements and manage-
ment’s discussion and analysis as of September 30, 2001
prepared in accordance with § 292a HGB are being filed
with the Commercial Registries of the Berlin-Charlotten-
burg District Court under the number, HRB 12300, and
Munich District Court under the number, HRB 6684.
Statement of the Managing Board
The Managing Board of Siemens AG is responsible for
preparing the following consolidated financial statements
and management’s discussion and analysis.
Siemens employs extensive internal controls, enter-
prise-wide uniform reporting guidelines and additional
measures, including employee education and training, to
ensure that its financial reporting is conducted in accord-
ance with accepted accounting principles. We continually
monitor the compliance with these measures and guide-
lines, and also the functionality and reliability of our
internal control system, through an enterprise-wide inter-
nal audit process.
Our risk management system complies with the
requirements of the German Corporation Act (AktG). Our
risk management system is designed to enable the Manag-
ing Board to recognize potential risks early on and initiate
timely countermeasures.
In accordance with the resolution made at the Annual
Shareholders’ Meeting, KPMG Deutsche Treuhand-Gesell-
schaft Aktiengesellschaft has audited the consolidated
financial statements prepared in accordance with U.S.
GAAP and management’s discussion and analysis, and
issued an unqualified opinion.
Together with the independent auditors, the Superviso-
ry Board has thoroughly examined the consolidated finan-
cial statements, management’s discussion and analysis,
and the independent auditors’ report. The result of this
examination is included in the Report of the Supervisory
Board which begins on page 40 of this Annual Report.
Dr. Heinrich v. Pierer Heinz-Joachim Neubürger
President and Chief Executive Chief Financial Officer
Officer of Siemens AG of Siemens AG
Independent Auditors’ Report
The Supervisory Board of Siemens AG:
We have audited the accompanying consolidated bal-
ance sheets of Siemens AG and subsidiaries, as of Septem-
ber 30, 2001 and 2000, and the related consolidated state-
ments of income, cash flow, and changes in shareholders’
equity for the years then ended. These consolidated finan-
cial statements are the responsibility of the Company’s
management. Our responsibility is to express an opinion
on these consolidated financial statements based on our
audits.
We conducted our audits in accordance with auditing
standards generally accepted in the United States of Ameri-
ca. Those standards require that we plan and perform the
audit to obtain reasonable assurance about whether the
financial statements are free of material misstatement. An
audit includes examining, on a test basis, evidence support-
ing the amounts and disclosures in the financial state-
ments. An audit also includes assessing the accounting
principles used and significant estimates made by manage-
ment, as well as evaluating the overall financial statement
presentation. We believe that our audits provide a reason-
able basis for our opinion.
In our opinion, the consolidated financial statements
referred to above present fairly, in all material respects,
the financial position of Siemens AG and subsidiaries as of
September 30, 2001 and 2000, and the results of their
operations and their cash flows for the years then ended in
conformity with accounting principles generally accepted
in the United States of America.
Munich, Germany
November 29, 2001
KPMG Deutsche Treuhand-Gesellschaft
Aktiengesellschaft
Wirtschaftsprüfungsgesellschaft
Prof.Dr. Wiedmann Berger
Wirtschaftsprüfer Wirtschaftsprüfer

47
Management’s discussion and analysis
To help our shareholders follow our growth and progress,
our financial results are prepared in accordance with U.S.
GAAP principles using a component model that presents
the results for (i) our Operating Groups separately from
the results for (ii) the activities of Infineon Technologies
AG, (iii) our Financial and Real Estate activities, and (iv)
the effects of Eliminations, reclassifications and Corpo-
rate Treasury activities.
The four components of Siemens worldwide are as
follows:
■ Operations
This component is defined as Siemens’ Operating
Groups including corporate headquarters and exclud-
ing the other components.
■ Infineon
Infineon Technologies AG, Munich, is a consolidated
subsidiary whose shares are listed on the stock
exchanges in Frankfurt and New York. As we have
announced, we intend to reduce our holding in Infi-
neon over time.
■ Financing and Real Estate
Siemens’ Financing and Real Estate segments are
responsible for the Company’s international leasing,
finance, credit, and real estate management activities.
■ Eliminations, reclassifications and Corporate
Treasury
The fourth component included in Siemens’ financial
statements enhances the transparency of the other
components by separately presenting the elimination
of transactions among Operations, Infineon and
Financing and Real Estate and certain reclassifica-
tions. This component also includes Siemens’ Corpo-
rate Treasury activities, excluding those for Infineon.
Previously, eliminations of intracompany transactions
plus certain reclassifications were included in Operations,
while Corporate Treasury activities were included in
Financing and Real Estate. All prior-period financial
information has been reclassified to conform with the
current-period presentation.
We measure the profitability of our Operations compo-
nent by ebita and our Infineon component by ebit. ebita
is measured as earnings before financing interest, certain
pension costs, income taxes, amortization of goodwill and
purchased in-process R&D expenses and certain one-time
items. We measure the profitability of our Financing and
Real Estate component by income before income taxes
since interest expense and income is an important source
of revenue and expense for this component.
Management’s discussion and analysis presents
results for fiscal year 2001 and the prior fiscal year.
Following a discussion of joint ventures and acquisitions
completed in fiscal 2001, we discuss economic value
added (EVA) performance and provide an analysis of oper-
ating results and income. Also included in Management’s
discussion and analysis are separate sections concerning
our dividend, liquidity and capital resources, customer
financing, stock option plans, risk management, and out-
look for the period ahead.
Highlights
Fiscal 2001 compared to fiscal 2000
Despite a weakening economic environment throughout
fiscal 2001, many of our Operating Groups delivered
strong earnings. These include Automation and Drives
(A&D), Power Generation (PG), Transportation Systems
(TS), Medical Solutions (Med), and Osram. Financing and
Real Estate also contributed positive results. Other Operat-
ing Groups in key technology sectors were adversely
affected by rapidly deteriorating business conditions in
their particular industries. These include Information
and Communication Networks (ICN), Information and
Communication Mobile (ICM), Siemens Business Services
(SBS), and Infineon. We took aggressive action to address
these conditions by restructuring the capacities of these
Groups, which resulted in significant charges. These
effects contributed to a negative earnings development
for Operations as a whole compared to the previous fiscal
year. In this difficult environment, we initiated successful
asset management measures and significantly improved
our cash flow, particularly in the fourth quarter.
■ Siemens earned €2.088 billion in net income in fiscal
2001 including Infineon, special items as well as
restructuring and asset write-downs. Prior-year earn-
ings of €8.860 billion included substantial gains from
divestments implemented as part of the Ten-Point Pro-
gram we adopted in mid-1998. As a result, earnings
per share were €2.36 compared to €9.97 in the previous
year. For all periods presented, earnings per share
reflect a stock split, at a ratio of one additional share
for every two shares owned, which took effect on April
30, 2001.
Management’s discussion and analysis

48
Management’s discussion and analysis
■ ebita from Operations was €1.329 billion including
restructuring charges and asset write-downs of €1.863
billion. Excluding these charges and write-downs,
ebita from Operations was €3.192 billion. Prior year
ebita was €2.799 billion.
■ Net cash from operating activities of Siemens world-
wide was €7.016 billion for the year, sharply up from
the previous year’s level of €6.154 billion despite
increasingly difficult market conditions.
■ The proposed dividend of €1 per share is comparable
on a post-split basis to the prior-year dividend of €0.93
excluding the prior-year bonus dividend.
■ Sales for Siemens worldwide increased 12% compared
to fiscal 2000, to €87.000 billion. Excluding Infineon,
sales increased 15% to €82.256 billion. Positive cur-
rency translation effects contributed 1 percentage
point to this increase. Setting aside the effect of acqui-
sitions, sales at continuing businesses excluding Infi-
neon grew 11%.
■ Infineon, in which we held a 50.4% economic interest
at the end of fiscal 2001, recorded a net loss for the fis-
cal year of €591 million compared to net income of
€1.126 billion in fiscal 2000.
■ Fourth-quarter net income of Siemens worldwide was
a negative €1.098 billion impacted by special items of
negative €532 million after taxes. Net income in the
fourth quarter of fiscal 2000 was €562 million. ebita
from Operations for the fourth quarter of fiscal 2001
was a negative €130 million including restructuring
charges and asset write-downs of €959 million. Exclud-
ing these effects, ebita from Operations was a positive
€829 million. Prior-year fourth quarter ebita was €840
million. Also in the fourth quarter, operating activities
provided net cash of €5.857 billion, compared to net
cash provided of €2.757 billion in the fourth quarter of
fiscal 2000.
Twelve months ended September 30 Siemens worldwide Siemens excluding Infineonin millions of € 2001 2000 2001 2000
Net income 2,088 8,860 2,351 7,989
Less: Special items (net of taxes) (2,003) (6,221) (2,003) (6,221)
Net income excluding special items 85 2,639 348 1,768
Net income excluding special items –
Fiscal 2001 compared to fiscal 2000
Net income excluding special items adjusts reported net
income by removing certain one-time items from results
in our Operations segments and Financing and Real
Estate segments. We adjust net income in this way to pro-
vide a more meaningful comparison between the periods
under review. All figures for Siemens worldwide include
the results of Infineon.
Net income excluding special items for Siemens world-
wide was €85 million compared to net income of €2.639
billion in the previous year. For Siemens worldwide, earn-
ings per share excluding special items for the fiscal year
2001 were €0.10, compared to earnings per share of €2.97
for the fiscal year 2000. Excluding Infineon, net income
excluding special items for fiscal 2001 decreased to €348
million compared to €1.768 billion in fiscal 2000, princi-
pally reflecting reduced earnings from Operations.
Our largest special item in fiscal 2001 was a €3.459 bil-
lion pretax gain as a result of the irrevocable transfer of
93,825,225 shares of Infineon to our domestic pension
trust. We also recorded a €484 million gain resulting from
Infineon’s sale of 60 million of its shares in a capital
increase in the fourth quarter. In addition, Infineon
increased its capital in connection with acquisitions which
resulted in an aggregate gain of €122 million. Siemens
did not participate in these capital increases. These items
are recorded on our income statement as gains on sales
and dispositions of significant business interests. Taken
together, these transactions had the effect of reducing
Siemens’ economic interest in Infineon from approxi-
mately 71% as of the end of last fiscal year to 50.4% as of
September 30, 2001.

49
Management’s discussion and analysis
Offsetting these gains are charges totaling €927 mil-
lion taken in the fourth quarter of 2001 for impairment of
goodwill relating to acquisitions made by ICN and A&D.
These charges are not included in ebita from Operations.
They include a charge resulting from the impairment of
goodwill associated with the acquisition by ICN of Effi-
cient Networks, Inc, a provider of DSL equipment in the
U.S. Shortly after the acquisition of Efficient, worldwide
demand for DSL products contracted sharply. Additionally,
the total charges include an impairment of goodwill
primarily associated with the acquisition by A&D of
Milltronics, Ltd.
Also included in special items in fiscal 2001 is the
write-down of €258 million of inventories and other
assets in connection with a long-term, centrally managed
production and outsourcing contract for a border control
system in Argentina. This contract, originally entered into
by SBS, was cancelled by government decree.
Lower tax rates enacted by the tax reform passed in
Germany in October 2000, and the consequent adjust-
ment of Siemens’ deferred tax balances at October 1, 2000,
resulted in a one-time reduction of €222 million in
income tax expense. This benefit was recorded in the first
quarter of fiscal 2001.
After adjusting the amounts described above for taxes,
special items totaled €2.003 billion in fiscal 2001.
Special items in fiscal 2000 included €7.826 billion
from pre-tax gains on sales of significant business inter-
ests, principally including gains relating to the initial
public offering of Infineon. Special items in 2000 also
included exceptional gains from certain marketable secu-
rities and exceptional charges related to contract losses,
certain restructuring costs, the write-off of goodwill, a
one-time bonus for employees, and a provision related to
a loan. These other special items totaled a negative €280
million for fiscal 2000. For more information, see note 29
to the consolidated financial statements. Adjusted for
taxes, special items for fiscal 2000 totalled €6.221 billion.
Joint ventures and acquisitions
We completed the following transactions in fiscal 2001:
■ In November 2000, Med acquired Acuson Corporation
of the U.S. for a purchase price of approximately
U.S.$700 million.
■ In January 2001, PG transferred its nuclear power oper-
ations into a joint venture with Framatome ANP in
exchange for a 34% interest in the joint venture. This
investment is accounted for under the equity method.
■ In April 2001, Siemens completed the acquisition of
a controlling interest of 50% plus two shares in Atecs
Mannesmann AG (Atecs), an automotive and automa-
tion technology company. In accordance with the pur-
chase agreement, prior to closing we paid €3.1 billion
to Mannesmann AG. As of the date of closing, Siemens
made a capital contribution to Atecs. The purchase
agreement also provides for our acquisition of Man-
nesmann AG’s remaining interest in Atecs, either at
the option of Mannesmann during the period from the
date of closing through September 30, 2002, or at the
option of Siemens during the period from April 1, 2002
through December 31, 2003. We plan to exercise this
latter option. The purchase price for the remaining
interest in Atecs is between €3.7 and €3.8 billion under
both options. We have accounted for the Atecs transac-
tion as a purchase of a 100% interest, at a price of €9.6
billion, using the purchase method of accounting. The
purchase price, including the assumption of €2.8 bil-
lion of financial debt and pension liabilities, was allo-
cated to the assets acquired and liabilities assumed
based on estimated fair values. In connection with the
Atecs transaction, we entered into a put option con-
tract giving Siemens the right to sell Rexroth AG
(Rexroth), a wholly-owned subsidiary of Atecs, to
Bosch GmbH for €2.7 billion. The put option is exercis-
able from January 2002 through December 31, 2002.
We plan to exercise this option.
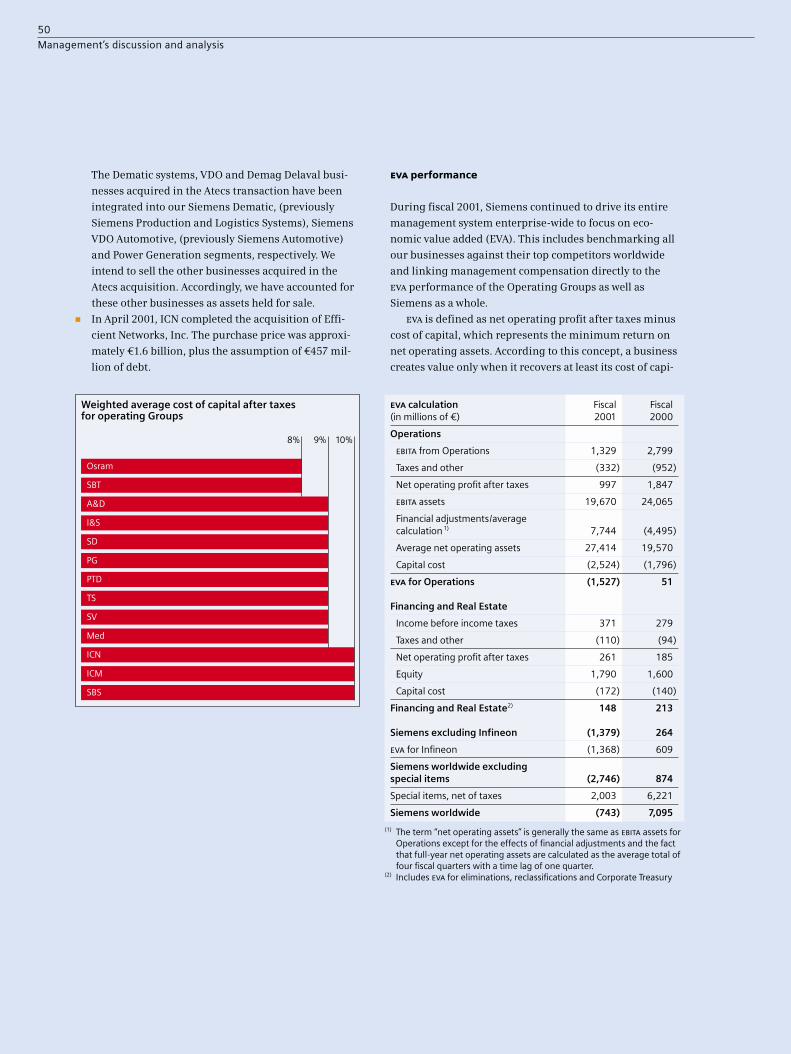
50
Management’s discussion and analysis
The Dematic systems, VDO and Demag Delaval busi-
nesses acquired in the Atecs transaction have been
integrated into our Siemens Dematic, (previously
Siemens Production and Logistics Systems), Siemens
VDO Automotive, (previously Siemens Automotive)
and Power Generation segments, respectively. We
intend to sell the other businesses acquired in the
Atecs acquisition. Accordingly, we have accounted for
these other businesses as assets held for sale.
■ In April 2001, ICN completed the acquisition of Effi-
cient Networks, Inc. The purchase price was approxi-
mately €1.6 billion, plus the assumption of €457 mil-
lion of debt.
eva performance
During fiscal 2001, Siemens continued to drive its entire
management system enterprise-wide to focus on eco-
nomic value added (EVA). This includes benchmarking all
our businesses against their top competitors worldwide
and linking management compensation directly to the
eva performance of the Operating Groups as well as
Siemens as a whole.
eva is defined as net operating profit after taxes minus
cost of capital, which represents the minimum return on
net operating assets. According to this concept, a business
creates value only when it recovers at least its cost of capi-
eva calculation Fiscal Fiscal(in millions of €) 2001 2000
Operations
ebita from Operations 1,329 2,799
Taxes and other (332) (952)
Net operating profit after taxes 997 1,847
ebita assets 19,670 24,065
Financial adjustments/average calculation 1) 7,744 (4,495)
Average net operating assets 27,414 19,570
Capital cost (2,524) (1,796)
eva for Operations (1,527) 51
Financing and Real Estate
Income before income taxes 371 279
Taxes and other (110) (94)
Net operating profit after taxes 261 185
Equity 1,790 1,600
Capital cost (172) (140)
Financing and Real Estate2) 148 213
Siemens excluding Infineon (1,379) 264
eva for Infineon (1,368) 609
Siemens worldwide excluding special items (2,746) 874
Special items, net of taxes 2,003 6,221
Siemens worldwide (743) 7,095
(1) The term “net operating assets” is generally the same as ebita assets forOperations except for the effects of financial adjustments and the factthat full-year net operating assets are calculated as the average total offour fiscal quarters with a time lag of one quarter.
(2) Includes eva for eliminations, reclassifications and Corporate Treasury
Weighted average cost of capital after taxes for operating Groups
8% 9% 10%
Osram
SBT
A&D
I&S
SD
PG
PTD
TS
SV
Med
ICN
ICM
SBS

51
Management’s discussion and analysis
Segment information analysis –
Fiscal 2001 compared to fiscal 2000
The following discussion adheres to our component
model of reporting and includes an analysis of the finan-
cial performance of Operations, Infineon, and our
Financing and Real Estate component.
Operations
Information and Communications
Information and Communication Networks (ICN) was
affected by substantial cut-backs in capital spending by
telecom operators for telecommunications and network-
ing products due to financial difficulties in these sectors.
In this challenging environment, ICN’s ebita for the fiscal
year was a negative €861 million, including restructuring
charges and asset write-downs of €1.059 billion. Exclud-
ing these effects, ebita at ICN was €198 million. ebita in
fiscal 2000 was €686 million, which included €204 million
in nonrecurring gains from the sales of investments and
real estate. Both fiscal 2000 and fiscal 2001 included
approximately €120 million in gains on shares of start-up
companies.
The restructuring charge is part of an overall plan to
cut approximately 10,000 positions in manufacturing,
sales and other functions and significantly reduce the
number of production facilities. In fiscal 2001, the plan
resulted in charges primarily for an employee severance
charge of €387 million which is expected to be paid out in
fiscal 2002. ICN expects to incur additional charges to
complete this plan during the first half of fiscal 2002.
Asset write-downs unrelated to the restructuring plan
involved accounts receivable, inventories, and venture
capital investments. Write-downs of accounts receivable
totaled €330 million, partly related to a major U.S. cus-
tomer, Winstar Communications. Inventory write-offs
were €173 million and the Group also wrote down €169
million primarily in venture capital investments.
Margin erosion and pricing pressures impacted earn-
ings throughout the Group. While the Wireline Networks
Division remained strongly profitable, ICN’s other major
tal and furthermore delivers EVA improvements in line
with capital market requirements. Because the three
major components of Siemens – Operations, Infineon,
and Financing and Real Estate – are fundamentally differ-
ent from each other, we adjust our calculations of EVA
accordingly. We use an “Operations Concept” for Opera-
tions and Infineon, and a finance concept known as
RORAC (return on risk-adjusted capital) for Financing and
Real Estate. This enables us to use EVA as a consistent
management metric while leaving business-specific value
drivers transparent. The EVA for Siemens worldwide is the
sum of the EVA for the three components.
Siemens worldwide excluding special items realized
negative eva of €2.746 billion in fiscal 2001 compared to
positive eva of €874 million in fiscal 2000. Excluding Infi-
neon, the comparable numbers are a negative €1.379 bil-
lion and a positive €264 million, respectively. Including
the effects of special items, eva was a negative €743 mil-
lion compared to a positive €7.095 billion in the prior year.

52
Management’s discussion and analysis
divisions posted losses involving the charges and write-
downs noted above. Unisphere Networks Division sub-
stantially narrowed its loss compared to fiscal 2000.
ebita margin was a negative 6.7% for ICN as a whole.
Excluding the restructuring charges and asset write-
downs, ebita margin was a positive 1.5%. eva remained
negative. Working off its large order backlog, ICN
increased sales to €12.882 billion for the full fiscal year,
14% higher than in fiscal 2000. A highlight was the Wire-
line Networks Division, which delivered a record 31 mil-
lion EWSD ports during the year. Order growth slowed
within the year, but still increased 9% year-over-year to
€12.639 billion. Asset write-downs and disposal of certain
marketable securities were partially offset by increased
goodwill due to the acquisition of Efficient. This, together
with improved working capital management, resulted in a
decrease of ebita assets by €1.156 billion year-over-year, to
€3.298 billion at the end of fiscal 2001.
Information and Communication Mobile (ICM)
increased profitability in its infrastructure business and
addressed sharply slower market growth in its mobile
phone business with a rapid realignment in the second
half of the fiscal year. ebita of negative €307 million
includes asset write-downs of €441 million, which were
largely confined to the Mobile Phones Division in the
third quarter. Excluding the write-downs, ebita was a pos-
itive €134 million compared to €718 million a year earlier.
The largest item within the €441 million was an inventory
write-off of €213 million. Other asset write-downs totaled
€228 million, including a €69 million write-down of ICM’s
investment in the German mobile commerce software
company, Brokat AG, and a €71 million write-down
incurred in connection with the closing of ICM’s U.S.
Opuswave operation.
The Mobile Networks Division strongly increased its
ebita contribution to €435 million for the year, and
increased sales by 52% despite a slowing market. The
Mobile Phones Division had ebita of negative €540 mil-
lion, approximately half of which relates to asset write-
down charges compared to positive ebita of €632 million
a year earlier. The Division sold more than 28.7 million
units compared to 23.9 million units in the previous fiscal
year. Rigorous cost-cutting initiated in the third quarter
helped the Division reduce its loss to €22 million in the
fourth quarter. ICM’s Fujitsu Siemens joint venture con-
tributed a modest profit and thus reversed its loss in fiscal
2000. Sales for ICM in the fiscal year grew 27%, to €11.299
billion. Orders of €11.866 billion were 14% higher than fis-
cal 2000. ebita assets decreased to €2.623 billion from
€2.876 billion, despite significant sales growth principally
due to successful asset management initiatives which led
to a reduction in working capital. Due to negative earn-
ings, however, eva was negative for the year.
ebita at Siemens Business Services (SBS) was a nega-
tive €259 million including fourth-quarter restructuring
charges and asset write-downs totaling €242 million.
Excluding these effects, ebita was a negative €17 million
compared to a positive €70 million a year earlier. Restruc-
turing charges totaling €196 million in employee sever-
ance costs arose from the elimination of 2,200 positions
primarily in Europe, as part of a program to address dete-
riorating economic conditions in the region. The Group
expects to pay out substantially all of this charge in fiscal
2002. Asset write-downs of €46 million related to accounts
receivable and venture capital investments. Fiscal 2001
ebita includes loss provisions relating to two significant
business process outsourcing contracts totaling €192 mil-
lion. Results in fiscal 2001 and 2000 include gains on
investments of €44 million and 54 million, respectively.
ebita margin at SBS was a negative 4.3%. Excluding the
restructuring charges and asset write-downs noted above,
ebita margin was a negative 0.3%. As a result, eva was
negative. Sales for the fiscal year edged up 3%, to €6.034
billion, while new orders rose more quickly, to €6.303 bil-
lion. Asset write-downs and contract loss provisions,
together with effective working capital management,
resulted in a decline in ebita assets from €1.396 billion at
the end of fiscal 2000 to €518 million at the close of fiscal
2001.
53
Management’s discussion and analysis
Automation and Control
Automation and Drives (A&D) delivered strong double-
digit growth in earnings, sales and orders, based on
excellent performance by the Group’s three largest divi-
sions: Industrial Automation Systems, Low Voltage Con-
trols and Distribution, and Motion Control Systems. ebita
increased to €981 million, €116 million higher than in fis-
cal 2000, and ebita margin reached 11%. Acquisitions and
higher business volume in existing businesses pushed
ebita assets up slightly, but the faster growth in earnings
enabled A&D to further increase its positive eva. In fiscal
2001, sales rose 13% to €8.947 billion and orders climbed
11% to €9.065 billion, compared to €7.943 billion and
€8.163 billion in fiscal 2000. Slowing market demand
began having an effect in the fourth quarter, as new
orders slid 5% compared to the comparable quarter of
fiscal 2000.
ebita at Industrial Solutions and Services (I&S) fell
to €97 million from €111 million in fiscal 2001. ebita mar-
gin declined slightly to 2.1%. Mid-year weakness in the
Group’s project-related divisions and lower margins in its
petrochemical business and its industrial services busi-
ness were the primary factors in reducing the Group’s
profitability year-over-year. Sales rose 8% to €4.563 bil-
lion from €4.226 billion a year earlier, while orders rose
11% to €4.881 billion from €4.401 billion on increased vol-
ume at the Industrial Services Division. ebita assets
increased by €118 million, due to higher receivable and
contract inventories, to €493 million. Coupled with
reduced earnings, this resulted in a lower eva.
Siemens Dematic (SD) was formed during the year via
a third-quarter merger of the existing businesses of
Siemens Production and Logistics Systems (PL) and
Dematic AG (part of the Atecs acquisition). ebita was a
negative €59 million compared to a positive €196 million
for PL in fiscal 2000. Profitability at the Electronics Assem-
bly Division was reduced by a sharp slow-down in the
telecommunications and other electronics manufacturing
industries. Negative results at the Postal Automation Divi-
sion and contract loss provisions of €66 million primarily
at the Material Handling Automation Division combined
with €29 million in integration and other costs to further
reduce ebita. ebita margin moved from 11% for PL in fiscal
2000 to a negative 2.3% for SD in fiscal 2001.
Sales rose 41% to €2.520 billion and orders rose 19% to
€2.281 billion compared to fiscal 2000, driven by Dematic
AG’s contribution of €822 million in sales and €983 mil-
lion in orders. Both sales and orders declined year-over-
year on a comparable basis, principally due to postpone-
ment of major projects by customers, including the U.S.
Postal Service, at the Postal Automation Division. ebita
assets rose 76% as a result of the merger, to €984 million
from €560 million. Coupled with negative earnings for
the year, this resulted in a negative eva.
Siemens Building Technologies (SBT) recorded ebita
of €132 million, compared to €297 million in fiscal 2000.
ebita margin fell to 2.4%, and the Group’s eva turned neg-
ative. Margin erosion and certain one-time charges pri-
marily at the Fire and Safety Division in the U.S., together
with rationalization costs at the Building Automation and
Fire and Safety Divisions, combined to reduce the Group’s
profitability. Acquisitions in Europe, the U.S. and Brazil
helped increase sales and orders by 12% and 10%, respec-
tively, to €5.518 billion and €5.549 billion. However, SBT’s
ebita assets remained flat at €2.276 billion.
Power
ebita at Power Generation (PG) surged from €66 million
in fiscal 2000 to €634 million in fiscal 2001. ebita margin
rose 6.5 points, to 7.4%, and the Group’s positive eva
increased substantially. The Fossil Power Generation Divi-
sion drove the Group’s profitability, primarily on strong
demand for its gas turbines in the U.S. Sales grew 10% to
€8.563 billion and orders jumped 30% to €12.219 billion,
also reflecting the robust gas turbine business in the U.S.
In the second quarter, the Group’s nuclear power business
was contributed to a joint venture with Framatome in
exchange for a 34% interest in the venture. This interest is
accounted for using the equity method. In the third quar-
ter, PG acquired Demag Delaval as part of the Atecs acqui-
sition. On a comparable basis, sales grew 24% compared
to fiscal 2000, including a positive currency translation

54
Management’s discussion and analysis
effect of 4%, and orders grew 40%. The Group’s order
backlog reached €26 billion at year-end including €11 bil-
lion of reservations. Higher customer prepayments
enabled the Group to reduce its ebita assets to a negative
€1.003 billion, compared to a positive €178 million at the
end of fiscal 2000.
Power Transmission and Distribution (PTD)
improved its ebita to €96 million, including restructuring
charges and capacity adjustments of €31 million. Exclud-
ing these effects, ebita was €127 million compared to €45
million a year earlier. ebita margin was 2.4%, and eva
moved closer to positive territory. Excluding the restruc-
turing charges and capacity adjustments, ebita margin
was 3.1%. The High Voltage Division drove the Group’s
earnings improvement. The €31 million in charges were
split between the Medium Voltage Division and Metering
Division. Major projects helped push sales up 29%, to
€4.053 billion for the fiscal year, while customers’ post-
ponement of major projects in the Energy Management
Division held order growth to 9%, or €3.887 billion. ebita
assets increased 28%, to €1.004 billion, due in part to
acquisitions and lower advances received from customers.
Transportation
Transportation Systems (TS) more than doubled its
earnings compared to the previous year, with ebita of
€186 million. ebita margin also more than doubled, from
2.0% to 4.6%, improving the Group’s already positive eva.
Effective implementation of a Group-wide productivity
initiative enabled TS to achieve its strong earnings per-
formance on comparatively modest sales growth of 8%, to
€4.021 billion compared to €3.710 billion a year earlier.
The Group also excelled in winning new business, with
orders growing 52% to €5.647 billion. New orders during
the year included 1,200 new passenger railcars and related
maintenance in Britain, and a super-high-speed train for
the city of Shanghai. These and other successful bids
pushed the Group’s order backlog toward €11 billion at the
end of the fiscal year. TS further reduced its already nega-
tive ebita assets to a negative €916 million through ongo-
ing asset management programs and higher customer
prepayments.
Siemens VDO Automotive AG (SV) is the new name of
Siemens’ automotive businesses, which merged with the
VDO automotive operations of Atecs in the third quarter.
SV recorded an ebita of negative €261 million, including
€90 million in asset write-downs split between losses on
the divestment of the Group’s wiring harness business
and write-downs of investments. ebita excluding these
charges was a negative €171 million compared to a posi-
tive €89 million a year earlier due to pricing pressures
and continued significant development costs for innova-
tive new technologies including advanced diesel injection
systems as well as communications and multimedia sys-
tems. Sales and orders rose 49%, to €5.702 billion, com-
pared to fiscal 2000, primarily due to the merger. The VDO
Automotive businesses contributed €1.686 billion to both
sales and orders for the year, while sales and orders grew
slowly for the former Siemens Automotive businesses.
ebita assets, which include goodwill from the VDO acqui-
sition, jumped to €3.691 billion from €937 million at the
end of fiscal 2000, pushing eva further into negative terri-
tory.
Medical
Medical Solutions (Med) turned in an excellent perform-
ance, achieving record levels in earnings, sales, and
orders due in large part to the successful integration of
Acuson, acquired in fiscal 2001, and Shared Medical Sys-
tems Corp. (SMS), acquired in late fiscal 2000. ebita of
€808 million was 75% higher than in fiscal 2000. ebita
margin increased to 11.2%. Imaging systems remained
the primary engine of Med’s profitable growth. Sales
increased 47% to €7.219 billion, and orders grew 61% to
€8.444 billion. Currency translation effects contributed
five percentage points of sales growth. The acquisition of
Acuson was the main factor in the Group’s higher ebita
assets, which stood at €4.099 billion at the end of the fiscal
year. The effect of acquisitions on ebita assets resulted in
a lower eva than the prior year.

55
Management’s discussion and analysis
Lighting
Despite a significantly more difficult economic environ-
ment, particularly in the U.S., Osram increased its ebita
to €462 million in fiscal 2001 from €388 million a year
earlier. ebita margin climbed to 10.2%, and eva was posi-
tive. ebita benefited from €54 million in nonrecurring
gains, including €31 million related to the successful reso-
lution of a patent rights issue in the fourth quarter and
€23 million from an earn-out payment received in the
first quarter related to the Group’s interest in a joint ven-
ture. Excluding these effects, Osram continued to main-
tain a 9% ebita margin despite deteriorating economic
conditions in its large U.S. market. Sales grew 5% com-
pared to fiscal 2000, to €4.522 billion, primarily due to
positive currency translation effects. ebita assets
decreased slightly, to €2.505 billion, from €2.533 billion
at the end of fiscal 2000.
Corporate, eliminations (Operations) and
Reconciliation to Financial Statements
The Managing Board is responsible for assessing the per-
formance of the Groups. Corporate, eliminations (Opera-
tions) and Reconciliation to Financial Statements include
various categories of items which are not allocated to the
Groups since the Managing Board has determined that
such items are not indicative of Group performance.
These include nonrecurring, one-time charges or gains
and results from centrally managed projects. In addition,
Corporate, eliminations (Operations) includes corporate
charges such as personnel as well as domestic pension-
related income or expense, certain corporate-related
derivative activities, centrally held equity investments,
business units, and corporate projects. Reconciliation to
Financial Statements includes various items excluded by
definition from ebita. Group ebita is used to determine
bonus payments in accordance with our management
incentive program.
Corporate, eliminations (Operations). ebita for Cor-
porate, eliminations was a negative €320 million in fiscal
2001 compared to a negative €1.270 billion a year earlier.
Corporate headquarter expenses increased to €910
million in fiscal 2001 from €827 million in 2000, reflect-
ing an increase of €252 million relating to activities in
various central projects, particularly the Company’s
e-business initiatives, partly offset by a decline in central
personnel-related expenses associated with the Com-
pany’s employee stock purchase program.
In fiscal 2001, gains on available for sale securities
increased to €227 million from €98 million in the prior
fiscal year, reflecting the continuing disposal of a portion
of the centrally managed equities portfolio.
Domestic pension-related benefit (expense) increased
from a negative €177 million in fiscal 2000 to a positive
€418 million in fiscal 2001. In March 2000, the Company
established a domestic pension trust and assets were con-
tributed at that date. As a result, expected return on plan
assets was included in the determination of net periodic
pension benefit (expense) for the entire year in fiscal
2001. Prior to the establishment of the pension trust, the
return on trading securities designated as pension assets
was recorded as income from marketable securities.
Other corporate charges totaled negative €168 million
in fiscal 2001 compared to a negative €445 million in fis-
cal 2000. The total for fiscal 2001 includes a €209 million
loss on the sale of a centrally held investment, €78 million
in expenses on centrally managed litigation issues, €74
million in corporate interest expense in part related to the
Atecs acquisition, €63 million in severance charges asso-
ciated with the Ten-Point Program, and €49 million attrib-
utable to the service cost component of domestic pension
expense which is no longer allocated to the Groups. Fiscal
2001 also included a gain of €114 million related to cur-
rency effects and the treatment of derivative contracts not
qualifying for hedge accounting, and positive resolution
of certain asset disposal contingencies of €162 million.
In fiscal 2000, other corporate items included the fol-
lowing: higher charges related to currency effects and the
treatment of derivative contracts not qualifying for hedge
accounting of €212 million; losses on asset dispositions
totaling €210 million; €178 million in employee severance
and contract termination costs associated with the Ten-
Point Program; and €68 million related to the centrally
managed outsourcing contract in Argentina originally
entered into by SBS. The €178 million in employee sever-
ance and contract termination costs relate to the Groups
primarily as follows: PG €60 million; SBT €46 million; SBS
€35 million; and TS €10 million. Fiscal 2000 also included
€692 million in income from marketable securities classi-
fied as trading.

56
Management’s discussion and analysis
ebita assets in the prior year included an initial
deposit of €2.1 billion related to the Atecs acquisition,
which closed in fiscal 2001. As a result of the closing, the
assets of the acquired and consolidated Atecs activities
were assigned to their respective Operating Groups (SD,
SV, and PG) in fiscal 2001. ebita assets were reduced in fis-
cal 2001 by the recognition of a minimum pension liabil-
ity of €2.7 billion, offset in part by assets from the Atecs
acquisition that are classified as held for sale.
Reconciliation to Financial Statements. Other inter-
est expense increased in fiscal 2001 as a result of higher
borrowings to fund Operations. Goodwill amortization
and IPR&D expenses increased as a result of acquisitions
in fiscal 2000 and 2001, primarily Atecs and SMS. Gains
on sales and dispositions of significant business interests
and other special items are discussed on page 48 under
“Net income excluding special items.”
Infineon
Infineon’s ebit was a negative €1.024 billion in fiscal
2001, compared to a positive €1.670 billion last year. Sales
decreased to €5.671 billion from €7.283 billion in fiscal
2000. Net capital employed increased to €6.471 billion
compared to €5.709 billion at the end of the preceding fis-
cal year.
Additional financial information is available from
Infineon Technologies AG in its Annual Report and at
www.infineon.com under Investor Information/Reports &
Financials.
Financing and Real Estate
Siemens Financial Services (SFS) increased its income
before income taxes €80 million year-over-year, to €158
million. Gains on the sale of equity stakes held by Siemens
Project Ventures in India and the U.S. contributed €45 mil-
lion of the increase. These gains helped further improve
the Group’s positive EVA. Higher interest income from the
factoring of receivables and the Group’s growing leasing
business was offset by higher loan provisions and in-
creased administrative expense, resulting in part from
the acquisition of Schroder Leasing Ltd. in the prior year.
Sales climbed to €481 million, 36% higher than in fiscal
2000. Sales primarily represent lease revenues from oper-
ating leases, and do not reflect the bulk of the Group’s
business in capital leases and other financing activities.
Total assets increased to €9.363 billion, 10% higher than at
the end of fiscal 2000, due to increased receivables in the
leasing business of the Equipment Sales Financing Divi-
sion.
Income before income taxes at Siemens Real Estate
(SRE) increased 6% to €213 million. As in fiscal 2000, a
significant part of the earnings resulted from gains on
the dispositions of real estate assets, amounting to €117
million as compared to €111 million in fiscal 2000. The
Group generated most of its remaining pretax earnings
from rental income related to its real estate management
and lease administration activities. Of the total sales of
€1.542 billion in fiscal 2001, more than 75% relates to
rental income, with the balance composed primarily of
sales from facilities services. The 9% increase in total
sales results in part from increased rentals following SRE’s
assumption of control over additional Siemens real estate
and increased demand. Total assets declined 3%.

57
Management’s discussion and analysis
Consolidated statements of income –
Fiscal 2001 compared to fiscal 2000
The following discussion adheres to our component
model of reporting and includes an analysis of the income
statement organized by component: Operations, Financ-
ing and Real Estate, and Eliminations, reclassifications
and Corporate Treasury. A detailed discussion of
Infineon’s income statement is available in the Infineon
AG Annual Report for fiscal 2001 and at www.infineon.com
under Investor Information/Reports & Financials.
Operations
Net sales in fiscal 2001 totaled €82.427 billion, an increase
of 15% compared to fiscal 2000. The acquisitions of
Shared Medical Systems Corp. (SMS), Acuson, Efficient
Networks, Atecs Mannesmann AG and other businesses
contributed approximately €3.5 billion in additional sales.
Every business area contributed to the positive sales
trend, with ICN, ICM, A&D and PG leading the Group con-
tributions. Revenues were also affected positively by for-
eign currency effects of 1%.
As a percentage of revenue, gross profit on sales
decreased slightly to 27.0% from 27.5%. Higher margins at
PG, TS and Med were offset by restructuring charges and
asset write-downs including severance charges and
inventory write-downs as well as by contract loss accruals
primarily at ICN, ICM, SBS and SD, and margin erosion at
ICN and ICM. See the analysis above for further com-
ments on the individual Groups.
Research and development expenses for the Opera-
tions component exclude purchased IPR&D. These
expenses are reported together with goodwill amortiza-
tion as a line item below ebita from Operations. R&D
increased 17.5% to €5.427 billion in fiscal 2001. R&D
spending represented 6.6% of sales, 0.1 percentage points
more than in the prior fiscal year. The increase reflects
our ongoing R&D efforts in a wide variety of areas, includ-
ing higher spending on the development of network prod-
ucts for UMTS wireless technologies at our ICM Group and
continued spending on IP convergence products at ICN.
Expansion of research and development programs at SV
and Med also contributed to the increase.
Marketing, selling and general administrative
expenses totaled €15.559 billion, a 16.7% increase com-
pared to fiscal 2000. This figure represents 18.9% of sales,
an increase of 0.3 percentage points over the prior year.
The majority of the increase was contributed by ICN and
ICM, reflecting higher accounts receivable provisions,
including those related to Winstar Communications, as
well as increased advertising costs at ICM.
Other operating income (expense), net from opera-
tions decreased to a negative €118 million compared to a
negative €13 million in fiscal 2000. The current period
includes higher amortization expense of intangibles pri-
marily related to the Atecs acquisition and losses on the
divestment of a business at SV.
Income from investments in other companies
decreased by €334 million to an expense of €24 million,
due primarily to a €209 million loss on the sale of a cen-
trally managed investment. Also included in fiscal 2001
are additional charges and expenses resulting from the
write-down of venture capital and equity investments at
ICN and SV. In contrast, fiscal 2000 includes €161 million
in gains on the sale of investments at ICN.
Income from financial assets and marketable securi-
ties in fiscal 2001 was a positive €263 million. This
includes principally €420 million in gains on sales of
available for sale securities offset by €184 million of write-
downs of marketable securities, particularly Brokat AG,
that suffered a material decline in value which we have
determined to be other than temporary. Income from
financial assets and marketable securities in fiscal 2000
was a positive €832 million. This includes principally
€692 million in income on marketable securities classi-
fied as trading and €174 million of gains on sales of avail-
able for sale securities. Subsequent to the contribution in
March 2000 of the trading portfolio to the domestic pen-
sion trust, the Company no longer maintains a trading
portfolio.
ebita from Operations in fiscal 2001 decreased to
€1.329 billion from €2.799 billion in fiscal 2000, reflecting
in large part charges for restructuring and asset write-
downs. As a result, ebita margin decreased to 1.6% com-
pared to 3.9% in fiscal 2000.
Other interest income (expense), net increased to an
expense of €304 million compared to an expense of €220
million in fiscal 2000, due primarily to interest on a liabil-
ity relating to our acquisition of Atecs and interest on
other financial indebtedness.

58
Management’s discussion and analysis
Goodwill amortization and purchased IPR&D expenses
of Operations totaled €665 million in fiscal 2001 com-
pared to €253 million in fiscal 2000. The increase reflects
the goodwill amortization and IPR&D expenses relating to
Acuson, acquired in November 2000, and Atecs and Effi-
cient, acquired in April 2001.
Gains on sales and dispositions of significant business
interests include the gain resulting from the irrevocable
transfer of Infineon shares into our domestic pension
trust, as well as a gain from an additional capital offering
by Infineon as described below in “Siemens Worldwide.”
Other special items include goodwill impairments related
to Efficient and Milltronics, and the write-down of inven-
tories and assets associated with the contract cancellation
in Argentina discussed above in “Net income excluding
special items.”
Financing and Real Estate
Sales from Financing and Real Estate increased 14% to
€2.016 billion compared to fiscal 2000. The increase is pre-
dominantly attributable to the Equipment Sales Financ-
ing Division at SFS and additional real estate property
leases at SRE.
Other operating income (expense), net was €143 mil-
lion in fiscal 2001 compared to €245 million in 2000. Both
years included gains on the disposal of real estate. For fis-
cal 2001, interest income was €68 million, which repre-
sents an increase of €65 million as compared to 2000.
This increase resulted from higher volumes in equipment
leasing and from sales of receivables. As a result, income
before income taxes increased to €371 million compared
to €279 million in fiscal 2000.
Eliminations, reclassifications and corporate
treasury
This component of Siemens worldwide includes elimina-
tions of activity conducted between the other three com-
ponents: Operations, Infineon, and Financing and Real
Estate. (For definitions of these components, see page 47).
In practical terms, these eliminations primarily concern
transactions between the Operations and Financing and
Real Estate components. To the extent that Infineon pro-
vides products or services to Operations, that activity is
eliminated here as well.
This component also includes reclassification of finan-
cial items, which are associated with Operations but not
included in ebita of Operations. We make these reclassifi-
cations in our Consolidated Statements of Income to
enable increased transparency in reporting results for
Operations. Examples of such reclassifications in fiscal
2001 include €258 million into cost of goods sold related
to a write-down of assets associated with a centrally man-
aged project in Argentina, €126 million in IPR&D related
to the acquisitions of Acuson, Atecs and Efficient which
was reclassified as research and development expenses
for Siemens worldwide, and €927 million in goodwill
impairments primarily related to the acquisitions of Effi-
cient and Milltronics reclassified as other operating
expense for Siemens worldwide.
Finally, this component also reflects the results of
intra-Siemens activity by our Corporate Treasury, which
provides corporate finance and treasury management
services to our Operations component (excluding Infi-
neon Technologies AG) and to our Financing and Real
Estate component.

59
Management’s discussion and analysis
Siemens worldwide (including Infineon)
New orders in fiscal 2001 rose to €92.528 billion, 11% or
€9.102 billion higher than in fiscal 2000. Orders in Ger-
many increased 5% to €18.921 billion from €18.043 billion
in fiscal 2000. International orders rose faster, from
€65.383 billion a year ago to €73.607 billion in fiscal 2001,
an increase of 13%. Sales for the fiscal year climbed 12% to
€87.000 billion. Sales in Germany increased by 1% to
€19.144 billion, while international sales rose 16% to
€67.856 billion. International business now accounts for
almost 80% of Siemens’ total volume.
Gross profit decreased by 1.2 percentage points to
26.6% in fiscal 2001. The effects of Operations, Financing
and Real Estate and Eliminations, reclassifications and
Corporate Treasury on gross profit are discussed above.
In addition, gross profit for Siemens worldwide was nega-
tively affected by the significant decrease in gross profit
at Infineon.
Gains on sales and dispositions of significant business
interests for the fiscal year were €4.238 billion. Included
in this amount was a €3.459 billion pre-tax gain as a result
of the irrevocable transfer of 93,825,225 shares of Infi-
neon to our domestic pension trust. We also recorded a
€484 million gain resulting from Infineon’s sale of 60 mil-
lion of its shares in a capital increase in the fourth quar-
ter. In addition, Infineon increased its capital in connec-
tion with acquisitions which resulted in a gain of €122
million. Siemens did not participate in these capital
increases. Taken together, these transactions had the
effect of reducing Siemens’ economic interest in Infineon
from approximately 71% as of the end of last fiscal year to
50.4% as of September 30, 2001.
As described in “Liquidity and Capital Resources”
below, with the worldwide decline in equity markets,
Siemens’ worldwide pension plans experienced a signifi-
cant change in their funding status in fiscal 2001. Primar-
ily as a result of the decline in funding status, net periodic
pension cost in fiscal 2002 will increase.
The effective tax rate on income for fiscal 2001 was
29%, which was positively impacted by the tax-free sale of
a part of our interest in Infineon. In fiscal 2001, lower tax
rates mandated by the tax reform passed in Germany in
October 2000 resulted in an one-time reduction of €222
million in income tax expense after adjustment of
Siemens’ deferred tax balances at October 1, 2000.
Dividend
Siemens AG, the parent company of all businesses dis-
cussed in this report, recorded a net income under Ger-
man accounting principles of €899 million for fiscal 2001,
compared to €1.927 billion in the previous year.
At the Annual Shareholders’ Meeting scheduled for
January 17, 2002, the Managing Board, in agreement with
the Supervisory Board, will submit the following proposal:
to pay €1.00 per share as a dividend, which aggregates to
a total payout of €888 million. This proposed dividend is
comparable in amount to the prior year dividend of €0.93
on a post-split basis excluding the prior-year bonus divi-
dend.

60
Management’s discussion and analysis
Liquidity and capital resources
The following discussion adheres to our component
model of reporting and includes an analysis of cash flow
and related balance sheet effects in our Operations and
Financing and Real Estate components.
Cash Flow
Net cash provided by the operating activities of the
Operations component for fiscal 2001 totaled €5.885 bil-
lion compared to €4.555 billion for fiscal 2000. Significant
improvements in asset management, particularly man-
agement of receivables and other working capital ele-
ments especially in the fourth quarter, increased cash
flow despite the decrease in net income. Net income in
both years includes gains on sales and dispositions of sig-
nificant business interests, described above. These gains,
along with the proceeds of the sales, are eliminated from
net cash provided by operating activities and included in
net cash provided by investing activities. The increase in
depreciation and amortization reflects primarily the
goodwill impairments described above. The prior year
includes adjustments for non-cash gains on trading secu-
rities. The increase in inventories was significantly lower
than in the prior year, while accounts receivable
decreased more than in fiscal 2000 and accounts payable
increased. In addition, other current liabilities increased
significantly as a result of higher billings in excess of
costs and related advances.
Net cash used in investing activities within Operations
was €4.519 billion, compared to net cash provided of
€1.670 billion in fiscal 2000. The prior year included pro-
ceeds from sales and dispositions of significant business
interests totaling €9.562 billion. Cash used in acquisitions
in the current year includes a repayment of approximately
€1 billion to Robert Bosch GmbH as a result of the revised
acquisition structure for Atecs, €1.6 billion for the acquisi-
tion of Efficient Networks, and €780 million for the acqui-
sition of Acuson. Investments in property, plant and
equipment also increased. The prior year includes €2.449
billion used in the purchase of investments, primarily the
initial payment for the acquisition of Atecs. The prior year
includes cash used in acquisitions for the purchase of
SMS. Cash was provided in the current year from the sale
of marketable securities as well as the sale of an invest-
ment in a domestic equity and debt security fund, the lat-
ter of which generated proceeds of approximately €2.6 bil-
lion.
Net cash provided by the operating activities of
Infineon was €211 million, compared to €2.080 billion in
the prior year, primarily due to the net loss of €591 mil-
lion in fiscal 2001 compared to net income of €1.126 bil-
lion in the prior year. Net cash used in investing activities
of Infineon was €1.813 billion, compared to €2.327 billion
in fiscal 2000 reflecting an increase in investments in
property, plant and equipment offset by sales of invest-
ments and marketable securities in the current year.
Net cash provided by the operating activities of our
Financing and Real Estate component was €654 million
compared to €1.155 billion in fiscal 2000. This reflects a
net increase in working capital, primarily due to an
increase in other current assets.
Net cash used in investing activities in Financing and
Real Estate was €870 million compared to €2.367 billion in
the prior year, reflecting reduced incremental sales of
receivables to SFS by Operations. Net proceeds from the
Net cash provided by operating activities(in billions of euros)
1999 2000 2001
7.0
6.2
3.6

61
Management’s discussion and analysis
sale of trade receivables of €866 million includes the sale
of approximately €750 million in accounts receivable via
the issuance of asset-backed commercial paper in a mar-
ket standard transaction to third party financial market
participants under our SieFunds program (discussed
below). This transaction further enhances SFS’s ability to
manage its overall funding position. These sales of receiv-
ables were largely offset by an increase in third-party
financing receivables at SFS. For Siemens worldwide, pro-
ceeds from the sale of trade receivables are reclassified
from investing activities to operating activities. Proceeds
generated from the sale of accounts receivable to SFS by
our Operating Groups are eliminated for Siemens world-
wide under (increase) decrease in accounts receivable.
Net cash provided by operating activities of Siemens
worldwide totaled €7.016 billion compared to €6.154 bil-
lion for fiscal 2000. Net working capital (defined as the
change in current assets and liabilities) provided €4.490
billion in fiscal 2001 compared to €1.868 billion in fiscal
2000. This increase was driven primarily by a reduction in
accounts receivable and the sale of trade receivables.
Net cash used in investing activities of Siemens world-
wide reflects €1.475 billion in proceeds from the issuance
of Infineon shares in July 2001. This issuance additionally
resulted in a decrease in Siemens’ ownership percentage
in Infineon.
Net cash used in financing activities for Siemens
worldwide was €95 million compared to net cash used of
€1.174 billion in fiscal 2000. The decrease in cash used was
driven by the June 2001 issuance of two bonds with a total
volume of €4.0 billion shown in Corporate Treasury pri-
marily associated with refinancing in the Financing and
Real Estate businesses. This was partially offset by repay-
ment of short-term debt of €976 million and the payment
of dividends of €1.412 billion, which included an amount
of €823 million in regular dividends and an amount of
€589 million as a bonus dividend. For more information
on the bond issuance, see the discussion in “Capital
Resources and Capital Requirements” below.
For Siemens worldwide, total net cash provided by
operating activities of €7.016 billion, less net cash used in
investing and financing activities of €5.981 billion, plus
currency translation effects, resulted in a €940 million
increase in cash and cash equivalents, to €7.802 billion.
Capital Resources and Capital Requirements
Siemens’ overall financing policy reflects its commitment
to a strong financial profile. We maintain a range of fund-
ing sources and high-volume backup facilities with a
number of banks which operate on an international basis.
For example, we have available commercial paper pro-
grams of U.S.$1.6 billion and €1.5 billion in the U.S. dollar
and euro markets, respectively, as well as a medium-term
note program of €3.5 billion in Europe. At the close of fis-
cal 2001, the amount outstanding under the commercial
paper and medium-term note programs totaled approxi-
mately €2.0 billion. The backstop facilities at our disposal
include U.S.$2.0 billion provided by a syndicate of interna-
tional banks and an aggregate of €1.4 billion provided by
three domestic banks.
Siemens constantly monitors funding options avail-
able in the capital markets as well as trends in the avail-
ability and cost of such funding, with a view to ensuring
an appropriate overall funding situation. In June 2001, we
issued bonds with a total volume of €4 billion. These
bonds were issued in two tranches of €2 billion each, with
a 5-year and 10-year maturity, respectively. The annual
coupon for the five-year tranche is 5%, and for the ten
year tranche, 5.75%. The five-year tranche matures on
July 4, 2006 and the ten-year tranche matures on July 4,
2011. A portion of the borrowed funds was used to repay
short-term liabilities and refinance outstanding debt due
in the current and following calendar year.
Our Financing and Real Estate businesses are also key
contributors to our financial management activities. In
fiscal 2001, SFS successfully established structures that
allow Siemens to raise funding either by issuing asset-

62
Management’s discussion and analysis
backed securities via the multi-seller, multi-currency
SieFunds conduit sponsored by SFS, or alternatively by
selling receivable portfolios to banks or other financial
market participants. Siemens provides liquidity lines for
SieFunds. Liquidity lines are provided for internal and
external transactions. In external transactions, liquidity
is generally syndicated up to a certain percentage.
In view of weakening economic growth in many of our
regional and global markets, we initiated a series of meas-
ures in the third quarter of fiscal 2001 to improve working
capital management and increase our cash flows. While
asset management is already a fundamental component
of our company-wide emphasis on eva, we have imple-
mented an additional management incentive program to
further improve working capital management and
increase liquidity.
As a separate, publicly listed company, Infineon man-
ages its capital resources separately from Siemens and, as
a consequence, according to its own independent require-
ments and business objectives.
Standard & Poor’s and Moody’s Investors Service rate
our long-term corporate credit AA and Aa3, respectively.
Their ratings for our short-term corporate credit and com-
mercial paper are A-1+ and P-1, respectively.
We believe that cash and cash equivalents as well as
our overall funding options give us adequate flexibility to
meet both our short-term and long-term financial obliga-
tions and to execute our spending programs as planned
in line with current market conditions. A final net pay-
ment of approximately €1 billion for the Atecs acquisition
is scheduled for calendar year 2002 upon the purchase of
the remaining interest. We have approximately €2.6 bil-
lion of debt including commercial paper that is scheduled
to become due within the next year.
As of September 30, 2001, we had approximately €1.4
billion of accrued contract loss provisions. Accrued con-
tract losses relate primarily to the Groups PG (€433 mil-
lion), SBS (€127 million), ICN (€95 million) and ICM (€90
million). For all accrued contract losses, we anticipate that
the cash outflows for labor, materials, contract penalties
and related costs on such contract losses will be approxi-
mately €1.2 billion in fiscal 2002.
In fiscal 2001, Siemens’ pension plans experienced sig-
nificant changes in their funding status as a result of the
significant declines in the value of plan assets resulting
from a worldwide decline in equity markets. The funding
status at September 30, 2001 has resulted in the recogni-
tion of a minimum pension liability of €3.994 billion (net
of tax) that has been recorded against accumulated other
comprehensive income as a reduction of shareholders’
equity and may result in future funding requirements.
Shareholders’ equity was €23.812 billion on September
30, 2001, down from €28.480 billion on September 30,
2000. This is mainly due to the charge taken to other com-
prehensive income described above. In the first quarter of
fiscal 2001, we issued and repurchased 3 million shares
(4.5 million after stock split) to be used for issuance under
the stock purchase plan and the special bonus program
for our employees. These shares were reissued to our
employees in Germany in the third quarter. On February
22, 2001 Siemens shareholders approved a stock split (one
additional share for two existing shares) of the common
stock. This stock split was effective on April 30, 2001.
Our shareholders have given us authorization to
repurchase up to 10% of our outstanding shares at any
time until August 22, 2002. We have no immediate plans
to exercise this authorization.

63
Management’s discussion and analysis
Customer financing
The following table presents our customer financing com-
mitments at September 30, 2001 (in billions):
Market demand and industry practices, particularly in
the telecommunications equipment area, require Siemens
increasingly to assist customers in arranging financing
from various third-party sources, including export credit
agencies, in order to be awarded supply contracts. The
Company also provides direct vendor financing and
grants guarantees to banks in support of loans to Siemens
customers. Siemens may enter into a combination of the
above arrangements. Siemens evaluates such financing
requirements on a very selective basis and has forgone
and will continue to forgo new business contracts if the
financing risks are not justifiable.
According to our credit approval process, the Corpo-
rate Executive Committee of the Managing Board must
approve all customer financing projects of the Operating
Groups that exceed €25 million. In certain countries we
use an even lower threshold of €5 million. In reviewing
requests for such financings, which generally carry a sub-
stantially higher risk element than is incurred in the ordi-
nary course of our business, we take into account various
business aspects as well as financial risk factors. The
financial risk factors are analysed under a comprehensive
standard risk assessment model comparable to those used
by international banks. Such models are primarily driven
by the rating of the customer. Absent a rating, we inter-
nally assess the credit-worthiness of the customer and the
feasibility of the particular project, provided the cash flow
of the project will be the primary source for the debt serv-
ice. Independent of the Operating Groups, SFS conducts
this risk assessment in support of the decision-making
role of the Corporate Executive Committee. The Operating
Groups retain overall business responsibility for such
financing arrangements, which impact their ebita asset
base.
Currently approved and contractually committed
financing totals approximately €2.5 billion relating pri-
marily to projects at ICN and ICM. For comparison, cur-
rent and noncurrent accounts and loans receivable totaled
€23.7 billion on September 30, 2001. Of the total of €2.5
billion, €1.7 billion has been utilized either by providing
supplier credits (approximately €1.0 billion) or in the
form of guarantees extended by Siemens to banks in sup-
port of their loans to Siemens’ customers (approximately
€700 million). The largest exposures before taking provi-
sions into account are financings to Telecom Asia Corp.
Public Company Ltd., Thailand (€338 million), which was
rescheduled in 1999, and a financing to Winstar Commu-
nications, Inc., U.S. (€218 million) which is in Chapter 11
proceedings. We have established sufficient provisions
related to the Winstar financing.
Also included in the €2.5 billion total is approximately
€800 million which has been approved for customer
financing but has not yet been utilized. Included in this
amount are commitments to provide financing for two
UMTS wireless network projects along with NEC Corp.,
Japan: Retevisión Móviles S.A., Spain, (Amena) (approxi-
mately €152 million); Hutchison 3G Limited, Great Britain
(approximately €178 million). Also included is a commit-
ment related to Telemar Brazil (approximately €175 mil-
lion).
Additionally, €0.8 billion of customer financing proj-
ects are approved in principle but are still under negotia-
tion, including UMTS financing of approximately €350
million to companies associated with Deutsche Telekom
AG.
At September 30, 2001Total loans and
in billions of € guarantees Loans Guarantees
Approved commitments
Utilized 1.7 1.0 0.7
Not utilized 0.8 0.6 0.2
Commitments under negotiation 0.8
Total 3.3

64
Management’s discussion and analysis
Revenue and income for projects financed directly or
indirectly by Siemens are recognized if the credit quality
as evidenced by the customer’s rating or by the credit
analysis performed by SFS meets certain parameters.
Such parameters are equivalent to a minimum of single B
rating category as awarded by rating agencies or based
upon the ability to sell the financing without recourse to
Siemens in the financial markets. Provisions are also
established considering the specific credit risks of certain
countries. Additionally, provisions are established on an
individual basis taking into account the credit-worthiness
of the customer and the characteristics of the project
being financed. The provision levels are regularly
reviewed. As a result of such review activity, we believe we
have established appropriate provisions for the above
financings.
Stock option plans
At the Annual Shareholders’ Meeting in 2001, sharehold-
ers authorized Siemens to establish the 2001 Siemens
Stock Option Plan. The new plan makes available up to 55
million options representing approximately 6.2% of the
total shares outstanding. Compared to the 1999 Siemens
Stock Option Plan, the number of eligible recipients is sig-
nificantly larger. The options grants are subject to a two-
year vesting period, after which they may be exercised for
up to three years. The exercise price is equal to 120% of
the reference price, which corresponds to the average
opening market price of trading in the stock of Siemens
AG during the five trading days preceding the date of
stock option grant. The exercise price is also the perform-
ance target. The design of the plan allows Siemens the
option to determine whether to settle the options in
shares or in cash. As a result of its design, the new plan
will have no income effect in the case of settlement in
shares due to the fact that the exercise price is also the
performance target.
In fiscal 2001, we made option grants under the exist-
ing 1999 Siemens Stock Option Plan to approximately
1,513 key executives, totaling 3,260,391 shares reflecting
the three-for-two stock split approved by shareholders
effective April 30, 2001, setting the strike price at €86.23
per share and the commencement of the vesting period at
November 24, 2000. The strike price before reflecting the
stock split is €129.35.
Risk management
Within its worldwide activities in the electrical engineer-
ing and electronics industry, Siemens is exposed to a
number of risks that arise in the ordinary course of its
business. We have described our risk management system
and all the risks that we consider material below.
Our risk management policy is to take advantage of
opportunities while taking on only those risks that are
necessarily associated with creating economic value. Risk
management is therefore an integral part of our business
processes and decisions.
The risk management policy is governed by the Man-
aging Board and executed by the Groups’ management in
line with our organizational and accountability structure.
Each operating unit or business entity is accountable for
managing the risks associated with its regional or world-
wide business.
To measure, monitor and manage our exposure to risk,
we use a variety of management and control systems,
including an enterprise-wide strategy and planning
process. The business targets and risk control measures
are monitored during the year through our existing con-
trol systems and processes. In this manner, the Managing
Board and the Supervisory Board are kept informed of
material risks on a timely basis.
Our internal auditors regularly review the adequacy
and efficiency of our risk management and control sys-
tems.
Our business, financial condition or results of opera-
tions could suffer material adverse effects due to any of
the following risks. The risks described below are not the
only ones we face. Additional risks not known to us or that
we now consider immaterial may also impair our busi-
ness operations.
Business risks
The worldwide markets for our products are highly com-
petitive in terms of pricing, product and service quality,
development and introduction time, customer service and
financing terms. Siemens faces downward price pressures
and aggressive competitive pricing, especially in the busi-
nesses of the Information and Communications Groups
(I&C), and is exposed to market downturns or slower

65
Management’s discussion and analysis
growth, particularly in the highly volatile semiconductors
business of Infineon, the mobile communications market
of ICM, and the automotive supplier market of SV. The
current weak economic situation has already influenced
our business perspectives, as shown by the significant
cost-cutting, restructuring, and asset write-down meas-
ures taken in the third and fourth quarters of fiscal 2001.
Future success will therefore depend also on our success
with such programs. From a technological perspective, we
experience rapid and significant changes due to the intro-
duction of new technologies.
To maintain a high level of innovation and competi-
tiveness, we continue to execute divestitures, acquisi-
tions, strategic alliances and joint ventures. Transactions
such as these carry inherent risks associated with the
challenges of integrating people, operations, technologies
and products. To counter these risks, we employ defined
M&A and post-merger processes. We also have to face the
risk that acquired technologies may become obsolete due
to unforeseen business or market developments.
Operational risks
Within many areas of Operations, including the busi-
nesses of PG, PTD, TS, the I&C Groups and I&S, we are
engaged in large and complex infrastructure projects. In
such projects, the risks include unexpected technological
problems, unforeseen developments at project sites, prob-
lems at our partner companies or logistic difficulties. This
may lead to the Company to incur significant cost over-
runs or penalties.
We also have production facilities all over the world
with a high degree of organizational and technological
complexity. Therefore, we face risks of problems within
our value chain processes such as operational failures,
quality problems and potential product safety, labor
safety or environmental risks.
To prevent operational failures, we have established a
comprehensive set of policies and procedures relating to
project and quality management, product safety, labor
safety, and environmental protection. We also continu-
ously develop and refine our production processes and
technologies, as well as our administrative processes. In
addition, we rigorously maintain our facilities and train
our employees.
Supplier risks
We rely on third parties to supply us with parts, compo-
nents and services. Using third parties to manufacture,
assemble and test our products reduces our control over
manufacturing yields, quality assurance, delivery sched-
ules and costs. Also, the unexpected rise of purchasing
prices due to market shortages or currency fluctuations
can affect the performance of certain of our operating
units. We try to counter these risks by monitoring our
supply markets, working closely with our suppliers and
using long-term supplier agreements.
Human resources risks
Competition for highly qualified management and techni-
cal personnel is intense in the industries in which our
business units operate. This is especially relevant in con-
nection with employees with scientific, technical or indus-
try-specific knowledge for developing new technologies
and products.
Therefore, our future success depends in part on our
continued ability to recruit, assimilate and retain quali-
fied management and other technical personnel. To
attract and retain our personnel, we maintain intensive
contact with universities and provide internal qualifica-
tion programs, attractive remuneration systems and new-
hire integration programs.
Credit risks
We are exposed to credit risks because we provide various
forms of direct or indirect financing to our customers, as
described above. This includes both large projects and
smaller orders, such as equipment leasing. Infrastructure
projects often require supplier financing, which involve
credit and country risk. Additionally, vendor financing of
projects such as GSM or UMTS wireless network equip-
ment for customers who lack established credit histories
may cause special credit risks. Aside from specific risks
associated with project financing, we may experience gen-
eral financial risks, including delayed payments from cus-
tomers or difficulties in the collection of receivables, espe-
cially given the deteriorating economic conditions in
several markets, in emerging markets or when customers
are start-up companies. To monitor and administer these
credit risks, we have a defined project financing and
credit assessment process, and we emphasize the impor-
tance of effective receivables management on an enter-
prise-wide basis.

66
Management’s discussion and analysis
Market risks
We define “market risk” as a potential loss due to an
adverse move in market rates. We define “potential loss”
for equity price risk as a decline in fair values due to an
adverse move in market prices. For foreign exchange risk,
a “potential loss” is defined as a decline in future cash
flows due to an adverse move in market rates. For interest
rate risk, we consider “potential loss” to mean, for fixed-
rate instruments, a decline in fair values, and, for vari-
able-rate instruments, a decline in future cash flows. We
use the “sensitivity analysis” method to measure our mar-
ket risk.
Equity Price Risk: We have investments in publicly
traded companies, which are held for purposes other than
trading. The market value of these investments as of Sep-
tember 30, 2001 was €480 million, with our 12.5% interest
in EPCOS AG representing the largest share. This material
decrease from €2.7 billion at September 30, 2000 is due
principally to a substantial decline in market prices as
well as significant sales of marketable securities during
the last fiscal year. An adverse move in equity prices of
20% would reduce the value of these investments by €96
million. The change in the valuation of equity securities
associated with our pension trusts has an impact in deter-
mining net periodic pension cost.
Foreign Currency and Interest Rate Exposure: Our
risk management approach is to pool and analyze interest
rate and currency risk exposures of the business groups.
Exceptions to this approach are made in the case of coun-
try-specific restrictions and similar considerations. The
pooled exposures are recorded on a real-time basis in a
treasury management system maintained by our Trea-
sury and Financing Services (TFS) Division of SFS. This
system allows us to perform an ongoing mark-to-market
valuation of interest rate and currency risks of all pooled
transactions, as well as a measure of credit exposure to
individual financial institutions. We use TFS on an inter-
nal service basis as a centralized link between our Operat-
ing Groups and third-party financial institutions in our
financial risk management activities. TFS enters into
derivative financial instruments with third-party finan-
cial institutions to offset all pooled exposures using a
value-at-risk model. The derivative instruments used are
readily marketable, liquid and priced on a daily basis.
They include: forward exchange contracts, interest-rate
swaps, cross-currency swaps, forward contracts and
options. For all these tasks, TFS has in place appropriate
functional and organizational separation of duties
between transaction initiation, processing and account-
ing.
Our foreign currency transactions arise mainly from
our business groups and to a lesser extent from invest-
ments and financing activities of Siemens as a whole. For-
eign exchange risks are partly offset through our produc-
tion facilities abroad, as well as through procurement and
financing activities conducted in foreign currencies. We
define foreign currency exposure as foreign-currency-
denominated cash inflows and cash outflows from antici-
pated transactions for the next three months, firm com-
mitments, and balance sheet items. The foreign currency
exposure is determined from the point of view of the
respective functional currencies of the Siemens’ entity
where the exposure exists.
Because our foreign currency inflows exceed our out-
flows, a weakening of foreign currencies against the euro
would have a negative financial impact. For example, at
September 30, 2001, we had a net long U.S. dollar expo-
sure; therefore, if the dollar weakened against the euro,
we would have been able to convert it into fewer euros.
At September 30, 2001, a parallel 10% alteration of for-
eign currencies would have resulted in a decline in future
cash flows of €8 million, particularly to the U.S. dollar, the
British pound and the Swiss franc, and €14 million at Sep-
tember 30, 2000.
Our fair-value interest risk results primarily from our
long-term fixed-rate debt obligations. We seek to limit this
risk through the use of derivative instruments which
allow us to hedge changes in fair value by swapping fixed
rates of interest into variable rates of interest. Assuming a
100-basis-point decrease in interest rates, our fair-value
interest risk was €222 million and €103 million at Septem-
ber 30, 2001 and 2000, respectively. The significant
increase over the prior year is due primarily to the
issuance of the €4.0 billion bond program, only a part of
which has been swapped into variable rates of interest.
Our cash-flow interest rate risk on our variable-rate
portfolio was €37 million at September 30, 2001 and €18
million at September 30, 2000, assuming a 100-basis-
point increase in interest rates. Such risk is largely related
to variable interest rates resulting from the aforemen-
tioned hedges of fixed-rate debt obligations.

67
Management’s discussion and analysis
Outlook
We are confident of our capabilities to successfully exe-
cute the various restructuring programs, especially at our
I&C Groups, and therefore look forward to improved earn-
ings from Operations. Before commenting more specifi-
cally on our outlook, however, we want to continue to
monitor our business performance, particularly the trend
in sales and order intake, to better assess the effects of
September 11. While many telecom operators have
announced sharply reduced capital expenditures, directly
affecting business at the I&C Groups, other businesses
such as Power Generation, Medical Solutions and Trans-
portation Systems are expected to continue their positive
development, particularly due to their considerable order
backlog.
Siemens remains committed to its Operation 2003 pro-
gram, aimed at achieving previously communicated
medium-term margin targets. Some Groups should be
able to meet their targets earlier than planned or exceed
them, while for the I&C Groups it might take longer.
Siemens has demonstrated that it can handle difficult
times better than many of its competitors, based on a
broader business portfolio, solid capital structure, and
exceptional strength in innovation as well as technical
expertise. These advantages, combined with a global pres-
ence and successful asset management throughout the
company, are the pillars upon which Siemens continues to
build its business.
This Annual Report contains forward-looking statements
based on beliefs of Siemens’ management. We use the
words “anticipate,” “believe,” “estimate,” “expect,”
“intend,” “should,” “plan” and “project” to identify for-
ward-looking statements. Such statements reflect our
current views with respect to future events and are sub-
ject to risks and uncertainties. Many factors could cause
the actual results to be materially different, including,
among others, changes in general economic and busi-
ness conditions, changes in currency exchange rates and
interest rates, introduction of competing products, lack
of acceptance of new products or services and changes in
business strategy. Actual results may vary materially
from those projected here. Please refer to the discussion
of Siemens’ risk factors in our Form 20-F. Siemens does
not intend or assume any obligation to update these
forward-looking statements. It is our policy to disclose
material information on an open, nonselective basis.

68
Consolidated financial statements
Consolidated Statements of IncomeFor the fiscal years ended September 30, 2001 and September 30, 2000 (in millions of €, per share amounts in €)
(1)ebita is measured as earnings before financing interest, income taxes, amortization ofgoodwill and purchased in-process R&D expenses and certain one-time items. Inter-est income related to receivables from customers, cash allocated to the segments andinterest expense on payables to suppliers are part of ebita. ebita differs from incomebefore income taxes and should not be considered to be the same. Other companiesthat use ebita may calculate it differently, and their figures may not be comparable toours.
(2) The income taxes of Eliminations, reclassifications and Corporate Treasury, Operations,and Financing and Real Estate are based on the consolidated effective corporate taxrate (excluding Infineon) applied to income before income taxes.
The accompanying notes are an integral part of these consolidated financial statements.
Siemens worldwide
Note 2001 2000
Net sales 87,000 77,484
Cost of sales (63,895) (55,949)
Gross profit on sales 23,105 21,535
Research and development expenses (6,782) (5,848)
Marketing, selling and general administrative expenses (16,640) (14,173)
Other operating income (expense), net 4 (1,476) (277)
Income from investments in other companies, net 5 49 299
Income from financial assets and marketable securities, net 6 173 2,732
Interest income (expense) of Operations, net 7 (32) (35)
ebita(1) from Operations /ebit Infineon
Other interest (expense) income, net 7 43 180
Goodwill amortization and purchased in-process R&D expenses of Operations
Gains on sales and dispositions of significant business interests (therein gain on
issuance of subsidiary and associated company stock €617 and €534, respectively) 3 4,238 7,826
Other special items
Income (loss) before income taxes 2,678 12,239
Income taxes(2) 8 (781) (3,017)
Minority interest 191 (362)
Net income (loss) 2,088 8,860
Basic earnings per share 28 2.36 9.97
Diluted earnings per share 28 2.36 9.96

69
Consolidated financial statements
Eliminations,reclassifications and Financing andCorporate Treasury Operations Infineon Real Estate
2001 2000 2001 2000 2001 2000 2001 2000
(3,114) (3,176) 82,427 71,603 5,671 7,283 2,016 1,774
2,899 1,656 (60,192) (51,946) (5,021) (4,111) (1,581) (1,548)
(215) (1,520) 22,235 19,657 650 3,172 435 226
(166) (204) (5,427) (4,619) (1,189) (1,025)
2 31 (15,559) (13,333) (786) (670) (297) (201)
(1,701) (511) (118) (13) 200 2 143 245
(175) (24) 310 36 154 37 10
(140) 1,867 263 832 65 37 (15) (4)
9 (41) (35)
1,329 2,799 (1,024) 1,670
280 323 (304) (220) (1) 74 68 3
665 253 (665) (253)
173 4,065 7,826
1,185 280 (1,185) (280)
92 344 3,240 9,872 (1,025) 1,744 371 279
(30) (79) (1,058) (2,262) 428 (612) (121) (64)
185 (356) 6 (6)
62 265 2,367 7,254 (591) 1,126 250 215

70
Consolidated financial statements
Consolidated Balance SheetsAs of September 30, 2001 and September 30, 2000 (in millions of €)
Siemens worldwide
Note 9/30/2001 9/30/2000
Assets
Current assets
Cash and cash equivalents 7,802 6,862
Marketable securities 9 791 3,317
Accounts receivable, net 10 18,928 19,228
Intracompany receivables
Inventories, net 11 13,406 12,422
Deferred income taxes 8 1,113 1,596
Other current assets 12 8,973 5,666
Total current assets 51,013 49,091
Long-term investments 13 3,314 5,402
Intangible assets, net 14 9,771 6,446
Property, plant and equipment, net 14 17,803 15,720
Deferred income taxes 8 3,684 485
Other assets 15 4,533 4,510
Other intracompany receivables
Total assets 90,118 81,654
The accompanying notes are an integral part of these consolidated financial statements.
Liabilities and shareholders’ equity
Current liabilities
Short-term debt and current maturities of long-term debt 18 2,637 2,604
Accounts payable 10,376 9,458
Intracompany liabilities
Accrued liabilities 16 10,864 9,913
Deferred income taxes 8 754 1,086
Other current liabilities 17 19,893 13,794
Total current liabilities 44,524 36,855
Long-term debt 18 9,973 6,734
Pension plans and similar commitments 19 4,721 2,473
Deferred income taxes 8 111 662
Other accruals and provisions 20 2,957 4,068
Other intracompany liabilities
62,286 50,792
Minority interests 4,020 2,382
Shareholders’ equity 21
Common stock, no par value
Authorized: 1,145,773,579 and 1,078,130,900 shares, respectively
Issued: 888,230,245 and 882,930,900 shares, respectively 2,665 1,505
Additional paid-in capital 4,901 5,547
Retained earnings 19,762 19,280
Accumulated other comprehensive income (3,516) 2,150
Treasury stock, at cost. 1,116 and 23,100 shares, respectively (2)
Total shareholders’ equity 23,812 28,480
Total liabilities and shareholders’ equity 90,118 81,654

71
Consolidated financial statements
Eliminations,reclassifications and Financing andCorporate Treasury Operations Infineon Real Estate
9/30/2001 9/30/2000 9/30/2001 9/30/2000 9/30/2001 9/30/2000 9/30/2001 9/30/2000
6,103 5,105 907 1,211 757 511 35 35
36 34 638 2,768 93 498 24 17
734 431 14,055 13,267 719 1,698 3,420 3,832
(10,706) (14,116) 10,060 13,935 208 127 438 54
(74) (119) 12,485 11,520 882 841 113 180
971 1,352 39 100 103 144
799 642 7,223 4,596 178 60 773 368
(3,108) (8,023) 46,339 48,649 2,876 3,835 4,906 4,630
6 74 2,348 4,622 655 432 305 274
(1) 9,223 6,113 437 222 112 111
2 3 8,547 7,861 5,233 4,034 4,021 3,822
3,071 240 412 166 201 79
(56) 321 1,240 1,327 130 164 3,219 2,698
(152) (297) 149 297 3
(3,309) (7,922) 70,917 69,109 9,743 8,853 12,767 11,614
1,499 808 878 1,572 119 138 141 86
(86) (383) 9,173 8,419 1,050 1,222 239 200
(7,068) (11,759) 1,215 4,182 239 87 5,614 7,490
148 125 10,126 8,886 426 719 164 183
1 631 848 19 75 103 163
(221) 1,607 19,145 11,767 351 213 618 207
(5,727) (9,602) 41,168 35,674 2,204 2,454 6,879 8,329
6,205 3,224 3,121 2,980 249 128 398 402
45 42 4,653 2,419 23 12
43 348 53 178 15 136
(414) (280) 2,653 3,793 319 287 399 268
(3,418) (1,306) 155 439 3,263 867
(3,309) (7,922) 51,793 45,653 2,825 3,047 10,977 10,014
4,002 2,382 18
15,122 21,074 6,900 5,806 1,790 1,600
(3,309) (7,922) 70,917 69,109 9,743 8,853 12,767 11,614
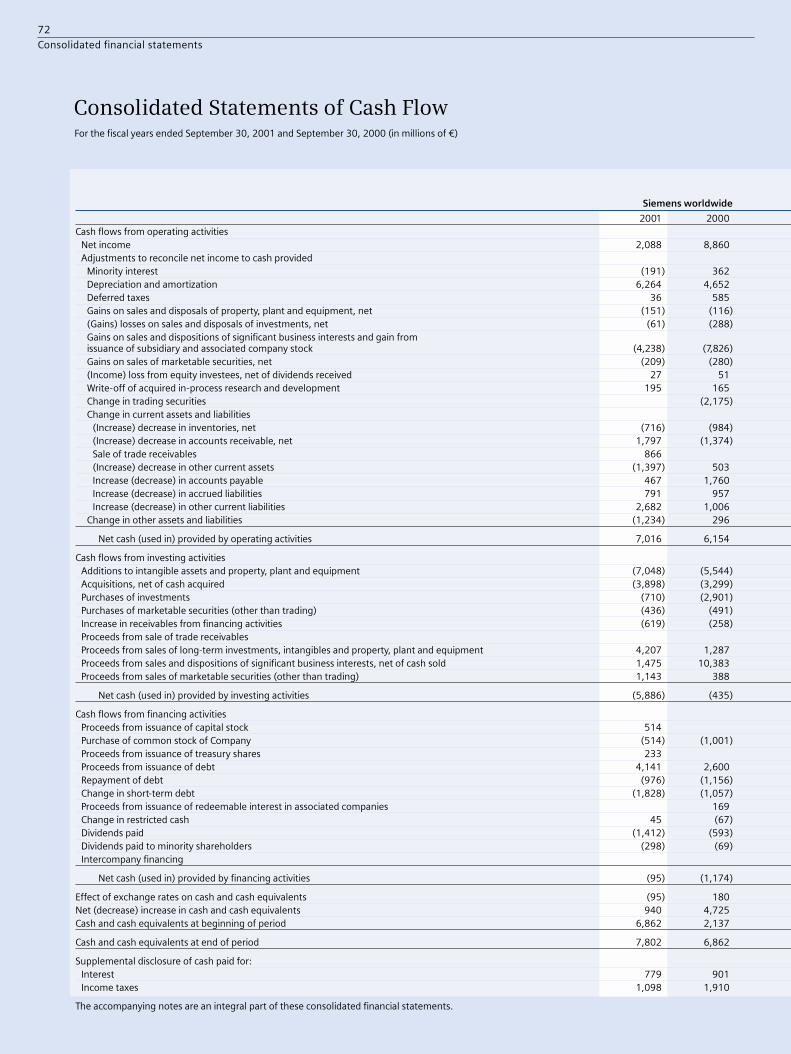
72
Consolidated financial statements
Consolidated Statements of Cash FlowFor the fiscal years ended September 30, 2001 and September 30, 2000 (in millions of €)
Siemens worldwide
2001 2000Cash flows from operating activities
Net income 2,088 8,860Adjustments to reconcile net income to cash provided
Minority interest (191) 362Depreciation and amortization 6,264 4,652Deferred taxes 36 585Gains on sales and disposals of property, plant and equipment, net (151) (116)(Gains) losses on sales and disposals of investments, net (61) (288)Gains on sales and dispositions of significant business interests and gain fromissuance of subsidiary and associated company stock (4,238) (7,826)Gains on sales of marketable securities, net (209) (280)(Income) loss from equity investees, net of dividends received 27 51Write-off of acquired in-process research and development 195 165Change in trading securities (2,175)Change in current assets and liabilities
(Increase) decrease in inventories, net (716) (984)(Increase) decrease in accounts receivable, net 1,797 (1,374)Sale of trade receivables 866(Increase) decrease in other current assets (1,397) 503Increase (decrease) in accounts payable 467 1,760Increase (decrease) in accrued liabilities 791 957Increase (decrease) in other current liabilities 2,682 1,006
Change in other assets and liabilities (1,234) 296
Net cash (used in) provided by operating activities 7,016 6,154
Cash flows from investing activitiesAdditions to intangible assets and property, plant and equipment (7,048) (5,544)Acquisitions, net of cash acquired (3,898) (3,299)Purchases of investments (710) (2,901)Purchases of marketable securities (other than trading) (436) (491)Increase in receivables from financing activities (619) (258)Proceeds from sale of trade receivablesProceeds from sales of long-term investments, intangibles and property, plant and equipment 4,207 1,287Proceeds from sales and dispositions of significant business interests, net of cash sold 1,475 10,383Proceeds from sales of marketable securities (other than trading) 1,143 388
Net cash (used in) provided by investing activities (5,886) (435)
Cash flows from financing activitiesProceeds from issuance of capital stock 514Purchase of common stock of Company (514) (1,001)Proceeds from issuance of treasury shares 233Proceeds from issuance of debt 4,141 2,600Repayment of debt (976) (1,156)Change in short-term debt (1,828) (1,057)Proceeds from issuance of redeemable interest in associated companies 169Change in restricted cash 45 (67)Dividends paid (1,412) (593)Dividends paid to minority shareholders (298) (69)Intercompany financing
Net cash (used in) provided by financing activities (95) (1,174)
Effect of exchange rates on cash and cash equivalents (95) 180Net (decrease) increase in cash and cash equivalents 940 4,725Cash and cash equivalents at beginning of period 6,862 2,137
Cash and cash equivalents at end of period 7,802 6,862
Supplemental disclosure of cash paid for: Interest 779 901Income taxes 1,098 1,910
The accompanying notes are an integral part of these consolidated financial statements.

73
Consolidated financial statements
Eliminations,reclassifications and Financing andCorporate Treasury Operations Infineon Real Estate
2001 2000 2001 2000 2001 2000 2001 2000
62 265 2,367 7,254 (591) 1,126 250 215
(186) 356 (5) 64,684 3,428 1,122 834 458 390
13 16 463 464 (494) 91 54 14(40) (3) (2) (111) (111)207 (288) (235) (33)
(162) (4,065) (7,826) (11)(203) (260) (1) (20) (5)
1 56 152 (25) (101) (5)126 139 69 26
(2,175)
(746) (900) (36) (108) 66 24(38) (1,475) 1,021 550 755 (683) 59 234866
(229) (100) (848) 398 (139) (13) (181) 218(43) (59) 428 1,364 58 469 24 (14)185 5 974 441 (322) 467 (46) 44
(100) (125) 2,694 1,095 27 103 61 (67)(289) (163) (1,047) 366 39 (115) 63 208
266 (1,636) 5,885 4,555 211 2,080 654 1,155
(4,044) (3,375) (2,364) (1,614) (640) (555)(3,898) (3,299)
(419) (2,449) (214) (302) (77) (150)(11) (329) (39) (82) (452) (14)714 1,762 (1,333) (2,020)
(866) 8664 4 3,511 885 373 41 319 357
1,475 821 9,5622 660 385 474 9 1
1,316 2,589 (4,519) 1,670 (1,813) (2,327) (870) (2,367)
(1,495) (821) 514 1,495 821(514) (1,001)233
4,141 100 2,500(921) (320) 2 (733) (20) (78) (37) (25)281 (139) (2,354) (1,005) 114 73 131 14
16945 (67)
407 (1,412) (593) (407)(119) (179) (69)
(2,865) 4,717 2,122 (5,728) 619 (199) 124 1,210
(571) 3,537 (1,588) (6,629) 1,846 719 218 1,199
(13) 36 (82) 129 2 9 (2) 6998 4,526 (304) (275) 246 481 (7)
5,105 579 1,211 1,486 511 30 35 42
6,103 5,105 907 1,211 757 511 35 35

74
Consolidated financial statements
Consolidated Statements of Changes in Shareholders’ EquityFor the fiscal years ended September 30, 2001 and September 30, 2000 (in millions of €)
AdditionalCapital Paid-in RetainedStock Capital Earnings
Balance at October 1, 1999 1,521 5,605 11,887
Net income 8,860
Change in currency translation adjustment
Change in unrealized gains and losses
Total comprehensive income 8,860
Dividends paid (593)
Purchase of capital stock
Re-issuance of treasury stock
Other changes 51
Purchase and retirement of capital stock (16) (58) (925)
Balance at September 30, 2000 1,505 5,547 19,280
Net income 2,088
Change in currency translation adjustment
Change in unrealized gains and losses
Total comprehensive income 2,088
Dividends paid (1,412)
Issuance of capital stock 10 504
Purchase of capital stock
Re-issuance of treasury stock
Recapitalization and stock split 1,150 (1,150)
Other changes (194)
Balance at September 30, 2001 2,665 4,901 19,762
The accompanying notes are an integral part of these consolidated financial statements.

75
Consolidated financial statements
Accumulated Other Comprehensive Income (Loss)
Cumulative Available- Minimum Treasury Translation for-sale Derivative Pension SharesAdjustment Securities Instruments Liability at Cost Total
(126) 251 19,138
8,860
1,059 1,059
1,002 (30) (6) 966
1,059 1,002 (30) (6) 10,885
(593)
(224) (224)
222 222
51
(999)
933 1,253 (30) (6) (2) 28,480
2,088
(532) (532)
(1,199) 53 (3,988) (5,134)
(532) (1,199) 53 (3,988) (3,578)
(1,412)
514
(514) (514)
516 516
(194)
401 54 23 (3,994) 23,812

76
Consolidated financial statements
Segment informationAs of and for the fiscal years ended September 30, 2001 and September 30, 2000 (in millions of €)
New orders(unaudited) External sales Intersegment sales
2001 2000 2001 2000 2001 2000
Operations
Information and Communication Networks (ICN) 12,639 11,648 12,189 11,129 693 194
Information and Communication Mobile (ICM) 11,866 10,420 11,151 8,790 148 120
Siemens Business Services (SBS) 6,303 5,857 4,261 4,390 1,773 1,492
Automation and Drives (A&D) 9,065 8,163 7,843 6,889 1,104 1,054
Industrial Solutions and Services (I&S) 4,881 4,401 3,398 3,173 1,165 1,053
Siemens Dematic (SD) 2,281 1,913 2,381 1,589 139 197
Siemens Building Technologies (SBT) 5,549 5,066 5,094 4,504 424 428
Power Generation (PG) 12,219 9,409 8,487 7,726 76 31
Power Transmission and Distribution (PTD) 3,887 3,566 3,818 2,969 235 182
Transportation Systems (TS) 5,647 3,722 4,000 3,706 21 4
Siemens VDO Automotive (SV) 5,702 3,839 5,694 3,828 8 5
Medical Solutions (Med) 8,444 5,253 7,199 4,901 20 23
Osram 4,522 4,327 4,200 4,038 322 288
Corporate, eliminations (6,890) (4,759) 1,945 3,229 (5,361) (4,329)
Total Operations 86,115 72,825 81,660 70,861 767 742
Reconciliation to financial statements
Other interest expense
Goodwill amortization and purchased in-process R&D expenses
Gains on sales and dispositions of significant business interests
Other special items
Operations income before income taxes / total assets /total amortization, depreciation and write-downs
Infineon Technologies (Infineon) 4,390 8,837 4,744 6,200 927 1,083
Reconciliation to financial statements
Infineon income (loss) before income taxes / total assets
Financing and Real Estate
Siemens Financial Services (SFS) 481 354 373 242 108 112
Siemens Real Estate (SRE) 1,542 1,410 223 181 1,319 1,239
Eliminations (7)
Total Financing and Real Estate 2,023 1,764 596 423 1,420 1,351
Eliminations, reclassifications and Corporate Treasury (3,114) (3,176)
Siemens worldwide 92,528 83,426 87,000 77,484
(1) Intangible assets, property, plant and equipment, acquisitions, and investments.(2) Includes amortization of intangible assets, depreciation of property, plant and equipment,
and write-downs of investments.(3) Represents only goodwill amortization.
The accompanying notes are an integral part of these consolidated financial statements.

77
Consolidated financial statements
Amortization, depre-ciation and write-
Capital downs(2) (excl. good-Total sales ebita ebita assets spending(1) will amortization)
2001 2000 2001 2000 9/30/2001 9/30/2000 2001 2000 2001 2000
12,882 11,323 (861) 686 3,298 4,454 2,291 604 435 355
11,299 8,910 (307) 718 2,623 2,876 543 618 400 254
6,034 5,882 (259) 70 518 1,396 484 559 342 268
8,947 7,943 981 865 2,653 2,632 429 766 242 218
4,563 4,226 97 111 493 375 115 77 53 54
2,520 1,786 (59) 196 984 560 78 56 63 51
5,518 4,932 132 297 2,276 2,226 326 217 163 144
8,563 7,757 634 66 (1,003) 178 351 262 211 182
4,053 3,151 96 45 1,004 784 215 141 78 72
4,021 3,710 186 75 (916) (337) 164 74 55 42
5,702 3,833 (261) 89 3,691 937 447 345 339 162
7,219 4,924 808 463 4,099 3,308 1,034 2,294 203 94
4,522 4,326 462 388 2,505 2,533 416 465 283 260
(3,416) (1,100) (320) (1,270) (2,555) 2,143 1,468 2,645 265 649
82,427 71,603 1,329 2,799 19,670 24,065 8,361 9,123 3,132 2,805
51,247 45,044
(304) (220)
(665) (253) 539(3) 253(3)
4,065 7,826
(1,185) (280) 1,013 370
3,240 9,872 70,917 69,109 4,684 3,428
Amortization, Net capital depreciation
ebit employed and write-downs(2)
5,671 7,283 (1,024) 1,670 6,471 5,709 2,578 1,916 1,122 834
(1) 74 3,272 3,144
(1,025) 1,744 9,743 8,853
Income beforeincome taxes Total assets
481 354 158 78 9,363 8,532 514 531 257 202
1,542 1,420 213 201 3,469 3,590 203 174 201 188
(7) (65) (508)
2,016 1,774 371 279 12,767 11,614 717 705 458 390
(3,114) (3,176) 92 344 (3,309) (7,922)
87,000 77,484 2,678 12,239 90,118 81,654 11,656 11,744 6,264 4,652
78
Notes to consolidated financial statements (in millions of €, except where otherwise stated and per share amounts)
1 Basis of presentation
The accompanying consolidated financial statements
present the operations of Siemens AG and its subsidiaries,
(the Company or Siemens). The consolidated financial
statements have been prepared in accordance with United
States Generally Accepted Accounting Principles (U.S.
GAAP). Siemens has prepared and reported its consolidat-
ed financial statements in millions of euros (“€”), except
where otherwise stated and per share amounts.
Per share information – On February 22, 2001, the
Company’s shareholders approved a stock split (one
additional share for two existing shares) of the common
stock. This stock split became effective on April 30, 2001.
Share and per share data for all periods presented reflect
the share split and are based on the new number of
shares.
Financial statement presentation
The financial data of the Company is presented in the
following components:
■ Siemens worldwide – Represents the consolidated
financial statements of the Company.
■ Operations – Operations are defined as Siemens’
Operating segments including corporate headquarters
and excluding the activities of Infineon Technologies
AG (Infineon), the Financing and Real Estate seg-
ments, and Corporate Treasury.
■ Infineon – Infineon is a consolidated subsidiary whose
shares are listed on the stock exchanges in Frankfurt
and New York.
■ Financing and Real Estate – Siemens’ Financing and
Real Estate segments are responsible for the Compa-
ny’s international leasing, finance, credit and real
estate management activities.
■ Eliminations, reclassifications and Corporate Trea-
sury – This component combines the consolidation of
transactions among Operations, Infineon and Financ-
ing and Real Estate with certain reclassifications. This
component also includes the Company’s Corporate
Treasury activities.
The Company’s presentation of Operations, Infineon,
Financing and Real Estate and Corporate Treasury reflects
the management of these components as distinctly differ-
ent business activities, with different goals and require-
ments. Management believes that this presentation pro-
vides a clearer understanding of the components of the
Company’s financial position, results of operations and
cash flows. The accounting and valuation principles
applied to these components are generally the same as
those used for Siemens worldwide. The Company has allo-
cated shareholders’ equity to the Financing and Real
Estate business based on a management approach orient-
ed towards the inherent risk evident in the underlying
assets. Infineon’s shareholders’ equity represents
amounts presented in its separate financial statements.
The remaining amount of total shareholders’ equity is
shown under Operations. The financial data presented for
the Operations and Financing and Real Estate compo-
nents are not intended to purport the financial position,
results of operations and cash flows as if separate entities
under U.S. GAAP.
The information disclosed in these footnotes relates to
Siemens worldwide unless otherwise stated.
Notes

79
Notes to consolidated financial statements (in millions of €, except where otherwise stated and per share amounts)
2 Summary of significant accounting policies
Basis of consolidation – The consolidated financial state-
ments include the accounts of Siemens AG and all sub-
sidiaries which are directly or indirectly controlled.
Results of associated companies – companies in which
Siemens, directly or indirectly, has 20% to 50% of the vot-
ing rights and the ability to exercise significant influence
over operating and financial policies – are recorded in the
consolidated financial statements using the equity
method of accounting.
The principal subsidiaries and associated companies
are listed on pages 114–117. A complete list of Siemens’
holdings is being filed with the Commercial Registries of
the Berlin-Charlottenburg and Munich District Courts.
Foreign currency translation – The assets and liabil-
ities of foreign subsidiaries, where the functional currency
is other than the euro, are translated using period-end
exchange rates, while the statements of operations are
translated using average exchange rates during the peri-
od. Differences arising from such translations are includ-
ed as a separate component of shareholders’ equity.
The exchange rates of the significant currencies of
non-euro countries used in the preparation of the consoli-
dated financial statements were as follows:
Currency iso code Year-end exchange rate (€) Annual average rate (€)
September 30 Fiscal year2001 2000 2001 2000
100 Swiss francs chf 67.70 65.53 66.61 63.35
1 British pound gbp 1.60 1.67 1.61 1.63
1 U.S. dollar usd 1.09 1.14 1.11 1.05
100 Japanese yen jpy 0.92 1.05 0.92 0.99
Revenue recognition – Revenue is recognized for
product sales when title passes, the risks and rewards of
ownership have been transferred to the customer, the fee
is fixed or determinable, and collection of the related
receivable is probable. If product sales are subject to cus-
tomer acceptance, revenues are not recognized until cus-
tomer acceptance occurs. For product sales which require
the Company to install the product at the customer loca-
tion, and for which installation is essential to the func-
tionality of the product being installed, revenue is recog-
nized when the equipment has been delivered to and
installed at the customer location. Revenues from services
are recognized as services are rendered. In the case of
long-term service contracts, revenues are generally recog-
nized on a straight-line basis over the term of the con-
tract. Revenues under fixed-price long-term service con-
tracts are generally recognized under the percentage-of-
completion method, based on the percentage of costs to
date compared to the total estimated contract costs. Rev-
enues from long-term construction projects are generally
recognized under the percentage-of-completion method
based on contractual milestones or performance. Operat-
ing lease income for the rental of equipment is recognized
on a straight-line basis over the lease term. Interest
income from capital leases is recognized using the inter-
est method.
Product-related expenses and contract loss pro-
visions – Provisions for estimated costs related to product
warranties are made at the time the related sale is record-
ed. Research and development costs are expensed as
incurred. Contract loss provisions are established in the
period when the current estimate of total contract costs
exceeds contract revenue.
Earnings per share – Basic earnings per share is
computed by dividing net income by the weighted average
shares outstanding during the year. Diluted earnings per
share is calculated by adjusting outstanding shares
assuming conversion of all potentially dilutive stock
options. Share and per share data for all periods presented
reflect the share split and are based on the new number of
shares.
Cash and cash equivalents – The Company considers
all highly liquid investments purchased with an original
maturity of three months or less to be cash equivalents.

80
Notes to consolidated financial statements (in millions of €, except where otherwise stated and per share amounts)
Marketable securities and investments – The Com-
pany’s marketable securities are accounted for at fair
value if readily determinable. Securities are classified
as either available-for-sale or trading securities. Manage-
ment determines the appropriate classification of its
investments in marketable securities at the time of pur-
chase and reevaluates such determination at each balance
sheet date. Marketable securities classified as available-
for-sale are reported at fair value, with unrealized gains
and losses included in accumulated other comprehensive
income, net of applicable deferred taxes. Realized gains
and losses are accounted for using the specific identifica-
tion method.
The Company’s trading securities consist of mar-
ketable securities and money market instruments. Gains
and losses, both realized and unrealized, as well as other
income earned from these assets such as dividends and
interest are included in “income from financial assets and
marketable securities, net.” Investments for which there
is no readily determinable market value are recorded at
cost.
Available-for-sale marketable securities and invest-
ments which incur a decline in value below cost that is
judged to be other than temporary are considered
impaired. The Company considers all available evidence
such as market conditions and prices, investee specific
factors and the duration and extent to which fair value is
less than cost in evaluating potential impairment of its
marketable securities and investments. Impairments are
recognized in earnings in the period in which the decline
in value is judged to be other than temporary and a new
cost basis in the marketable security or investment is
established.
Securitization transactions – When the Company
sells trade receivables in securitizations, it retains a
deferred payment account and servicing obligations, all
of which are retained interests in the securitized receiv-
ables. Servicing responsibilities for these transactions
remain with the Company, for which it receives an ade-
quate servicing fee. The gain or loss on the sale of receiv-
ables is determined based upon the difference between
the total proceeds received on the sale and the allocated
carrying amount of the sold receivables. The allocated
carrying amount is determined based upon the relative
fair value of the receivables sold and the retained interest.
Fair values are based upon quoted market prices whenev-
er available. As such information is generally not avail-
able for retained interests, estimates of fair values are
based on the present value of future expected cash flows
determined using management’s best estimate of key
assumptions including credit risk and discount rates com-
mensurate with the risks involved. In subsequent periods
following securitization, retained interests in securitized
receivables are carried at fair value. Changes in fair value
of retained interests are recognized in earnings.
Inventories – Inventory is valued at the lower of
acquisition or production cost or market, cost being gen-
erally determined on the basis of an average or first-in,
first-out method (FIFO). Production costs comprise direct
material and labor and applicable manufacturing over-
heads, including depreciation charges.
Intangible assets – Intangible assets consist of good-
will and patents, software, licenses and similar rights.
Intangible assets other than goodwill are amortized on
a straight-line basis over the shorter of their contractual
rights or estimated useful lives. Intangible assets other
than goodwill acquired after June 30, 2001 which are
determined to have indefinite useful lives are not amor-
tized. Except for goodwill acquired in a business combina-
tion for which the acquisition date is after June 30, 2001,
goodwill is amortized over its estimated period of benefit
on a straight-line basis not exceeding 40 years. The Com-
pany evaluates the recoverability of goodwill when events
or circumstances warrant revised estimates of useful lives
or indicate that an impairment exists, based on projected
future cash flows discounted at a risk-adjusted rate. If the
carrying amount of the net assets, including goodwill,
exceeds the sum of the discounted cash flows, an impair-
ment is recorded. Such impairment charges are recorded
in the amount of the excess of the carrying value of the
net tangible and identifiable intangible assets and good-
will over the discounted cash flows of the business evalu-

81
Notes to consolidated financial statements (in millions of €, except where otherwise stated and per share amounts)
ated. In the determination of projected future cash flows,
the Company considers current and projected levels of
profitability, business and technological trends and eco-
nomic and other developments.
Property, plant and equipment – Property, plant and
equipment is valued at acquisition or manufacturing cost
less accumulated depreciation. Depreciation expense is
recognized either using the declining balance method
until the straight-line method yields larger expenses or
the straight-line method. Costs of construction of certain
long-term assets include capitalized interest, which is
amortized over the estimated useful life of the related
asset. The following useful lives are assumed:
Factory and office buildings 20 to 50 years
Other buildings 5 to 10 years
Technical machinery & equipment 5 to 10 years
Furniture & office equipment generally 5 years
Equipment leased to others generally 3 to 5 years
Impairment of long-lived assets – The Company
reviews long-lived assets for impairment whenever events
or changes in circumstances indicate that the carrying
amount of an asset may not be recoverable. Recoverability
of assets to be held and used is measured by the compari-
son of the carrying amount of the asset to the undiscount-
ed future net cash flows expected to be generated by the
asset. If such assets are considered to be impaired, the
impairment to be recognized is measured by the amount
by which the carrying amount of the assets exceeds the
fair value of the assets. Estimated fair value is generally
based on either appraised value or measured by discount-
ed estimated future cash flows.
Derivative instruments and hedging activities –
Effective October 1, 1999, the Company adopted Statement
of Financial Accounting Standards (SFAS) 133, “Account-
ing for Derivative Instruments and Hedging Activities”, as
amended, which requires all derivative instruments, such
as interest rate swap contracts and foreign currency
exchange contracts, be recognized in the financial state-
ments and measured at fair value regardless of the pur-
pose or intent for holding them. Changes in the fair value
of derivative financial instruments are recognized peri-
odically either in income or shareholders’ equity (as a
component of other comprehensive income), depending
on whether the derivative is being used to hedge changes
in fair value or cash flows. SFAS 133 also requires that cer-
tain derivative instruments embedded in host contracts
be accounted for separately as derivatives. In accordance
with the provisions of SFAS 133, the Company has chosen
January 1, 1999, as its transition date for embedded deriv-
atives. Accordingly, only those derivatives embedded in
host contracts issued, acquired or substantially modified
on or after January 1, 1999, are accounted for separately as
derivatives in the financial statements of the Company.
The Company has historically utilized various deriva-
tive instruments to reduce the risks related to fluctuations
in foreign currencies. The strategies used to reduce for-
eign currency risks did not satisfy the requirements of
hedge accounting existing before the adoption of SFAS
133, and accordingly all related derivative instruments
were accounted for at fair value prior to October 1, 1999
with changes in fair value impacting earnings. The Com-
pany employed hedge accounting for risks related to the
effects of changes in interest rates on a portion of its long-
term, fixed-rate debt via interest rate swaps prior to adop-
tion of SFAS 133. The effect of adoption of SFAS 133 result-
ed in a charge to net income of €1 (representing the net
effect of recording embedded derivatives as of October 1,
1999) and a net increase to other comprehensive income
of €5.
See footnote 23, “Derivative instruments and hedging
activities,” for a description of the Company’s risk man-
agement strategies and the effect these strategies have on
the Consolidated Financial Statements.
82
Notes to consolidated financial statements (in millions of €, except where otherwise stated and per share amounts)
Taxes – The Company applies SFAS 109, “Accounting
for Income Taxes”. Under the asset and liability method of
SFAS 109, deferred tax assets and liabilities are recog-
nized for the future tax consequences attributable to dif-
ferences between the financial statement carrying
amounts of existing assets and liabilities and their
respective tax bases. The effect on deferred tax assets and
liabilities of a change in tax laws is recognized in the
results of operations in the period the new laws are enact-
ed. A valuation allowance is recorded to reduce the carry-
ing amounts of deferred tax assets unless it is more likely
than not that such assets will be realized.
Environmental clean-up costs – The Company
charges to expense environmental clean-up costs related
to existing conditions resulting from past or current oper-
ations from which no current or future benefit is dis-
cernible. Liabilities for these expenditures are recorded
on a site-by-site basis at the time when they are probable
and can be reasonably estimated. Expenditures which
extend the life of the related property or mitigate or pre-
vent future environmental contamination are capitalized.
Environmental liabilities are discounted when the associ-
ated payments are deemed to be fixed or reliably deter-
minable.
Issuance of shares by subsidiaries or associated
companies – Gains or losses arising from the issuances
of shares by subsidiaries or associated companies, due
to changes in the Company’s proportionate share of the
value of the issuer’s equity, are recorded as income or
expense pursuant to U.S. Securities and Exchange Com-
mission Staff Accounting Bulletin Topic 5H, “Accounting
for Sales of Stock by a Subsidiary”.
Use of estimates – The preparation of financial state-
ments requires management to make estimates and
assumptions that affect the reported amounts of assets
and liabilities and disclosure of contingent amounts at
the date of the financial statements and reported amounts
of revenues and expenses during the reporting period.
Actual results could differ from those estimates.
Reclassification – The presentation of certain prior
year information has been reclassified to conform to the
current year presentation.
Recent accounting pronouncements – In June 2001,
the Financial Accounting Standards Board (FASB) issued
SFAS 143, “Accounting for Asset Retirement Obligations”,
which addresses financial accounting and reporting for
obligations associated with the retirement of tangible
long-lived assets and the associated asset retirement
costs. The standard applies to legal obligations associated
with the retirement of long-lived assets that result from
the acquisition, construction, development or normal use
of the asset. SFAS 143 requires that the fair value of a lia-
bility for an asset retirement obligation be recognized in
the period in which it is incurred if a reasonable estimate
of fair value can be made. The fair value of the liability is
added to the carrying amount of the associated asset and
this additional carrying amount is depreciated over the
life of the asset. The liability is accreted at the end of each
period through charges to operating expense. If the obli-
gation is settled for other than the carrying amount of the
liability, the Company will recognize a gain or loss on set-
tlement. SFAS 143 is required to be adopted for the fiscal
year beginning October 1, 2002. The Company expects
that the adoption of SFAS 143 will have no material impact
on its financial position.
In July 2001, the FASB issued SFAS 141, “Business Com-
binations,” and SFAS 142, “Goodwill and Other Intangible
Assets”. SFAS 141 requires that the purchase method of
accounting be used for all business combinations initiat-
ed after June 30, 2001 as well as all purchase method busi-
ness combinations completed after June 30, 2001. SFAS
142 will require that goodwill and intangible assets with
indefinite useful lives no longer be amortized, but instead
tested for impairment at least annually in accordance with
the provisions of SFAS 142. SFAS 142 will also require that
intangible assets with definite useful lives be amortized
over their respective estimated useful lives to their esti-
mated residual values.
At the date of adoption, a goodwill impairment assess-
ment must be performed and any impairment loss at the
date of adoption will be recognized as a cumulative effect
of a change in accounting principles in the Company’s
statement of income.

83
Notes to consolidated financial statements (in millions of €, except where otherwise stated and per share amounts)
The Company is required to adopt the provisions of
SFAS 141 immediately and will adopt SFAS 142 effective
October 1, 2001. Consequently, any goodwill and any
intangible asset determined to have an indefinite useful
life that is acquired in a purchase business combination
completed after June 30, 2001 will not be amortized.
Goodwill and intangible assets acquired in business com-
binations completed before July 1, 2001 will continue to be
amortized prior to the adoption of SFAS 142.
As of September 30, 2001, Siemens has unamortized
goodwill in the amount of €6,963 and unamortized intan-
gible assets in the amount of €2,808, all of which will be
subject to the provisions of SFASs 141 and 142. Amortiza-
tion expense related to goodwill, excluding impairment
charges, was €562 and €253 for the years ended Septem-
ber 30, 2001 and 2000, respectively. Because of the exten-
sive effort needed to comply with adopting SFASs 141 and
142, it is not practicable to reasonably estimate the impact
of adopting these Statements on the Company’s financial
statements at the date of this report.
3 Acquisitions and dispositions
Acquisitions
During the years ended September 30, 2001 and 2000, the
Company completed a number of acquisitions. These
acquisitions have been accounted for under the purchase
method and have been included in the Company’s consol-
idated financial statements since the date of acquisitions.
In February 2000, Automation and Drives (A&D)
acquired Moore Products, Inc. for a purchase price of
approximately €180. This acquisition resulted in the capi-
talization of approximately €47 of goodwill, which is
being amortized on a straight-line basis over 20 years.
In March 2000, A&D acquired Milltronics Ltd. for €242,
which resulted in the capitalization of approximately €177
of goodwill, which is being amortized on a straight-line
basis over 20 years (see footnote 14).
In April 2000, Siemens Business Services (SBS)
acquired Entex Information Services, Inc., an information
services provider in the U.S. The purchase price was
approximately €294. In connection with this acquisition,
approximately €248 was capitalized as goodwill and is
being amortized on a straight-line basis over 20 years.
In May 2000, Information and Communications
Mobile (ICM) acquired the mobile telecommunications
development operations of Robert Bosch GmbH (Bosch)
for a purchase price of approximately €172. In connection
with this acquisition, approximately €55 of IPR&D was
charged to expense as research and development cost,
and approximately €7 was capitalized as goodwill and is
being amortized on a straight-line basis over 4 years.
In June 2000, Siemens Financial Services (SFS)
acquired Schroder Leasing plc of the U.K. for a purchase
price of approximately €142. In connection with this
acquisition, approximately €95 was capitalized as good-
will and is being amortized on a straight-line basis over
20 years.
In July 2000, Medical Solutions (Med) completed its
acquisition of Shared Medical Systems Corp. (SMS) of the
U.S. for a purchase price of approximately €2.1 billion. In
connection with this acquisition, €84 of IPR&Dwas charged
to expense as research and development cost, and approx-
imately €1.6 billion was capitalized as goodwill and is
being amortized on a straight-line basis over 20 years.
In November 2000, Med acquired Acuson Corporation.
The aggregate purchase price was approximately €780. In
connection with this acquisition, approximately €345 was
capitalized as goodwill and is being amortized on a
straight-line basis over 20 years. Approximately €47 of
IPR&D was charged to expense as research and develop-
ment cost.
In January 2001, the merger of the nuclear power busi-
nesses of Siemens and Framatome S.A. was completed.
The Company holds a 34% minority interest in the compa-
ny, called Framatome ANP. This investment is accounted
for using the equity method.

84
Notes to consolidated financial statements (in millions of €, except where otherwise stated and per share amounts)
In April 2001, Siemens’ Information and Communica-
tion Networks Group (ICN) completed the acquisition of
Efficient Networks, Inc. The purchase price was approxi-
mately €1.6 billion, plus the assumption of €457 of debt.
In connection with this acquisition, approximately €1.2
billion has been recorded as goodwill and is being amor-
tized on a straight-line basis over 5 years. IPR&D of
approximately €17 was charged to expense as research
and development cost (see footnote 14).
In April 2001, Siemens completed the acquisition of a
controlling interest of 50% plus two shares in Atecs Man-
nesmann AG (Atecs), an automotive and automation tech-
nology company. In accordance with the purchase agree-
ment, prior to closing, Siemens paid €3.1 billion to
Mannesmann AG. As of the date of closing, Siemens made
a capital contribution to Atecs. The purchase agreement
also provides Siemens the option to acquire Mannesmann
AG’s remaining interest in Atecs, either at the option of
Mannesmann during the period from the date of closing
through September 30, 2002, or at the option of Siemens
during the period from April 1, 2002 through December
31, 2003. The purchase price for the remaining interest in
Atecs under both options is between €3.7 and €3.8 billion.
Siemens plans to exercise its option. The Company has
accounted for the Atecs transaction as the purchase of a
100% interest using the purchase method of accounting.
The purchase price for 100% of Atecs of €9.6 billion,
including the assumption of €2.8 billion of financial debt
and pension liabilities, was allocated to the assets acquired
and liabilities assumed based on estimated fair values.
In connection with the acquisition, €62 of IPR&D was
charged to expense. The excess of the purchase price over
the fair value of the net identifiable assets acquired and
IPR&D of €1.9 billion has been recorded as goodwill and is
being amortized on a straight-line basis over 40 years.
The purchase price allocation has not been finalized due
to the pending sale of various Atecs businesses discussed
below. Accordingly, in fiscal 2002, the goodwill associated
with this acquisition may change, although management
does not presently anticipate such changes to be material.
In connection with the Atecs transaction, Siemens
entered into a put option contract giving Siemens the right
to sell Rexroth AG , a wholly owned subsidiary of Atecs, to
Bosch for an adjusted equity value €2.7 billion. The put
option is exercisable from January 2002 through Decem-
ber 31, 2002. Siemens plans to exercise this put option.
Siemens intends to dispose of certain of the business-
es of Atecs within one year of its acquisition of Atecs. In
accordance with Emerging Issue Task Force Issue 87-11,
“Allocation of Purchase Price to Assets to Be Sold,” the
accompanying consolidated financial statements include
as “assets held-for-sale”, within other current assets, €4.3
billion representing management’s estimate of the net
proceeds from the sales of the businesses, less incremen-
tal financing costs during the holding period. The
increase in the recorded value of these businesses from
the date of acquisition through September 30, 2001 of €42
(representing allocable interest costs) has been excluded
from the Consolidated Statements of Income. Any differ-
ence between the actual and estimated proceeds from the
sale of these Atecs businesses held-for-sale will result in
an adjustment to goodwill, unless the adjustment results
from a post-acquisition event. Net income generated since
the date of acquisition by these businesses classified as
assets held-for-sale of €13 has been excluded from net
income of the Company.
The following unaudited pro forma information for the
years ended September 30, 2001 and 2000 assumes that
Acuson Corporation, Efficient Networks, Inc. and Atecs
had been acquired as of the beginning of fiscal 2001 and
2000: Net sales would have been €91,275 (2000: €84,057),
net income would have been €1,825 (2000: €8,440), basic
earnings per share would have been €2.06 (2000: €9.49)
and diluted earnings per share would have been €2.06
(2000: €9.49).
The Company made certain other acquisitions during
the years ended September 30, 2001 and 2000, accounted
for by the purchase method of accounting, which did not
have a significant effect on the consolidated financial
statements.
Dispositions
In October 1999, in connection with an initial public offer-
ing (IPO) of Epcos AG (Epcos), the Company sold a portion
of its ownership interest in Epcos for net proceeds of €767,
which resulted in a pretax gain of €638. The Company
continues to hold a 12.5% plus one share ownership inter-
est in Epcos.

85
Notes to consolidated financial statements (in millions of €, except where otherwise stated and per share amounts)
Savan Communications, Ltd. As a result of this transac-
tion, the Company realized a pretax gain of €20 (after tax
gain of €14). The acquisition of Savan Communications,
Ltd. was accounted for using the purchase method of
accounting with a purchase price of €131 resulting in
goodwill of €18 and a charge for acquired in-process
research and development of €26.
In December 2000, Infineon sold its Image & Video
business unit. After giving effect to the minority interest
ownership of Infineon, the gain increased the Company’s
pretax income by €143.
In April 2001, Siemens irrevocably transferred
93,825,225 Infineon shares into its domestic pension
trust. As a result of the transfer, the Company realized a
pretax gain of €3,459 (after tax gain of €2,519).
In July 2001, Infineon completed a follow-on offering
of 60 million shares for which the Company realized a
pretax gain of €484.
In August 2001, Infineon issued an additional 6.4 mil-
lion shares of new stock in connection with the acquisi-
tion of Catamaran Communications Inc. As a result of this
transaction, the Company realized a pretax gain of €83.
The acquisition of Catamaran Communications Inc. was
accounted for using the purchase method of accounting
with a purchase price of €252 resulting in goodwill of €179
and a charge for acquired IPR&D of €57.
As a result of Siemens’ irrevocable transfer of Infineon
shares into the domestic pension trust, the follow-on
offering of 60 million shares by Infineon and additional
dilution resulting from acquisitions made by Infineon
using its shares, Siemens’ ownership interest in Infineon
decreased to approximately 50.4% as of September 30,
2001.
4 Other operating income and expenses
Year endedSeptember 30,
2001 2000
Gains on sales of property, plant and equipment 172 190
Other 645 415
Other operating income 817 605
Amortization and impairment of goodwill (1,489) (448)
Losses on sales and disposals of property, plant and equipment (21) (74)
Other (783) (360)
Other operating expenses (2,293) (882)
In November 1999, the Company’s Electromechanical
Components business was sold to Tyco International, Ltd.
for net proceeds of €874. The resulting pretax gain was
€525.
In December 1999, the Company sold Nixdorf Retail
and Banking Systems to a consortium of investors for net
proceeds of €698 with a resulting pretax gain of €538.
In December 1999, the Company disposed of Vacuum-
schmelze GmbH through a sale to Morgan Crucible Com-
pany, plc. This disposition resulted in net proceeds of
€180 with a resulting pretax gain of €93.
During 2000, the Company sold substantially all of its
fiber-optic cable and optical fiber business to Corning Inc.
for net proceeds of €1,107. The pretax gain from this trans-
action was €584.
In March 2000, the Company sold its Swiss-based tele-
vision cable business to NTL, Inc. for net proceeds of €839.
The pretax gain on this disposition was €774.
In March 2000, the Company successfully completed
the IPO of Infineon. Prior to the offering, Siemens held
100 percent of the outstanding shares of Infineon. A total
of 173.5 million shares of Infineon stock were sold in the
IPO and a further 7.6 million shares were sold through a
concurrent private placement, so that 181.1 million shares
in total were sold. The average offering price was €35 per
share. The Company sold 156.8 million shares for net pro-
ceeds of €5,284 resulting in a tax-free gain of €4,135. In
addition, Infineon sold 24.3 million shares of newly
issued stock for net proceeds of €820. A pretax gain of
€461 (after tax gain of €330) arose as a result of the
issuance of shares directly by Infineon.
In April 2000, Infineon issued an additional 1.2 million
shares of new stock in connection with the acquisition of
For fiscal year 2001, “Other operating income”
includes the effect of the positive resolution of certain
assets disposal contingencies as well as certain asset dis-
posals, including the pretax gain of €202 from the dispo-
sition of Infineon’s sales of its Image & Video business
unit. Included in “Amortization and impairment of good-
will” in fiscal 2001, are impairments relating to Efficient
Networks Inc. and Milltronics Ltd. (see footnote 14). “Oth-
er” in “Other operating expenses” include amortization of
other intangibles.

86
Notes to consolidated financial statements (in millions of €, except where otherwise stated and per share amounts)
5 Income from investments in other companies, net
Year endedSeptember 30,
2001 2000
Income from investments 166 135
Share in earnings from equity investees 213 149
Gains on sales of investments 138 314
Losses on sales of investments (279) (26)
Write-downs on investments (231) (52)
Other 42 (221)
49 299
Included in “Losses on sales of investments” for the
year ended September 30, 2001 is a €209 loss on the sale
of an investment in a domestic equity and debt security
fund. “Write-downs on investments” for the year ended
September 30, 2001 relate to the write-down of certain
equity investments. Included in “Other” for the year end-
ed September 30, 2000 is a €175 provision related to a loan
associated with the investment in a joint venture.
6 Income from financial assets and marketable securities, net
Year endedSeptember 30,
2001 2000
Gains on sales of available-for-sale securities 426 280
Income from trading securities – 2,512
Other financial losses, net (253) (60)
173 2,732
7 Interest income, net
Year endedSeptember 30,
2001 2000
Interest income (expense) of Operations, net (32) (35)
Other interest (expense) income, net 43 180
Total net interest income 11 145
Thereof: Interest and similar income 964 1,039
Thereof: Interest and similar expense (953) (894)
In fiscal 2001, included in “Other financial losses, net,”
is a write-down of certain marketable securities totaling
€217 where the decline in value was determined to be oth-
er than temporary.
“Interest income (expense) of Operations, net”
includes interest income and expense related to receiv-
ables from customers and payables to suppliers, interest
on advances from customers and advanced financing of
customer contracts. “Other interest (expense) income,
net” includes all other interest amounts primarily consist-
ing of interest relating to debt and related hedging activi-
ties as well as interest income on corporate assets.

87
Notes to consolidated financial statements (in millions of €, except where otherwise stated and per share amounts)
Year endedSeptember 30,
2001 2000
Germany 1,446 5,112
Foreign 1,232 7,127
2,678 12,239
8 Income taxes
Income before income taxes and minority interests for the
years ended September 30, 2001 and 2000 is attributable
to the following geographic regions:
For the years ended September 30, 2001 and 2000, Ger-
man corporation tax law applies a split rate imputation
credit system to the income taxation of corporations and
their shareholders. In accordance with the tax law in
effect for fiscal 2001 and 2000, retained corporation
income is initially subject to a federal corporation tax rate
of 40%, plus a solidarity surcharge of 5.5% for each year
on federal corporate taxes payable. Including the impact
of the surcharge, the federal corporate tax amounted to
42.2%, plus trade tax, net of federal tax benefit, of 9.8% for
the years ended September 30, 2001 and 2000.
Upon distribution of retained earnings to sharehold-
ers, the corporation income tax rate on such distributed
earnings is adjusted to 30%, plus solidarity surcharge of
5.5% for a total of 31.65%. This reduction is effected by
means of a refund for taxes previously paid, and is
referred to as the dividend tax credit.
Year endedSeptember 30,
2001 2000
‘Expected’ income tax expense at the undistributed rate 1,393 6,364
Increase (decrease) in income taxes resulting from:
Nondeductible losses and expenses 144 108
Goodwill and acquired in-process research and development 853 225
Tax-free income (43) (27)
Dividend distribution credit – (208)
Gains from sales of business interests (859) (2,972)
Effect of change in German tax rates:
Effect of change on deferred taxes of date of enactment (222) –
Effect of change on deferred taxes arising during the year 367 –
Foreign tax rate differential (768) (440)
Tax effect of equity method investments (111) (77)
Other 27 44
Actual income tax expense 781 3,017
Income tax expense (benefit) for the years ended Sep-
tember 30, 2001 and 2000 consisted of the following:
In October 2000, the German government enacted new
tax legislation which, among other changes, will reduce
the Company’s statutory tax rate in Germany from 40% on
retained earnings and 30% on distributed earnings to a
uniform 25% effective for the Company’s year ending
September 30, 2002. The impact of the various revisions
in the new tax legislation for the Company is an increase
of income tax expense of €145.
For the years ended September 30, 2001 and 2000,
income tax expense differed from the amounts computed
by applying the German federal corporation income tax
rate of 42.2% plus the after-federal tax benefit rate for
trade taxes on income of 9.8% for a combined statutory
rate of 52%, as follows:
Year endedSeptember 30,
2001 2000
Current:
German corporation and trade taxes 228 1,371
Foreign income taxes 517 1,061
745 2,432
Deferred:
Germany (131) 656
Foreign 167 (71)
36 585
Net income tax expense 781 3,017

88
Notes to consolidated financial statements (in millions of €, except where otherwise stated and per share amounts)
September 30,2001 2000
Intangibles 339 90
Property, plant and equipment 434 442
Inventories 605 507
Receivables 413 392
Retirement plans 74 550
Other accrued liabilities 1,356 1,860
Other liabilities 3,092 2,449
Deferred income 223 251
Tax loss and credit carryforwards 1,767 521
Other 272 172
Total deferred tax assets, before valuation allowances 8,575 7,234
Valuation allowances (551) (193)
Deferred tax assets 8,024 7,041
Intangibles 373 258
Property, plant and equipment 732 487
Inventories 750 1,705
Receivables 1,106 1,283
Other accrued liabilities 123 127
Other liabilities 211 209
Investments 118 2,074
Other 679 565
Total deferred tax liabilities 4,092 6,708
Deferred tax assets, net 3,932 333
Deferred income tax assets and liabilities as of Sep-
tember 30, 2001 and 2000 are summarized as follows:
wards, €3,436 have unlimited carryforward periods and
€898 expiring over the period to 2020.
In assessing the realizability of deferred tax assets,
management considers whether it is more likely than not
that some portion of the deferred tax asset will not be
realized. The ultimate realization of deferred tax assets is
dependent upon the generation of future taxable profits
during the periods in which those temporary differences
and tax loss carryforwards become deductible. Manage-
ment considers the scheduled reversal of deferred tax lia-
bilities and projected future taxable income in making
this assessment. Based upon the level of historical taxable
income and projections for future taxable income over the
periods which the deferred tax assets are deductible,
management believes it is more likely than not the Com-
pany will realize the benefits of these deductible differ-
ences, after giving effect to related valuation allowances.
Provision has not been made for income taxes or for-
eign withholding taxes on €989 of cumulative earnings of
foreign subsidiaries because such earnings will either not
be subject to any such taxes or are intended to be indefi-
nitely reinvested in those operations. It is not practicable
to estimate the amount of the unrecognized deferred tax
liabilities for these undistributed foreign earnings.
Including the items charged or credited directly to
related components of shareholders’ equity, the provision
(benefit) for income taxes consists of the following:
Year endedSeptember 30,
2001 2000
Provision for income taxes 781 3,017
Shareholders’ equity for other comprehensive income (3,326) 806
(2,545) 3,823
As of September 30, 2001, the Company had approxi-
mately €4,334 of tax loss carryforwards, of which €770
related to Infineon. Of the total €4,334 tax loss carryfor-
9 Marketable securities
As of September 30, 2001 and 2000, the Company’s port-
folio of marketable securities consisted solely of securities
classified as available-for-sale. During the year ended
September 30, 2000, the Company contributed approxi-
mately €10 billion of trading securities into a domestic
pension trust (see footnote 19).
The following tables summarizes the Company’s
investment in available-for-sale securities:
September 30, 2001Unrealized
Cost Fair Value Gain Loss
Equity securities 244 480 291 55
Debt securities 126 124 – 2
Fund securities 190 187 4 7
560 791 295 64

89
Notes to consolidated financial statements (in millions of €, except where otherwise stated and per share amounts)
The estimated fair values of investments in debt secu-
rities by contractual maturity were as follows:
September 30, 2000Unrealized
Cost Fair Value Gain Loss
Equity securities 371 2,691 2,338 18
Debt securities 482 483 1 –
Fund securities 119 143 25 1
972 3,317 2,364 19
Actual maturities may differ from contractual maturity
because borrowers have the right to call or prepay certain
obligations.
Proceeds from sale of available-for-sale securities for
the years ended September 30, 2001 and 2000 were €1,143
and €388, respectively. Gross realized gains on sales of
available-for-sale securities for the years ended Septem-
ber 30, 2001 and 2000 were €426 and €280, respectively.
September 30, 2001
Due within one year 21
Due after one year through five years 103
Related companies are those in which Siemens has an
ownership interest of less than 20% and no significant
influence over their operating and financial policies.
The valuation allowance for accounts receivable devel-
oped as follows:
10 Accounts receivable, net
September 30,2001 2000
Trade receivables from the sale of goods and services, net 16,115 17,468
Receivables from sales and financeleases, net 1,220 945
Receivables from associated andrelated companies, net 1,593 815
18,928 19,228
Year endedSeptember 30,
2001 2000
Valuation allowance as of beginning of fiscal year 1,610 1,710
Amount charged to expense in current period 505 219
Write-offs charged against the allowance (383) (417)
Recoveries of amounts previously written-off 45 18
Foreign exchange translation adjustment 8 80
Valuation allowance as of September 30 1,785 1,610
Receivables from sales and finance leases
September 30, 2001
2002 1,532
2003 1,093
2004 752
2005 433
2006 209
Thereafter 134
Minimum future lease payments 4,153
Less: Unearned income (577)
Less: Allowance for doubtful accounts (146)
Plus: Unguaranteed residual values 99
Net investment in lease receivables 3,529
Less: Long-term portion 2,309
Receivables from sales and finance leases, current 1,220
Investment in direct financing and sales-type leases
primarily relates to equipment for information and com-
munication products, data processing and medical engi-
neering equipment. Investments in direct financing leas-
es also include leases of industrial and consumer
products of third party manufacturers. Actual cash flows
will vary from contractual maturities due to future sales
of finance receivables, prepayments and write-offs.

90
Notes to consolidated financial statements (in millions of €, except where otherwise stated and per share amounts)
Securitization of trade receivables
In June 2001, the Company began selling short-term trade
receivables through a securitization program on a revolv-
ing basis. During fiscal 2001, the Company sold short-
term receivables totaling €1,848 in securitization transac-
tions. The Company has retained interests in all trade
receivables sold, which are subordinated to the interests
of the investors. In addition, the Company has provided a
guarantee of up to an additional 17% of such trade receiv-
ables. Except for such subordinated retained interests and
guarantees, the investors and securitization trusts have
no recourse to the Company’s other assets and liabilities
for failure of debtors to pay when due.
The value of retained interests is subject to credit, pre-
payment, and interest rate risks of the trade receivables
sold. The weighted average key assumptions used in
measuring the retained interests at the time of securitiza-
tion resulting from securitizations completed during the
year were as follows: average days outstanding – 61, dis-
count rate – 4.6% per annum and credit risk – 0.6% per
annum.
For the year ended September 30, 2001, the Company
recognized pretax losses of €13 on the securitizations of
trade receivables and received cash from new securitiza-
tions totaling approximately €1,673 from securitization
trusts. The Company also received cash flows of €95 from
retained interests.
As of September 30, 2001, the Company’s retained
interests in trade receivables sold had a fair value of €65.
The key economic assumptions used in measuring these
retained interests were as follows: average days outstand-
ing – 64, discount rate – 4.0% per annum and credit risk –
0.7% per annum.
The sensitivity of the fair value of these retained inter-
ests as of September 30, 2001, to an immediate 10% and
20% adverse change in each of the assumptions above was
less than €(0.2). These sensitivities are hypothetical and
should be used with caution. The effect of a variation in a
particular assumption on the fair value of the retained
interests is calculated without changing any other
assumption; in reality, changes in one assumption may
result in changes in another, which might magnify or
counteract the sensitivities.
Outstanding Delinquencies Net credit losses balance > 60 days during the year
Total short-term trade receivables 18,769 2,061 412
Less: receivables sold (see discussion below) (815) (73) –
Receivables held in portfolio 17,954 1,988 412
During fiscal 2001, the Company wrote-down invento-
ry of €386 principally within the Information and Com-
munication business area. Such write-downs are included
in cost of sales.
11 Inventories, net
September 30,2001 2000
Raw materials and supplies 2,387 2,336
Work in process 3,564 3,108
Costs and earnings in excess of billings on uncompleted contracts 6,263 5,771
Finished goods and products held for resale 4,004 3,655
Advances to suppliers 609 1,010
16,827 15,880
Advance payments received (3,421) (3,458)
13,406 12,422
The following table presents quantitative information
about delinquencies and net credit losses for total short-
term trade receivables, excluding allowances, and the
securitized portion of such receivables as of and for the
year ended September 30, 2001:

91
Notes to consolidated financial statements (in millions of €, except where otherwise stated and per share amounts)
12 Other current assets
September 30,2001 2000
Taxes receivable 1,277 953
Loans receivable 761 401
Other 6,935 4,312
8,973 5,666
13 Long-term investments
September 30,2001 2000
Investment in associated companies 2,354 4,318
Miscellaneous investments 960 1,084
3,314 5,402
Included in “Other” for fiscal 2001 are €4.3 billion
assets held-for-sale in connection with Siemens’ intention
to dispose certain of the businesses of Atecs within one
year of its acquisition of Atecs. Included in “Other” for fis-
cal 2000 was an advance deposit of €2.1 billion to Mannes-
mann AG in connection with the purchase of Atecs.
Investments in associated companies represent non-
controlling interests in entities of 20% to 50% accounted
for using the equity method of accounting. As of Septem-
ber 30, 2000, such investments include the Company’s
investment in a domestic equity and debt security fund,
which was sold in fiscal 2001.
Miscellaneous investments include interests in other
companies for which there is no readily determinable
market value and which are recorded at the lower of cost
or net realizable value.
14 Intangible assets and property, plant and equipment, net
Accu- Depre-Accu- mulated ciation/mulated Net depre- Net Amorti-
Trans- Re- depre- book ciation/ book zationlation classi- Retire- ciation/ Value amorti- value duringadjust- Addi- fica- ments amorti- as of zation as of fiscal
10/1/00 ment tions tions at cost 9/30/01 zation 9/30/01 10/1/00 10/1/00 year
Goodwill 5,521 (294) 4,169 – 173 9,223 2,260 6,963 784 4,737 1,489
Patents, software,licenses and similarrights 2,484 (94) 2,385 – 397 4,378 1,570 2,808 775 1,709 660
Intangible assets 8,005 (388) 6,554 – 570 13,601 3,830 9,771 1,559 6,446 2,149
Land and buildings 10,089 (147) 1,405 129 891 10,585 4,769 5,816 4,614 5,475 360
Technical machineryand equipment 11,941 (291) 2,838 750 1,031 14,207 8,613 5,594 7,510 4,431 1,400
Furniture and officeequipment 11,145 (279) 3,115 378 1,611 12,748 9,020 3,728 8,079 3,066 1,825
Equipment leased toothers 2,165 (78) 493 (114) 303 2,163 1,099 1,064 1,100 1,065 299
Advances to suppliersand construction inprogress 1,683 (57) 1,475 (1,143) 357 1,601 – 1,601 – 1,683 –
Property, plant andequipment 37,023 (852) 9,326 – 4,193 41,304 23,501 17,803 21,303 15,720 3,884

92
Notes to consolidated financial statements (in millions of €, except where otherwise stated and per share amounts)
The Company has capitalized interest of approximately
€27 and €4 during the years ended September 30, 2001
and 2000, respectively.
During the fourth quarter of fiscal 2001, the Company
recorded impairments of goodwill for businesses acquired
by ICN and A&D totaling €927. At ICN, the Company deter-
mined that due to the rapid and significant deterioration
in the market for customer-premises equipment for high-
speed digital subscriber lines (xDSL) for broadband
access in the U.S., the future cash flows from Efficient will
be lower than anticipated. Also, at A&D, as a result of oper-
ational issues relating primarily to the acquired business
of Milltronics, the Company determined that the future
cash flows from these businesses will be lower than previ-
ously anticipated.
Additions to “Patents, software, licenses and similar
rights” during fiscal 2001 consist primarily of identifiable
intangible assets acquired in connection with the acquisi-
tions of Atecs, Acuson and Efficient Networks.
During the year ended September 30, 2000, the Com-
pany recorded a charge of €124 for the impairment of
goodwill associated with the acquisition of Argon Net-
works, Inc. This impairment represented the remaining
unamortized value of the Argon Networks, Inc. goodwill.
The impairment charge resulted from a review of the
development of Argon’s key product, the core router. Due
to significant delays in its development, the introduction
of more advanced next generation technology by competi-
tors and, to a lesser extent, the loss of key management
and development personnel, the Company determined
that there would be no future cash flows generated from
the Argon Networks intellectual property as acquired.
15 Other assets
September 30,2001 2000
Long-term portion of receivablesfrom sales and finance leases 2,309 2,056
Prepaid pension and other postretirement benefit assets 179 411
Long-term loans receivable 587 151
Other 1,458 1,892
4,533 4,510
16 Accrued liabilities
September 30,2001 2000
Employee related costs 2,876 2,747
Income and other taxes 1,827 2,141
Warranties 1,555 1,260
Accrued losses on uncompleted contracts 1,188 1,380
Other 3,418 2,385
10,864 9,913
“Employee related costs” primarily include accruals for
vacation pay, bonuses, accrued overtime and service anni-
versary awards and the current portion of accruals for
pension plans and similar commitments. Employee relat-
ed costs in 2000 include a €600 charge for a special one-
time employee bonus program related to the Company’s
exceptional results in fiscal year 2000 (see footnote 25).
During the fourth quarter of 2001, in response to slow-
ing economic conditions globally, especially in the tech-
nology sector, certain of Siemens’ information and com-
munications units undertook plans to reduce their work-
forces. The Company is seeking to achieve the workforce
reduction through voluntary programs that provide the
affected employees with appropriate separation payments.

93
Notes to consolidated financial statements (in millions of €, except where otherwise stated and per share amounts)
Employees have been notified that in case of insufficient
voluntary terminations, employees will be terminated
involuntarily in order to achieve the required workforce
reduction.
For fiscal 2001, the charges recorded in connection
with these plans were €662 of which €80 have been paid.
The remaining unpaid amount of €582 is recorded within
accrued liabilities in “Employee related costs” and within
other current liabilities in “Other”. The Company expects
the workforce reduction programs to be completed within
a period of approximately 12 months.
17 Other current liabilities
September 30,2001 2000
Billings in excess of costs and estimated earnings on uncompleted contracts and related advances 7,320 5,008
Payroll and social security taxes 2,431 2,321
Sales and other taxes 624 1,025
Bonus obligations 1,137 1,317
Liabilities to associated and related companies 997 826
Deferred income 938 755
Accrued interest 175 145
Other liabilities 6,271 2,397
19,893 13,794
Included in “Other liabilities” as of September 30,
2001, is the deferred purchase price of €3,616 relating to
the acquisition of Atecs (see footnote 3).
18 Debt
September 30,2001 2000
Short-term
Notes and bonds 882 766
Loans from banks 1,078 1,121
Other financial indebtedness 640 662
Obligations under capital leases 37 55
Short-term debt and current maturities of long-term debt 2,637 2,604
Long-term
Notes and bonds (maturing 2002 – 2011) 9,142 5,852
Loans from banks (maturing 2002 – 2008) 328 323
Other financial indebtedness (maturing 2002 – 2031) 274 339
Obligations under capital leases 229 220
Long-term debt 9,973 6,734
12,610 9,338
As of September 30, 2001, weighted average interest
rates for loans from banks, other financial indebtedness
and obligations under capital leases were 5.0% (2000:
6.1%), 3.8% (2000: 6.1%) and 6.5% (2000: 6.9%), respec-
tively. As of September 30, 2001, debt in the amount €79 is
secured, €3 of which, primarily outside Germany, is
secured by mortgages. In some countries, the Company
has pledged securities and executed promissory notes to
secure borrowings in conformity with local practice.
The Company has agreements with financial institu-
tions under which it may issue up to €1.5 billion and
US$1.6 billion (€1.8 billion) of commercial paper. As of
September 30, 2001 and 2000, outstanding commercial
paper totaled €214 (interest rates from 2.45% to 4.16%),
and €233 (interest rates from 6.4% to 6.5%), respectively.
The Company also has agreements with financial insti-
tutions under which it may issue up to €3.5 billion in
medium-term notes. As of September 30, 2001 and 2000,
approximately €1.8 billion and €2.0 billion, respectively,
was outstanding under this program.
The Company maintains global credit facilities of €1.4
billion and US$2 billion (€2.2 billion). As of September 30,
2001 and 2000, the full amounts of these lines of credit
remain unused. Commitment fees for each of the years
ended September 30, 2001 and 2000 totaled approximate-

94
Notes to consolidated financial statements (in millions of €, except where otherwise stated and per share amounts)
ly €2. Under the terms of the agreements, credit may be
used for general business purposes. Borrowings under
these lines of credit would bear interest of .16% above
LIBOR (London Inter Bank Offer Rate) for €1 billion and
.28% above LIBOR for €0.4 billion on the credit facility
denominated in euro, and .125% above LIBOR on the cred-
it facility denominated in U.S. dollar.
As of September 30, 2001, the aggregate amounts of
indebtedness maturing during the next five years and
thereafter are as follows:
Details of the Company’s medium-term notes and
bonds are as follows:
Fiscal year
2002 2,600
2003 462
2004 201
2005 2,637
2006 1,988
Thereafter 4,456
12,344
Fiscal year
2002 38
2003 52
2004 47
2005 45
2006 41
Thereafter 110
Minimum lease payment obligation 333
Less: unamortized interest expense (67)
Obligations under capital leases 266
Less: current portion (37)
229
As of September 30, 2001, the minimum lease pay-
ments under capital leases for the next five years and
thereafter are as follows:
September 30, 2001 September 30, 2000Currency Currency(notional amount) €* (notional amount) €*
0.10% 1999/99 2000/00 chf libor Linked notes eur 50 50
10.25% 1998/2000 dem reverse convertibles dem 190 98
1986/2001 U.S.$ zero coupon bonds usd 200 214
2% 1994/2001 Swiss franc bonds chf 100 66
4.5% 1998/2001 U.S.$ notes usd 300 338
3.25% 1997/2002 Swiss franc notes chf 350 238 chf 350 225
5.75% 1998/2002 U.S.$ notes usd 200 223 usd 200 225
7.75% 1992/2002 Swiss franc bonds chf 28 20 chf 28 20
8% 1992/2002 U.S.$ bonds usd 573 639 usd 580 654
2.75% 1993/2003 Swiss franc bonds chf 100 68 chf 100 66
7.5% 1998/2003 Greek drachma € notes grd 5,000 17 grd 5,000 17
3% 1994/2004 Swiss franc bonds chf 178 121 chf 178 117
1.0% 2000/2005 € exchangeable notes eur 2,500 2,529 eur 2,500 2,503
5.0% 2001/2006 € bonds eur 1,900 1,941
2.5% 2001/2007 Swiss franc bonds chf 250 163
5.5% 1997/2007 € bonds eur 991 1,041 eur 991 973
6% 1998/2008 U.S.$ notes usd 970 1,127 usd 975 1,052
5.75% 2001/2011 € bonds eur 1,900 1,897
10,024 6,618* Includes adjustments for hedge accounting.

95
Notes to consolidated financial statements (in millions of €, except where otherwise stated and per share amounts)
In June 2001, the Company issued bonds with a face
value of €4 billion. Net proceeds from the issuance were
€3,988. The bonds were issued in two tranches: €2 billion
5.00 per cent bonds, which mature on July 4, 2006, and €2
billion 5.75 per cent bonds, which mature on July 4, 2011.
Interest on both tranches is payable on an annual basis on
July 4, beginning 2002. The bonds are redeemable prior to
maturity under limited circumstances at the option of the
Company, at a redemption price equal to their principal
amount, together with accrued interest thereon. During
2001, the Company acquired €100 notional amount of
each tranche.
In August 2000, the Company issued €2,500 of 1%
exchangeable notes due in 2005. These notes are
exchangeable at the option of the noteholder on or after
August 10, 2001 into 1,000 ordinary registered shares with
no par value in Infineon (the “Shares”) at an initial
exchange price for each share of €100 subject to certain
provisions. The Company is entitled, upon exercise of the
exchange right by a noteholder, to pay a cash amount in
lieu of delivery of Shares. Unless previously exchanged,
the notes will be redeemed by the Company on August 10,
2005 at 105.204 per cent of their principal amount of
€2,500. The Company may, at any time on or after
August 12, 2003, redeem all or any part of the notes at
their amortized principle amount subject to certain
conditions.
19 Pension plans and similar commitments
Pension benefit plans – The Company provides pension
benefits to virtually all of its employees in Germany. Indi-
vidual benefits are generally based on eligible compensa-
tion levels or ranking within the Company hierarchy and
years of service. During March 2000, the Company estab-
lished a pension trust to provide for future pension bene-
fit payments relating to certain defined benefit pension
plans in Germany and contributed approximately €10 bil-
lion of securities into the pension trust, resulting in a
reduction of accrued pension liabilities. During April
2001, the Company contributed 93.8 million Infineon
shares with a fair value of €4,376 into the domestic pen-
sion trust. The transfer was intended, in part, to bring the
current net asset value of the pension fund's assets back
into balance with Siemens’ expanded domestic pension
obligations following the closing of the Atecs acquisition.
As in Germany, the Company’s foreign subsidiaries
offer primarily defined benefit pension plans. Retirement
benefits may vary depending on the legal, fiscal and eco-
nomic requirements in each country. About half of the
obligations outside Germany are for employees and
retirees in the U.S. and Canada. In these countries, the
Company sponsors trusteed contributory and noncontrib-
utory defined benefit pension plans whose plan assets are
held in trusts. The benefits for these plans are based pri-
marily on years of service and employees’ compensation.
The assets of the pension plan trusts in the U.S. and Cana-
da primarily consist of U.S. and international corporate
equities, government securities and fixed income invest-
ments.
Other postretirement benefit plans – In Germany,
employees who entered into the Company’s employment
on or before September 30, 1983, are entitled to transition
payments for the first six months after retirement equal
to the difference between their final compensation and
the retirement benefits payable under the corporate pen-
sion plan (transition payment obligations upon retire-
ment in Germany). Certain foreign companies, primarily
in the U.S., provide postretirement health care and life
insurance benefits to employees. The health care plans
are contributory, with participants’ contributions adjusted
annually at the Company’s discretion. The basic life insur-
ance plans are noncontributory. The accounting for the
health care plans anticipates future cost sharing changes
to the written plans that are consistent with the Compa-
ny’s intent that retirees share a fixed percentage of the
overall costs of benefits each year. The plans provide
either defined medical, dental and life insurance benefits
or a defined Company contribution toward the cost of
such benefits.
Liabilities for the Company’s principal pension benefit
plans and other postretirement benefit plans are com-
prised of the following components:
September 30,2001 2000
Pension benefits 3,048 842
Other postretirement benefits 1,366 1,347
Other 307 284
Total accrual for pension plans and similar commitments 4,721 2,473

96
Notes to consolidated financial statements (in millions of €, except where otherwise stated and per share amounts)
A reconciliation of the funded status to the amounts
recognized in the consolidated balance sheets is as follows:
As of September 30, 2001, the projected benefit obliga-
tion, accumulated benefit obligation and fair value of plan
assets for pension plans with an accumulated benefit obli-
gation in excess of the fair value of plan assets were €13.1
billion, €12.4 billion and €9.7 billion, respectively.
Assumed discount rates and rates of increase in remu-
neration and pension entitlements used in calculating the
projected benefit obligation together with long-term rates
of return on plan assets vary according to the economic
conditions of the country in which the retirement plans
are situated. The weighted-average assumptions used in
calculating the actuarial values were as follows:
September 30,2001 2000
Funded status (3,783) (145)
Unrecognized net losses (gains) 7,354 (283)
Unrecognized prior service cost 113 28
Unrecognized net transition asset (7) (11)
Net amount recognized 3,677 (411)
Amounts recognized in the consolidatedbalance sheets consist of:
Prepaid benefit asset 179 407
Accrued benefit liability (3,048) (842)
Intangible asset 17 14
Accumulated other comprehensive income 6,529 10
Net amount recognized 3,677 (411)
September 30,2001 2000
Discount rate 6.2% 6.7%
Expected return on plan assets 8.8% 8.9%
Rate of compensation increase 3.3% 3.9%
Rate of pension progression 1.7% 1.5%
The components of the net periodic benefit cost for the
years ended September 30, 2001 and 2000 were as follows:
September 30,2001 2000
Service cost 464 455
Interest cost 1,091 991
Expected return on plan assets (1,609) (872)
Amortization of:
Unrecognized prior service cost 8 4
Unrecognized net gains (1) (9)
Unrecognized net transition obligation(asset) (4) (4)
Gain due to settlements and curtailments – (1)
Net periodic benefit cost (51) 564
Information regarding the Company’s principal pen-
sion benefit plans is presented in the following tables:
September 30,2001 2000
Change in projected benefit obligation:
Projected benefit obligation at beginning of year 15,930 15,069
Foreign currency exchange rate changes (244) 572
Service cost 464 455
Interest cost 1,091 991
Settlements and curtailments – (13)
Plan participants’ contributions 27 25
Amendments and other 665 261
Actuarial losses (gains) 703 (592)
Acquisitions 703 115
Divestments – (212)
Benefits paid (795) (741)
Projected benefit obligation at end of year 18,544 15,930
Change in plan assets:
Fair value of plan assets at beginning of year 15,785 4,634
Foreign currency exchange rate changes (210) 574
Actual return on plan assets (5,278) 479
Acquisitions 551 260
Employer contributions 4,655 10,299
Plan participants’ contributions 32 25
Benefits paid (774) (486)
Fair value of plan assets at end of year 14,761 15,785

97
Notes to consolidated financial statements (in millions of €, except where otherwise stated and per share amounts)
September 30,2001 2000
Change in projected benefit obligation:
Projected benefit obligation at beginning of year 1,210 1,078
Foreign currency exchange rate changes (25) 96
Service cost 47 44
Interest cost 79 74
Plan participants’ contributions 1 1
Amendments – 14
Actuarial gains (86) (9)
Divestments (18) (50)
Benefits paid (38) (38)
Projected benefit obligation at end of year 1,170 1,210
Change in plan assets:
Fair value of plan assets at beginning of year 32 7
Foreign currency exchange rate changes – 1
Actual return on plan assets (6) –
Employer contributions 26 41
Plan participants’ contributions 1 1
Benefits paid (25) (18)
Fair value of plan assets at end of year 28 32
Information regarding the Company’s principal other
postretirement benefit plans is presented in the following
tables:
A reconciliation of the funded status to the amounts
recognized in the consolidated balance sheets is as follows:
September 30,2001 2000
Funded status (1,142) (1,178)
Unrecognized net gains (228) (169)
Unrecognized prior service cost 3 2
Unrecognized net transition obligation 1 2
Net amount recognized (1,366) (1,343)
Amounts recognized in the consolidated balance sheets consist of:
Prepaid benefit asset – 4
Accrued benefit liability (1,366) (1,347)
Net amount recognized (1,366) (1,343)
Assumed discount rates and rates of increase in remu-
neration and pension entitlements used in calculating the
projected benefit obligations together with long-term
rates of return on plan assets vary according to the eco-
nomic conditions of the country in which the retirement
plans are situated. The weighted-average assumptions
used in calculating the actuarial values were as follows:
September 30,2001 2000
Discount rate 6.7% 7.1%
Expected return on plan assets 9.0% 8.8%
Medical trend rates (initial/ultimate/year):
Medicare ineligible pre 65 10.0%/5.0%/2007 8.5%/5.4%/2021
Medicare eligible post 65 10.0%/5.0%/2007 6.9%/5.4%/2021
Fixed dollar benefit 5.8% 6.0%
Dental trend rates (initial/ultimate/year) 6.0%/5.0%/2021 6.0%/5.0%/2021

98
Notes to consolidated financial statements (in millions of €, except where otherwise stated and per share amounts)
The health-care trend rate assumptions have a signifi-
cant effect on the amounts reported. A one-percentage-
point change in the health-care trend rates would have the
One-percentage- One-percentage-point increase point decrease
Effect on accumulated postretirement benefit obligation 71 (50)
Effect on total of service and interest cost components 10 (8)
The components of the net periodic benefit cost for the
years ended September 30, 2001 and 2000 were as follows:
September 30,2001 2000
Service cost 47 44
Interest cost 79 74
Expected return on plan assets (2) –
Amortization of:
Unrecognized prior service cost (1) –
Unrecognized net gain (20) (8)
Net periodic benefit cost 103 110
20 Other accruals and provisions
September 30,2001 2000
Remediation and environmental accruals 728 969
Deferred income 254 218
Other long-term accruals 1,975 2,881
2,957 4,068
Remediation and environmental protection liabilities
have been accrued primarily to account for the decom-
missioning of the facilities for the production of uranium
and mixed-oxide fuel elements in Hanau, Germany
(Hanau facilities) as well as the facilities in Karlstein, Ger-
many (Karlstein facilities). According to the German
Atomic Energy Act, when such a facility is closed, the
resulting radioactive waste must be collected and deliv-
ered to a government-developed final storage facility. In
this regard, the Company has developed a plan to decom-
mission the Hanau and Karlstein facilities in the following
steps: clean-out, decontamination and disassembly of
equipment and installations, decontamination of the
facilities and buildings, sorting of radioactive materials,
and intermediate and final storage of the radioactive
waste. This process will be supported by continuing engi-
neering studies and radioactive sampling under the
supervision of German federal and state authorities. The
decontamination, disassembly and sorting activities are
planned to continue until 2006; thereafter, the Company
is responsible for intermediate storage of the radioactive
materials until a final storage facility is available. The
final location is not expected to be available before
approximately 2030. The ultimate costs of the remediation
are contingent on the decision of the federal government
on the location of the final storage facility and the date of
its availability. Consequently, the accrual is based on a
number of significant estimates and assumptions. The
Company does not expect any recoveries from third par-
ties and did not reduce the accruals for such recoveries.
The Company believes that it has adequately provided for
this exposure. As of September 30, 2001 and 2000, the
accrual totals €676 and €706 and is recorded net of a pres-
ent value discount of €1,460 and €1,493, respectively, cal-
culated using a range of rates from approximately 4-5%.
following effects on the accumulated postretirement ben-
efit obligation and service and interest costs as of and for
the year ended September 30, 2001:

99
Notes to consolidated financial statements (in millions of €, except where otherwise stated and per share amounts)
The rates are determined based on the differing durations
of the steps of decommissioning. The total expected pay-
ments for each of the next five fiscal years and the total
thereafter are €66, €70, €75, €79, €3 and €1,843 (includes
€1,663 for the costs associated with final storage in 2033).
The Company recognizes the accretion of the liability
for the Hanau facility using the interest method. During
the years ended September 30, 2001 and 2000, €33 and
€33, respectively, was recognized as interest expense
related to such accretion.
21 Shareholders’ equity
Capital Stock and Additional Paid-in Capital
As of September 30, 2001, the Company’s capital stock
amounts to €2,665 divided into 888,230,245 shares with-
out par value with a notional value of €3.00 per share.
Each share of common stock is entitled to one vote.
Capital increases
On February 22, 2001, the Company’s shareholders
approved a capital increase of €262 through the increase
in the notional value per share to a round amount from
approximately €2.56 per share to €3.00 per share.
In addition, the Company’s shareholders approved a
capital increase of €888 effected in the form of a 3-for-2
stock split through increasing the number of shares out-
standing by 295,812,450. The stock split was effective for
trading purposes on April 30, 2001. All share and per
share data for periods prior to April 30, 2001 have been
restated to give effect to the 3-for-2 stock split.
The foregoing capital increases had the effect of
decreasing additional paid-in capital and increasing com-
mon stock by €1,150.
In December 2000, €8 or 3,000,000 shares (4,500,000
after stock split) from Authorized Capital 1996/II were
issued to an underwriter, repurchased and subsequently
offered for sale to employees in Germany principally with
respect to a special employee share program.
In June 2001, €2 or 790,000 shares from Authorized
Capital 2001/II were issued to an underwriter, repur-
chased and subsequently offered for sale to employees in
the U.S. with respect to a special employee share program.
In fiscal 2001 and 2000, capital stock increased by €20
thousand and €32 thousand, respectively, through the
issuance of 9,345 shares and 18,990 shares, respectively,
from the conditional capital as settlement to former
shareholders of SNI AG who had not tendered their SNI
share certificates by September 30, 2000 and 1999.
Treasury stock
On February 22, 2001, the Company’s shareholders
authorized the Company to repurchase up to 10% of the
€2,662 capital stock.
In fiscal 2001, Siemens repurchased 6,063,920 shares
(representing €18 or 1.2% of capital stock) at an average
price of €84.76 per share. Including the 23,100 shares of
treasury stock held at the beginning of the fiscal year,
6,085,904 shares were sold to employees. A majority of
these shares were related to a special employee share pro-
gram. The remainder of these shares were offered for sale
to employees at a preferential price of €58.77. As of Sep-
tember 30, 2001, 1,116 shares of stock remained in treas-
ury with a carrying amount of €111 thousand.
In fiscal 2000, Siemens repurchased 2,718,486 shares
(representing €5 or 0.2% of the capital stock) at an aver-
age price of €82.55 per share, in order to offer them for
sale to employees. Including the 28 shares of treasury
stock held at the beginning of the fiscal year, 2,695,414
shares were sold to employees at a preferential price of
€42.07 per share. At fiscal year-end, 23,100 shares of stock
remained in treasury. The carrying amount of these
shares, valued at €82.56 each, was €2.
During the years ended September 30, 2001 and 2000,
the Company incurred compensation expense of €65 and
€109, respectively, related to the sale to employees of
repurchased shares.
During fiscal 2000, the Company repurchased during
the months of May to August 2000 a total of 9,274,500 of
its outstanding shares at an average price of €107.71 per
share for a total of €999. The shares were purchased on
the open market and were subsequently retired. As a
result of these transactions, capital stock was reduced by
€16 or 1%, paid-in capital was reduced by €58 or 1%, while
retained earnings was charged with the purchase price
difference of €925.

100
Notes to consolidated financial statements (in millions of €, except where otherwise stated and per share amounts)
The authorization to issue €300 or 100,000,000 in new
common shares for which the shareholders’ preemptive
rights are excluded because these shares will be issued
against contribution in kind will expire on February 1,
2003 for the first tranche of €90 (Authorized Capital 1998)
and on February 1, 2004 for the second tranche of €210
(Authorized Capital 1999).
By resolution of the Annual Shareholders’ Meeting on
February 22, 2001, conditional share capital of €147 was
approved to service the 2001 Siemens Stock Option Plan
(Conditional Capital 2001). In addition, conditional capi-
tal of €45 was approved by the Company’s shareholders to
service the 1999 Siemens Stock Option Plan and the 2001
Siemens Stock Option Plan (Conditional Capital 1999).
Conditional capital of €2.5 provides for the settlement
offered to former shareholders of SNI AG who had not ten-
dered their SNI share certificates by September 30, 2001.
Other Comprehensive Income
The changes in the components of other comprehensive
income are as follows:
Authorized and Conditional Capital
Authorized Capital 1996/II, which was used for the above
mentioned capital increase during fiscal 2001 of 3,000,000
shares, expired on February 1, 2001.
On September 30, 2001, the authorized but unissued
capital of the Company amounts to €773 or 257,543,334
common shares (€499 or 195,200,000 common shares as
of September 30, 2000).
On February 22, 2001, the Company’s shareholders
authorized the Managing Board with the approval of the
Supervisory Board to increase the capital stock by up to
€400 through the issuance of up to 133,333,334 shares for
offer to existing shareholders until February 1, 2006
(Authorized Capital 2001/I). The Managing Board, with
the approval of the Supervisory Board, is authorized to
increase the capital stock by up to €75 through the
issuance of up to 25,000,000 shares until February 1,
2006. The shareholders’ preemptive rights are excluded
since these shares will be offered for sale to employees
(Authorized Capital 2001/II). As mentioned above, 790,000
shares from this authorized capital were issued during
fiscal 2001.
September 30,2001 2000
Tax TaxPretax effect Net Pretax effect Net
Unrealized gains (losses) on securities:
Unrealized holding gains (losses) for the period (2,239) 918 (1,321) 2,123 (973) 1,150
Reclassification adjustments for gains included in net income 209 (87) 122 (280) 132 (148)
Net unrealized gains (losses) on available-for-sale securities (2,030) 831 (1,199) 1,843 (841) 1,002
Unrealized gains (losses) on derivative financial instruments:
Cumulative effect of change in accounting for derivative instruments – – – 8 (3) 5
Unrealized gains (losses) on derivative financial instruments (87) (41) 46 (67) 33 (34)
Reclassification adjustments for (gains) losses included in net income 12 (5) 7 (2) 1 (1)
Net unrealized gains (losses) on derivative financial instruments 99 (46) 53 (61) 31 (30)
Minimum pension liability (6,529) 2,541 (3,988) (10) 4 (6)
Foreign currency translation adjustment (532) – (532) 1,059 – 1,059
(8,992) 3,326 (5,666) 2,831 (806) 2,025

101
Notes to consolidated financial statements (in millions of €, except where otherwise stated and per share amounts)
Miscellaneous
Under the German Stock Corporation Act, the amount of
dividends available for distribution to shareholders is
based upon the earnings of Siemens AG as reported in its
statutory financial statements determined in accordance
with the German Commercial Code (Handelsgesetzbuch).
During the year ended September 30, 2001, Siemens AG
management distributed an ordinary dividend of €823
(€0.93 per share) and an additional bonus of €589 (€0.67
per share) of the 2000 earnings of Siemens AG as a divi-
dend to the shareholders. During the years ended Septem-
ber 30, 2000, Siemens AG management distributed €593
(€0.67 per share) of the 1999 earnings of Siemens AG as a
dividend to the shareholders.
In August 2001, Infineon entered into an agreement to
sell its 49% share in the OSRAM Opto Seminconductors
GmbH & Co. OHG joint venture for approximately €565 to
Osram. The purchase price in excess of historic cost, net
of tax, of €392 was reflected as a capital transaction in the
separate financial statements of Infineon and Osram.
Accordingly, in its consolidated financial statements, the
Company recorded a decrease of €194 in its retained earn-
ings to reflect the minority interest holding of Infineon.
22 Commitments and contingencies
Guarantees and other commitments As of September 30, 2001, the Company has commit-
ments to make capital contributions of €55 to other com-
panies.
The Company is jointly and severally liable and has
capital contribution obligations as a partner in companies
formed under the German Civil Code (BGB), through
which it has executed profit-and-loss transfer agreements
with other companies as a partner in commercial partner-
ships and in a European Economic Interest Grouping
(EEIG) and as a participant in various consortiums.
The Company is a party to various lawsuits and arbi-
tration proceedings arising in the ordinary course of its
business, including matters involving allegations of
improper shipments and services, product liability, patent
infringement and claims for damages. Liabilities for liti-
gation risks have been accrued, which the Company
believes represent reasonable estimates of the probable
liabilities associated with the cost of related litigation and
the estimated cost of an unfavorable outcome of the dis-
putes. Although the final resolution of any such matters
could have a material effect on Siemens’ consolidated
operating results for the particular reporting period in
which an adjustment of the estimated reserve is recorded,
Siemens believes that any resulting adjustment should
not materially affect its consolidated financial position.
September 30,2001 2000
Discounted bills of exchange 121 356
Guarantees 4,595 3,835
therein credit guarantees [668] [495]
Collateral for third-party liabilities 3 5
2002 460
2003 396
2004 326
2005 263
2006 229
Thereafter 926
As of September 30, 2001, future payment obligations
under noncancellable operating leases are as follows:
The total operating rental expense for the years ended
September 30, 2001 and 2000 was €279 and €283, respec-
tively.
102
Notes to consolidated financial statements (in millions of €, except where otherwise stated and per share amounts)
23 Derivative instruments and hedging activities
As part of the Company’s risk management program,
a variety of derivative financial instruments are used to
reduce risks resulting primarily from fluctuations in for-
eign currency exchange rates and interest rates. The fol-
lowing is a summary of Siemens’ risk management strate-
gies and the effect of these strategies on the consolidated
financial statements.
Foreign currency exchange risk management
Siemens’ significant international operations expose the
Company to significant foreign currency exchange risks
in the ordinary course of business. The Company employs
various strategies discussed below involving the use of
derivative financial instruments to mitigate or eliminate
certain of those exposures.
Derivative financial instruments not designated as
hedges
The Company manages its risks associated with fluctua-
tions in foreign-currency-denominated receivables,
payables, debt, firm commitments and anticipated trans-
actions primarily through a Company-wide portfolio
approach. This approach concentrates the associated
Company-wide risks centrally, and various derivative
financial instruments, primarily foreign exchange con-
tracts and, to a lesser extent, interest rate and cross-cur-
rency, interest rate swaps and options, are utilized to min-
imize such risks. Such a strategy does not qualify for
hedge accounting treatment under SFAS 133 and also did
not qualify for hedge accounting prior to SFAS 133.
Accordingly, all such derivative financial instruments are
recorded at fair value on the balance sheet as either an
other current asset or other current liability and changes
in fair values are charged to earnings.
The Company also has foreign currency derivative
instruments, which are embedded in certain sale and
purchase contracts denominated in a currency other than
the functional currency of the significant parties to the
contract, principally the U.S. dollar. Gains or losses relat-
ing to such embedded foreign currency derivatives are
reported in cost of sales in the statements of income.
Hedging activities
During the years ended September 30, 2001 and 2000, the
Company’s operating units applied hedge accounting for
certain significant anticipated transactions and firm com-
mitments denominated in foreign currencies. Specifically,
the Company has entered into foreign exchange contracts
to reduce the risk of variability of future cash flows result-
ing from forecasted sales and purchases and firm com-
mitments resulting from its business units entering into
long-term contracts (project business) which are denomi-
nated primarily in U.S. dollars.
Cash flow hedges – Changes in fair value of forward
exchange contracts that were designated as foreign-cur-
rency cash flow hedges are recorded in accumulated other
comprehensive income as a separate component of share-
holders’ equity. During the year ended September 30,
2001, a net loss of €1 (2000: €–) was reclassified from
accumulated other comprehensive income into cost of
sales because the occurrence of the related hedged fore-
casted transaction was no longer probable. During the
year ended September 30, 2001, a net loss of €2 (2000: €–)
on the derivative contracts was recognized in cost of sales
representing hedge ineffectiveness.
It is expected that €30 of net deferred gains in accumu-
lated other comprehensive income will be reclassified into
earnings during the year ended September 30, 2002 when
the hedged forecasted foreign-currency-denominated
sales and purchases occur.
As of September 30, 2001, the maximum length of time
over which the Company is hedging its future cash flows
associated with foreign-currency forecasted transactions
is 64 months.
Fair value hedges – As of September 30, 2001, the
Company hedged firm commitments using forward
exchange contracts that were designated as foreign-cur-
rency fair value hedges of future sales related primarily to
the Company’s project business and, to a lesser extent,
purchases. The hedging transactions resulted in the
recognition of an other current asset of €6 (2000: €16)
and other current liability of €6 (2000: €–) for the hedged
firm commitments, whose changes in fair value were
charged to cost of sales. Changes in fair value of the deriv-
ative contracts were also recorded in cost of sales includ-
ing a net loss of €– (2000: €(1)) representing hedge inef-
fectiveness.

103
Notes to consolidated financial statements (in millions of €, except where otherwise stated and per share amounts)
Interest rate risk management
Interest rate risk arises from the sensitivity of financial
assets and liabilities to changes in market rates of inter-
est. The Company seeks to mitigate such risk by entering
into interest rate derivative financial instruments such as
interest rate swaps and, to a lesser extent, cross-currency
interest rate swaps and interest rate futures.
Interest rate swap agreements are used to adjust the
proportion of total debt, and to a lesser extent interest-
bearing investments, that are subject to variable and fixed
interest rates. Under an interest rate swap agreement, the
Company either agrees to pay an amount equal to a speci-
fied variable rate of interest times a notional principal
amount, and to receive in return an amount equal to a
specified fixed rate of interest times the same notional
principal amount or, vice-versa, to receive a variable-rate
amount and to pay a fixed-rate amount. The notional
amounts of the contracts are not exchanged. No other
cash payments are made unless the agreement is termi-
nated prior to maturity, in which case the amount paid or
received in settlement is established by agreement at the
time of termination, and usually represents the net pres-
ent value, at current rates of interest, of the remaining
obligations to exchange payments under the terms of the
contract.
Derivative financial instruments not designated
as hedges
The Company uses a portfolio-based approach to manage
its interest rate risk associated with certain interest-bear-
ing assets and liabilities, primarily interest-bearing
investments and debt obligations. This approach focuses
on mismatches in the structure of the interest terms of
these assets and liabilities without referring to specific
assets or liabilities. Such a strategy does not qualify for
hedge accounting treatment under SFAS 133. Accordingly,
all interest rate derivative instruments used in this strate-
gy are recorded at fair value as either an other current
asset or other current liability and changes in the fair val-
ues are charged to earnings.
Fair value hedges of fixed-rate debt obligations
Under the interest rate swap agreements outstanding dur-
ing the years ended September 30, 2001 and 2000, the
Company agrees to pay a variable rate of interest times a
notional principle amount, and receive in return an
amount equal to a specified fixed rate of interest times the
same notional principal amount. The interest rate swap
contracts are reflected at fair value in the Company’s con-
solidated balance sheet and the related portion of fixed-
rate debt being hedged is reflected at an amount equal to
the sum of its carrying value plus an adjustment repre-
senting the change in fair value of the debt obligations
attributable to the interest rate risk being hedged.
Changes in the fair value of interest rates swap contracts,
and the offsetting changes in the adjusted carrying value
of the related portion of fixed-rate debt being hedged, are
recognized as adjustments to the line item “Income from
financial assets and marketable securities, net” in the
consolidated statements of income. Net cash receipts and
payments relating to such interest rate swap agreements
are recorded to interest expense.
The Company had interest rate swap contracts to pay
variable rates of interest (average rate of 3.9% and 6.2% as
of September 30, 2001 and 2000, respectively) and receive
fixed rates of interest (average rate of 5.3% and 5.8% as of
September 30, 2001 and 2000, respectively). The notional
amount of indebtedness hedged as of September 30, 2001
and 2000 was €5,212 and €3,668, respectively. This result-
ed in 53% and 55% of the Company’s underlying notes
and bonds being subject to variable interest rates as of
September 30, 2001 and 2000, respectively. The notional
amounts of these contracts mature at varying dates based
on the maturity of the underlying hedged items. The net
fair value of interest rate swap contracts used to hedge
indebtedness as of September 30, 2001 and 2000 was €103
and €(166), respectively.
Cash flow hedges
Prior to adoption of SFAS 133, the Company used interest
rate derivative contracts to hedge certain anticipated com-
mercial paper borrowings in the United States. The net
unrealized gain of €8 on such derivatives was recorded to
other comprehensive income at the date of adoption of
SFAS 133. The Company elected not to designate such
derivatives in a hedging relationship upon adoption of
SFAS 133. During fiscal 2000, the Company significantly
curtailed its commercial paper borrowing program in the
United States and reclassified the unrealized gain of €8
from other comprehensive income into earnings.

104
Notes to consolidated financial statements (in millions of €, except where otherwise stated and per share amounts)
24 Fair value of financial instruments
The fair value of a financial instrument represents the
amount at which the instrument could be exchanged in a
current transaction between willing parties, other than in
a forced sale or liquidation. In determining the fair values
of the derivative financial instruments, certain compen-
sating effects from underlying transactions (e.g. firm
commitments and anticipated transactions) are not taken
into consideration.
Derivative financial instruments
The Company enters into derivative financial instruments
with various counterparties, principally financial institu-
tions with investment grade credit ratings.
Derivative interest rate contracts – The fair values of
derivative interest rate contracts (e.g. interest rate swap
agreements) are estimated by discounting expected
future cash flows using current market interest rates and
yield curve over the remaining term of the instrument.
Interest rate options are valued on the basis of quoted
market prices or on estimates based on option pricing
models.
Derivative currency contracts – The fair value of
forward foreign exchange contracts is based on forward
exchange rates. Currency options are valued on the basis
of quoted market prices or on estimates based on option
pricing models.
As of September 30, 2001, the Company’s derivative
financial instruments had a net fair value of €263 (2000:
€(481)) and were recorded on the consolidated balance
sheet as other current assets of €463 (2000: €259) and
other current liabilities of €200 (2000: €740).
Non-derivative financial instruments
The fair values for non-derivative financial instruments
are determined as follows:
Fair value of cash and cash equivalents, short-term
receivables, accounts payable, additional liabilities and
commercial paper and borrowings under revolving credit
facilities approximate their carrying value due to the
short-term maturities of these instruments.
Financial assets and securities
Securities in the portfolio are carried at fair value, which
is based on quoted market prices. It is not practicable to
estimate the fair value of the Company’s other equity
investments in related and affiliated companies, as these
investments are not publicly traded.
Financing receivables
Long-term fixed-rate and variable-rate receivables are
evaluated by the Company based on parameters such as
interest rates, specific country risk factors, individual
creditworthiness of the customer and the risk characteris-
tics of the financed project. Based on this evaluation,
allowances are taken to account for the expected losses of
these receivables. As such, as of September 30, 2001 and
2000, the carrying amounts of such receivables, net of
allowances, approximates their fair value.
Debt
The fair value of debt is estimated by discounting future
cash flows using rates currently available for debt of simi-
lar terms and remaining maturities. As of September 30,
2001 and 2000, the fair value and carrying value of debt is
as follows:
September 30,2001 2000
Fair value 12,333 9,208
Carrying value 12,610 9,338

105
Notes to consolidated financial statements (in millions of €, except where otherwise stated and per share amounts)
25 Stock-based compensation
Pursuant to SFAS 123, “Accounting for Stock-Based Com-
pensation”, the Company has elected to apply Accounting
Principles Board (APB) Opinion No. 25, “Accounting for
Stock Issued to Employees” and related Interpretations in
accounting for its stock-based compensation plan.
Description of plans – 1999 Siemens Stock Option Plan
As part of a stock option plan for members of the Manag-
ing Board, executive officers and other eligible employ-
ees, the Company’s shareholders authorized the Manag-
ing Board on February 18, 1999 to distribute
non-transferable options exercisable for up to an aggre-
gate of 10 million common shares. The authority to dis-
tribute options under this plan would have originally
expired on February 18, 2004. With the ratification by
Siemens shareholders of the 2001 Siemens Stock Option
Plan (further details see below), the 1999 Siemens Stock
Option Plan (the 1999 Plan) has been terminated and fur-
ther options will not be granted. In connection with the
1999 Plan, the shareholders originally approved an
increase in conditional capital in an amount not to exceed
€26, which has been increased to up to €45 in fiscal 2001
(see footnote 21).
Under the 1999 Plan, the Supervisory Board decided
annually after the end of each fiscal year how many
options to grant to the Managing Board, and the Manag-
ing Board decided annually how many options to grant to
executive officers and other eligible employees. The exer-
cise price is equal to the average market price of Siemens’
stock during the five days preceding the date the options
are granted. The options are exercisable within the five
years following a holding period of two years if Siemens
AG stock price outperforms the Dow Jones Stoxx-Index by
at least two percentage points on five consecutive days.
This percentage applies to the first year of the five-year
option exercise period, and increases by 0.5 percentage
points in each subsequent year. As a result of such per-
formance requirements, the plan has been accounted for
as a variable plan under APB Opinion No. 25.
The option may be settled either in newly issued
shares of common stock of Siemens AG from the Condi-
tional Capital reserved for this purpose, treasury stock or
cash. The alternatives offered to optionees are deter-
mined by the Managing Board in each case as approved by
the Supervisory Board.
Compensation in cash shall be equal to the difference
between the exercise price and the average market price
of the Company’s stock on the five trading days preceding
the exercise of the stock options.
Details on option activity and weighted average exer-
cise prices are as follows. On November 4, 1999, the Super-
visory Board and the Managing Board granted options
exercisable for approximately 1,181,061 (1,771,592 after
stock split) shares with an exercise price of €86.60 (€57.73
after stock split) of which options exercisable for 114,000
(171,000 after stock split) shares were granted to the Man-
aging Board. On November 24, 2000, the Supervisory
Board and the Managing Board granted options exercis-
able for approximately 2,173,594 (3,260,391 after stock
split) shares with an exercise price of €129.35 (€86.23
after stock split) of which options exercisable for 107,000
(160,500 after stock split) shares were granted to the Man-
aging Board.
The options and exercise prices below have been
restated to reflect the stock split:
Year ended September 30,2001 2000
Exercise ExerciseOptions price Options price
Outstanding, beginning of period 1,750,892 €57.73
Granted 3,260,391 €86.23 1,771,592 €57.73
Options exercised – – – –
Options forfeited (47,611) €76.27 (20,700) €57.73
Outstanding, end of period 4,963,672 €76.27 1,750,892 €57.73
Exercisable, end of period – – – –

106
Notes to consolidated financial statements (in millions of €, except where otherwise stated and per share amounts)
The following table summarizes information on stock
options outstanding and exercisable at September 30,
2001:
Fair value information
The Company uses the Black-Scholes option pricing model
to determine the fair value of grants. The fair value prior
to the stock split for the first tranche of the 1999 Plan in
November 1999 was €22.52 and for the second tranche in
November 2000, €38.11. The fair value of grants made
during the years ended September 30, 2001 and 2000,
restated for the stock split are as follows:
Assumptions at grant date2001 2000
Risk-free interest rate 5.0% 4.6%
Expected dividend yield 2.59% 0.94%
Expected volatility 50.00% 35.85%
Expected option life 4 years 4 years
Estimated weighted average fair value of options €25.41 €15.01
The Black-Scholes option valuation model was devel-
oped for use in estimating the fair values of options that
have no vesting restrictions. Option valuation models
require the input of highly subjective assumptions includ-
ing the expected stock price volatility. Because the Compa-
ny’s stock options may have characteristics that vary sig-
nificantly from traded options and because changes in
subjective assumptions can materially affect the fair value
of the option, it is management’s opinion that existing
models do not necessarily provide a single reliable meas-
ure of fair value.
Year endedSeptember 30,
2001 2000
Net income
As reported 2,088 8,860
Pro forma 2,034 8,870
Basic earnings per share
As reported 2.36 9.97
Pro forma 2.30 9.98
Diluted earnings per share
As reported 2.36 9.96
Pro forma 2.30 9.97
Description of plans – 2001 Siemens Stock Option Plan
At the Annual Shareholders’ Meeting on February 22,
2001, shareholders authorized Siemens AG to establish
the 2001 Siemens Stock Option Plan, making available up
to 55 million options representing approximately 6.2% of
the total shares outstanding. Compared to the 1999 Plan,
the number of eligible recipients is significantly larger.
The option grants are subject to a two-year vesting period,
after which they may be exercised for a period of up to
three years. The exercise price is equal to 120% of the ref-
erence price, which corresponds to the average opening
market price of Siemens AG during the five trading days
preceding the date of the stock option grant. The exercise
price is also the performance target. The terms of the plan
allow the Company to offer optionees the choice of set-
tling options in either shares or cash. As a result of its
design, the new plan will have no income effect in the case
Pro forma information
If the Company had adopted the fair value based account-
ing method prescribed by SFAS 123, the net income and
earnings per share would have been changed to the pro
forma amounts indicated below:
Options outstanding Options exercisable
Weighted Weighted Range of Options average remaining average Number Weighted averageexercise prices outstanding life (years) exercise price exercisable exercise price
€57.73 1,750,892 5 €57.73 – –
€86.23 3,212,780 6 €86.23 – –

107
Notes to consolidated financial statements (in millions of €, except where otherwise stated and per share amounts)
of settlement in shares due to the fact that the exercise
price is also the performance target. In connection with
the 2001 Siemens Stock Option Plan, the shareholders
approved an increase in conditional capital in an amount
not to exceed €147 (see footnote 21).
Stock options may be granted within a period of 30
days after publication of the results for the fiscal year or
quarter then ended. The Supervisory Board decides how
many options to grant to the Managing Board, and the
Managing Board decides how many options to grant to
executive officers and other eligible employees. Option
grants to members of the Managing Board may only be
made once annually after the close of the fiscal year.
The option may be settled either in newly issued
shares of common stock of Siemens AG from the Condi-
tional Capital reserved for this purpose, treasury stock or
cash. The alternatives offered to optionees are deter-
mined by the Managing Board in each case as approved by
the Supervisory Board.
Compensation in cash shall be equal to the difference
between the exercise price and the opening market price
of the Company’s stock on the day of exercising the stock
options.
During 2000, the Managing Board approved a special
one-time employee bonus award of €600 relating to the
Company’s exceptional results in 2000. Individuals
employed by Siemens, other than employees of Osram
GmbH and Infineon Technologies AG, during the entire
period October 1, 1999 through September 30, 2000 were
entitled to participate in the bonus program, including
former employees who left the Company after September
30, 2000. Approximately €300 of the special bonus was
allocated to domestic participants. Eligible participants in
Germany were offered a 50% discount towards the pur-
chase of a fixed number of the Company’s shares in
November 2000, with an enrollment period of 21 days.
Shares issued to domestic participants under the bonus
program approximated 2.4 million shares and cannot be
sold for a period of one year. In foreign countries, depend-
ing on the legal environment, the bonus program has
been administered either through a similar program as in
Germany or through a grant of stock or cash.
26 Personnel costs
Year endedSeptember 30,
2001 2000
Wages and salaries 23,028 21,264
Statutory social welfare contributions and expenses for optional support payments 3,673 3,305
Expenses relating to pension plans and employee benefits 401 2,032
27,102 26,601
The average number of employees in fiscal year 2001
was 477,100 (2000: 430,200). Part-time employees are
included on a proportionate basis rather than being count-
ed as full units. The employees were engaged in the follow-
ing activities:
September 30,2001 2000
Manufacturing 214,900 191,400
Sales and marketing 142,000 129,300
Research and development 60,200 54,800
Administration and general services 60,000 54,700
477,100 430,200

108
Notes to consolidated financial statements (in millions of €, except where otherwise stated and per share amounts)
27 Additional information relating to Board members
The total remuneration received or receivable by the
members of the Supervisory Board amounts to €2.1 and
€3.6 for the years ended September 30, 2001 and 2000,
respectively, of which €0.1 (2000: €0.1) is accounted for by
fixed compensation, and €1.2 (2000: €3.5) by variable
compensation and, in 2001, €0.8 by the market value of
appreciation rights granted under the same conditions as
under the Siemens 1999 Stock Option Plan. The total
remuneration of the members of the Managing Board was
€17.0 and €21.7 for the years ended September 30, 2001
and 2000, respectively, of which €5.1 (2000: €4.0) is
accounted for by fixed salary and €6.3 (2000: €15.1) by
variable compensation and, in fiscal 2001, €4.1 by the
market value of the stock options under the 1999 Siemens
Stock Option Plan (2000: €2.6). Furthermore, the Manag-
ing Board received an amount of €1.5 for the immediate
acquisition of a total of 15,375 shares (10,250 prior to
stock split) under the condition that each board member,
within a period of 18 months, buys the same number of
shares on his own account. Each board member paid any
taxes and other levies associated with the initial payment.
None of the shares purchased may be sold until the holder
leaves the Managing Board or for three years from the
date of the award, whichever is longer. Former members
of the Managing Board and their surviving dependents
received pensions and transitional payments of €13.2
(2000: €12.2).
Pension commitments to former members of the Man-
aging Board and their surviving dependents are covered
by an accrual of €95.8 (2000: €95.6).
During the last two fiscal years there have been no
loans outstanding to our management.
28 Earnings per share
Year endedSeptember 30,
(shares in thousands) 2001 2000
Net income 2,088 8,860
Weighted average shares outstanding – basic 885,658 889,055
Effect of dilutive stock options 270 662
Weighted average shares outstanding – diluted 885,928 889,716
Basic earnings per share 2.36 9.97
Diluted earnings per share 2.36 9.96
Share ownership
The Supervisory Board members and the Managing Board
members of Siemens AG hold shares and options repre-
senting less than 1% of the total shares outstanding. For
this calculation, Siemens has not included the aggregate
of 2.01% of outstanding share capital that is held by the
von Siemens-Vermögensverwaltungs GmbH, a German
limited liability entity that functions much like a trust
(vSV) or the 4.47% as to which the vSV has voting power
under a power of attorney. Mr. Peter von Siemens has the
voting control over these shares.
Related party transactions
Some of the board members of Siemens AG hold or in the
last three years have held positions of significant respon-
sibility with other entities. The Company has relation-
ships with almost all of these entities in the ordinary
course of business, whereby it buys and sells a wide vari-
ety of products and services at arm’s length. Significant
are the relationships with Deutsche Bank AG, Bayerische
Hypo- und Vereinsbank AG and Allianz AG. Dr. Rolf-E.
Breuer is the Spokesman of the Managing Board of
Deutsche Bank AG and Dr. Albrecht Schmidt is the
Spokesman of the Managing Board of Bayerische Hypo-
und Vereinsbank AG. The Company’s ongoing banking
relations with these institutions include securities under-
writings, other investment banking services, and credit,
money market and foreign-exchange business. Dr. Hen-
ning Schulte-Noelle is Chairman of the Managing Board
of Allianz AG, which directly and indirectly provides
insurance coverage in the ordinary course of our business
as well as banking services through its majority-owned
subsidiary, Dresdner Bank AG to Siemens.
The members of the Managing Board of Siemens AG
are listed on pages 24, 25 and 121 of this Annual Report,
and the Supervisory Board members are named on
page 120.

109
Notes to consolidated financial statements (in millions of €, except where otherwise stated and per share amounts)
29 Segment information
The Company’s segments are organized based on the
nature of products and services provided.
The segment information is subdivided on a primary
level into four components: Operations, Infineon, Financ-
ing and Real Estate, and Eliminations, reclassifications and
Corporate Treasury. The accounting policies of these com-
ponents (and the segments included) are generally the
same as those described in the summary of significant
accounting policies. Corporate overhead is generally not
allocated to segments. Intersegment transactions are gen-
erally based on market prices.
New orders are determined principally as the estimated
sales value of accepted purchase orders and order value
changes and adjustments, excluding letters of intent.
Operations
The Managing Board is responsible for assessing the per-
formance of the Operations segments. In fiscal 2001, the
Company changed the profitability measure for its Opera-
tions segments to earnings before financing interest, cer-
tain pension costs, income taxes, and amortization of
goodwill and purchased in-process R&D and certain one-
time items (EBITA). The prior-period segment information
has been restated to reflect this change. In the prior year
and until March 31, 2001, the service cost component of
domestic net periodic pension cost was included in the
measure of segment ebita. Beginning April 2001, manage-
ment decided to discontinue the allocation of the service
cost component of domestic pension costs to the Opera-
tions segments. Such change increased ebita of the seg-
ments in total by €49 for fiscal 2001. Additionally, in fiscal
2001, management decided to allocate the expense or
income associated to the Company’s stock option plans to
the segments. Such change increased ebita of the seg-
ments by €26 in 2001. Interest costs, return on plan assets
and all other components of domestic net periodic pension
costs are included in the line item “Corporate, elimina-
tions.” Interest related to accounts receivable to customers,
cash allocated to the segments, and accounts payable to
suppliers are part of ebita.
Earnings (losses) from equity investees included in
ebita of Operations segments were €6 and €(61) at ICM; €1
and €12 at ICN; €33 and €2 at PG; as well as €28 and €14 in
the other Operations segments for the years ended Sep-
tember 30, 2001 and 2000, respectively.
ebita assets is the asset measure used to assess the per-
formance for the Operations segments. It represents net
capital employed (total assets less tax-related assets, less
accruals and less non-interest bearing liabilities other
than tax-related liabilities). ebita assets are not reduced
for amortization of goodwill and in-process research and
development as such expenses are added back to calculate
ebita assets.
Corporate, eliminations and Reconciliation to
financial statements
Corporate, eliminations within Operations and Reconcili-
ation to financial statements include various categories of
items which are not allocated to the segments since the
Managing Board has determined that such items are not
indicative of the segments’ performance. These include
nonrecurring, one-time charges or gains and the results
of centrally managed projects. In addition, Corporate,
eliminations includes corporate charges such as person-
nel costs, including results from the domestic pension
fund, certain corporate related derivative activities, cen-
trally held equity investments, business units and corpo-
rate projects, liquid assets unallocated to segments and
corporate items relating to foreign subsidiaries. Reconcili-
ation to financial statements consists of various items
excluded by definition from ebita. Operations segments
ebita is used to determine bonus payments in accordance
with Siemens’ management incentive program.
Corporate, eliminations
Corporate, eliminations in the column ebita consists of:
Year endedSeptember 30,
2001 2000
Corporate headquarters expenses and charges (910) (827)
Gains on sales of available-for-sale securities 227 98
Domestic pension related income (expense) 418 (177)
At-equity earnings from centrally held equity investees 113 81
Eliminations, other (168) (445)
(320) (1,270)

110
Notes to consolidated financial statements (in millions of €, except where otherwise stated and per share amounts)
Year endedSeptember 30,
2001 2000
Gains on sales and dispositions of significant business interests 4,065 7,826
Other special items
Income from marketable securities classified as trading – 1,820
Personnel related expenses – (600)
Rationalization expenses – (193)
Impairment of goodwill (927) (195)
Contract losses (258) (450)
Other – (662)
Total of other special items (1,185) (280)
In March 2000, the Company contributed all of the
trading securities and other assets into a pension trust to
provide for future pension benefit payments relating to
certain defined benefit pension plans in Germany. Prior
to the establishment of the pension trust, certain trading
securities were designated as pension assets and the
return on these assets was included in income from mar-
ketable securities.
In fiscal 2001, gains on sales of available-for-sales
securities increased to €227 from €98 in the prior fiscal
year, reflecting the continuing disposal of a portion of the
centrally managed equities portfolio.
For the year ended September 30, 2001, “Eliminations,
other” in the table above includes the loss on the sale of a
centrally held investment of €209; €78 in expenses related
to centrally managed litigation issues, €74 in corporate
interest expense in part related to the Atecs acquisition,
and €63 in severance charges. Fiscal 2001, also included a
gain of €114 related to currency effects and the treatment
of derivative contracts not qualifying for hedge account-
ing, and positive resolution of certain asset disposal con-
tingencies of €162.
For the year ended September 30, 2000, “Eliminations,
other” in the table above includes higher charges related
to currency effects and to the treatment of derivative con-
tracts not qualifying for hedge accounting of €212 and
losses on asset dispositions totaling €210. Also included
are costs of €178 for employee severance and contract ter-
mination associated with the Ten-Point Program. Further-
more, Eliminations, other, consists of €68 related to the
centrally managed outsourcing contract in Argentina,
originally entered into by SBS. The most significant
income item for Eliminations, other, was €692 in income
from marketable securities classified as trading.
Reconciliation to financial statements
“Other interest expense” of Operations relates primarily
to interest paid on debt and corporate financing transac-
tions through Corporate Treasury.
“Goodwill amortization and purchased in-process R&D
expenses” are not included in ebita by definition.
“Gains on sales and dispositions of significant busi-
ness interests” are shown under Reconciliation to finan-
cial statements. For fiscal year 2001, such amount
includes a gain of €3,459 from the irrevocable transfer of
approximately 93,825,225 Infineon shares into our
domestic pension trust as well as a €484 gain from a fol-
low-on offering by Infineon of approximately 60 million
of its shares in the fourth quarter. In addition, Infineon
increased its capital in connection with two acquisitions,
which resulted in an aggregate gain of €122. Siemens did
not participate in these capital increases. Gains on sales
and dispositions of significant business interests for the
prior year total €7,826 resulting primarily from the IPO of
Infineon and other dispositions.
For fiscal 2001, “Other special items” include goodwill
impairments, primarily related to Efficient and Milltron-
ics totaling €927, and the write-down of inventories and
assets associated with the contract cancellation by the
Argentine government of €258. Other special items of the
prior fiscal period primarily resulted from exceptional
gains from certain marketable securities, a one-time
bonus for employees, certain restructuring costs, a write-
off of goodwill and exceptional charges related to certain
contract losses, as well as a provision related to a loan
associated with a joint venture and a contribution to the
German government-sponsored humanitarian fund,
called “Remembrance, Responsibility and the Future,” and
write-downs associated with centrally managed assets.
For further details of “Gains on sales and dispositions
of significant business interests” and "Other special
items” see below:

111
Notes to consolidated financial statements (in millions of €, except where otherwise stated and per share amounts)
September 30,2001 2000
Total assets 70,917 69,109
Intracompany financing receivables and investments (8,305) (14,203)
Tax related assets (4,335) (1,625)
Pension plans and similar commitments (4,653) (2,419)
Accruals (6,977) (6,609)
Liabilities to third parties (28,034) (20,580)
Accumulated goodwill amortization and in-process R&D expense 1,057 392
Total reconciliation (51,247) (45,044)
ebita assets 19,670 24,065
The following table reconciles total assets of the Opera-
tions component to ebita assets as disclosed in Segment
Information according to the above definition:
Infineon
The Company’s profitability measure for Infineon is earn-
ings before interest and taxes (EBIT).
Earnings (losses) from equity investees included in
ebit at Infineon were €32 and €101 for the years ended
September 30, 2001 and 2000, respectively.
Net capital employed, as an ebit-related asset indicator,
is the only asset measure used to assess the performance
for Infineon.
Financing and Real Estate
The Company’s performance measurement for its Financ-
ing and Real Estate segments is income before income
taxes. In contrast to the performance measurement used
for the Operations segments, interest expense and
income is an important source of revenue and expense for
Financing and Real Estate.
For the years ended September 30, 2001 and 2000,
income before income taxes at SFS includes interest rev-
enue of €603 and €418, respectively, and interest expense
of €404 and €307, respectively. For the years ended Sep-
tember 30, 2001 and 2000, income before income taxes at
SRE includes interest revenue of €19 and €9, respectively,
and interest expense of €150 and €117, respectively.
Eliminations, reclassifications and Corporate
Treasury
Income before income taxes consists primarily of interest
income due to cash management activities, corporate
finance, and certain currency and interest rate derivative
instruments.
Description of business segments
With the completion of the acquisition of Atecs and its
consolidation in the Siemens consolidated financial state-
ments beginning with the third quarter of fiscal 2001, two
Operating segments were renamed: Siemens Dematic
(SD) resulted out of the merger of Siemens Production
and Logistics Systems (PL) and Mannesmann Dematic,
and Siemens VDO Automotive (SV) resulted from the inte-
gration of Mannesmann VDO into Siemens Automotive
(AT).
The Operations segments are comprised of the follow-
ing businesses:
Information and Communication Networks (ICN)
– ICN develops, manufactures and sells public communi-
cation systems, private business communication systems
and related software, and provides a wide variety of con-
sulting, maintenance and other services. This includes
circuit switching and communication access equipment,
private branch exchange systems, voice and data public
telecommunication elements, and broadband network
products for carrying data over the Internet. It also pro-
vides Internet core network switches, routers and related
services.
Information and Communication Mobile (ICM)
– ICM designs, manufactures and sells a broad range of
communication devices and mobile network products and
systems including mobile, cordless and corded fixed-line
telephones and radio base stations, base station con-
trollers and switches for mobile communication networks
as well as mobile and wireline intelligent network sys-
tems. ICM also holds a 50% interest in the Fujitsu Siemens
Computers joint venture, a leading manufacturer of per-
sonal and network computers and servers.
Siemens Business Services (SBS) – SBS provides
information and communications services to customers
in industry, the public sector, telecommunications, trans-
port, utilities and finance. SBS designs, builds and oper-
ates both discrete and large-scale information and com-
munications systems, and provides related maintenance
and support services.

112
Notes to consolidated financial statements (in millions of €, except where otherwise stated and per share amounts)
Automation and Drives (A&D) – A&D produces and
installs manufacturing automation systems, drives sys-
tems, low-voltage controllers and distributors, and
process automation products and instrument systems.
Industrial Solutions and Services (I&S) – I&S pro-
vides a range of facilities systems and services, including
general contracting, to raw materials processing compa-
nies and infrastructure customers.
Siemens Dematic (SD) – SD is active in the fields of
factory and logistics automation. The segment engineers
and provides turnkey systems and related components
and services for electronics assembly systems, logistics
and factory automation systems, postal automation sys-
tems, crane and drive technology, as well as mobile crane
systems.
Siemens Building Technologies (SBT) – SBT supplies
products, systems and services for safety and security
engineering, fire protection, heating and ventilation, and
air conditioning. SBT also provides full facility manage-
ment services as well as the planning and engineering of
large-scale infrastructure projects.
Power Generation (PG) – PG provides customers
worldwide with a broad range of products and services
necessary for the conversion of energy into electricity and
heat. This includes the design and construction of power
plants, turbines and generators, and the production and
development of alternative energy power sources.
Power Transmission and Distribution (PTD) – PTD
ensures, as a product supplier, system integrator and
service provider, reliable and efficient transmission of
electrical energy from the generating plant to the con-
sumer. PTD provides the liberalized energy markets not
only with tailormade IT solutions, but also enables power
suppliers to outsource the operation and servicing of
their electricity supply networks under service contracts
with PTD.
Transportation Systems (TS) – TS provides products
and services for the rail industry, including signaling and
control systems, railway electrification systems, complete
heavy rail systems including rapid transit systems and
locomotives, light rail systems and other rail vehicles.
Siemens VDO Automotive (SV) – SV provides infor-
mation, cockpit and car communication systems, includ-
ing instrumentation, audio, navigation, multimedia and
telmatics applications as well as system solutions for drive
train, motor control electronics and fuel injection technol-
ogy, safety products such as airbag and ABS electronics,
and chassis electronic products.
Medical Solutions (Med) – Med offers diagnostic and
therapy systems such as CAT scanners, hearing instru-
ments, magnetic resonance imagers and ultrasound and
radiology devices.
Osram – Osram designs, manufactures and sells gen-
eral lighting products, automotive lighting, photo/optical
lighting, and opto semiconductors.
Infineon Technologies (Infineon) – Infineon’s prod-
ucts include discrete and integrated semiconductor cir-
cuits and systems for wireless communications, computer
networks and for use in automotive and industrial appli-
cations.
The Financing and Real Estate Segments are com-
prised of the following two businesses:
Siemens Financial Services (SFS) – SFS, the Com-
pany’s international financial services segment, provides
customized financial solutions and best-practice risk
management.
Siemens Real Estate (SRE) – SRE owns and manages
Siemens’ domestic real estate portfolio, and increasingly
manages Siemens real estate in the U.S. and in Western
Europe.

113
Notes to consolidated financial statements (in millions of €, except where otherwise stated and per share amounts)
30 Geographic information
The following table presents data by geographic region as
of and for the years ended September 30, 2001 and 2000:
Long-lived assets consist of property plant and equip-
ment and equipment leased to others.
Sales by location Sales by location of customer of companies
2001 2000 2001 2000
Germany 19,144 18,899 30,547 27,640
Europe (other than Germany) 26,196 23,952 23,024 22,028
U.S. 21,103 16,978 21,102 16,863
Americas other than U.S. 4,893 4,317 3,928 3,674
Asia-Pacific 11,081 9,984 7,228 6,369
Other countries 4,583 3,354 1,171 910
Siemens worldwide 87,000 77,484 87,000 77,484
Long-lived assets
2001 2000
Germany 7,368 5,858
Europe (other than Germany) 3,991 3,850
U.S. 4,486 4,042
Americas other than U.S. 633 711
Asia-Pacific 1,197 1,189
Other countries 128 70
Siemens worldwide 17,803 15,720

114
Principal subsidiaries and associated companies
Sales (1) Income Equityafter taxes (1) interest
September 30, 2001 in millions of € in millions of € in %
I. Subsidiaries – Operations
1. Regional Companies (international)
Siemens S.A., Brussels 442 48 100
Siemens A/S, Ballerup (Copenhagen) 413 1 100
AS Siemens, Tallinn 29 2 100
Siemens Osakeyhtiö, Espoo (Helsinki) 241 6 100
Siemens S.A.S., Saint-Denis (Paris) 868 0 100
Siemens A.E., Elektrotechnische Projekte und Erzeugnisse, Athens 261 10 100
Siemens plc, Bracknell (London)(3) 2,188 118 100
Siemens Ltd., Dublin 181 3 100
Siemens S.p.A., Milan 1,215 11 100
Siemens d.d. Zagreb(2) 107 1 97
Siemens SIA, Riga 36 1 100
UAB Siemens, Vilnius 31 1 100
Siemens Nederland N.V., The Hague 1,418 314 100
Siemens AS, Oslo 482 (5) 100
Siemens Aktiengesellschaft Österreich, Vienna(3) 2,362 245 100
Siemens Sp.z.o.o., Warsaw 252 2 100
Siemens S.A., Lisbon(3) 612 46 100
Siemens AB, Stockholm 285 6 100
Siemens Schweiz AG, Zurich(3) 1,242 46 100
Siemens s.r.o., Bratislava(2) 69 1 100
Siemens d.o.o., Ljubljana 46 1 100
Siemens S.A., Madrid 1,380 55 100
Siemens s.r.o., Prague 459 6 100
Simko Ticaret ve Sanayi A.S., Istanbul 294 4 100
Siemens Rt., Budapest(2) 174 28 100
Siemens S.A., Buenos Aires 382 (10) 100
Siemens Ltda., São Paulo 689 25 100
Siemens S.A., Santiago de Chile 33 1 100
Siemens Canada Ltd., Mississauga/Ontario 1,430 57 100
Siemens S.A., Bogotá 106 2 94
Grupo Siemens S.A. de C.V., Mexico City(3) 384 13 100
Siemens S.A., Caracas 94 1 100
Siemens Ltd., Bayswater (Melbourne)(3) 292 (7) 100
Siemens Ltd., Beijing(7) 56 85 100
Siemens Ltd., Hong Kong 138 2 100
Siemens Ltd., Mumbai 259 15 54
P.T. Siemens Indonesia, Jakarta 86 6 94
Siemens K.K., Tokyo 323 3 100
Siemens Ltd., Seoul 17 5 100
Siemens Malaysia Sdn. Bhd., Kuala Lumpur 101 6 100
Siemens Pakistan Engineering Co. Ltd., Karachi 76 4 64
Siemens Inc., Manila 39 6 100
Siemens Advanced Engineering Pte. Ltd., Singapore 536 12 100
Siemens Ltd., Taipei 48 3 100
Siemens Ltd., Bangkok 294 11 93

115
Principal subsidiaries and associated companies
Siemens Ltd., Cairo 69 1 90
Siemens Israel Ltd., Tel Aviv 16 (4) 75
Siemens S.A., Casablanca 61 1 51
OOO Siemens, Moscow(2) 103 14 100
Siemens Ltd., Jidda 168 11 51
Siemens Ltd., Johannesburg(3) 215 16 87
Siemens LLC, Abu Dhabi 59 1 49(6)
2. Siemens U.S.A. (Group statements) 23,046 (603) 100
3. Other subsidiaries
Information and Communication Networks (ICN)
Siemens Tele Industrie A.E., Thessaloniki 191 10 70
Siemens Information and Communication Networks S.p.A., Milan 1,334 22 100
ZWUT S.A., Warsaw 304 11 97
Siemens Information and Communication Networks, Inc., Boca Raton, Florida 1,682(4) 100
Unisphere Networks, Inc., Burlington, Massachusetts 202(4) 96
Siemens Public Communication Networks Ltd., Bangalore 177 8 100
Egyptian German Telecommunication Industry S.A.E., Cairo 64 15 75
Information and Communication Mobile (ICM)
Siemens Information and Communication Mobile LLC, Austin, Texas 192(4) 100
Siemens Shanghai Mobile Communications Ltd., Shanghai 1,770 83 60
Siemens Telecommunication Systems Ltd., Taipei(3) 186 7 60
Siemens Business Services (SBS)
Siemens Business Services GmbH & Co. OHG, Munich 3,324 (198) 100
Siemens Business Services S.A., Brussels 214 6 100
Siemens Business Services Ltd., Hounslow, Middlesex 517 (232) 100
Siemens Informatica S.p.A., Milan 254 (2) 51
Siemens Business Services GmbH, Vienna 253 (6) 100
Siemens Business Services AG, Kloten (Zurich) 96 (1) 100
Siemens Itron Business Services S.A., Buenos Aires 72 (3) 60
Siemens Business Services, Inc., Rye Brook, New York 471(4) 100
Automation and Drives (A&D)
Siemens Production Automatisation S.A., Haguenau, France 75 3 100
Siemens Elektromotory s.r.o., Mohelnice, Czech Republic 116 14 100
Siemens Milltronics Inc., Mississauga, Ontario 85 (3) 100
Siemens Energy & Automation, Inc., Alpharetta, Georgia 2,198(4) 100
Sales (1) Income Equityafter taxes (1) interest
September 30, 2001 in millions of € in millions of € in %
(1) These figures correspond to the financial statements prepared inaccordance with local regulations and do not reflect the amountsincluded in the consolidated financial statements. Foreign currencyaccounts are translated at year-end exchange rates.
(2) Fiscal year from January 1, 2000 to December 31, 2000.(3) Sales and income after taxes as per consolidated financial statements.
(4) Included in U.S. Group statements.(5) Fiscal year from April 1, 2000 to March 31, 2001.(6) Subsidiary pursuant §290 (2) No. 2 German Commercial Code
(HGB).(7) Sales and income after taxes as per separate company financial
statements.

116
Principal subsidiaries and associated companies
Siemens Dematic (SD)
Siemens Dematic AG, Munich 978 (383) 100
Siemens Dematic Electronics Assembly Systems, Inc., Wilmington, Delaware 141(4) 100
Mannesmann Dematic Rapistan Corp., Grand Rapids, Michigan 573(4) 100
Siemens Dematic Postal Automation, Inc., Arlington, Texas 338(4) 100
Siemens Building Technologies (SBT)
Siemens Gebäudetechnik GmbH & Co. OHG, Erlangen 888 7 100
Siemens Building Technologies AG, Zurich 610 12 100
Siemens Building Technologies, Inc., Buffalo Grove, Illinois 1,520(4) 100
Power Generation (PG)
Siemens Westinghouse Power Corporation, Orlando, Florida 4,712(4) 100
Power Transmission and Distribution (PTD)
Siemens Metering AG, Zug 134 (6) 100
Siemens Power Transmission & Distribution, Inc., Raleigh, North Carolina 523(4) 100
Transportation Systems (TS)
Siemens Duewag Schienenfahrzeuge GmbH, Krefeld 365 (43) 100
Matra Transport International S.A., Montrouge (Paris) 162 5 95
Siemens SGP Verkehrstechnik Ges.m.b.H., Vienna 229 3 100
Siemens Transportation Systems, Inc., Sacramento, California 403(4) 100
Siemens VDO Automotive (SV)
Siemens VDO Automotive AG, Munich 2,251 (449) 75
Siemens VDO Automotive Rambouillet S.A.S., Rambouillet (Paris) 305 2 100
Siemens VDO Automotive S.A., Toulouse 494 (15) 100
VDO Automotive España S.A., Barcelona 433 3 100
VDO Cèska republika s.r.o., Brandys (Prague) 208 8 100
Siemens Automotive, Inc., Chatham, Ontario 334 5 100
Siemens Automotive Corp., Auburn Hills, Michigan 1,047(4) 100
VDO North America LLC, Winchester, Virginia 165(4) 100
Medical Solutions (Med)
Siemens-Elema AB, Solna (Stockholm) 373 1 100
Acuson Corporation, Wilmington, Delaware 538(4) 100
Siemens Medical Solutions Health Services, Wilmington, Delaware 1,128(4) 100
Siemens Medical Solutions USA, Inc., Iselin, New Jersey 2,279(4) 100
Siemens Asahi Medical Technologies Ltd., Tokyo 310 10 82
Osram
Osram GmbH, Munich 1,456 177 100
Osram Opto Semiconductors GmbH & Co. OHG, Regensburg 384 13 100
Osram S.A.S., Molsheim, France 203 0 100
Osram Ltd., Langley (London) 109 5 100
Osram Società Riunite Osram Edison-Clerici S.p.A., Milan 272 1 100
Osram Argentina S.A.C.I., Buenos Aires 52 2 100
Osram do Brasil Companhia de Lâmpadas Elétricas Ltda., Osasco (São Paulo) 79 6 100
Osram de México S.A. de C.V., Tultitlán 86 2 100
Sales (1) Income Equityafter taxes (1) interest
September 30, 2001 in millions of € in millions of € in %

117
Principal subsidiaries and associated companies
Osram Sylvania, Inc., Danvers, Massachusetts 2,176(4) 100
Osram-Melco Ltd., Yokohama 178 5 51
Infineon Technologies
Infineon Technologies AG, Munich 6,697 (437) 50.4
Infineon Technologies North America Corp., Wilmington, Delaware 1,171(4) 100
Infineon Technologies Japan K.K., Tokyo 186 1 100
Infineon Technologies Asia Pacific Pte. Ltd., Singapore 1,875 26 100
II. Subsidiaries – Financing and Real Estate
Siemens Financial Services (SFS)
Siemens Finance & Leasing GmbH & Co. KG, Munich 651 2 100
Siemens Financial Services GmbH, Munich 27 130 100
Siemens Finance S.A., Saint-Denis (Paris) 120 2 100
Siemens Financial Services Ltd., Harrow, Middlesex 49 10 100
Siemens Finanziaria S.p.A., Milan 38 4 100
Siemens Financial Services, Inc., Wilmington, Delaware 144(4) 100
Siemens Real Estate (SRE)
Siemens Immobilien Management GmbH & Co. OHG, Munich 294 47 100
Siemens Real Estate Ltd., Bracknell, Berkshire 50 1 100
Siemens Servizi Aziendali S.r.l., Milan 37 (2) 100
Siemens Real Estate, Inc., Iselin, New Jersey 47(4) 100
III. Associated companies
Information and Communication Mobile (ICM)
Fujitsu Siemens Computers (Holding) B.V., Amsterdam(5) 5,888 (65) 50
Infineon Technologies
ProMOS Technologies, Inc., Hsinchu, Taiwan(2) 672 213 33
Other (not allocatable to specific operating units)
BSH Bosch und Siemens Hausgeräte GmbH, Munich(2) 6,278 89 50
Tela Versicherung Aktiengesellschaft, Berlin and Munich(2) 334 (5) 50
(1) These figures correspond to the financial statements prepared inaccordance with local regulations and do not reflect the amountsincluded in the consolidated financial statements. Foreign currencyaccounts are translated at year-end exchange rates.
(2) Fiscal year from January 1, 2000 to December 31, 2000.
(3) Sales and income after taxes as per consolidated financial state-ments.
(4) Included in U.S. Group statements.(5) Fiscal year from April 1, 2000 to March 31, 2001.(6) Subsidiary pursuant §290 (2) No. 2 German Commercial Code (HGB).
Sales (1) Income Equityafter taxes (1) interest
September 30, 2001 in millions of € in millions of € in %

118
Five-year summary
2001 2000 1999 1998(1) 1997
Sales and earnings (in millions of euros)
Net sales 87,000 77,484 68,069 – –
Gross profit on sales 23,105 21,535 17,909 – –
Research and development expenses 6,782 5,848 5,260 – –
as a percentage of sales 7.8 7.5 7.7 – –
Net income 2,088 8,860 1,209 – –
Net income excluding special items 85 2,639 1,209 – –
Employees
Employees(2) (in thousands) 484 448 437 – –
Employee costs (in millions of euros) 27,102 26,601 23,126 – –
Cash flows (in millions of euros)
Net cash provided by operating activities 7,016 6,154 3,640 – –
Depreciation and amortization 6,264 4,652 3,594 – –
Net cash used in investing activities (5,886) (435) (2,876) – –
Additions to intangible assets and property, plant and equipment (7,048) (5,544) (3,998) – –
Net cash used in financing activities (95) (1,174) (1,111) – –
Net increase (decrease) in cash and cash equivalents 940 4,725 (292) – –
Assets, liabilities and shareholders’ equity (in millions of euros)
Current assets 51,013 49,091 44,850 – –
Current liabilities 44,524 36,855 31,049 – –
Debt 12,610 9,338 7,492 – –
Long-term debt 9,973 6,734 4,753 – –
Pension plans and similar commitments 4,721 2,473 11,540 – –
Shareholders’ equity 23,812 28,480 19,138 – –
as a percentage of total assets 26 35 27 – –
Total assets 90,118 81,654 71,720 – –
(1) Due to the adoption of U.S. GAAP comparable financial data is not availablefor the fiscal years 1998 and 1997.
(2) Without temporary student workers and trainees.(3) Data reflect stock split (one additional share for two existing shares)
effective April 30, 2001.(4) To be proposed at the Annual Shareholders’ Meeting.(5) XETRA closing prices, Frankfurt.
(1)

119
Five-year summary
Quarterly data (in millions of euros) 2001 4th Quarter 3rd Quarter 2nd Quarter 1st Quarter
Net sales 87,000 24,540 21,360 20,629 20,471
Net income 2,088 (1,098) 1,608 578 1,000
Net income excluding special items 85 (566) (705) 578 778
Quarterly data (in millions of euros) 2000 4th Quarter 3rd Quarter 2nd Quarter 1st Quarter
Net sales 77,484 23,660 18,025 19,058 16,741
Net income 8,860 562 267 5,628 2,403
Net income excluding special items 2,639 767 628 653 591
Key capital market data(3) (in euros, unless otherwise indicated) 2001 2000 1999 1998 1997
EVA (in millions of euros) (743) 7,095 – – –
Earnings per share 2.36 9.97 1.36 – –
Diluted earnings per share 2.36 9.96 1.36 – –
Dividend per share 1.00(4) 1.60 0.67 0.51 0.51
Siemens stock price(5)
High 105.77 127.67 57.53 47.25 44.31
Low 37.50 50.65 26.93 30.78 24.13
Year-end (September 30) 41.89 97.33 51.60 31.46 40.68
Siemens stock performance over prior year (in percentage points)
compared to DAX® index – 19.84 + 57.88 + 63.23 – 30.00 – 6.98
compared to Dow Jones STOXXSM index – 28.30 + 63.95 + 47.85 – 26.13 – 2.79
Number of shares (in millions) 888 883 892 892 857
Market capitalization (in millions of euros) 37,208 85,939 46,037 28,068 34,852
Credit rating of long-term debt
Standard & Poor’s AA AA AA AA AAA
Moody’s Aa3 Aa3 Aa3 Aa1 Aa1
* Prepared in accordance with the German Commercial Code (HGB).** Including distribution of an extra dividend of €0.6 billion.
**
Siemens AG – Statement of income and balance sheet*(condensed version) (in billions of euros)
Years ended September 30 2001 2000
Net sales 29.7 31.6
Cost of sales (22.8) (22.8)
Gross profit on sales 6.9 8.8
Other functional costs (9.3) (8.5)
Other income and expense, net 3.7 1.7
Income before income taxes 1.3 2.0
Income taxes (0.4) (0.3)
Extraordinary items (after taxes) – 0.2
Net income 0.9 1.9
Profit available for distribution 0.9 1.4
September 30 2001 2000
Property, plant and equipment 1.6 1.7
Investments 17.8 17.5
Noncurrent assets 19.4 19.2
Inventories 1.0 2.3
Accounts receivable 23.7 17.3
Marketable securities, liquid assets 12.9 14.0
Total assets 57.0 52.8
Shareholders’ equity 13.8 13.8
Accrued liabilities and special reserves 17.8 16.5
Debt 0.2 0.3
Other liabilities 25.2 22.2
Total shareholders’ equity and liabilities 57.0 52.8

120
Positions held by Supervisory Board members
Karl-Hermann Baumann,Dr. rer.oec.
Chairman
Additional positions
Supervisory Board:Allianz AG (until 9/30/01)Deutsche Bank AGE.ON AGLinde AGmg technologies agSchering AGThyssenKrupp AGWilhelm von Finck AG
Alfons Graf
First Deputy ChairmanChairman of theCentral Works Council
Rolf-E. Breuer, Dr. jur.
Second Deputy ChairmanSpokesman of the Board of Managing Directors,Deutsche Bank AG
Additional positions
Supervisory Board:Bertelsmann AGDeutsche Börse AG (Chairman)Deutsche Lufthansa AGE.ON AGMünchener Rückversicherungs-Gesellschaft AG
Board of Administration:Compagnie de Saint-Gobain S.A.Landwirtschaftliche Rentenbank
Helmut Cors
Head of Industrial Services andProduction, Vereinte Dienstleistungs-gewerkschaft
Additional positions
Supervisory Board: Hebel AGFramatome ANP GmbH
Bertin Eichler
Executive Member of the Board of Management, IG Metall
Additional positions
Supervisory Board:Allgemeine DeutscheDirektbank AGBGAG Beteiligungsgesellschaftder Gewerkschaften AG (Chairman)Deutsche BauBeCon AG
Jean Gandois
Member of the Supervisory Board, Suez Lyonnaise des Eaux S.A.
Additional positions
Supervisory Board:Rodamco Continental EuropeN.V.
Board of Administration:Air Liquide Espagne S.A.Air Liquide Italie S.p.A.Danone S.A.EurazéoSociété Générale de BelgiqueS.A.
Birgit Grube
Office clerk
Heinz Hawreliuk
Head of the Company Codetermination Department,IG Metall
Additional positions
Supervisory Board: Astrium GmbHDaimlerChrysler Aerospace AGDaimlerChrysler Luft undRaumfahrt Holding AGEurocopter Deutschland GmbHInfineon Technologies AG
Ralf Heckmann
Chairman of the Combined Works Council,Siemens AG
Robert M. Kimmitt
Executive Vice President ofAOL Time Warner
Additional positions
Board of Directors:Allianz Life Insurance Co.Commerce One, Inc.United Defense Industries, Inc.Xign Corporation
Heinz Kriwet, Dr. rer.pol.
Chairman of the Supervisory Board, ThyssenKrupp AG
Additional positions
Supervisory Board: Allianz Lebensversicherungs-AGDresdner Bank AGThyssenKrupp Steel AG(Chairman)
Hubert Markl, Prof. Dr. rer.nat.
President, Max-Planck-Gesellschaft zur Förderung der Wissenschaftene.V.
Additional positions
Supervisory Board:Aventis S.A.Bayerische Motoren Werke AG
Georg Nassauer
Steel casting constructor
Albrecht Schmidt, Ass. jur., Dr. jur.
Spokesman for the ManagingDirectors, Bayerische Hypo- undVereinsbank AG
Additional positions
Supervisory Board:Allianz AGBayerische Börse AG (Chairman)Münchener Rückversicherungs-Gesellschaft AG
Group positions
Supervisory Board:Bank Austria (Chairman)HVB Real Estate Bank AG(Chairman)Vereins- und Westbank AG (Chairman)
Henning Schulte-Noelle,Dr. jur.
Chairman of the Board of Management, Allianz AG
Additional positions
Supervisory Board:BASF AGE.ON AGLinde AGMünchener Rückversicherungs-Gesellschaft AGThyssenKrupp AG
Group positions:
Supervisory Board:Allianz Versicherungs-AG (Chairman)Allianz Lebensversicherungs-AG (Chairman)Dresdner Bank AG (Chairman)
Board of Administration:Assurances Générales deFrance S.A.Elvia Versicherungen AG
Board of Directors:RAS S.p.A. (Vice President)
Georg Seubert
Fitter
Peter von Siemens
Industrial manager
Additional positions
Supervisory Board:Münchener TierparkHellabrunn AG
Daniel L. Vasella, Dr.med.
President and Delegate ofthe Board of Administration,Novartis AG
Additional positions
Board of Administration:Credit Suisse Group
Klaus Wigand
Industrial clerk
Erwin Zahl
Telecommunications installer
Supervisory Board*
* German corporation law mandates establishment of a supervisory board, with the power to review and approvemajor strategies and actions proposed by a company’s managing board (which is equivalent to the board of direc-tors in U.S. corporations). A supervisory board also reviews and discusses a corporation’s financial statements andrelated topics, including allocation of retained earnings and payment of dividends. A supervisory board meets atdefined intervals during the year and maintains close contact with the Managing Board throughout the year.
As of September 30, 2001

121
Positions held by Managing Board members
As of September 30, 2001
Heinrich v. Pierer, Dr. jur. Dr.-Ing.E.h.
President and Chief Executive Officer, Siemens AG
Outside positions
Supervisory Board:Bayer AGHochtief AGMünchener Rückversicherungs-Gesellschaft AGVolkswagen AG
Company positions
Supervisory Board:Siemens AktiengesellschaftÖsterreich, Vienna(Chairman)
Volker Jung, Dr. Eng.h.c.
Outside positions
Supervisory Board:Direkt Anlage Bank AGMAN AGEpcos AG(Chairman)
Company positions
Supervisory Board:Infineon Technologies AG(Chairman)
Comparable positions:Siemens A.E., Athens(Chairman)Siemens Information andCommunication Networks, Inc.,Boca RatonSiemens Ltd., Johannesburg(Deputy Chairman)
Roland Koch(until 7/25/01)
Company positions
Supervisory Board:Fujitsu Siemens Computers B.V.,Amsterdam Siemens Osakeyhtiö, Helsinki(Deputy Chairman)
Comparable positions:Iranian TelecommunicationManufacturing Company, ShirazSiemens Information andCommunication Networks, Inc., Boca Raton(Chairman)Siemens Ltd., Bangkok(Chairman)Siemens Sherkate Sahami,Teheran(Chairman)
Edward G. Krubasik, Prof. Dr. rer.nat.
Outside positions
Supervisory Board:Dresdner Bank AGSTINNES AG
Comparable positions:Covisint LLC, Southfield
Company positions
Supervisory Board:BSH Bosch und SiemensHausgeräte GmbHMannesmann PlasticsMachinery AG (Chairman)Mannesmann Sachs AG(Chairman)Siemens Dematic AG(Chairman)Siemens VDO Automotive AG(Chairman)
Comparable positions:Siemens A/S, OsloSiemens BuildingTechnologies AG, Zurich(Chairman)Siemens France S.A., Saint-DenisSiemens S.A., Brussels(Chairman)
Rudi Lamprecht
Outside positions
Supervisory Board:Knorr Capital Partner AG
Company positions
Supervisory Board:EWW WienFujitsu Siemens Computers B.V.,Amsterdam (Chairman)
Comparable positions:Siemens Information andCommunication Mobile LLC,AustinSiemens France S.A., Saint-DenisSiemens S.A., BrusselsSiemens Telematica S.p.A., Santa Maria Capua Vetere
Heinz-Joachim Neubürger
Outside positions
Supervisory Board:Allianz Versicherungs-AGBayerische Börse AGHVB Real Estate Bank AGTELA Versicherung AG(Chairman)
Comparable positions:Merrill Lynch & Co., Inc.,New York
Company positions
Supervisory Board:Infineon Technologies AGSiemens Kapitalanlage-gesellschaft mbH(Chairman)Atecs Mannesmann AG(Chairman)Mannesmann Demag Krauss-Maffei AG(Chairman)
Comparable positions:Siemens Corp., New York(Deputy Chairman)
Peter Pribilla, Prof.
Outside positions
Supervisory Board:Deutsche KrankenversicherungAG
Company positions
Comparable positions:Grupo Siemens S.A. de C.V.,Mexico CitySiemens Canada Ltd.,MississaugaSiemens Corporation, New York(Chairman)Siemens Information andCommunication Networks, Inc.,Boca RatonSiemens Information andCommunication Mobile LLC,Austin
Jürgen Radomski
Company positions
Supervisory Board:BSH Bosch und SiemensHausgeräte GmbH(Chairman)Osram GmbH(Chairman)Siemens AktiengesellschaftÖsterreich, ViennaSiemens Osakeyhtiö, Helsinki
Comparable positions:Siemens A/S, CopenhagenSiemens-Elema AB, StockholmSiemens Holdings plc, BracknellSiemens Nederland N.V., The HagueSiemens Rt., Budapest(Chairman)Siemens S.A., Madrid(Deputy Chairman)Siemens Schweiz AG, Zurich(Deputy Chairman)Siemens S.p.A., Milan(Deputy Chairman)Simko Ticaret ve Sanayi A.S.,Istanbul
Uriel J. Sharef, Dr. rer.pol.
Company positions
Comparable positions:Siemens Ltda., São PauloSiemens Power Transmission& Distribution, Inc., RaleighSiemens Israel Ltd., Tel Aviv(Chairman)Siemens S.A., Buenos Aires(Chairman)
Claus Weyrich, Prof. Dr.phil. Dr.-Ing.E.h.
Outside positions
Supervisory Board:HERAEUS Holding GmbH, Hanau
Company positions
Supervisory Board:Infineon Technologies AG
Comparable positions:Siemens Corporate Research,Inc., Princeton(Chairman)
Klaus Wucherer, Dr.-Ing.
Outside positions
Supervisory Board:Deutsche Messe AG
Company positions
Supervisory Board:Infineon Technologies AGBSH Bosch und SiemensHausgeräte GmbH
Comparable positions:Eviop-Tempo A.E., EuboeaSiemens Energy & Automation,Inc., Alpharetta(Chairman)Yaskawa Siemens Automation& Drives K.K., Kitakyushu(Chairman)Siemens K.K., Tokyo(Chairman)Siemens Ltd., MumbaiSiemens BuildingTechnologies AG, Zurich
Managing Board

122
Glossary
Acquisition The act of taking over one company by another; usually accomplished by the purchase of a controlling portion of theacquired company’s stock.
Asset management The process of managing corporate assets in order to enhance operational efficiency while minimizing costs andassociated risks.
Backup facilities Bank line of credit to provide liquidity support to an organization in the event of unfavorable capital markets.
Benchmarking A technique used to compare the products, services, processes and financials within an organization, in relation to “best ofpractice” in other similar organizations.
Business portfolio The aggregate total of business areas in which Siemens is active.
Cash flow The net cash inflow or outflow for a specific time period.
Cash management The management of cash and cash equivalents within an organization to optimize financial activities.
Consolidated financial Financial statements that bring together all assets, liabilities, net worth, and operating figures of two or more affiliated statements companies, as though the business were in fact a single economic entity. Duplications in items are eliminated so that the
combined figures do not show more assets and equities than actually exist.
Cost of capital The rate that a company must pay for its capital.
Debt-to-equity ratio Total long-term debt divided by total shareholders’ equity. This is a measure of leverage – the use of borrowed money toenhance the return on shareholders’ equity. The higher the ratio, the greater the leverage.
Derivative A financial instrument that derives its value from the price or expected price of an underlying asset (e.g. a security,currency or bond).
Divestments Sale of activities or corporate divestiture (spin-off, carve-out) that results in a subsidiary or division becoming anindependent company.
EBIT Short for “earnings before interest and taxes.” Net income before interest cost and income tax expense.
EBITA Short for “earnings before interest, taxes and amortization.” Primary financial measure of operating income beforenoncash amortization of intangible assets, after charges for depreciation.
EBITA assets Similar to net capital employed (see below), but does not include the amortization of intangible assets, after charges fordepreciation.
E-business Also “e-biz,” short for “electronic business.” The aggregate total of information flows and transactions with productsand services through electronic networks, including the Internet and related technologies and concepts.
E-commerce Short for “electronic commerce.” E-commerce is a part of e-business and is defined as transacting or enabling themarketing, buying, and selling of goods and/or information, usually through the Internet.
Emerging markets Markets of newly industrialized countries (NICs), such as in Latin America, Southeast Asia and Eastern Europe.
E-procurement Short for “electronic procurement.” A generic term for using the Internet and other open networks to perform theprocurement function; a B2B (business-to-business) application.
Equity method Valuation method used to account for holdings in companies whose business policy can be significantly influenced(associated companies).
Equity ratio The proportion of shareholders’ equity to total funds employed.
EVA Short for “economic value added.” As a measure, EVA is equal to net operating profit after taxes (NOPAT) less a charge forthe capital employed in the business (cost of capital).
Financing and The worldwide leasing, lending, financing and real estate activities of Siemens Financial Services (SFS), Siemens Real Real Estate Estate (SRE), and Siemens Corporate Treasury.
Fully diluted Earnings per share are fully diluted when they reflect the effects of exercising stock options or warrants or convertingconvertible securities.
Functional costs Functional costs include cost of sales, R&D expenses, marketing and selling expenses, and general administrationexpenses.
GASC Short for “German Accounting Standards Committee.” An independent registered association to develop, among otherthings, accounting standards for application in the area of consolidated financial reporting.
German GAAP Short for “Generally Accepted Accounting Principles in Germany.” The accounting concepts, measurements, techniquesand standards of presentation used in financial statements in Germany pursuant to the German Commercial Code (HGB).
Goodwill The excess of the fair value of net assets acquired over cost resulting from a business combination accounted for as apurchase.
Glossary
123
Glossary
Hedging A strategy used to minimize exposure to changes in prices, interest rates or exchange rates by means of derivative financial instruments (options, swaps, forward contracts, etc.).
Joint venture A form of business partnership between two or more companies to engage in a commercial enterprise with mutual sharing of profits and losses.
M-business Short for “mobile business.” Mobile business is a part of e-business and describes the new business models enabled by themassive deployment of key mobile and wireless technologies and devices.
Medium Term Note Flexible financing framework providing for the issuance of notes in rotation in the context of a program unrestricted in Program time (constant issue). The notes may be issued in several tranches, with terms and conditions and time of issue being
determined in accordance with then current goals and prevailing market conditions.
Moody’s Investors Independent rating agency that provides evaluation of securities investment and credit risk.Service
Net capital employed Consists of long-term assets plus excess of current assets over current non-interest-bearing liabilities.
NOPAT Short for “net operating profit after tax.” Profit before interest and taxes net of adjustments to eliminate financing andaccounting distortions, minus taxes.
Operations The most important of the three major components of Siemens, comprising all activities of the Siemens organizationworldwide with the exception of Financing and Real Estate and the Domestic Pension Fund.
Purchase method Valuation method used to account for shareholders’ equity of subsidiaries included in the consolidated financialstatements.
R&D Short for “research and development.”
Rating Standardized evaluation of issuers’ credit standing and debt instruments, carried out by specialized agencies (such as Standard & Poor’s or Moody’s Investors Service).
Registered shares Shares of stock registered in the name of the owner on the books of the issuer.
Risk management Systematic process of identifying, assessing and monitoring various financial risk factors and of selecting and implement-ing measures to handle them.
RORAC Short for “return on risk adjusted capital.” An analysis tool commonly used in the banking industry to estimate line of business profitability.
SEC Short for “Securities and Exchange Commission.” The primary federal agency in the U.S. responsible for regulating thefinancial reporting practices of most publicly owned corporations in connection with the buying and selling of stocksand bonds.
Shareholder value Concept that focuses strategic and operational decision-making on steadily increasing corporate value, ensuring thatinvestors receive a reasonable return on their investment.
Siemens A corporate function responsible for ensuring the availability of company-wide financing and cash management,Corporate Treasury including consulting services involving issues of corporate finance, interest rates and currencies, liquidity management
and all other questions related to the financial management of operations.
SKAG Short for “Siemens Kapitalanlagegesellschaft mbH.”
Standard & Poor’s Independent rating agency that provides evaluation of securities investment and credit risk.
Stock options Form of employee incentive and compensation. The employee is given an option to purchase a company’s shares if certaintargets are met under specified conditions.
top+ top+ is our company-wide program to achieve sustained growth in profitability. To improve the performance of ourbusinesses, we apply tried and tested methods – e.g. cost reduction, sales stimulation, quality enhancement and assetmanagement. The motto of top+ is: Clear goals, concrete measures, rigorous consequences. We continually monitor theeffectiveness of our top+ activities.
Turnkey project A project in which a supplier contracts to design, build and deliver a completed facility or package ready for operation.
U.S. GAAP Short for “United States Generally Accepted Accounting Principles.” The accounting concepts, measurements, techniquesand standards of presentation applicable to financial statements in the U.S.
UMTS Short for “Universal Mobile Telecommunications System.” Third-generation mobile communications standard that willprovide broadband services optimized for high-speed data, mobile Internet and applications based on intranets, extranetsand mobile multimedia.
Volatility The degree of fluctuation for a given price or rate, such as a stock price or currency exchange rate.

Annual Shareholders’ MeetingOlympiahalle, Munich, 10:00 a.m. Jan. 17, 2002
Ex-dividend date Jan. 18, 2002
Interim report October to December Jan. 23, 2002
Semiannual Report andSemiannual Press Conference Apr. 25, 2002
Interim report October to June July 24, 2002
Preliminary figures for fiscal year Nov. 13, 2002
Annual Press Conference Dec. 5, 2002
Annual Shareholders’ Meeting for fiscal 2002 Jan. 16, 2003
* Preliminary dates
Siemens financial calendar*
ImprintDesignations used in this report may be trademarks whose use bythird parties for their own purposes could violate the rights of theirowners.
Concept and coordinationDr. Christoph WegenerCorporate Communicationse-mail [email protected]
LayoutKai Brüninghaus Kommunikationsdesign, Hamburg
PhotographyPeter Rüssmann, Hamburg (pages 4, 7, 8, 11–13, 38–39, 124)Regina Recht, Munich (President and CEO, page 14; Chairman of the Supervisory Board, page 40)All other photos Siemens AG, Munich
ProductionPublicis KommunikationsAgentur GmbH, GWA, Munich
© 2001 by Siemens AG, Berlin and Munich
information on contents
Telephone +49 89 636-33032 (Press Office)
+49 89 636-32474 (Investor Relations)
Fax +49 89 636-32825 (Press Office)
+49 89 636-32830 (Investor Relations)
e-mail [email protected]
address
Siemens AG
Wittelsbacherplatz 2
D-80333 Munich
Federal Republic of Germany
Internet http://www.siemens.com
This Annual Report is also available in French, German
and Spanish.
An abbreviated version has been prepared in Japanese.
for external orders
e-mail [email protected]
Internet http://www.siemens.de/geschaeftsbericht_2001/order
Telephone +49 89 636-32910
Fax +49 89 636-32908
for internal orders
LZF, Fürth-Bislohe
Intranet http://c4bs.spls.de/
Fax +49 911 654-4271
German Order no. A19100-F-V055
English Order no. A19100-F-V055-X-7600
French Order no. A19100-F-V055-X-7700
Spanish Order no. A19100-F-V055-X-7800
Please include postal address and complete company unit
designation (Org-ID) when ordering.
additional reports
Corporate Citizenship Report 2001
Please place external orders at the above address.
Internal orders can be placed at the LZF order center:
German Order no. A19100-F-V091
English Order no. A19100-F-V091-X-7600
Environmental Report 2002 (to be published in May 2002)
Please place external orders at the above address.
Internal orders can be placed at the LZF order center:
German Order no. A19100-F-V015
English Order no. A19100-F-V015-X-7600
Siemens
Siemens is a network encompassing well over 400,000 people in 190 countries.
We take pride in possessing in-depth knowledge of customers' requirements, the
expertise to create innovative solutions in electrical engineering and electronics, and
the experience to successfully navigate even rough economic waters. But our greatest
asset is undoubtedly our people, with their unparalleled motivation and their passion
for outperforming our competitors. Linked via a global network that enables them
to exchange ideas with colleagues around the world, Siemens employees strive
continuously to increase company value.
We at Siemens do not measure value solely in terms of short-term profitability. For
us, it is just as important to be a respected corporate citizen in all the countries in which
we operate. Ever since our company was founded 154 years ago, sustainability has
been a top priority at Siemens. This applies to all our activities – from information and
communications technology to automation, transportation, medical solutions, power
and lighting. Our global network is a network of innovation – a network that draws on
the best of many diverse cultures for the benefit of our customers, our investors, our
employees and our partners.
Annual Report 2001
Siemens Aktiengesellschaft Order No. A19100-F -V055-X-7600
s
»We have made great progress in
networking our internal value
chain electronically and in linking
it to our customers, suppliers and
partners. This is enabling us to
accelerate processes and cut costs.«
s
»We are on the right track for
ensuring our success as the
Global network of innovation.«
An
nu
al R
epor
t 2
001