waveev fault waveform analysis software_instruction...
TRANSCRIPT
WaveEvFault Waveform Analysis Software
Instruction Manual
NR Electric Co., Ltd.


WaveEv Fault Waveform Analysis Software
NR ELECTRIC CO., LTD. i
Preface
CopyrightRelease: R1.01P/N: EN_GJRJ0901.0086.0002Copyright © NR 2010. All rights reserved
We reserve all rights to this document and to the informationcontained herein. Improper use in particular reproduction anddissemination to third parties is strictly forbidden except whereexpressly authorized.
The information in this manual is carefully checked periodically,and necessary corrections will be included in future editions. Ifnevertheless any errors are detected, suggestions for correction orimprovement are greatly appreciated.
We reserve the rights to make technical improvements withoutnotice.
NR ELECTRIC CO., LTD.69 Suyuan Avenue, Jiangning, Nanjing 211102,ChinaTel: 86-25-87178185, Fax: 86-25-87178208Website: www.nari-relays.comEmail: [email protected]

WaveEv Fault Waveform Analysis Software
NR ELECTRIC CO., LTD.ii

WaveEv Fault Waveform Analysis Software
NR ELECTRIC CO., LTD. iii
Table of Content
Preface ..........................................................................................................................................i
Table of Content .........................................................................................................................iii
Chapter 1 Overview.....................................................................................................................1
1.1 Application .....................................................................................................................1
1.2 Copyright........................................................................................................................1
1.3 Overall Function ............................................................................................................1
1.4 System Files and Environmental Parameters Setup .................................................1
Chapter 2 Usage Instruction......................................................................................................3
2.1 Introduction to Main Interface......................................................................................3
2.2 Waveform Files Operation ............................................................................................3
2.2.1 Open Waveform Files..........................................................................................3
2.2.2 Path and Recent Historical Files List ................................................................4
2.2.3 Save as .................................................................................................................5
2.2.4 Merge Waveform..................................................................................................7
2.3 Waveform Display..........................................................................................................9
2.3.1 Display..................................................................................................................9
2.3.2 Waveform Display Operation ...........................................................................14
2.4 Waveform Analysis......................................................................................................35
2.4.1 Fault Location....................................................................................................35
2.4.2 Harmonic Analysis ............................................................................................38
2.4.3 Power Calculation .............................................................................................39
2.4.4 Sequence Component Analysis.......................................................................41
2.4.5 Impedance Analysis ..........................................................................................42
2.4.6 Formula Editor ...................................................................................................46
2.4.7 Spectral Analysis...............................................................................................49
2.4.8 Digital Event Information..................................................................................50
2.4.9 Fault Report .......................................................................................................53
2.4.10 View .CFG file information..............................................................................55

WaveEv Fault Waveform Analysis Software
NR ELECTRIC CO., LTD.iv
2.5 Display Analysis Data..................................................................................................56
2.5.1 Bar Chart ............................................................................................................57
2.5.2 Vector Graph......................................................................................................57
2.5.3 Sequence Component Graph...........................................................................59
2.5.4 Impedance Trajectory Graph............................................................................60
2.5.5 Spectral Analysis Graph...................................................................................60
2.6 Channel Ratio Setup....................................................................................................61
2.7 Configure WaveEv .......................................................................................................62
2.7.1 Line Setup ..........................................................................................................63
2.7.2 Analysis Option .................................................................................................63
2.7.3 Date Option ........................................................................................................64
2.7.4 Waveform Display Setup ..................................................................................64
2.7.5 Default Setup .....................................................................................................66
Chapter 3 Manual Release History..........................................................................................67
Chapter 1 Overview
NR ELECTRIC CO., LTD. 1
Chapter 1 Overview
1.1 Application
The Fault Waveform Analysis Software (FWAS) WaveEv provides an offline software for the
analysts and the general technical personnel of the power system to display the fault waveform,analyze the fault and print the waveform and analysis results. This software may be either used
independently, or used with Disturbance & Fault Recording System (DFRS), Protection Analysis
System (PAS), Supervisory Control and Data Acquisition System(SCADA) and SubstationAutomation System (SAS).
1.2 Copyright
WaveEv is developed by NR Electric Co., Ltd. (NR for short), and the copyright is reserved byNR. Only the authorized users have the right to use this software.
Please contact with NR in case of problems during the usage of WaveEv.
1.3 Overall Function
WaveEv includes waveform files operation, waveform display and print, waveform analysis,formula calculation and data display of analysis results, etc.
Waveform file operations include:
open file, save file, format conversion and merging file.
Waveform display/print include:
browsing waveform, zoom in/out, viewing data, label, copying waveform, print setup, print preview,
print, etc.
Waveform analysis includes:
fault location, fault line detection, harmonic analysis, power analysis, impedance analysis and
sequence component analysis, etc. New waveform analysis function can be developed by adding
new analysis function module.
The analysis results may be displayed in the form of list, polar coordinates, rectangular coordinate,
bar chart, pie chart and text, etc.
This instruction manual will introduce the how to use these functions in details.
1.4 System Files and Environmental Parameters Setup
If WaveEv is installed in Windows OS, no environmental configuration is needed.
If WaveEv is installed in Linux/UNIX OS, the current directory of executable files is required to beset in the environmental parameter COMTRADEPATH of OS.
In Linux/UNIX OS, if the current path is “\user\ems\WaveEv”, an environmental variableCOMTRADEPATH must be added in the environmental variables of the system, the value of which

Chapter 1 Overview
NR ELECTRIC CO., LTD.2
is “\user\ems\WaveEv\”.
NOTE:The last slash “\”in the value must not be omitted.

Chapter 2 Usage Instruction
NR ELECTRIC CO., LTD. 3
Chapter 2 Usage Instruction
2.1 Introduction to Main Interface
Figure 2.1-1 Main interface of WaveEv
The main interface is applied to provide an access to call various modules, which adopts
traditional menu bar, toolbar, status bar, floating window and multiple-document interface. Themultiple-document interface displays the original waveform and the page waveform generated by
analysis.
Various functions may be conveniently selected for analysis through the menu bar, toolbar or
shortcut menu.
2.2 Waveform Files Operation
2.2.1 Open Waveform Files
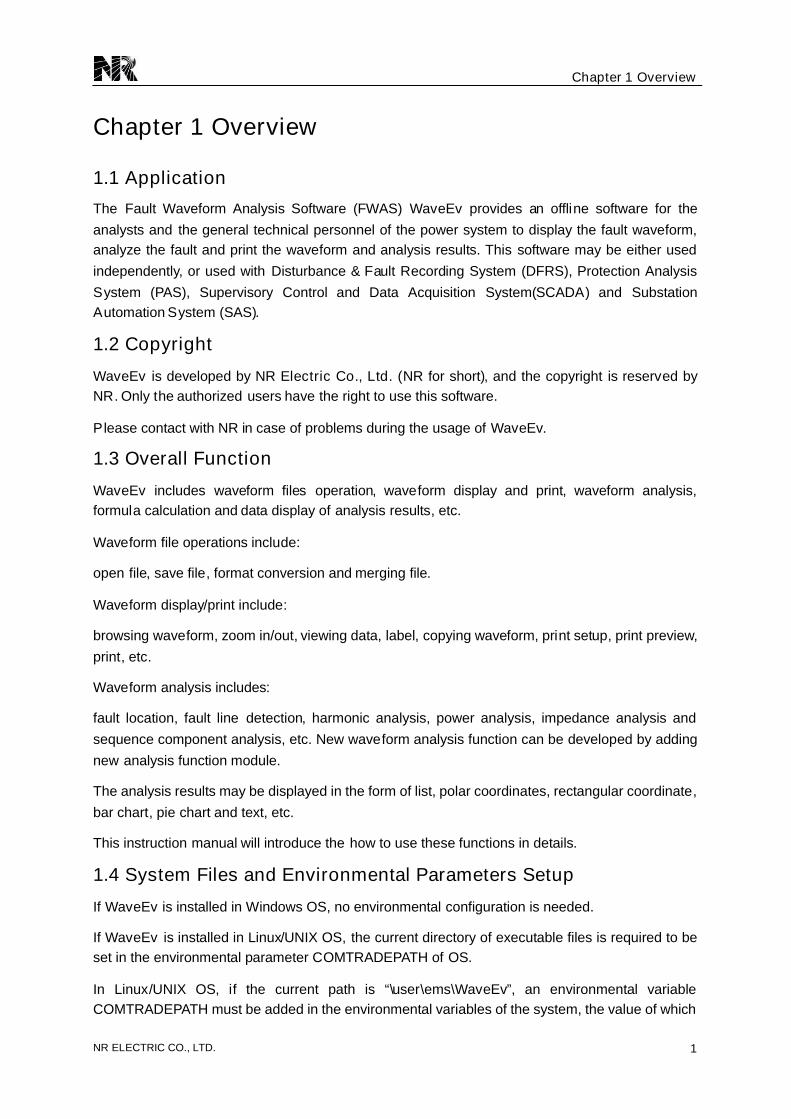
Select the menu “File”->“Open… ”or the toolbar button “ ”to open the waveform file, and the
following "Open waveform file”dialog box will pop up. Select the data file (*.DAT) to open the
waveform file.
Chapter 2 Usage Instruction
NR ELECTRIC CO., LTD.4
NOTE:The letter “O”with underline indicates the shortcut of “Open… ”. Press the button
“Ctrl”+“O”(“O”is case insensitive) can directly open the dialog box of “Open waveform
file”instead of performing the menu.
Ctrl+O: Open…
Ctrl+S: Save as…
Ctrl+P: Print…
Ctrl+X: Exit…
Figure 2.2-1 How to open a waveform file
2.2.2 Path and Recent Historical Files List
When the file is opened again, the last opened path of such file may be recorded, thus this pathmay be adopted when the waveform is opened next time.
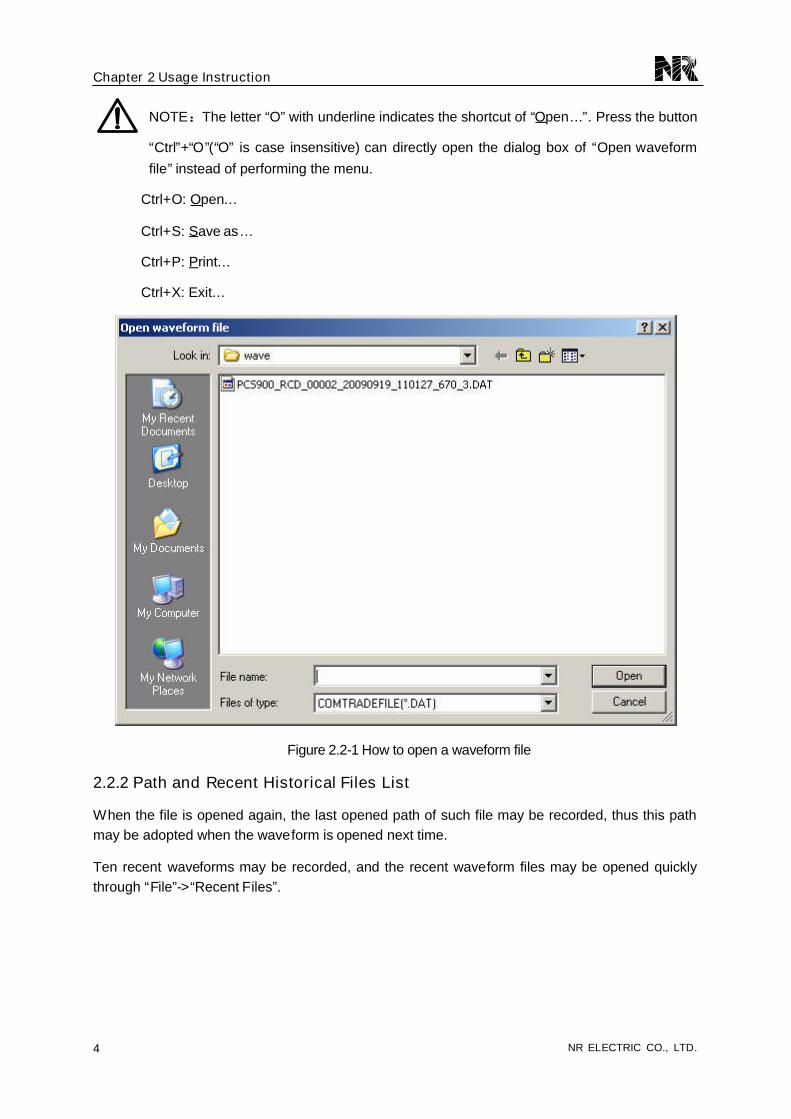
Ten recent waveforms may be recorded, and the recent waveform files may be opened quicklythrough “File”->“Recent Files”.
Chapter 2 Usage Instruction
NR ELECTRIC CO., LTD. 5
Figure 2.2-2 How to access recent files list
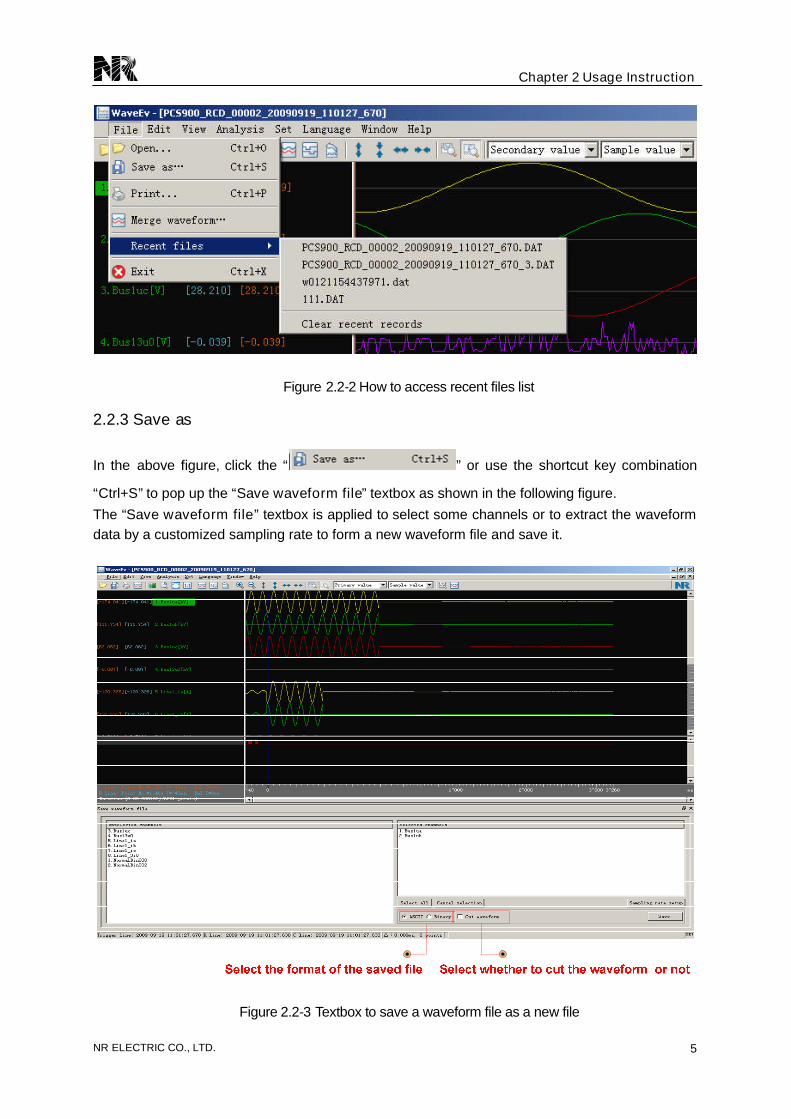
2.2.3 Save as
In the above figure, click the “ ”or use the shortcut key combination
“Ctrl+S”to pop up the “Save waveform file”textbox as shown in the following figure.
The “Save waveform file”textbox is applied to select some channels or to extract the waveformdata by a customized sampling rate to form a new waveform file and save it.
Figure 2.2-3 Textbox to save a waveform file as a new file
Chapter 2 Usage Instruction
NR ELECTRIC CO., LTD.6
As shown in the above figure, you can click some channels in the left “Unselected channels”
textbox to move them to the right “Selected channels”textbox.
By clicking the “ ”button, all the channels in the left “Unselected channels”textbox
will be moved to the right “Selected channels”textbox.
By clicking the “ ”button, all the channels in the right “Selected channels”
textbox will be moved to the left “Unselected channels”textbox.
“ ”is applid to select the file format to be saved, 2 formats are optional: ASCII
(text) format or Binary format.
Select “ ”: the number of selected channels will not be changed, and only the
sampling data between the reference line (R line) and current line (C line) will be extracted to be
saved into the file.
If “ ”is not selected, all the sampling data of will be saved.
clicking the “ ”button.
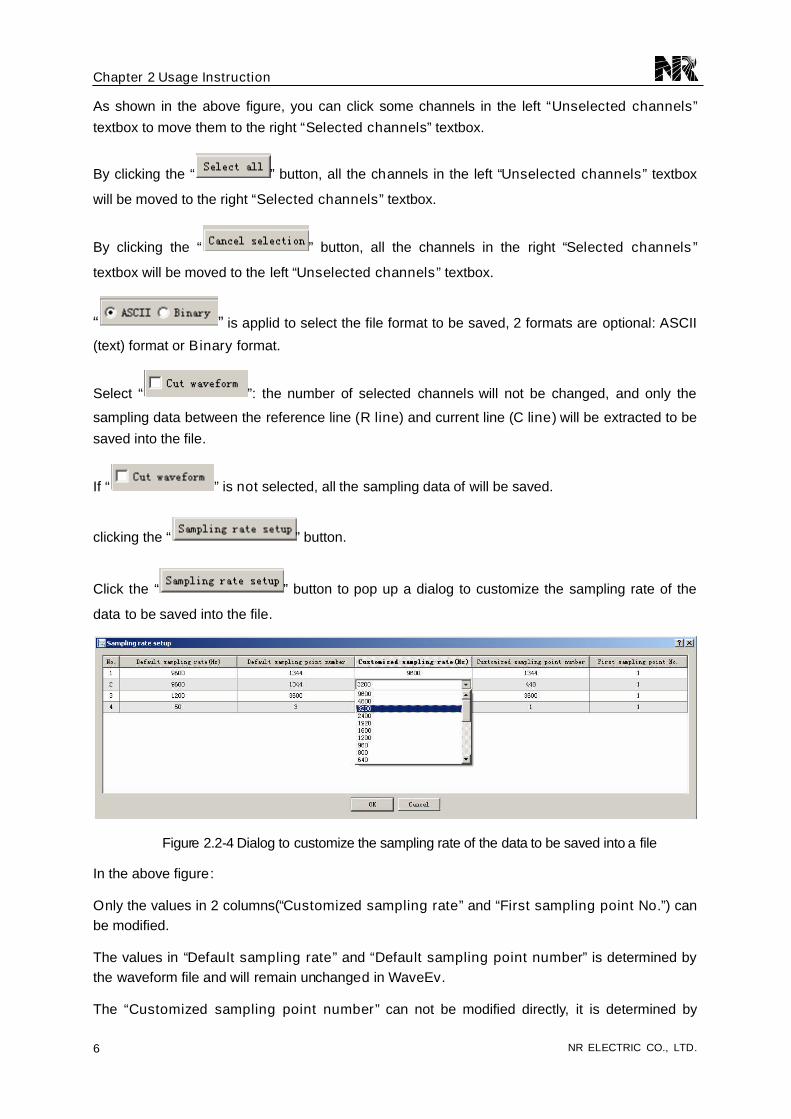
Click the “ ”button to pop up a dialog to customize the sampling rate of the
data to be saved into the file.
Figure 2.2-4 Dialog to customize the sampling rate of the data to be saved into a file
In the above figure:
Only the values in 2 columns(“Customized sampling rate”and “First sampling point No.”) canbe modified.
The values in “Default sampling rate”and “Default sampling point number”is determined bythe waveform file and will remain unchanged in WaveEv.
The “Customized sampling point number”can not be modified directly, it is determined by

Chapter 2 Usage Instruction
NR ELECTRIC CO., LTD. 7
configuring “Customized sampling rate”. E.g.: if the “Default sampling rate”is 9600Hz, and the
“Default sampling point number”=1344, when “Customized sampling rate”=3200Hz, so“Customized sampling point number”will be modified as 448 by WaveEv automatically.
NOTE:In the above figure, the “Default sampling rate”is the original sampling rate of
the waveform file, and it can not be modified here. The “Customized sampling rate”isapplied to customize the sampling rate of the sampling data to be saved into the file, the
“Customized sampling rate”must be 1/N of the “Default sampling rate”, (N is a
positive integer).
The “First sampling point No.”is applied to select the start point No. of the sampling
data. “First sampling point No.” must >=1 and <=N (=N=“Default samplingrate”/“Customized sampling rate”) E.g.: if the “Default sampling rate”=9600Hz, and
the “Customized sampling rate”=3200Hz, N=9600Hz/3200Hz=3, so “First sampling
point No.”can be customized as 1,2 or 3.
2.2.4 Merge Waveform
Click the menu “File”->“Merge waveform… ”or click the button
in the toolbar to open the dialog box of “Waveform merge”.
Figure 2.2-5 Dialog box of “Waveform merge”
Respectively open waveform file 1 and waveform file 2 that are needed to be merged, and
double-click the channels which need to be merged. Finally, select appropriate time strategy andfile format for merged waveform file. Details are introduced as below:
Chapter 2 Usage Instruction
NR ELECTRIC CO., LTD.8
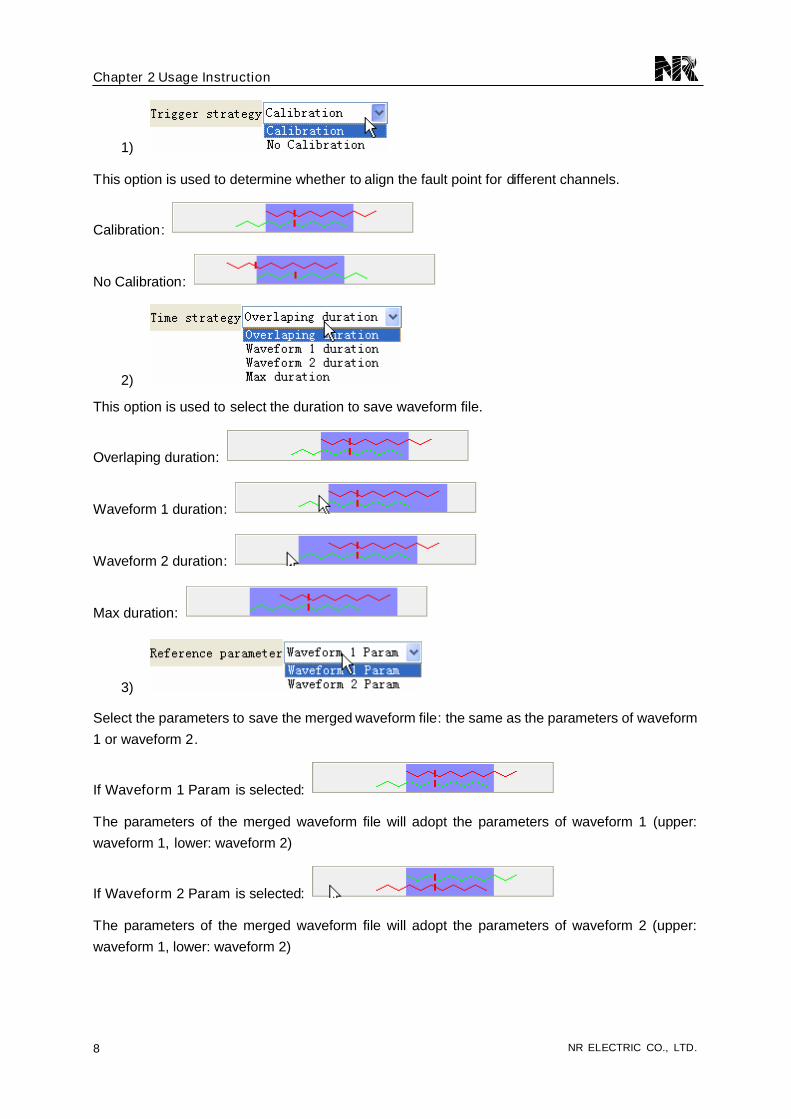
1)
This option is used to determine whether to align the fault point for different channels.
Calibration:
No Calibration:
2)
This option is used to select the duration to save waveform file.
Overlaping duration:
Waveform 1 duration:
Waveform 2 duration:
Max duration:
3)
Select the parameters to save the merged waveform file: the same as the parameters of waveform
1 or waveform 2.
If Waveform 1 Param is selected:
The parameters of the merged waveform file will adopt the parameters of waveform 1 (upper:
waveform 1, lower: waveform 2)
If Waveform 2 Param is selected:
The parameters of the merged waveform file will adopt the parameters of waveform 2 (upper:
waveform 1, lower: waveform 2)

Chapter 2 Usage Instruction
NR ELECTRIC CO., LTD. 9
4)
Select the format of merged waveform file: BINARY or ASCII.
Click the button “Merge”to pop up the dialog box of “Save merged file”.
Figure 2.2-6 Dialog to save merged file
A prompt dialog will pop up when the merged file is saved successfully.
Figure 2.2-7 Dialog to prompt successful file mergence
2.3 Waveform Display
2.3.1 Display
After opening a waveform file, the waveform will be displayed automatically as shown in the
following figure.

Chapter 2 Usage Instruction
NR ELECTRIC CO., LTD.10
Figure 2.3-1 Introduction of waveform interface
After opening a waveform, 8 areas and 3 vertical time scale lines will be automatically displayed as
shown in the above figure. The information windows can be displayed by operating on the menu
bar or toolbar.
2.3.1.1 Eight Areas
1) Menu bar
2) Toolbar
3) Name area of analog channel
The name area of analog channel displays the name of each analog channel and the data valuesof R line/C line. The color of R line data are the same as the color of R line, and the color of C
line data are the same as the color of C line. The waveform may be zoomed in/out by changingthe maximum scale of the horizontal coordinate. The display amplitude of a channel may be
changed by zooming in/out the channel height through the right-click menu.
4) Waveform display area of analog channel
The waveform display area of analog channel displays the waveforms of all analog channels andthe label of analog waveform. The default heights of waveforms of all channels are equal.
5) Name area of digital channel
The name area of digital channel is used to display the name of each digital channel, and two
colors are available to display alternatively.
6) Waveform display area of digital channel
The waveform display area of digital channel displays the waveforms of all digital channels and the
Chapter 2 Usage Instruction
NR ELECTRIC CO., LTD. 11
label of digital waveform. The status “1”is shown as the grid block. In this area, the status value of
each digital channel is displayed near C line. The changed status value is displayed by default.
7) Time axis area
The time axis area displays the relative time of each sampling point.
8) Status area
The status area displays the point No., absolute time and relative time (compared to trigger line)
of R line, and the point No., absolute time and relative time(compared to trigger line)of C line.
2.3.1.2 Three Time Scale Line
1) The line at the time scale that the fault started, i.e.: the trigger line (T line for short).
2) Current time scale line (C line for short).
3) Reference time line (R line for short).
C line can be moved by clicking the left mouse button.
R line can be moved by clicking the right mouse button.
The T line can be shown or hidden by clicking the submenu “Show/Hide trigger line”in the menu“View”.
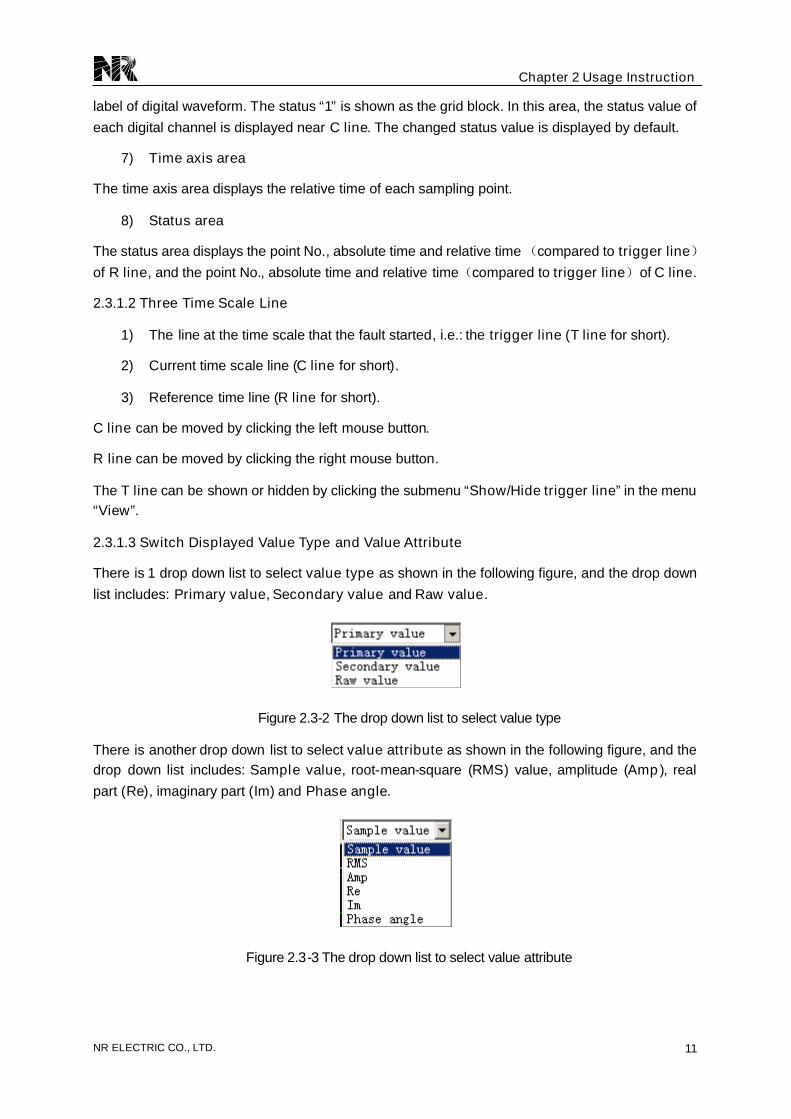
2.3.1.3 Switch Displayed Value Type and Value Attribute
There is 1 drop down list to select value type as shown in the following figure, and the drop down
list includes: Primary value, Secondary value and Raw value.
Figure 2.3-2 The drop down list to select value type
There is another drop down list to select value attribute as shown in the following figure, and thedrop down list includes: Sample value, root-mean-square (RMS) value, amplitude (Amp), real
part (Re), imaginary part (Im) and Phase angle.
Figure 2.3-3 The drop down list to select value attribute
Chapter 2 Usage Instruction
NR ELECTRIC CO., LTD.12
2.3.1.4 Move R line and C line
R line can be moved horizontally by clicking the right mouse button.
C line can be moved horizontally by clicking the left mouse button.
Figure 2.3-4 R line and C line
2.3.1.5 Fine Adjustment of R line and C line
The position of R line and C line can be fine adjusted by the menu or shortcut key. Each fine
adjustment corresponds to 1 sampling point.
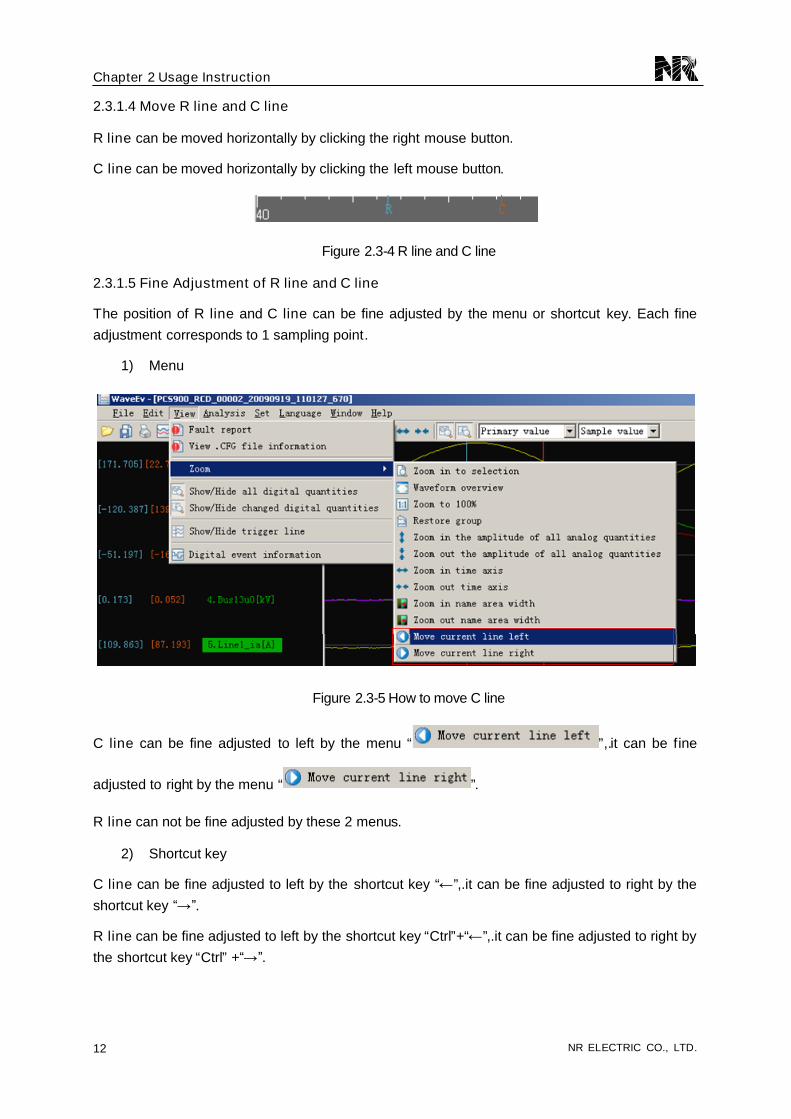
1) Menu
Figure 2.3-5 How to move C line
C line can be fine adjusted to left by the menu “ ”,.it can be fine
adjusted to right by the menu “ ”.
R line can not be fine adjusted by these 2 menus.
2) Shortcut key
C line can be fine adjusted to left by the shortcut key “← ”,.it can be fine adjusted to right by the
shortcut key “→ ”.
R line can be fine adjusted to left by the shortcut key “Ctrl”+“← ”,.it can be fine adjusted to right by
the shortcut key “Ctrl”+“→ ”.

Chapter 2 Usage Instruction
NR ELECTRIC CO., LTD. 13
2.3.1.6 Display Multiple Waveform
Multiple waveforms can be opened and displayed in multiple windows
Tile and cascade
Figure 2.3-6 Tile display of waveform
Figure 2.3-7 Cascade display of waveform
Chapter 2 Usage Instruction
NR ELECTRIC CO., LTD.14
2.3.2 Waveform Display Operation
2.3.2.1 Restore Default Setup of Channel
Select “View”->“Zoom”->“Restore group”or “Set”->“Restore group”in the menu, and the grouping,
color, line style and line width, etc. of the analog quantities and digital quantities may be restoredto default state.
2.3.2.2 Zoom Function
The zoom function includes:
1) Time axis zoom (Zoom in time axis/Zoom out time axis)
2) Amplitude zoom of all channels
3) Overall zoom of name area (Zoom in name area width/Zoom out name area width)
4) Amplitude zoom of single channel (Zoom in waveform amplitude/Zoom out waveformamplitude)
5) Display area zooming
6) Selected area zoom (Zoom in to selection)
1. Time axis zoom
Three methods are available for the waveform zoom in the time axis:
1) Select the “View”->“Zoom”->“Zoom in time axis”and “Zoom out time axis”in the menu
2) Toolbar button
3) “Shift”+“mouse wheel”
In zoom process, keep the current point always in the display area.
2. Amplitude zoom of all channels
Three methods are available to zoom in/out all the analog quantities vertically:
1) Select the “View”->“Zoom”->“Zoom in the amplitude of all analog quantities”and “Zoom out
the amplitude of all analog quantities”in the menu.
2) Toolbar button
3) “Ctrl”+“mouse wheel”
Only 1 method is available to zoom in/out all the digital quantities vertically:
“Ctrl”+“mouse wheel”.
3. Zoom of name area
Two methods are available to zoom in/out the name area:
Chapter 2 Usage Instruction
NR ELECTRIC CO., LTD. 15
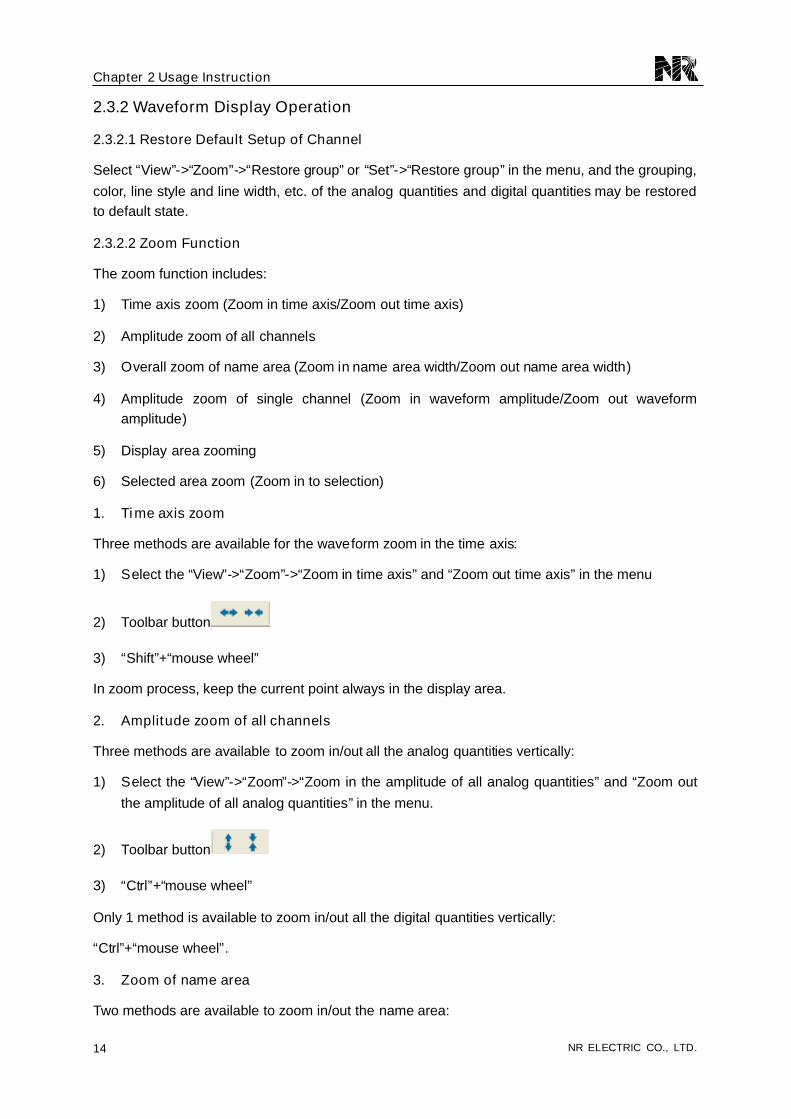
1) Select the “View”->“Zoom”->“Zoom in name area width”and “Zoom out name area width”in
the menu as shown in the following figure.
2) Drag the splitter bar with mouse.
Figure 2.3-8 Zoom in/out name area width
4. Amplitude zoom of single analog channel
Two methods are provided to zoom in/out the amplitude of single analog channel:
1) Select an analog channel and click the right mouse button to pop up a menu. Click the
command menu “Zoom in waveform amplitude”to zoom in the analog waveform amplitude,click the command menu “Zoom out waveform amplitude”to zoom out the analog waveform
amplitude.
2) Click the zoom-in button to zoom in the analog waveform amplitude, click the zoom-out
button to zoom out the analog waveform amplitude.
NOTE:In the first method, i.e.: clicking the command menu “Zoom in waveform
amplitude”/“Zoom out waveform amplitude”, both the channel height and the analog
Chapter 2 Usage Instruction
NR ELECTRIC CO., LTD.16
amplitude of the selected analog channel will be zoomed in/out.
In the second method, i.e.: clicking zoom-in button or the zoom-out button ,
only the analog amplitude of the selected analog channel will be zoomed in/out,but the channel height of the selected analog channel will remain unchanged.
Please refer to the following 4 figures to see the difference between these 2 methods.
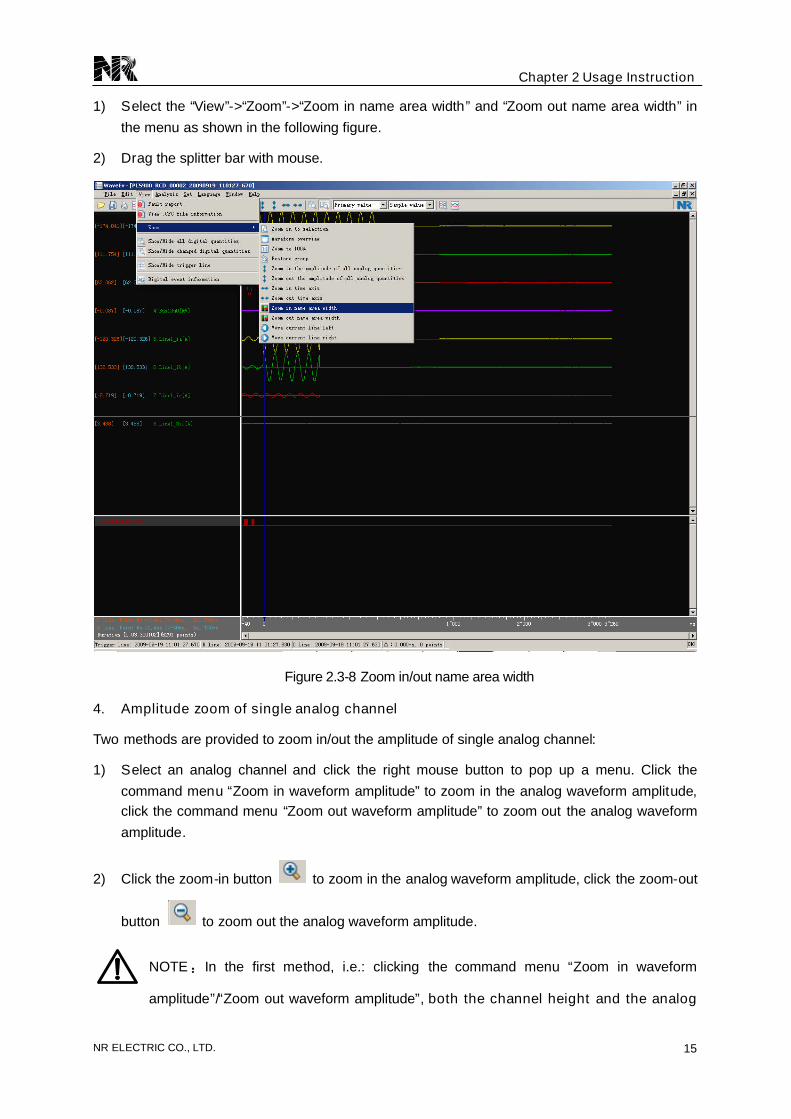
How to access the command menu “Zoom in waveform amplitude”is shown in the following figure.
The waveform of “Bus1ua”before clicking the command menu “Zoom in waveform amplitude”isalso shown in this figure.
Figure 2.3-9 The waveform of “Bus1ua”before clicking “Zoom in waveform amplitude”
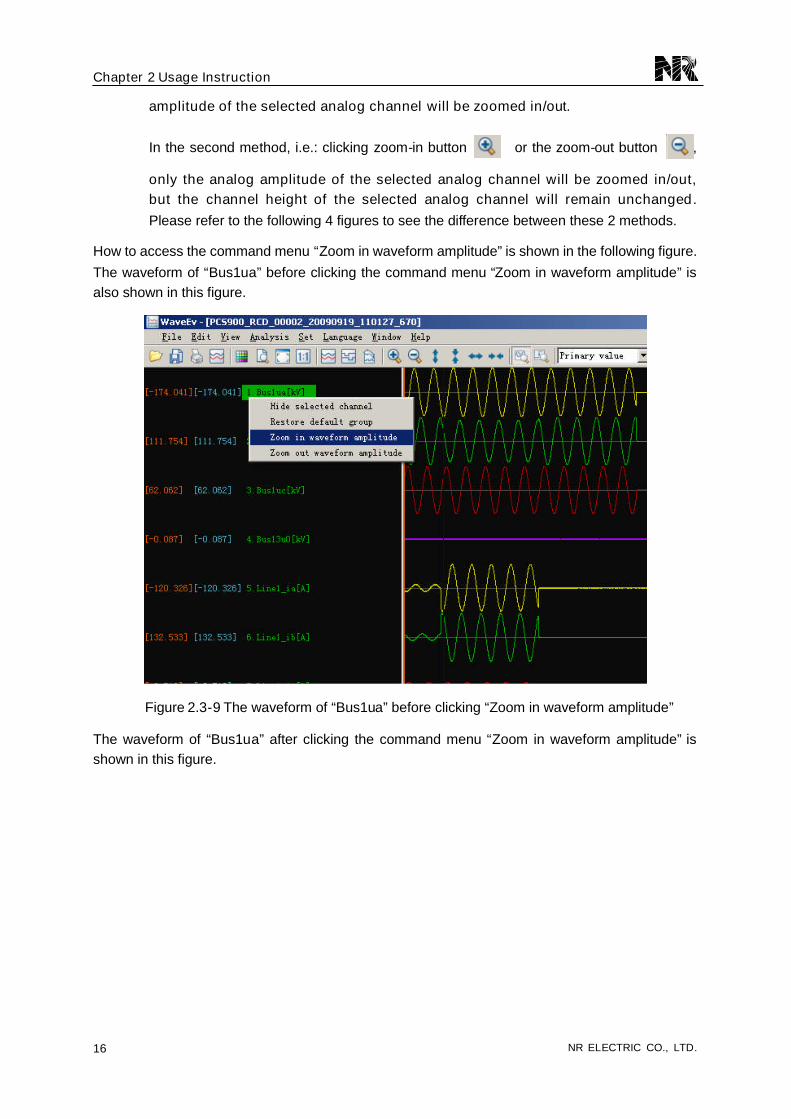
The waveform of “Bus1ua”after clicking the command menu “Zoom in waveform amplitude”isshown in this figure.
Chapter 2 Usage Instruction
NR ELECTRIC CO., LTD. 17
Figure 2.3-10 The waveform of “Bus1ua”after clicking “Zoom in waveform amplitude”
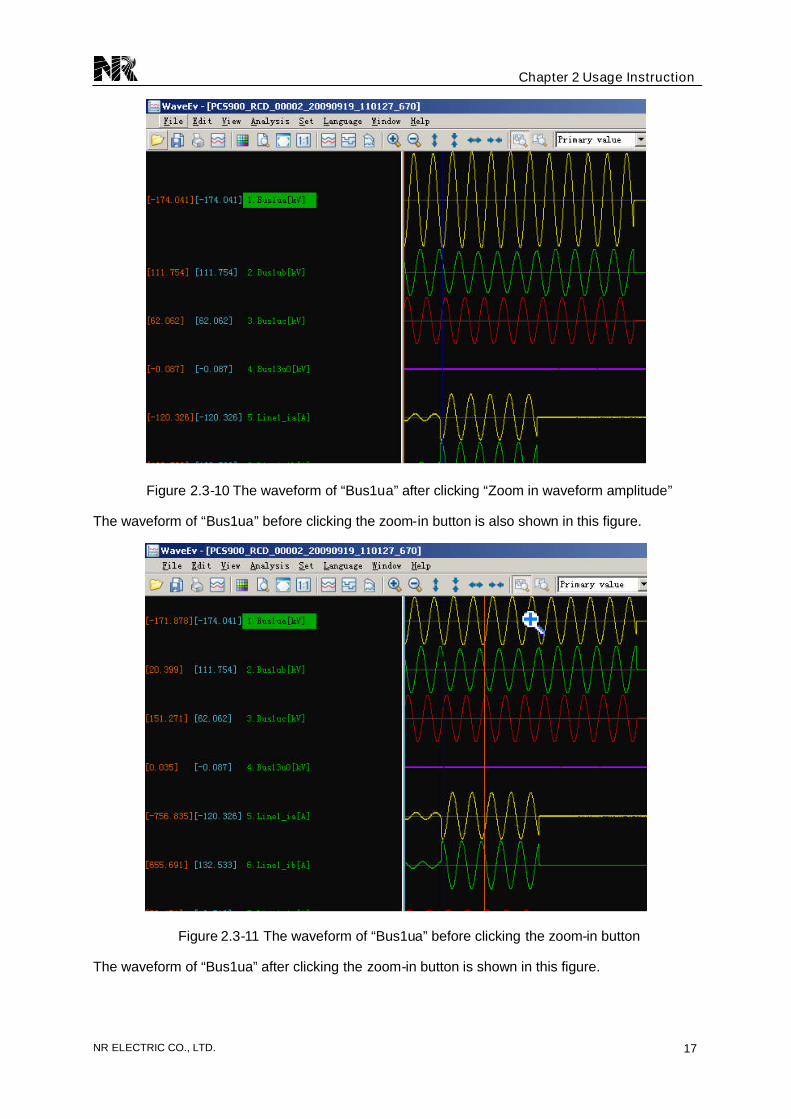
The waveform of “Bus1ua”before clicking the zoom-in button is also shown in this figure.
Figure 2.3-11 The waveform of “Bus1ua”before clicking the zoom-in button
The waveform of “Bus1ua”after clicking the zoom-in button is shown in this figure.
Chapter 2 Usage Instruction
NR ELECTRIC CO., LTD.18
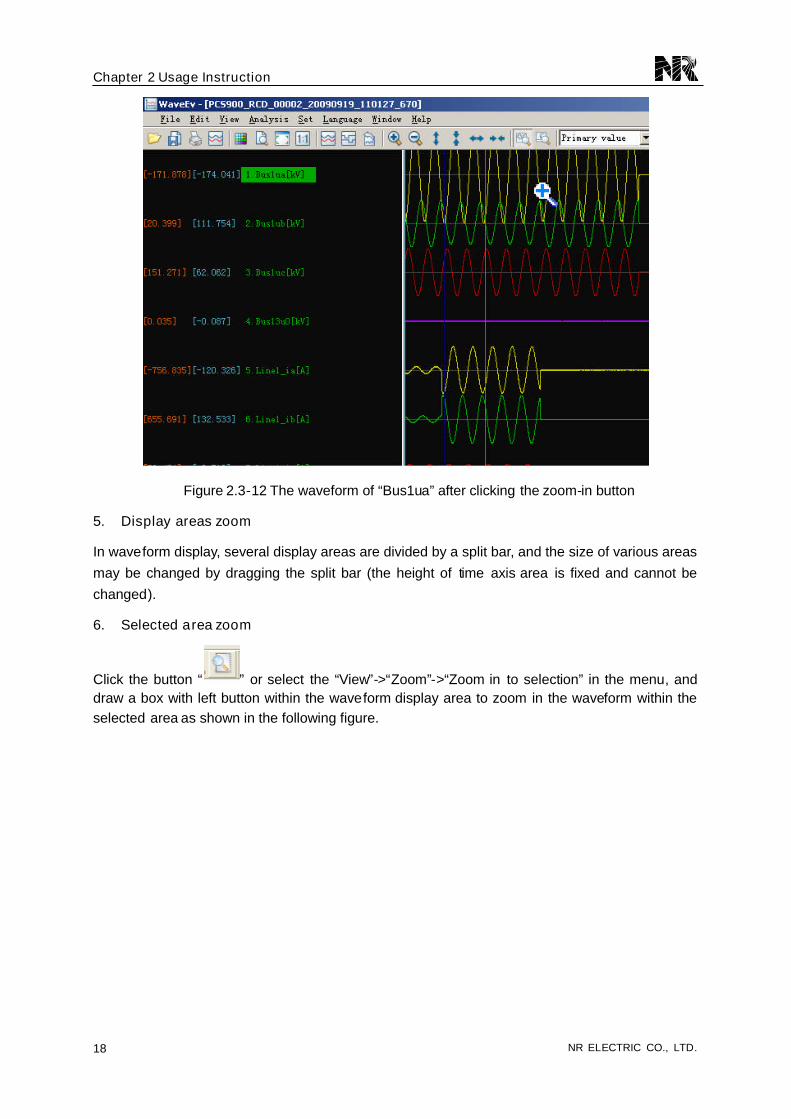
Figure 2.3-12 The waveform of “Bus1ua”after clicking the zoom-in button
5. Display areas zoom
In waveform display, several display areas are divided by a split bar, and the size of various areas
may be changed by dragging the split bar (the height of time axis area is fixed and cannot be
changed).
6. Selected area zoom
Click the button “ ”or select the “View”->“Zoom”->“Zoom in to selection”in the menu, anddraw a box with left button within the waveform display area to zoom in the waveform within theselected area as shown in the following figure.
Chapter 2 Usage Instruction
NR ELECTRIC CO., LTD. 19
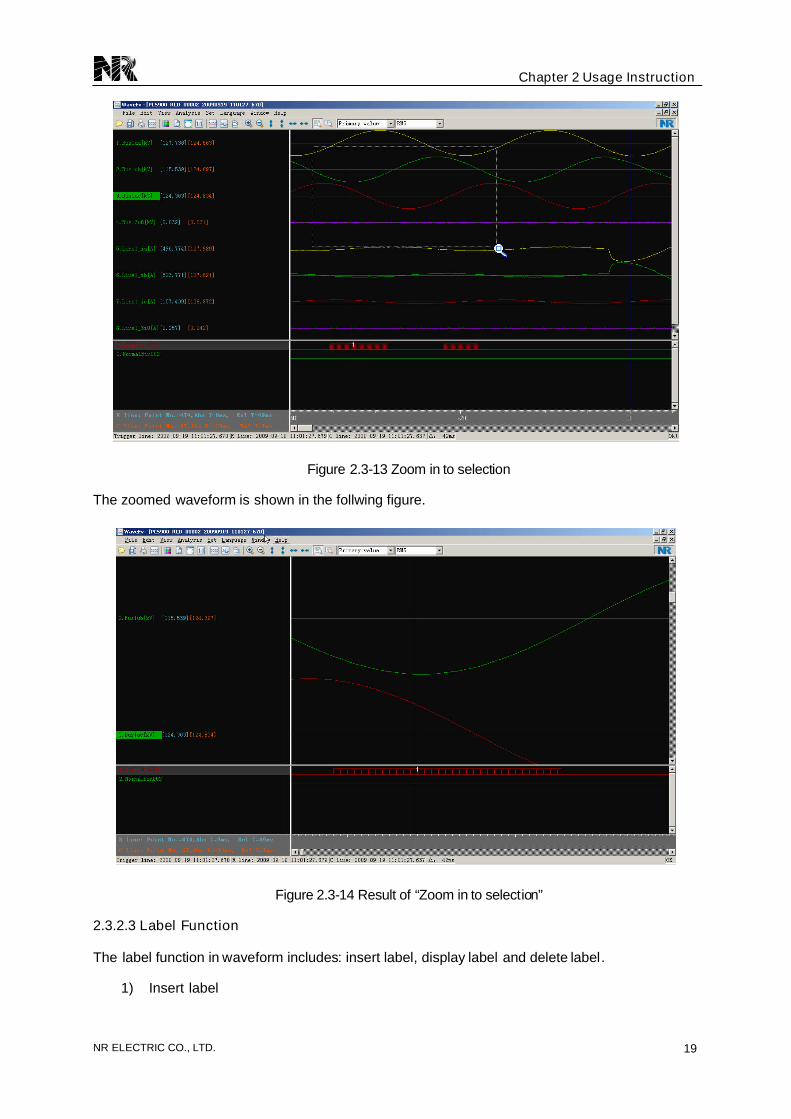
Figure 2.3-13 Zoom in to selection
The zoomed waveform is shown in the follwing figure.
Figure 2.3-14 Result of “Zoom in to selection”
2.3.2.3 Label Function
The label function in waveform includes: insert label, display label and delete label.
1) Insert label
Chapter 2 Usage Instruction
NR ELECTRIC CO., LTD.20
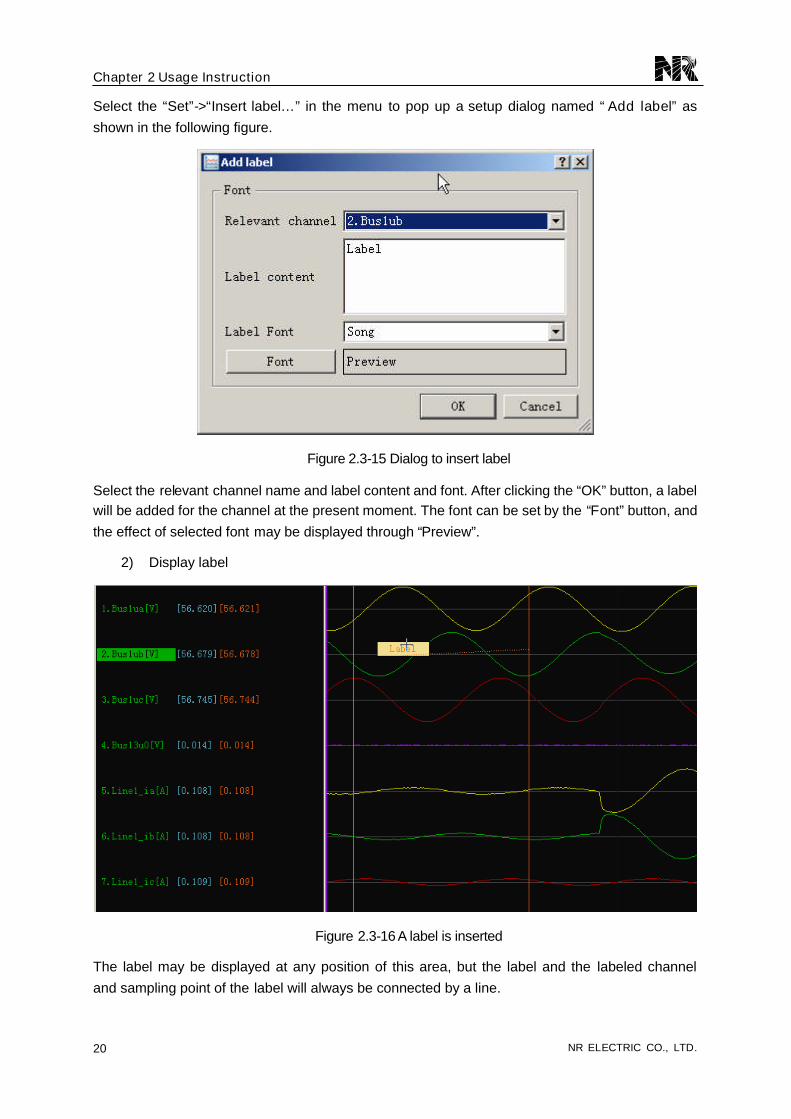
Select the “Set”->“Insert label… ”in the menu to pop up a setup dialog named “Add label”as
shown in the following figure.
Figure 2.3-15 Dialog to insert label
Select the relevant channel name and label content and font. After clicking the “OK”button, a labelwill be added for the channel at the present moment. The font can be set by the “Font”button, and
the effect of selected font may be displayed through “Preview”.
2) Display label
Figure 2.3-16 A label is inserted
The label may be displayed at any position of this area, but the label and the labeled channel
and sampling point of the label will always be connected by a line.

Chapter 2 Usage Instruction
NR ELECTRIC CO., LTD. 21
3) Browse, delete and modify label
Select “Set”->“Browse label… ”in the menu to browse the label.
The label may be either deleted or modified directly in the label browser.
Figure 2.3-17 Label browser
2.3.2.4 Group Function
The group function includes: Group analog channel and Group digital channel.
1) Group analog channel
Select “Set”->“Group analog quantity… ”in the menu to pop up a dialog box as shown in thefollowing figure.
Chapter 2 Usage Instruction
NR ELECTRIC CO., LTD.22
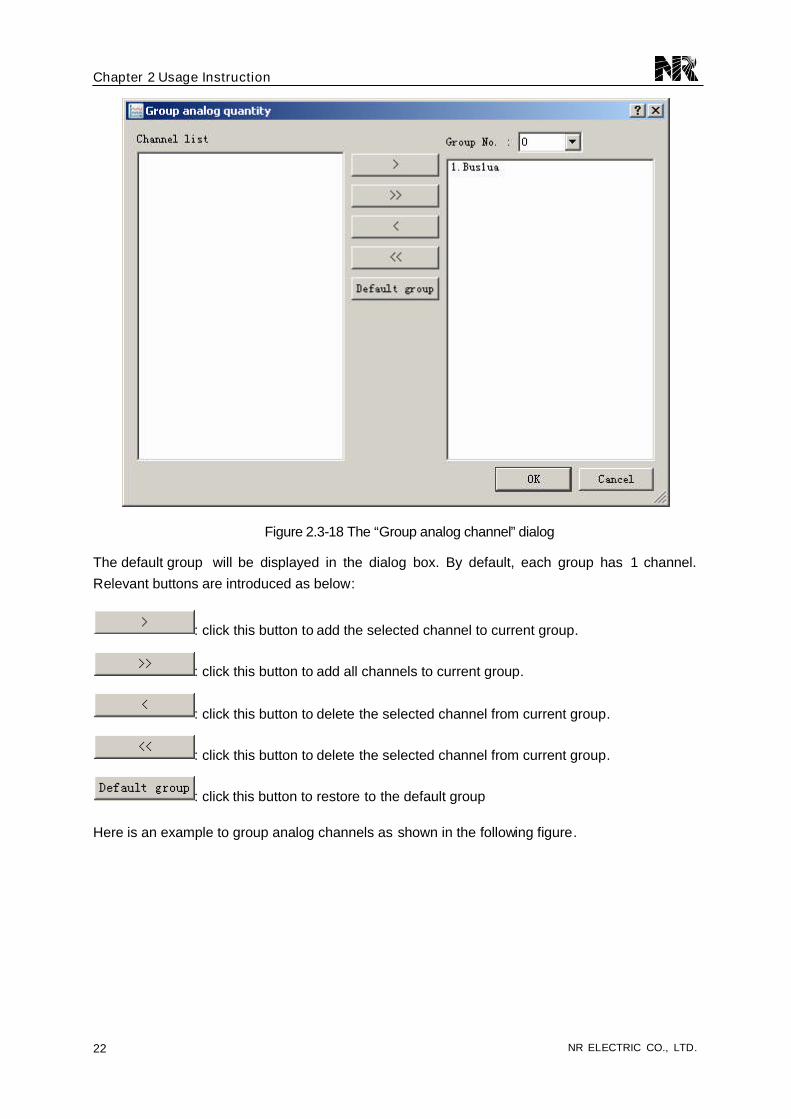
Figure 2.3-18 The “Group analog channel”dialog
The default group will be displayed in the dialog box. By default, each group has 1 channel.
Relevant buttons are introduced as below:
: click this button to add the selected channel to current group.
: click this button to add all channels to current group.
: click this button to delete the selected channel from current group.
: click this button to delete the selected channel from current group.
: click this button to restore to the default group
Here is an example to group analog channels as shown in the following figure.

Chapter 2 Usage Instruction
NR ELECTRIC CO., LTD. 23
Figure 2.3-19 An example to group analog channels
Click the button “OK”to display the main interface of WaveEv as shown in the following figure.
Figure 2.3-20 Main interface with grouped analog channels
2) Group digital channel
Chapter 2 Usage Instruction
NR ELECTRIC CO., LTD.24
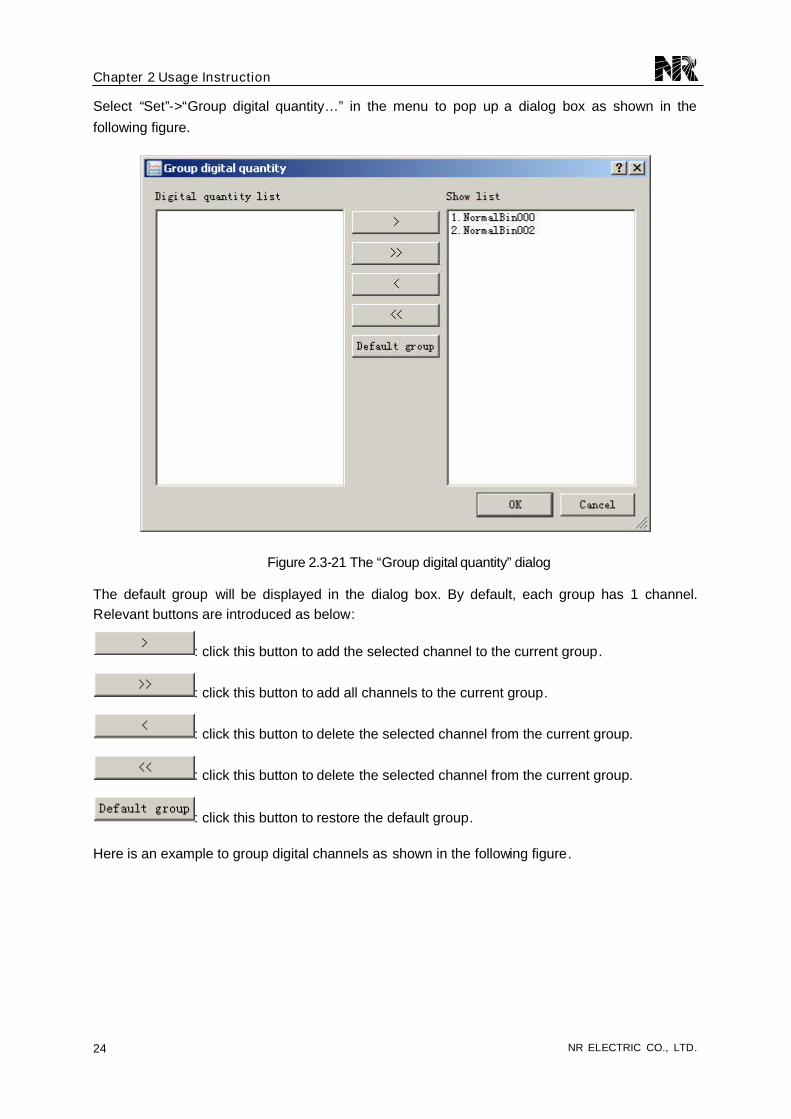
Select “Set”->“Group digital quantity… ”in the menu to pop up a dialog box as shown in the
following figure.
Figure 2.3-21 The “Group digital quantity”dialog
The default group will be displayed in the dialog box. By default, each group has 1 channel.Relevant buttons are introduced as below:
: click this button to add the selected channel to the current group.
: click this button to add all channels to the current group.
: click this button to delete the selected channel from the current group.
: click this button to delete the selected channel from the current group.
: click this button to restore the default group.
Here is an example to group digital channels as shown in the following figure.

Chapter 2 Usage Instruction
NR ELECTRIC CO., LTD. 25
Figure 2.3-22 An example to group digital channels
Click the button “OK”to display the main interface of WaveEv as shown in the following figure.
Figure 2.3-23 Main interface with grouped digital channels
Chapter 2 Usage Instruction
NR ELECTRIC CO., LTD.26
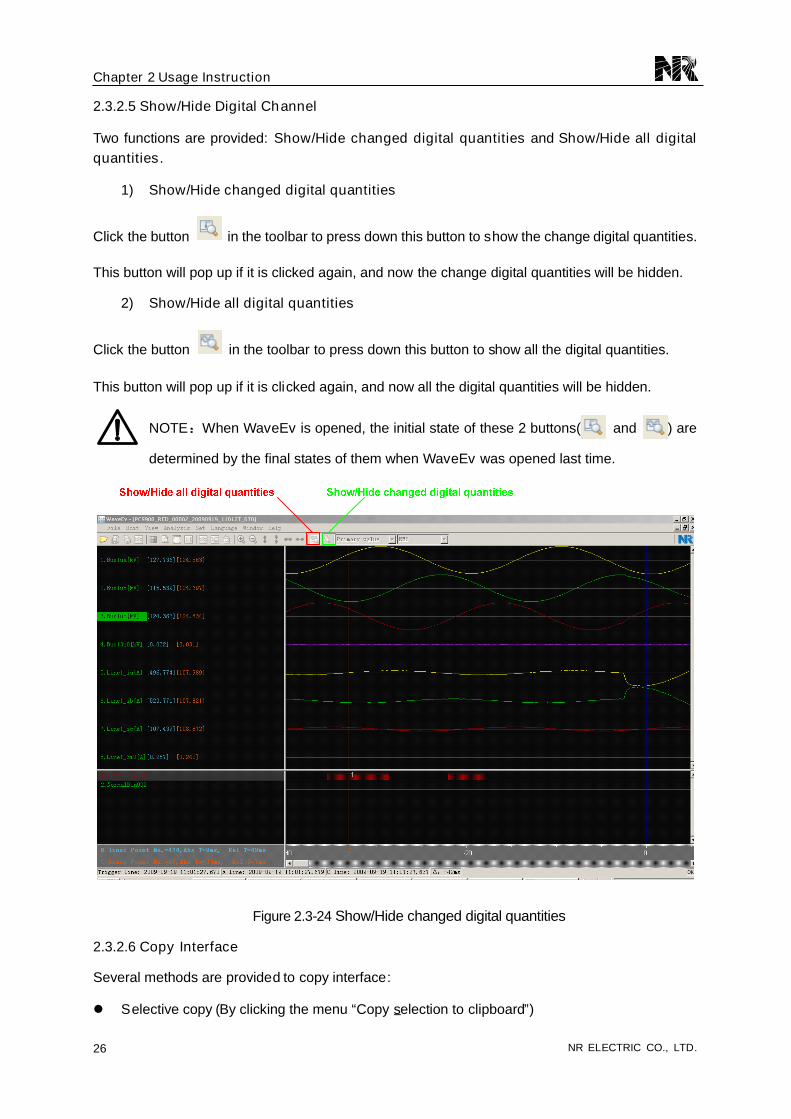
2.3.2.5 Show/Hide Digital Channel
Two functions are provided: Show/Hide changed digital quantities and Show/Hide all digitalquantities.
1) Show/Hide changed digital quantities
Click the button in the toolbar to press down this button to show the change digital quantities.
This button will pop up if it is clicked again, and now the change digital quantities will be hidden.
2) Show/Hide all digital quantities
Click the button in the toolbar to press down this button to show all the digital quantities.
This button will pop up if it is clicked again, and now all the digital quantities will be hidden.
NOTE:When WaveEv is opened, the initial state of these 2 buttons( and ) are
determined by the final states of them when WaveEv was opened last time.
Figure 2.3-24 Show/Hide changed digital quantities
2.3.2.6 Copy Interface
Several methods are provided to copy interface:
Selective copy (By clicking the menu “Copy selection to clipboard”)
Chapter 2 Usage Instruction
NR ELECTRIC CO., LTD. 27
Area copy (By clicking the menu “Copy area to clipboard… ”)
Analog channel copy (By clicking the menu “Copy waveform to clipboard… ”)
Digital channel copy (By clicking the menu “Copy waveform to clipboard… ”)
Total waveforms copy (By clicking the menu “Copy waveform to clipboard… ) ”
The copy result is saved in the clipboard in the form of bitmap.
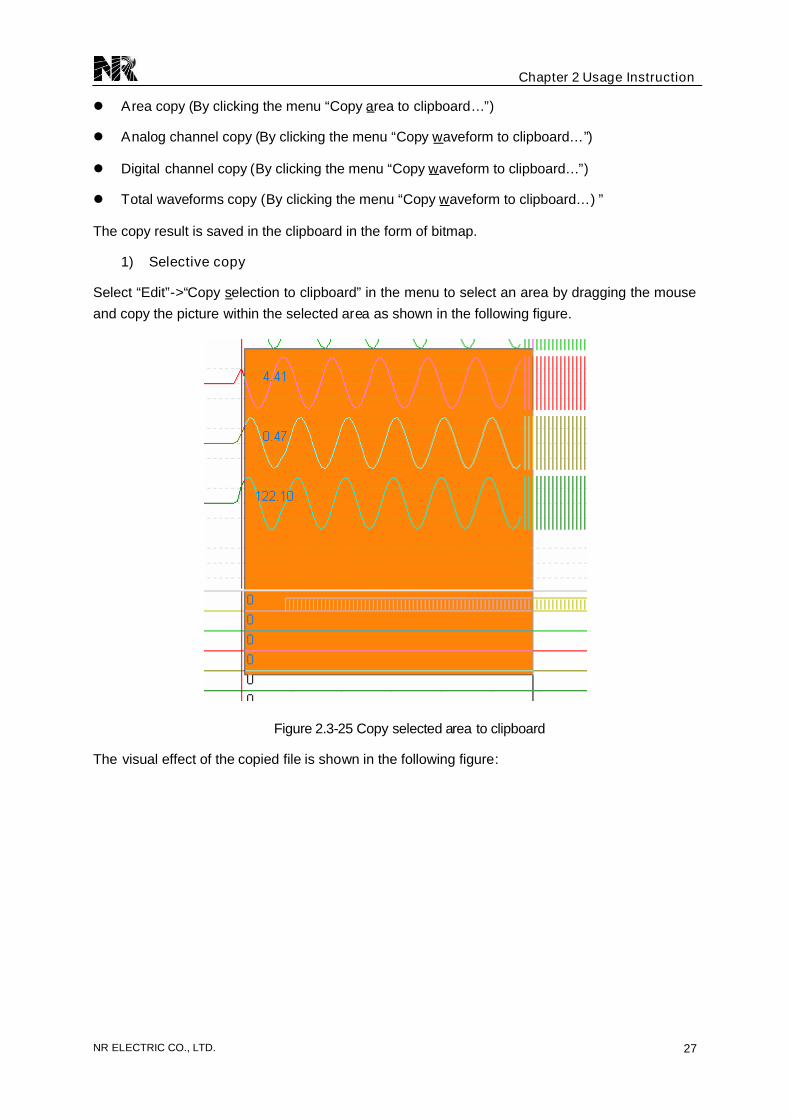
1) Selective copy
Select “Edit”->“Copy selection to clipboard”in the menu to select an area by dragging the mouse
and copy the picture within the selected area as shown in the following figure.
Figure 2.3-25 Copy selected area to clipboard
The visual effect of the copied file is shown in the following figure:
Chapter 2 Usage Instruction
NR ELECTRIC CO., LTD.28
Figure 2.3-26 The visual effect of the copied file by clicking “Copy selection to clipboard”
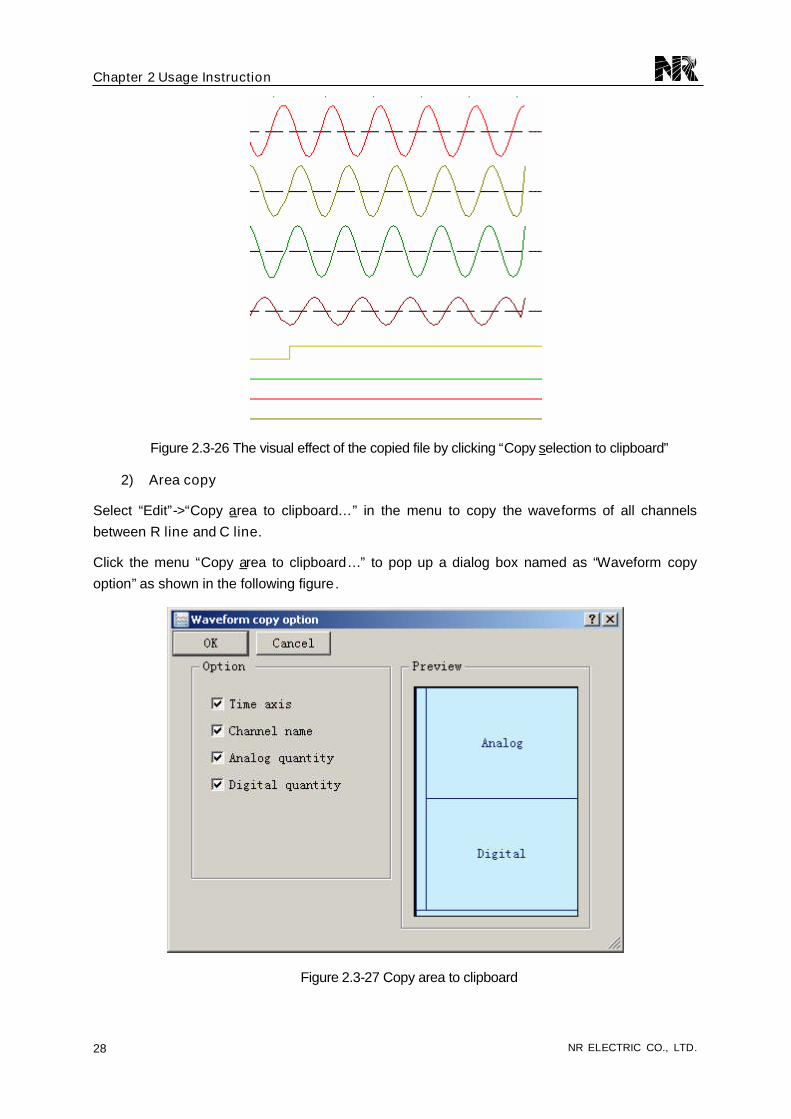
2) Area copy
Select “Edit”->“Copy area to clipboard… ”in the menu to copy the waveforms of all channels
between R line and C line.
Click the menu “Copy area to clipboard… ”to pop up a dialog box named as “Waveform copy
option”as shown in the following figure.
Figure 2.3-27 Copy area to clipboard

Chapter 2 Usage Instruction
NR ELECTRIC CO., LTD. 29
Area copy is applied to copy the waveforms of all channels between R line and C line as shown in
the following figure.
Figure 2.3-28 An example to show R line and C line
The visual effect of the copied file is shown in the following figure:
Figure 2.3-29 The visual effect of the copied file by clicking “Copy area to clipboard”
3) Total waveforms copy
Select “Edit”->“Copy waveform to clipboard… ”in the menu to copy the waveforms of all channels.
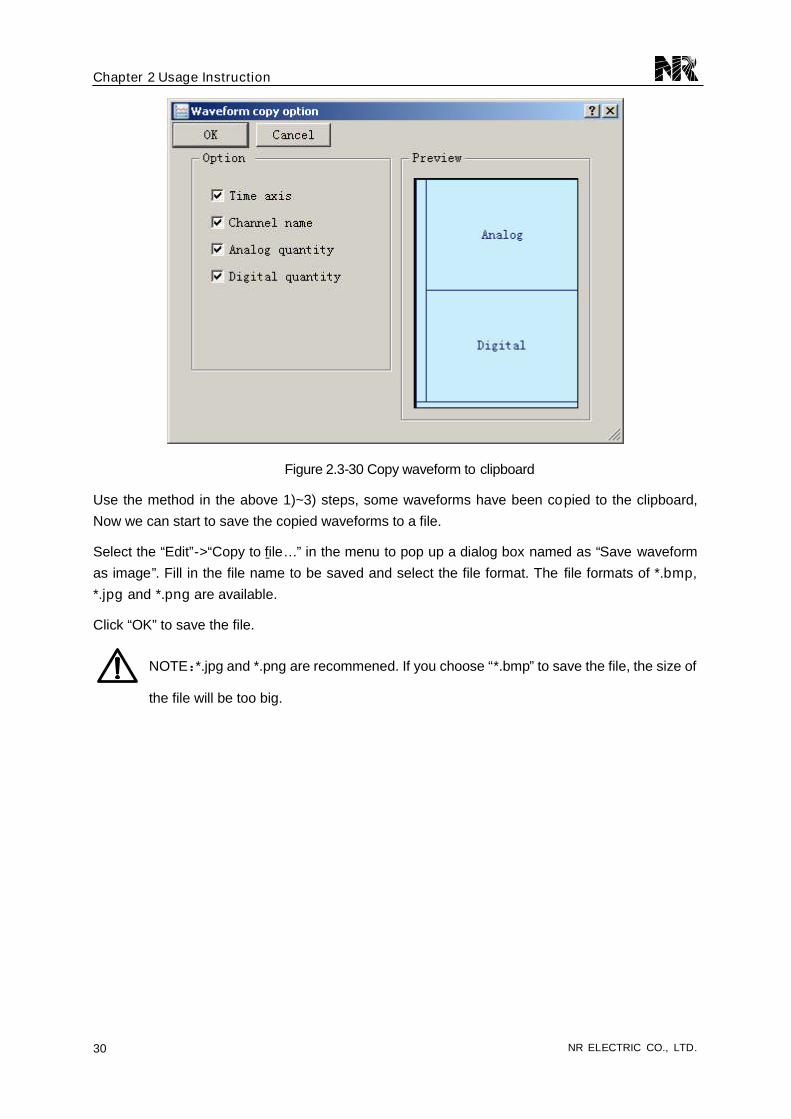
Click the menu “Copy waveform to clipboard… ”to pop up a dialog box named as “Waveform copy
option”will pop up as shown in the following figure.
In the folliwng figure, if “Time axis”is selected, the time axis will be included in the clipboard.
if “Channel name”is selected, the channel name will be included in the clipboard.
if “Analog quantity”is selected, the analog channels will be included in the clipboard.
if “Digital quantity”is selected, the digital channels will be included in the clipboard.
Chapter 2 Usage Instruction
NR ELECTRIC CO., LTD.30
Figure 2.3-30 Copy waveform to clipboard
Use the method in the above 1)~3) steps, some waveforms have been copied to the clipboard,
Now we can start to save the copied waveforms to a file.
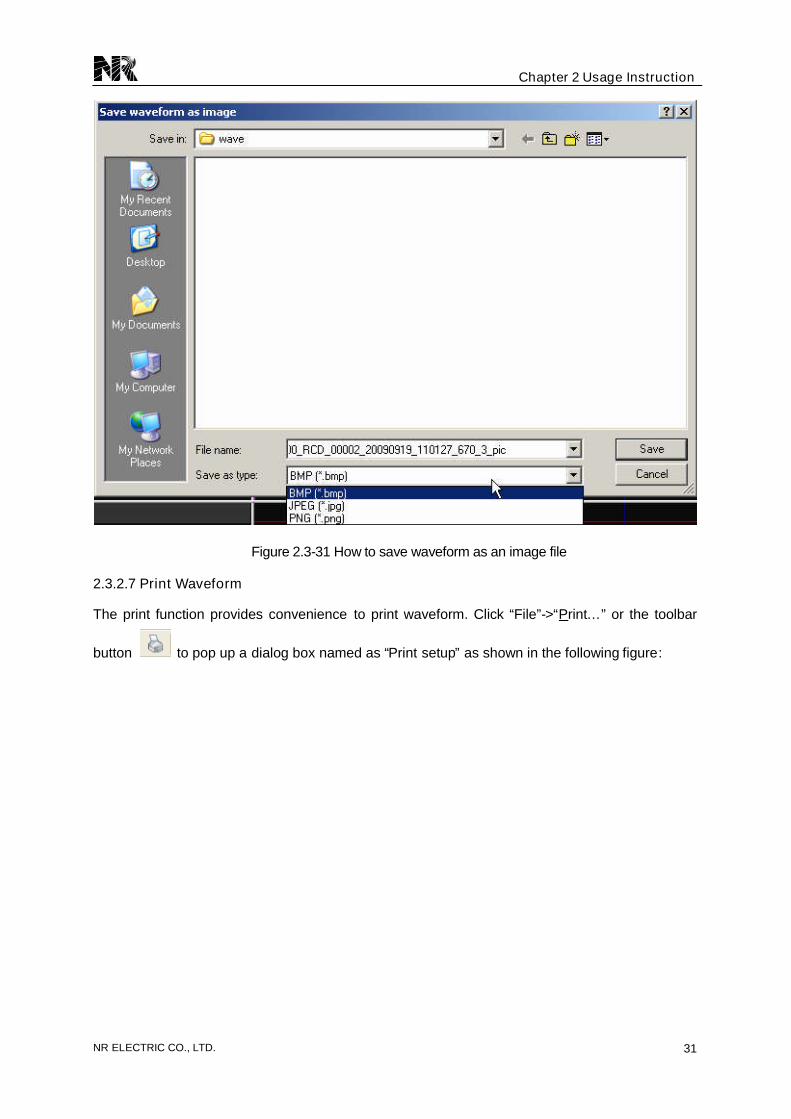
Select the “Edit”->“Copy to file… ”in the menu to pop up a dialog box named as “Save waveform
as image”. Fill in the file name to be saved and select the file format. The file formats of *.bmp,
*.jpg and *.png are available.
Click “OK”to save the file.
NOTE:*.jpg and *.png are recommened. If you choose “*.bmp”to save the file, the size of
the file will be too big.
Chapter 2 Usage Instruction
NR ELECTRIC CO., LTD. 31
Figure 2.3-31 How to save waveform as an image file
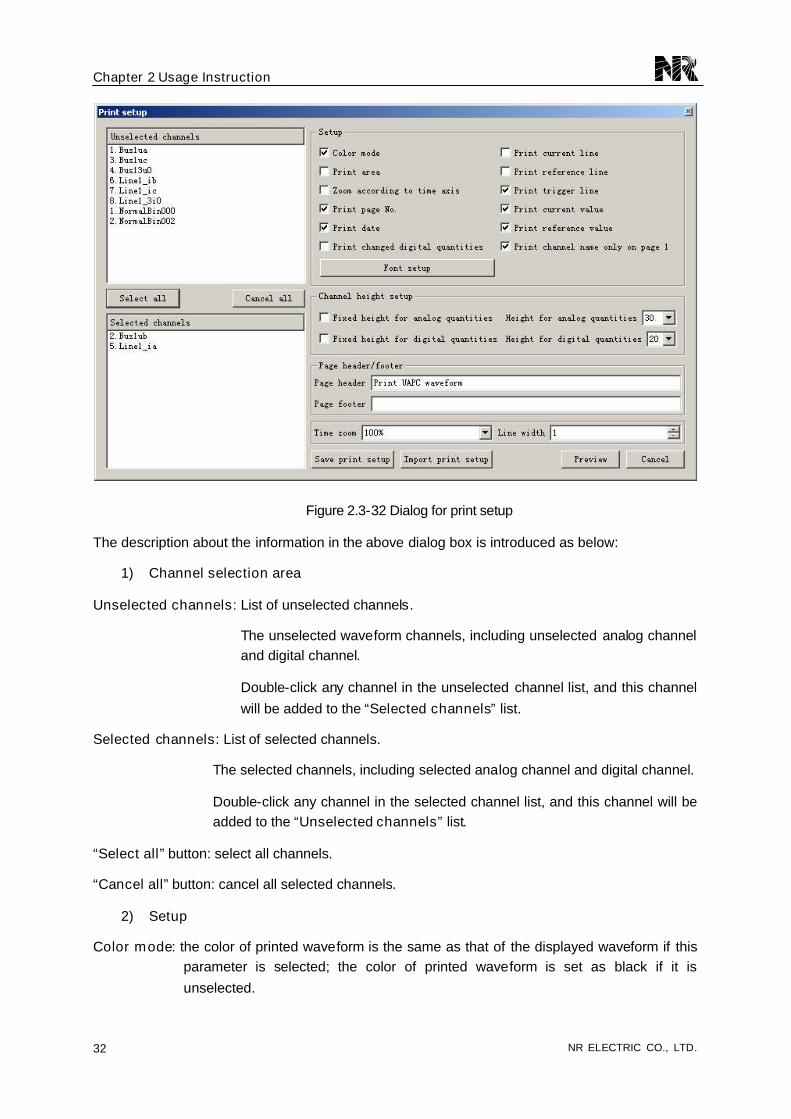
2.3.2.7 Print Waveform
The print function provides convenience to print waveform. Click “File”->“Print… ”or the toolbar
button to pop up a dialog box named as “Print setup”as shown in the following figure:
Chapter 2 Usage Instruction
NR ELECTRIC CO., LTD.32
Figure 2.3-32 Dialog for print setup
The description about the information in the above dialog box is introduced as below:
1) Channel selection area
Unselected channels: List of unselected channels.
The unselected waveform channels, including unselected analog channeland digital channel.
Double-click any channel in the unselected channel list, and this channel
will be added to the “Selected channels”list.
Selected channels: List of selected channels.
The selected channels, including selected analog channel and digital channel.
Double-click any channel in the selected channel list, and this channel will beadded to the “Unselected channels”list.
“Select all”button: select all channels.
“Cancel all”button: cancel all selected channels.
2) Setup
Color mode: the color of printed waveform is the same as that of the displayed waveform if thisparameter is selected; the color of printed waveform is set as black if it is
unselected.

Chapter 2 Usage Instruction
NR ELECTRIC CO., LTD. 33
Print area: the waveform between R line and C line will be printed if this parameter is selected; all
the waveforms will be printed if it is unselected.
Zoom according to time axis: the zoom scale is the same as the time axis displayed waveform if
this parameter is selected; to be zoomed according to the scaleset in the following “Time zoom”if it is unselected.
Print page No.: the page number will be printed if this parameter is selected; no page number willbe printed if it is unselected.
Print date: the current date will be printed if this parameter is selected; no current date will beprinted if it is unselected.
Print changed digital quantities: only the changed digital quantities will be printed if thisparameter is selected; all the digital quantities will be printed
if it is unselected.
Print current line: C line will be printed if this parameter is selected, and the time axis is marked
with a letter “C”near C line;
C line will not be printed if it is unselected.
Print reference line: R line will be printed if this parameter is selected, and the time axis ismarked with a letter “R”near R line;
R line will not be printed if it is unselected.
Print trigger line: T line will be printed if this parameter is selected, and the time axis is marked
with a letter “T”near T line;
T line will not be printed if it is unselected.
Print current value: the data value of C line will be printed if this parameter is selected; no datavalue of C linewill be printed if it is unselected.
Print reference value: the data value of R line will be printed if this parameter is selected; no datavalue of R line will be printed if it is unselected.
Print channel name only on page 1: the channel name will be only printed in the first page if thisparameter is selected; the channel name will be printed in
each page if it is unselected.
3) Channel height Setup
Fixed height for analog quantities : The height of analog quantities will be fixed to “Height foranalog quantities”.
Fixed height for digital quantities: The height of digital quantities will be fixed to “Height fordigital quantities”.
4) Page header/footer: set the content of page header/footer of the printed page.
Page header: set the content of page header of the printed page.

Chapter 2 Usage Instruction
NR ELECTRIC CO., LTD.34
Page footer: set the content of page footer of the printed page.
5) Time zoom: zoom the time axis according to corresponding proportion.
Line width: set line width of the printed waveform.
When the parameters have been configured succesfully, please click the “Preview”button to pop
up a new page as shown in the following figure:
Figure 2.3-33 Print preview
The buttons on the toolbar is introduced as below:
Print: click “Print”to pop up a dialog box for printing, the printer can be set here.
Print setup: click this menu to pop up a dialog as shown in Figure 2.3-32.
Page setup: set the paper size, orientation for printing (portrait or landscape) and margins, etc.
Zoom in: zoom in the page.
Zoom out: zoom out the page.
<<: switch to previous page.
>>: switch to next page.
Fit to width: make the page display adapt to the maximum visiable width.
Fit to height: make the page display adapt to the maximum visiable height.

Chapter 2 Usage Instruction
NR ELECTRIC CO., LTD. 35
2.4 Waveform Analysis
Various analyses on waveforms can give benefit to fault analysis, which is the final purpose of
waveform analysis. WaveEv provides various functions such as fault location, fault line selection,harmonic analysis, power analysis, impedance analysis and sequence component analysis. New
waveform analysis function can be developed by adding new analysis module.
2.4.1 Fault Location
The fault location function includes single-end fault location and double-end fault location.
NOTE:This function is inapplicable for the files of DFR of generator-transformer unit.
1. Single-end fault location
Select “Analysis”->“Fault location… ”to display the parameter setup interface for fault location,which is the interface of single-end fault location as shown in the following figure.
Figure 2.4-1 Parameter setup for single-end fault location
After selecting the line name in “ ”, select the
voltage and current channels in the setup area of “Local side”. If a current phase-shift angle exists,
mark “√”in the “ ”of “Shift angle of current”, and input the value of phase angle in the input boxf
Chapter 2 Usage Instruction
NR ELECTRIC CO., LTD.36
“ ”. Input correct line parameters in the
“ ”.
1) Positive sequence resistance (R1). Unit: ohm.
2) Zero sequence resistance (R0). Unit: ohm.
3) Positive-sequence reactance (X1). Unit: ohm.
4) Zero sequence reactance (X0). Unit: ohm.
5) Line length. Unit: km.
6) Positive sequence capacitance (C1) . Unit: μF.
Where:
C1, X1, X0, R1 and R0 adopt primary values.
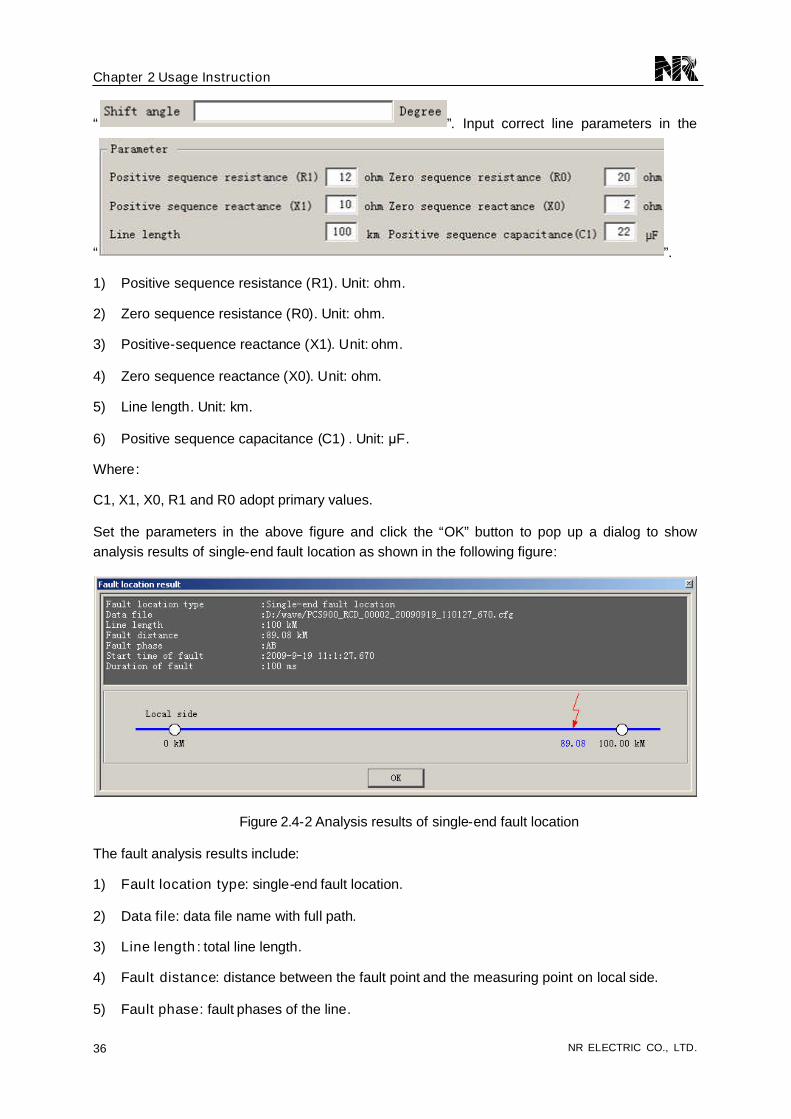
Set the parameters in the above figure and click the “OK”button to pop up a dialog to showanalysis results of single-end fault location as shown in the following figure:
Figure 2.4-2 Analysis results of single-end fault location
The fault analysis results include:
1) Fault location type: single-end fault location.
2) Data file: data file name with full path.
3) Line length : total line length.
4) Fault distance: distance between the fault point and the measuring point on local side.
5) Fault phase: fault phases of the line.

Chapter 2 Usage Instruction
NR ELECTRIC CO., LTD. 37
6) Start time of fault: the start time of the fault (accurate to the millisecond level).
7) Duration of fault: duration between fault occurrence and the time when the fault was cleared.
There is a graphical area below the text information, where the position of the fault point in thewhole line is displayed, thus the general position of the fault can be seen clearly.
2. Double-end fault location
Mark “√”in the “ ”of “Double-end fault location”, and now the dialoag will change as shown inthe following figure.
Parameters onlocal side
Parameters onopposite side
CommonParameters forlocal side andopposite side
Figure 2.4-3 Parameter setup for double-end fault location
Set the parameters in the above figure and click the “OK”button to pop up a dialog to show
analysis results of double-end fault location as shown in the following figure:
Chapter 2 Usage Instruction
NR ELECTRIC CO., LTD.38
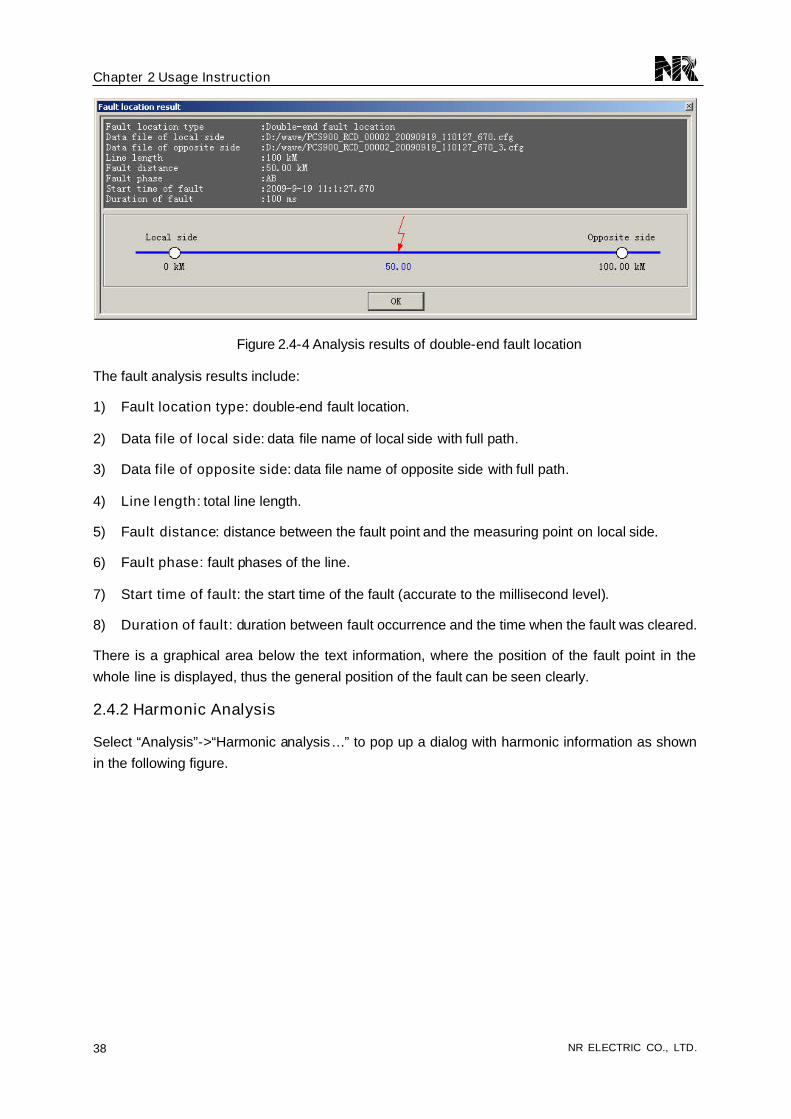
Figure 2.4-4 Analysis results of double-end fault location
The fault analysis results include:
1) Fault location type: double-end fault location.
2) Data file of local side: data file name of local side with full path.
3) Data file of opposite side: data file name of opposite side with full path.
4) Line length: total line length.
5) Fault distance: distance between the fault point and the measuring point on local side.
6) Fault phase: fault phases of the line.
7) Start time of fault: the start time of the fault (accurate to the millisecond level).
8) Duration of fault: duration between fault occurrence and the time when the fault was cleared.
There is a graphical area below the text information, where the position of the fault point in the
whole line is displayed, thus the general position of the fault can be seen clearly.
2.4.2 Harmonic Analysis
Select “Analysis”->“Harmonic analysis… ”to pop up a dialog with harmonic information as shown
in the following figure.
Chapter 2 Usage Instruction
NR ELECTRIC CO., LTD. 39
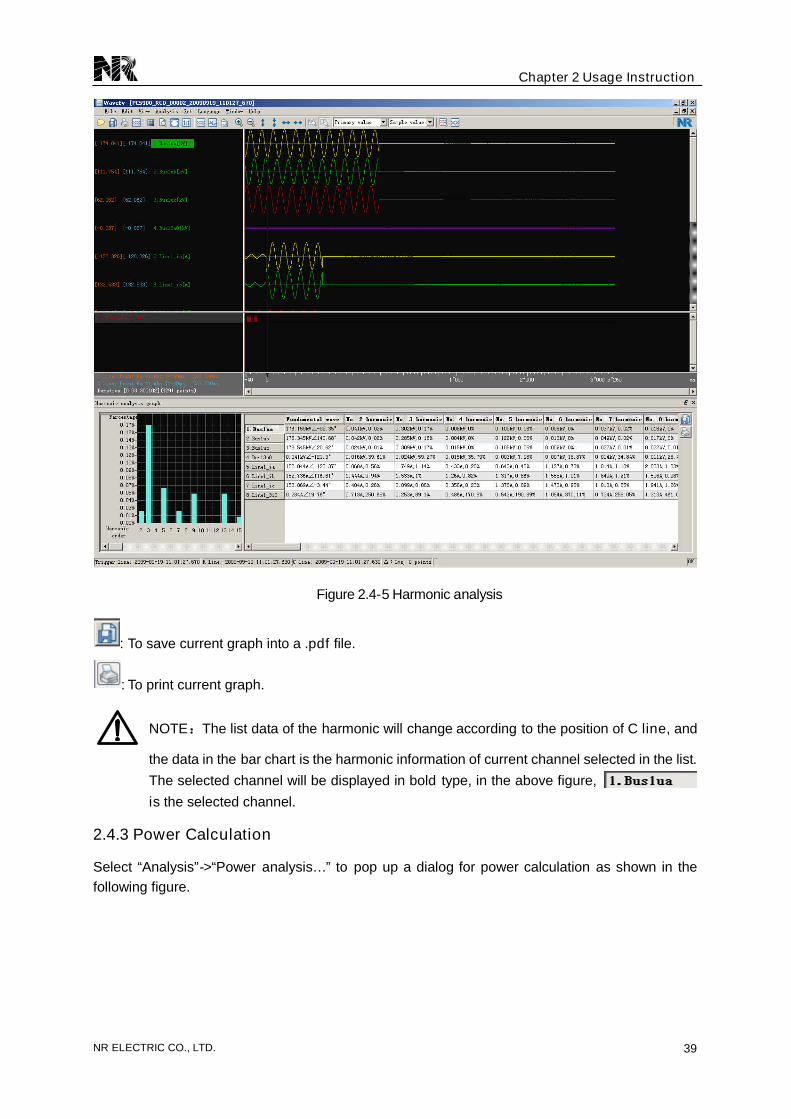
Figure 2.4-5 Harmonic analysis
: To save current graph into a .pdf file.
: To print current graph.
NOTE:The list data of the harmonic will change according to the position of C line, and
the data in the bar chart is the harmonic information of current channel selected in the list.
The selected channel will be displayed in bold type, in the above figure,
is the selected channel.
2.4.3 Power Calculation
Select “Analysis”->“Power analysis… ”to pop up a dialog for power calculation as shown in thefollowing figure.

Chapter 2 Usage Instruction
NR ELECTRIC CO., LTD.40
Figure 2.4-6 Parameter setup of power calculation
1) Select the analysis type: Single-phase power or Three-phase power.
2) Select line.
3) Select current/voltage channel.
After clicking the “OK”button to generate new waveforms.
The power analysis results inculde:
P(active power), Q (reactive power) , S (apparent power) and Cos( power factor).
Figure 2.4-7 Power analysis results

Chapter 2 Usage Instruction
NR ELECTRIC CO., LTD. 41
2.4.4 Sequence Component Analysis
Select “Analysis”->“Sequence analysis… ”to pop up a dialog for sequence component analysis asshown in the following figure.
Figure 2.4-8 Parameter setup of vector calculation
The analysis result is a new waveforms which includes:
positive sequence components(I1 or U1), negative sequence components(I2 or U2),
zero-sequence components(I0 or U0).
The vector diagram of each sequence can be observed by the sequence component diagram.
Chapter 2 Usage Instruction
NR ELECTRIC CO., LTD.42
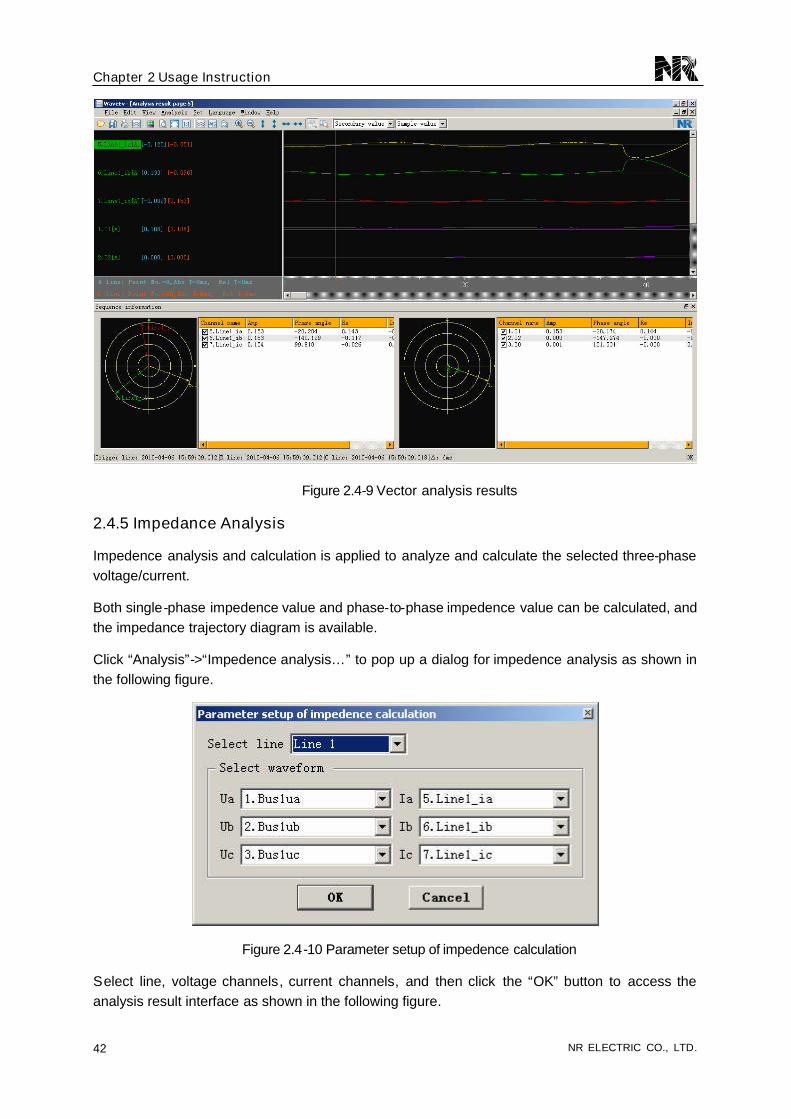
Figure 2.4-9 Vector analysis results
2.4.5 Impedance Analysis
Impedence analysis and calculation is applied to analyze and calculate the selected three-phasevoltage/current.
Both single-phase impedence value and phase-to-phase impedence value can be calculated, andthe impedance trajectory diagram is available.
Click “Analysis”->“Impedence analysis… ”to pop up a dialog for impedence analysis as shown inthe following figure.
Figure 2.4-10 Parameter setup of impedence calculation
Select line, voltage channels, current channels, and then click the “OK”button to access theanalysis result interface as shown in the following figure.
Chapter 2 Usage Instruction
NR ELECTRIC CO., LTD. 43
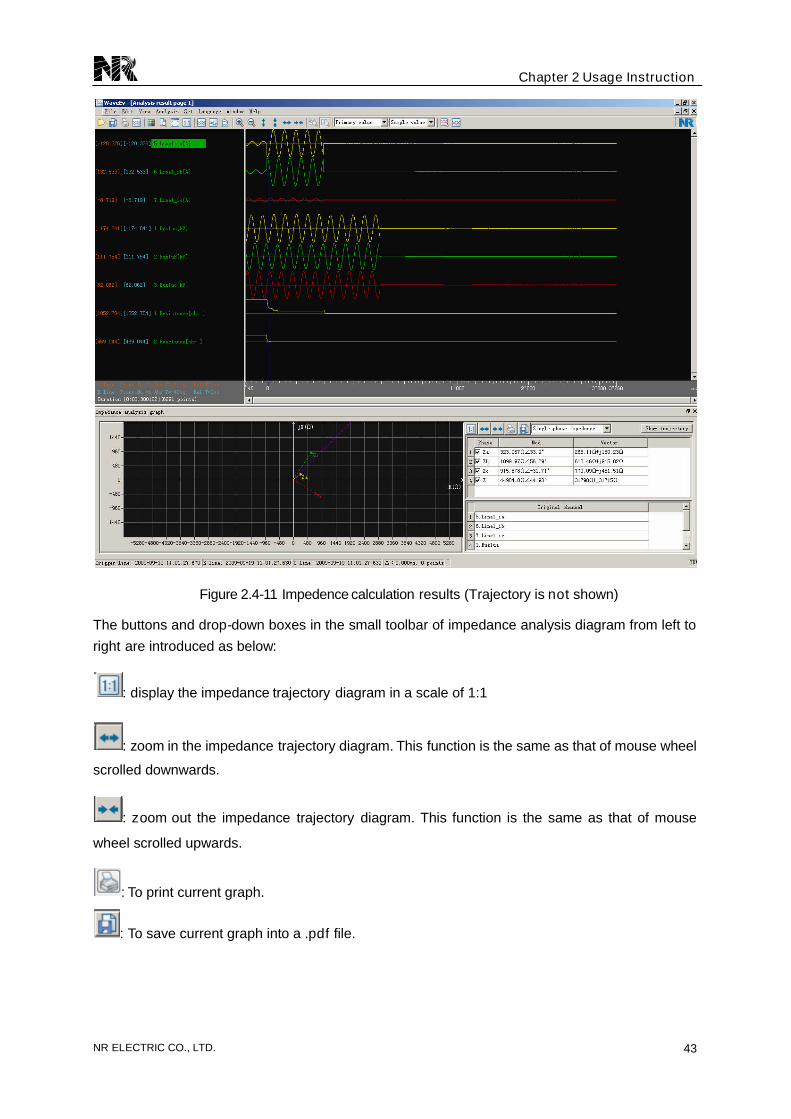
Figure 2.4-11 Impedence calculation results (Trajectory is not shown)
The buttons and drop-down boxes in the small toolbar of impedance analysis diagram from left to
right are introduced as below:
: display the impedance trajectory diagram in a scale of 1:1
: zoom in the impedance trajectory diagram. This function is the same as that of mouse wheel
scrolled downwards.
: zoom out the impedance trajectory diagram. This function is the same as that of mouse
wheel scrolled upwards.
: To print current graph.
: To save current graph into a .pdf file.

Chapter 2 Usage Instruction
NR ELECTRIC CO., LTD.44
: select the analysis type: Single-phase impedance or
Phase-to-phase impedance.
1) If Single-phase impedance is selected, Za, Zb and Zc respectively indicate the
single-phase impedance of phase A, B and C.
Z indicates the impedance.
2) If Phase-to-phase impedance is selected, Zab, Zbc and Zca respectively indicate thephase-to-phase impedance of phase AB, BC and CA.
Z still indicates the impedance.
: display the trajectory or not.
(push down: display the trajectory and the vector;
release: only display the vector.)
The impedance trajectory of a phase can be displayed or hidden by clicking the checkbox in thelist of “Phase”.
Click the “Show trajectory”button, and then the impedance trajectory of sampling points from R
line to C line will be drawn in the display area of impedance diagram as shown in the followingfigure:

Chapter 2 Usage Instruction
NR ELECTRIC CO., LTD. 45
Figure 2.4-12 Impedence calculation results (Trajectory is shown in default sacle)
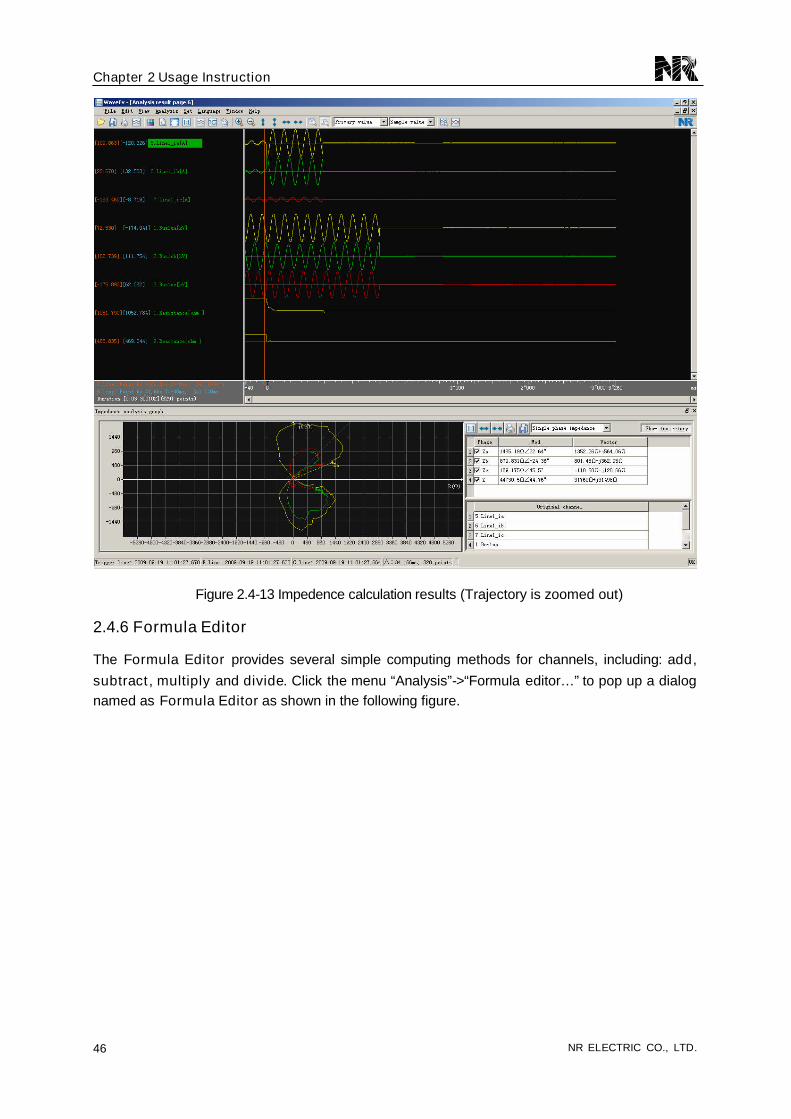
Zoom out the impedance trajectory diagram by clicking or scroll the mouse wheel
downwards as shown in the following figure.
Chapter 2 Usage Instruction
NR ELECTRIC CO., LTD.46
Figure 2.4-13 Impedence calculation results (Trajectory is zoomed out)
2.4.6 Formula Editor
The Formula Editor provides several simple computing methods for channels, including: add,
subtract, multiply and divide. Click the menu “Analysis”->“Formula editor… ”to pop up a dialognamed as Formula Editor as shown in the following figure.
Chapter 2 Usage Instruction
NR ELECTRIC CO., LTD. 47
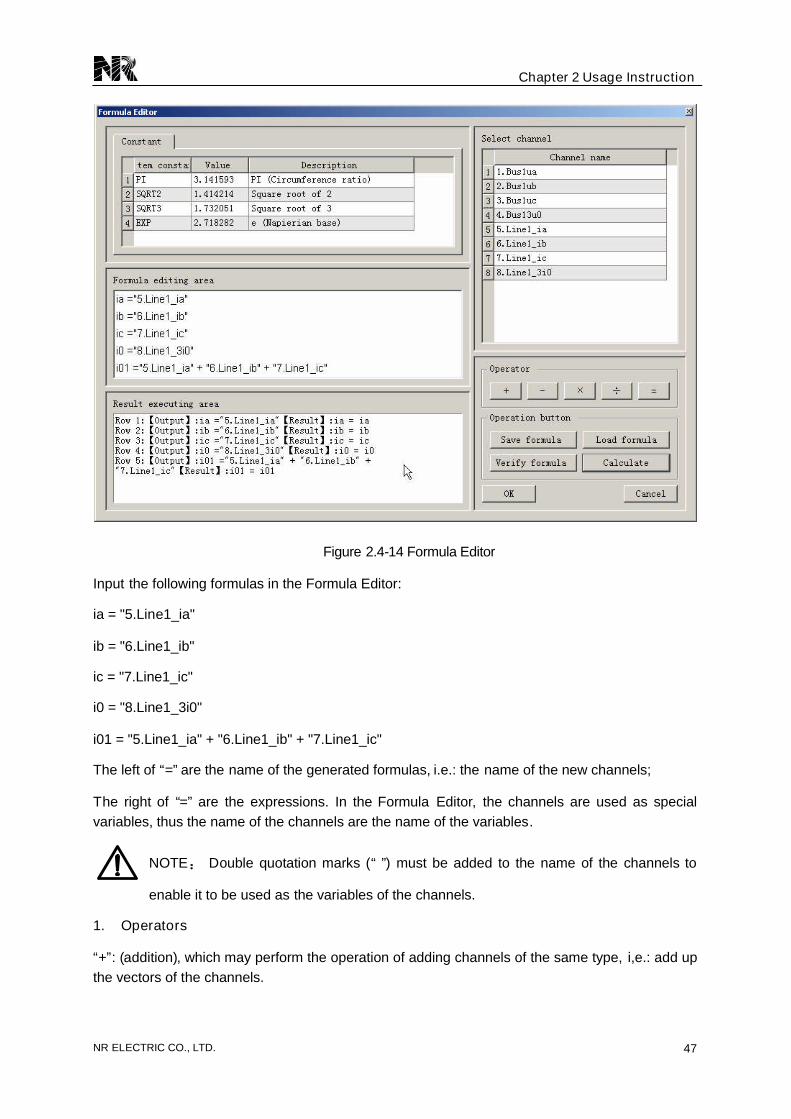
Figure 2.4-14 Formula Editor
Input the following formulas in the Formula Editor:
ia = "5.Line1_ia"
ib = "6.Line1_ib"
ic = "7.Line1_ic"
i0 = "8.Line1_3i0"
i01 = "5.Line1_ia" + "6.Line1_ib" + "7.Line1_ic"
The left of “=”are the name of the generated formulas, i.e.: the name of the new channels;
The right of “=”are the expressions. In the Formula Editor, the channels are used as specialvariables, thus the name of the channels are the name of the variables.
NOTE: Double quotation marks (“”) must be added to the name of the channels to
enable it to be used as the variables of the channels.
1. Operators
“+”: (addition), which may perform the operation of adding channels of the same type, i,e.: add upthe vectors of the channels.

Chapter 2 Usage Instruction
NR ELECTRIC CO., LTD.48
“-“: (subtract), which may perform the operation of subtracting channels of the same type, i,e.:
subtract the vectors of the channels.
“×”: (multiply), which may perform the operation of multiplying channels of various types (mainly
voltage and current channels); in which the power channel will be generated by multiplying thevoltage channel with the current channel.
“÷”: (divide), which may perform the operation of dividing channels of various types (mainly voltageand current channels); in which the impedance channel will be generated by dividing the voltage
channel by the current channel.
2. Operating button
Save formula : to save the established formulas as the files of the .set format for future use.
Load formula: to load the saved formula to the current formula editing area.
Verify formula: to verify whether the inputted formula is correct or not.
Calculate: to perform calculation by using the established formulas.
For the above formulas, ia, ib, ic and i0 are the phase A/B/C and zero-sequence channels of the
original current; while i01 is the new channel generated by adding the three-phase current,(i.e.:
calculated zero-sequence channel).
The generated waveforms is shown in the following figure.
Figure 2.4-15 Waveform of the current i01 calculated by Formula Editor

Chapter 2 Usage Instruction
NR ELECTRIC CO., LTD. 49
2.4.7 Spectral Analysis
Spectral analysis is applied to carry on fast Fourier transform (FFT) to selected channel, and theresult will be given by the means of curve graph after being calculated. Select
“Analysis”->“Spectral analysis… ”to to pop up a dialog as shown in the following figure.
Figure 2.4-16 Spectral analysis results
The detailed description about the interface are:
Toolbar
: Horizontal zoom in
: Horizontal zoom out
: Zoom in the amplitude
: Zoom out the amplitude
: Zoom to 100%
Chapter 2 Usage Instruction
NR ELECTRIC CO., LTD.50
: Hide/Show grid
: To print current graph
: To save current graph into a .pdf file
: Parameter setup
NOTE:For “Horizontal zoom in/out”, its shortcut is “mouse wheel”(upward: zoom in;
downward : zoom out), and for “Zoom in/out the amplitude”, its shortcut is “Ctrl”+“mouse
wheel”(upward: zoom in; downward: zoom out).
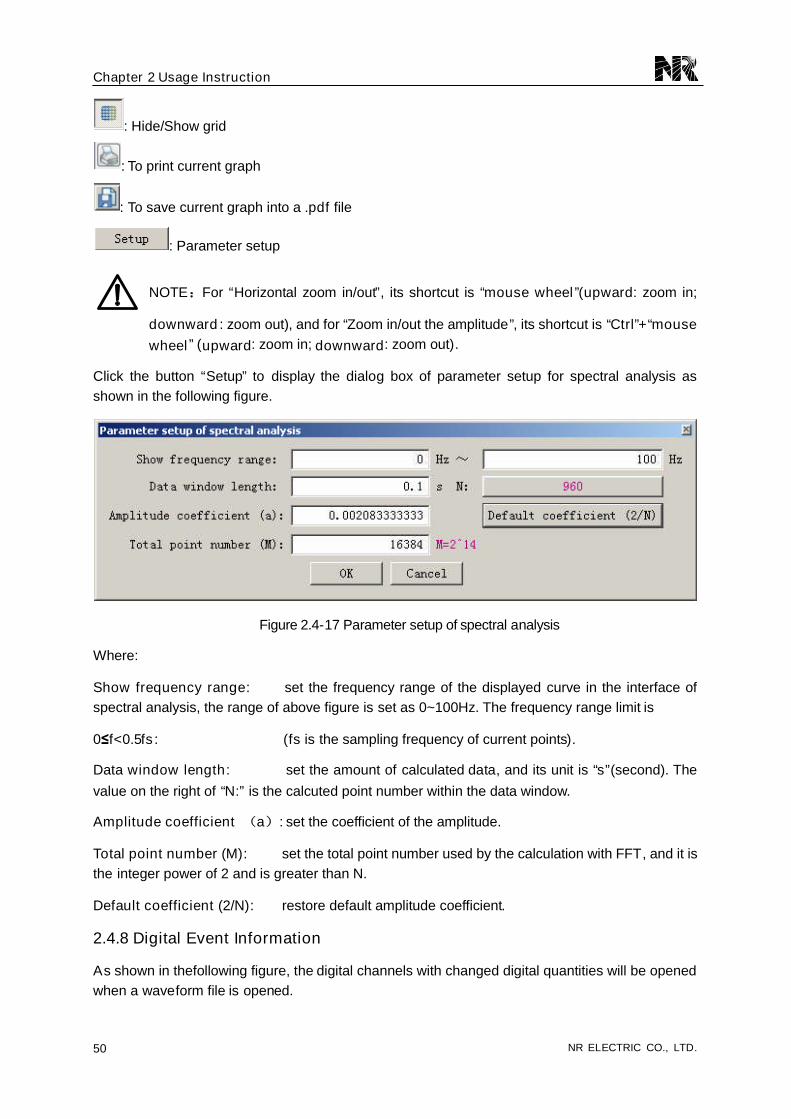
Click the button “Setup”to display the dialog box of parameter setup for spectral analysis asshown in the following figure.
Figure 2.4-17 Parameter setup of spectral analysis
Where:
Show frequency range: set the frequency range of the displayed curve in the interface ofspectral analysis, the range of above figure is set as 0~100Hz. The frequency range limit is
0≤f<0.5fs: (fs is the sampling frequency of current points).
Data window length: set the amount of calculated data, and its unit is “s”(second). The
value on the right of “N:”is the calcuted point number within the data window.
Amplitude coefficient (a): set the coefficient of the amplitude.
Total point number (M): set the total point number used by the calculation with FFT, and it isthe integer power of 2 and is greater than N.
Default coefficient (2/N): restore default amplitude coefficient.
2.4.8 Digital Event Information
As shown in thefollowing figure, the digital channels with changed digital quantities will be openedwhen a waveform file is opened.

Chapter 2 Usage Instruction
NR ELECTRIC CO., LTD. 51
Figure 2.4-18 The digital channels with changed digital quantities
NOTE:The relative time of state change is compared to the time of fault points.
1) Sort function
Click the name of a row for sort ascending/descending according to the name.
2) : To save current graph into a .pdf file.
3) : To print current graph.
4) Locate the point of status change of a channel
Click an event of a channel to locate the C line to the time when the status change of this event
occurs. The digital event information diagram before clicking “Event 4”of “NormalBin000”isshown in the following figure.
Chapter 2 Usage Instruction
NR ELECTRIC CO., LTD.52
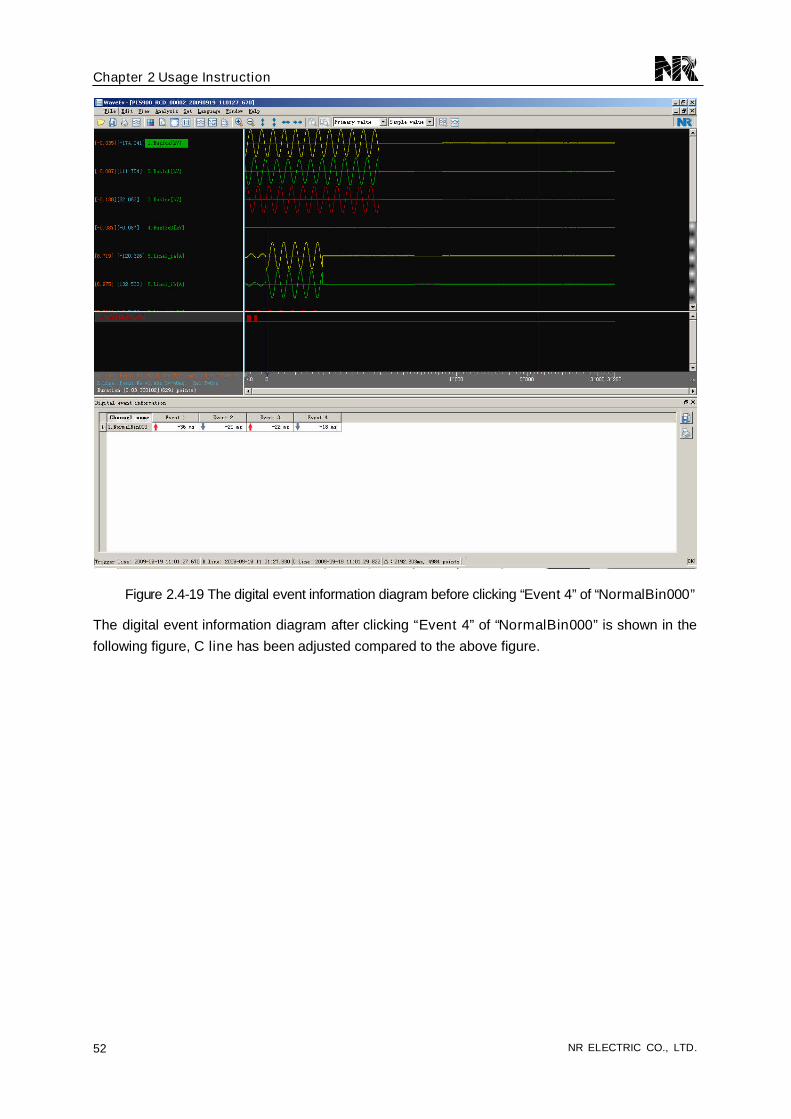
Figure 2.4-19 The digital event information diagram before clicking “Event 4”of “NormalBin000”
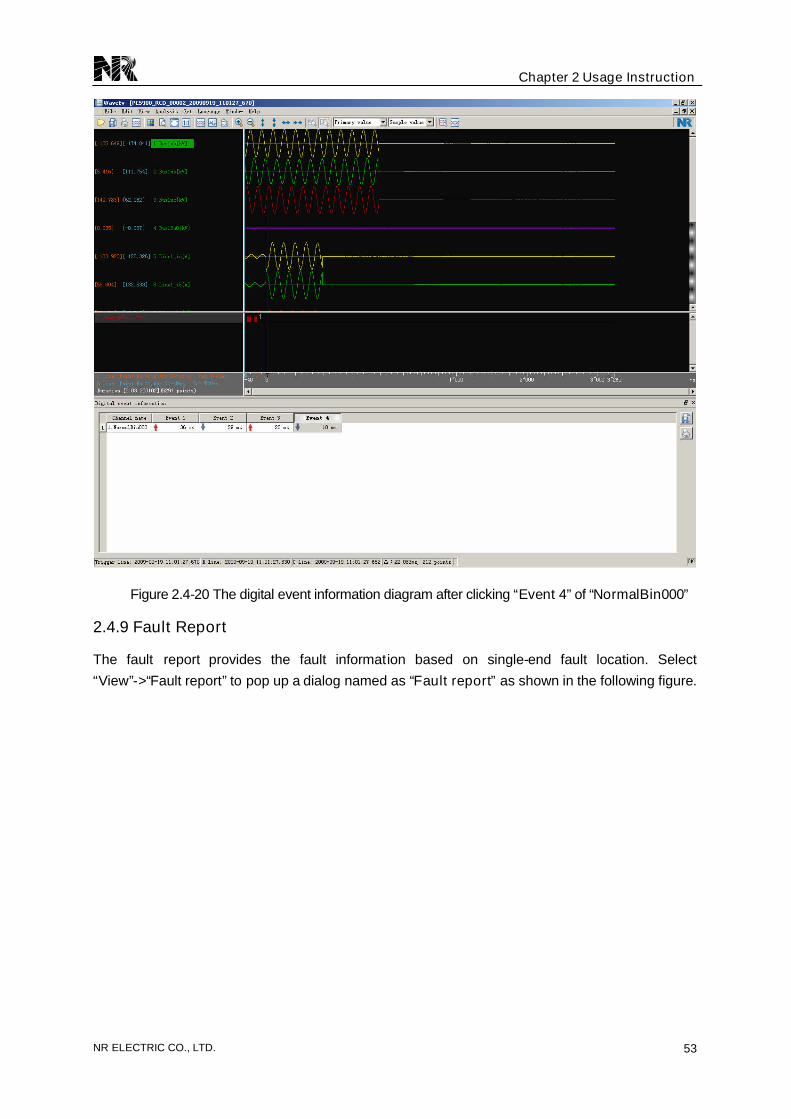
The digital event information diagram after clicking “Event 4”of “NormalBin000”is shown in the
following figure, C line has been adjusted compared to the above figure.
Chapter 2 Usage Instruction
NR ELECTRIC CO., LTD. 53
Figure 2.4-20 The digital event information diagram after clicking “Event 4”of “NormalBin000”
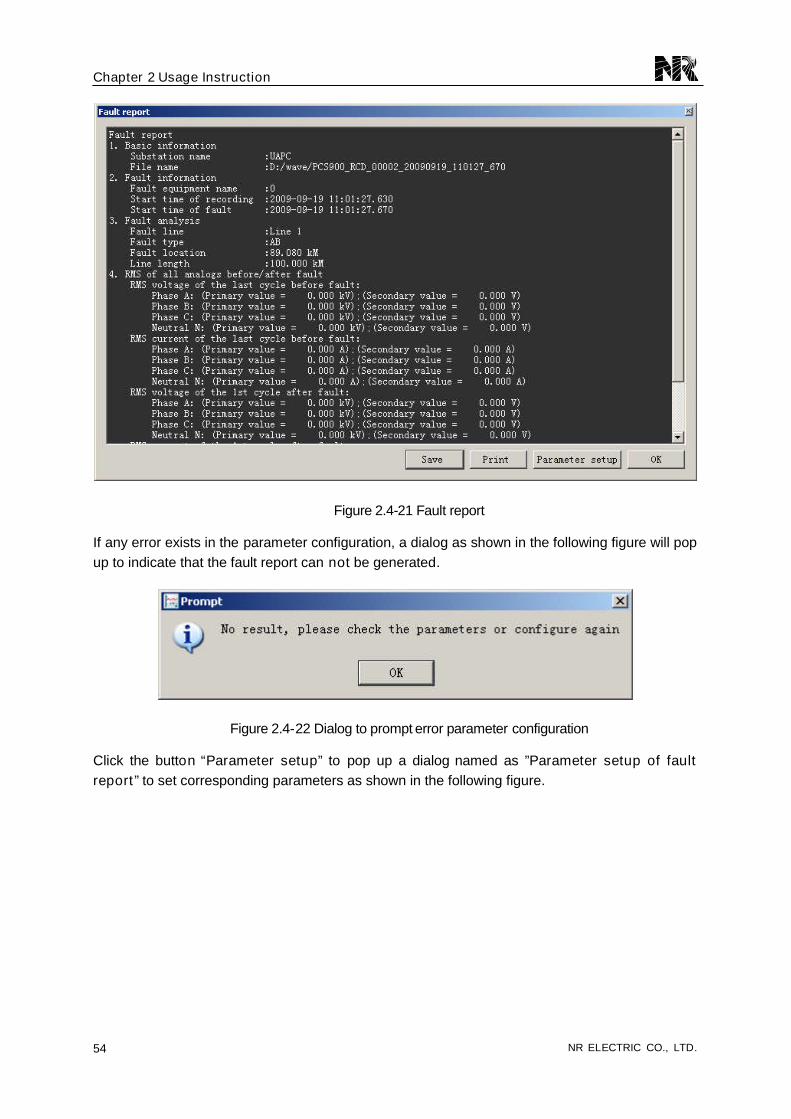
2.4.9 Fault Report
The fault report provides the fault information based on single-end fault location. Select
“View”->“Fault report”to pop up a dialog named as “Fault report”as shown in the following figure.
Chapter 2 Usage Instruction
NR ELECTRIC CO., LTD.54
Figure 2.4-21 Fault report
If any error exists in the parameter configuration, a dialog as shown in the following figure will popup to indicate that the fault report can not be generated.
Figure 2.4-22 Dialog to prompt error parameter configuration
Click the button “Parameter setup”to pop up a dialog named as ”Parameter setup of faultreport”to set corresponding parameters as shown in the following figure.

Chapter 2 Usage Instruction
NR ELECTRIC CO., LTD. 55
Figure 2.4-23 Parameter setup of fault report
If there is no line to be selected, all the current/voltage channels will be displayed.
Set corresponding parameters and then click the button “OK”, the selected channels will beanalyzed and calculated, and the result will be displayed in the dialog named as “Fault report”.
2.4.10 View .CFG file information
Select “View”->“View .CFG file information”as shown in the following figure.
Figure 2.4-24 How to view .CFG file
Click this menu to pop up a dialog to display the .CFG file information of the waveform as shown in
the following figure.

Chapter 2 Usage Instruction
NR ELECTRIC CO., LTD.56
Figure 2.4-25 .CFG file information
2.5 Display Analysis Data
The corresponding relationship between waveform analysis data and data display mode is shownin the following table.
Table 2.5-1
No. Data display mode Waveform data Description
1 Bar chart Harmonic analysisAmplitude, harmonic
order
2 Polar coordinatesVector diagram of waveforms of
any analog values
3 Impedance graph Impedance analysis
4 Spectral graph Spectral analysis
Chapter 2 Usage Instruction
NR ELECTRIC CO., LTD. 57
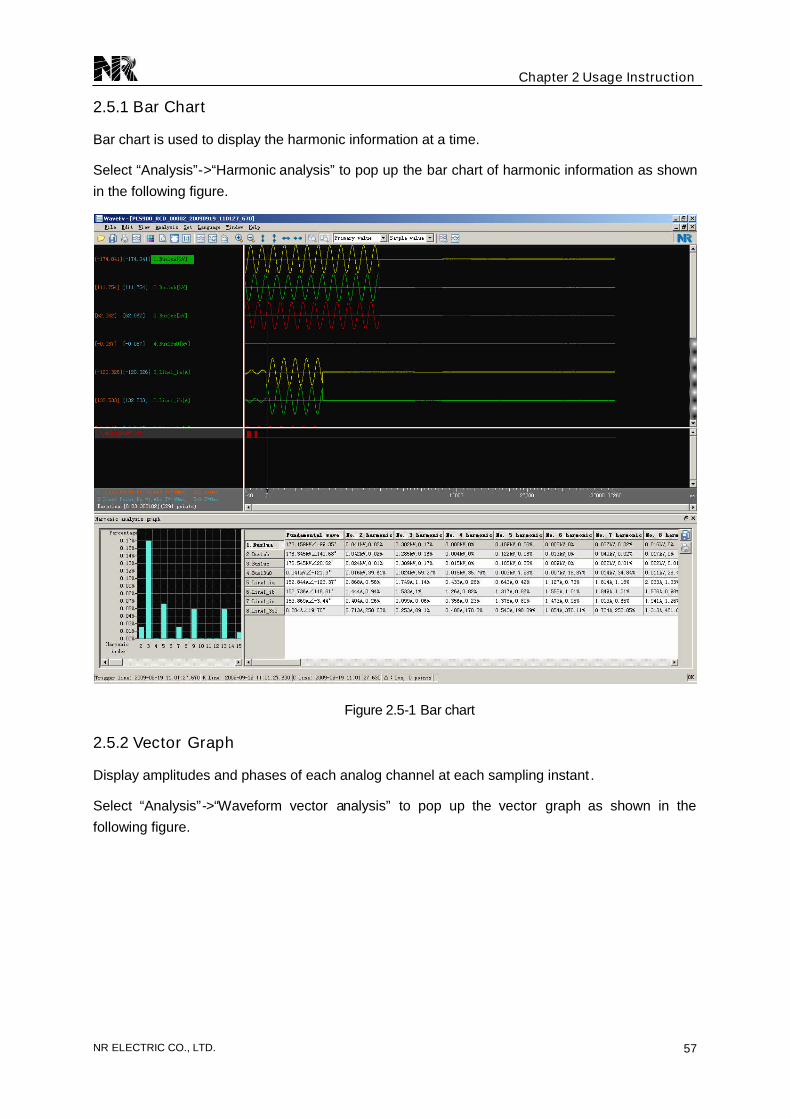
2.5.1 Bar Chart
Bar chart is used to display the harmonic information at a time.
Select “Analysis”->“Harmonic analysis”to pop up the bar chart of harmonic information as shown
in the following figure.
Figure 2.5-1 Bar chart
2.5.2 Vector Graph
Display amplitudes and phases of each analog channel at each sampling instant .
Select “Analysis”->“Waveform vector analysis” to pop up the vector graph as shown in the
following figure.

Chapter 2 Usage Instruction
NR ELECTRIC CO., LTD.58
Figure 2.5-2 How to access waveform vector analysis
Figure 2.5-3 Waveform vector analysis
NOTE : After clicking the right mouse button on the list, the right click menu
“Select/Cancel all channels” will appear as shown in the following figure. Click“Select/Cancel all channels”to cancel all the selected channels. Click this button again
can select all the channels again.

Chapter 2 Usage Instruction
NR ELECTRIC CO., LTD. 59
Figure 2.5-4 Select all channels
In the above figure:Print: To print waveform vector analysis results of the selected channels.
Save: To save waveform vector analysis results of the selected channels into a .pdf file.
You can select or cancel a specific channel by clicking the check box before the channel name as
shown in the following figure.
Figure 2.5-5 Select some channels
2.5.3 Sequence Component Graph
Sequence component graph is used to display the amplitudes and phases of each sequencecomponent in the waveform during sequence component analysis.
Figure 2.5-6 Sequence component graph
Chapter 2 Usage Instruction
NR ELECTRIC CO., LTD.60
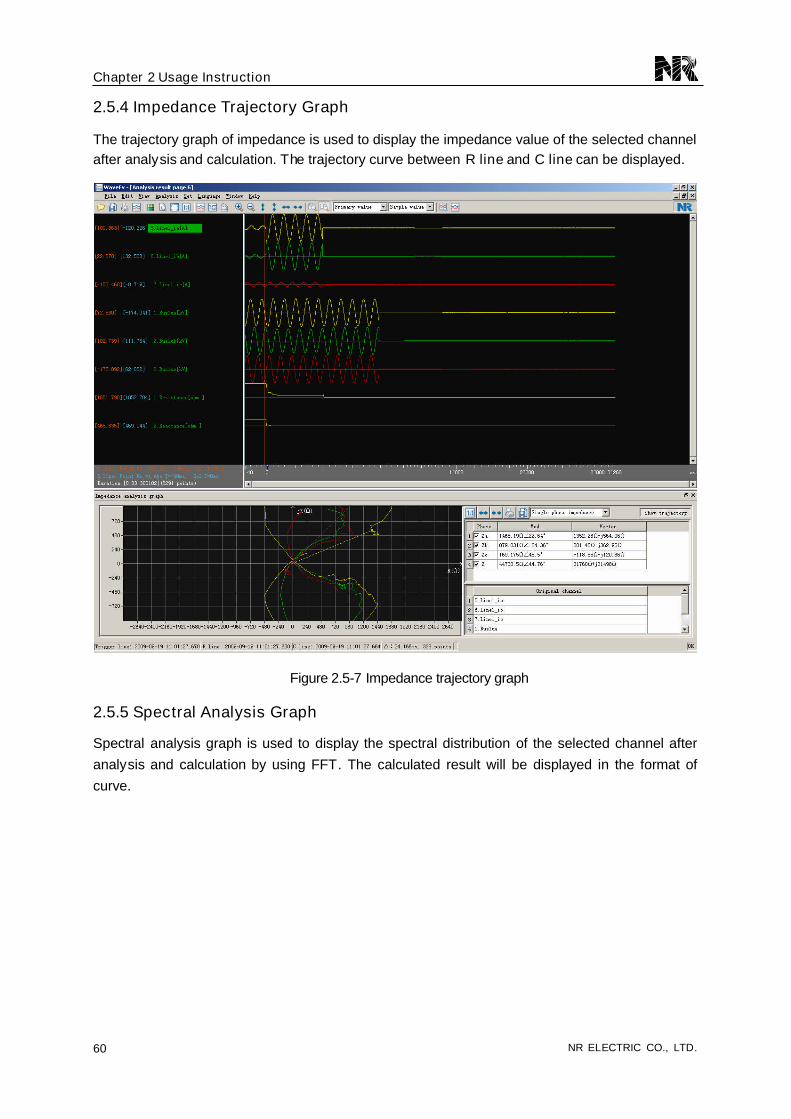
2.5.4 Impedance Trajectory Graph
The trajectory graph of impedance is used to display the impedance value of the selected channelafter analysis and calculation. The trajectory curve between R line and C line can be displayed.
Figure 2.5-7 Impedance trajectory graph
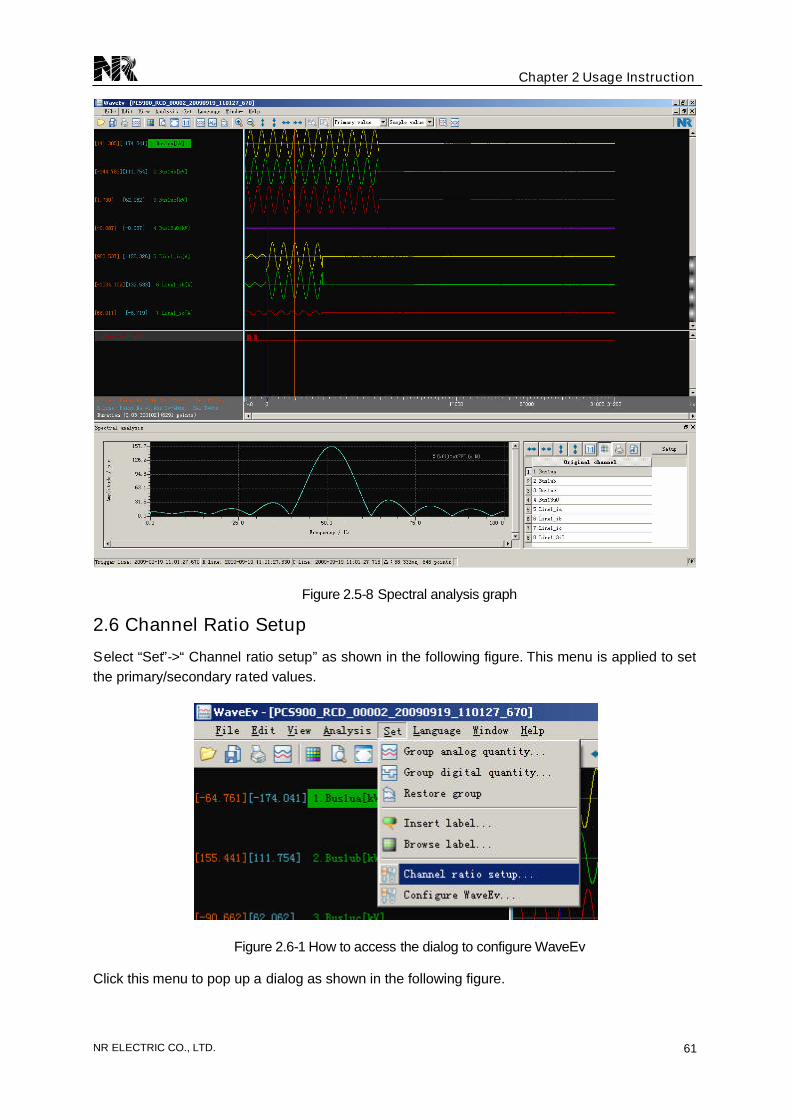
2.5.5 Spectral Analysis Graph
Spectral analysis graph is used to display the spectral distribution of the selected channel after
analysis and calculation by using FFT. The calculated result will be displayed in the format of
curve.
Chapter 2 Usage Instruction
NR ELECTRIC CO., LTD. 61
Figure 2.5-8 Spectral analysis graph
2.6 Channel Ratio Setup
Select “Set”->“Channel ratio setup”as shown in the following figure. This menu is applied to setthe primary/secondary rated values.
Figure 2.6-1 How to access the dialog to configure WaveEv
Click this menu to pop up a dialog as shown in the following figure.

Chapter 2 Usage Instruction
NR ELECTRIC CO., LTD.62
Figure 2.6-2 Channel ratio setup
When the primary/secondary rated values have been configured successfully, click “OK”to enablethem, and then the data in the waveform display interface will be refreshed according to the
primary/secondary rated values which have just been configured.
2.7 Configure WaveEv
Select “Set”->“Configure WaveEv… ”as shown in the following figure. This menu is applied to set
some parameters related to waveform display, including ”Line setup”, ”Analysis option”, ”Date
option”and “Waveform display setup”.
Figure 2.7-1 How to access the dialog to configure WaveEv
Click this menu to pop up a dialog as shown in the following figure.
Chapter 2 Usage Instruction
NR ELECTRIC CO., LTD. 63
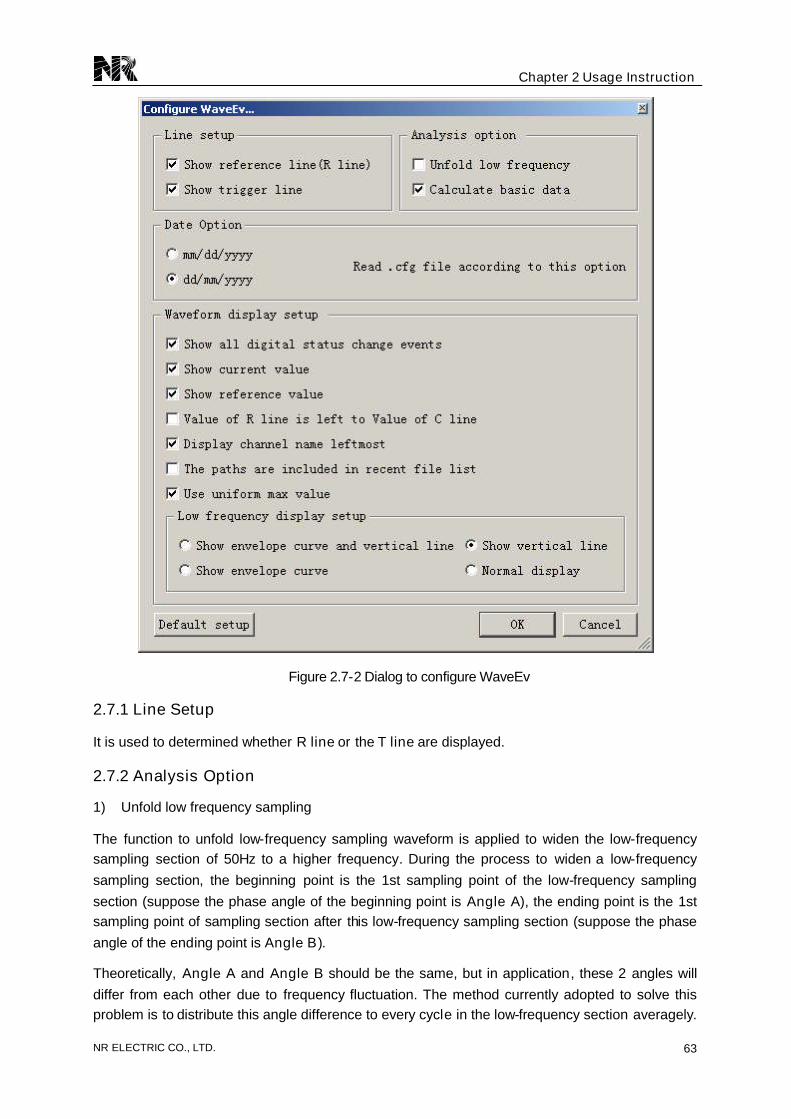
Figure 2.7-2 Dialog to configure WaveEv
2.7.1 Line Setup
It is used to determined whether R line or the T line are displayed.
2.7.2 Analysis Option
1) Unfold low frequency sampling
The function to unfold low-frequency sampling waveform is applied to widen the low-frequencysampling section of 50Hz to a higher frequency. During the process to widen a low-frequency
sampling section, the beginning point is the 1st sampling point of the low-frequency sampling
section (suppose the phase angle of the beginning point is Angle A), the ending point is the 1stsampling point of sampling section after this low-frequency sampling section (suppose the phase
angle of the ending point is Angle B).
Theoretically, Angle A and Angle B should be the same, but in application, these 2 angles will
differ from each other due to frequency fluctuation. The method currently adopted to solve thisproblem is to distribute this angle difference to every cycle in the low-frequency section averagely.
Chapter 2 Usage Instruction
NR ELECTRIC CO., LTD.64
NOTE:The function is disabled by default in WaveEv.
2) Calculate basic data
This parmeter is applied to determine whether to calculate the fundamental wave for the
waveforms of all channels when opening a waveform file.
2.7.3 Date Option
Set the format of running time and fault time when reading the waveform file in the format of
*.CFG.
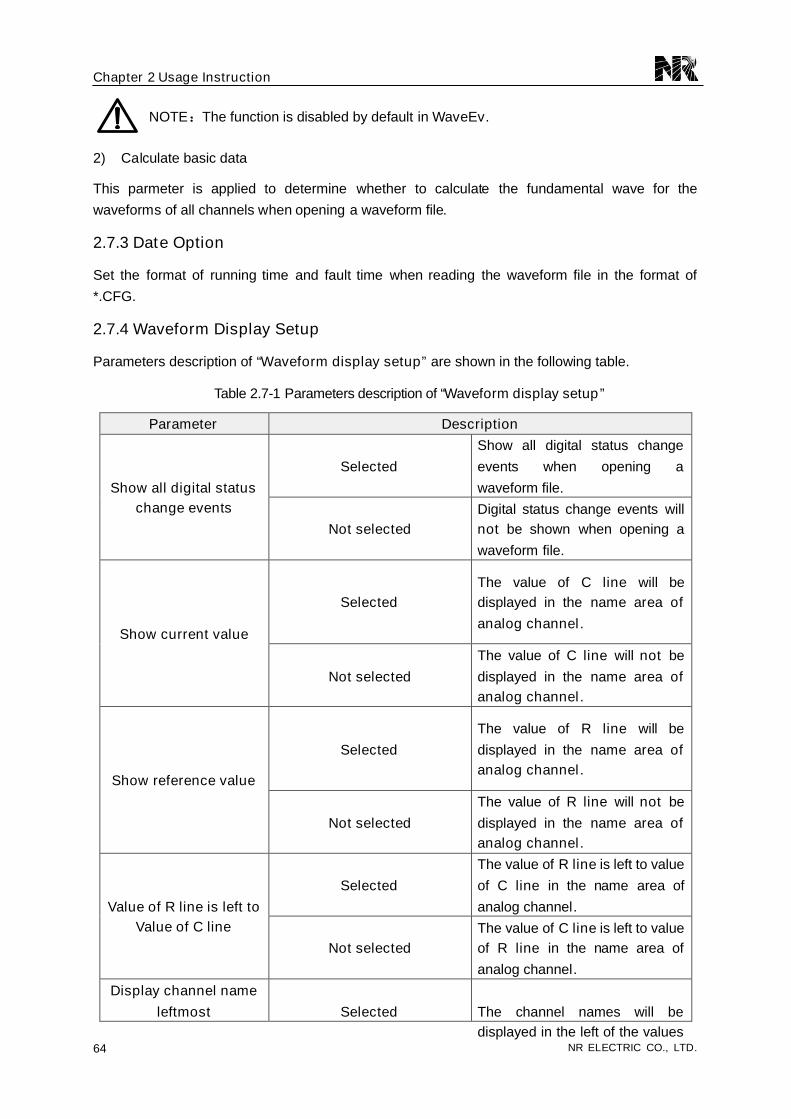
2.7.4 Waveform Display Setup
Parameters description of “Waveform display setup”are shown in the following table.
Table 2.7-1 Parameters description of “Waveform display setup”
Parameter Description
Selected
Show all digital status change
events when opening a
waveform file.Show all digital statuschange events
Not selectedDigital status change events willnot be shown when opening a
waveform file.
SelectedThe value of C line will bedisplayed in the name area of
analog channel.Show current value
Not selected
The value of C line will not be
displayed in the name area ofanalog channel.
Selected
The value of R line will be
displayed in the name area ofanalog channel.
Show reference value
Not selected
The value of R line will not be
displayed in the name area ofanalog channel.
Selected
The value of R line is left to value
of C line in the name area of
analog channel.Value of R line is left toValue of C line
Not selectedThe value of C line is left to valueof R line in the name area of
analog channel.
Display channel name
leftmost Selected The channel names will bedisplayed in the left of the values
Chapter 2 Usage Instruction
NR ELECTRIC CO., LTD. 65
in the name area of analog
channel.
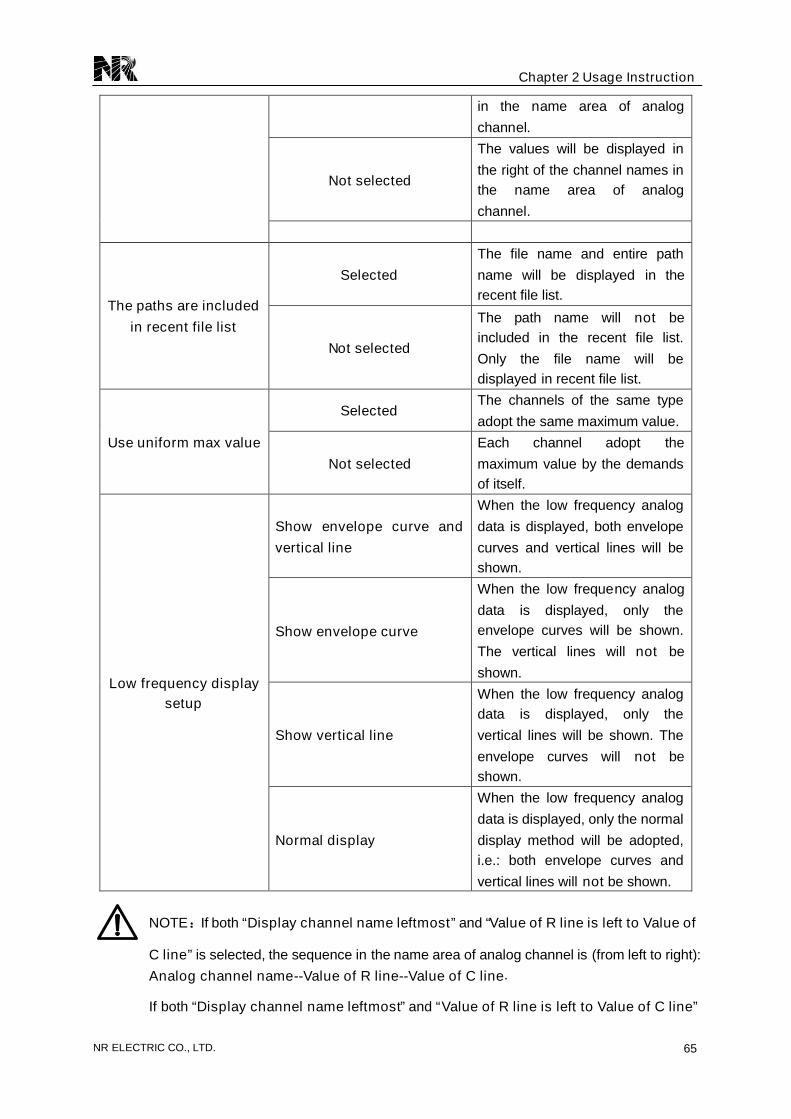
Not selected
The values will be displayed in
the right of the channel names inthe name area of analog
channel.
Selected
The file name and entire path
name will be displayed in therecent file list.
The paths are included
in recent file list
Not selected
The path name will not beincluded in the recent file list.
Only the file name will bedisplayed in recent file list.
SelectedThe channels of the same type
adopt the same maximum value.
Use uniform max value
Not selected
Each channel adopt the
maximum value by the demandsof itself.
Show envelope curve and
vertical line
When the low frequency analog
data is displayed, both envelope
curves and vertical lines will beshown.
Show envelope curve
When the low frequency analog
data is displayed, only theenvelope curves will be shown.
The vertical lines will not be
shown.
Show vertical line
When the low frequency analogdata is displayed, only the
vertical lines will be shown. The
envelope curves will not beshown.
Low frequency displaysetup
Normal display
When the low frequency analog
data is displayed, only the normal
display method will be adopted,i.e.: both envelope curves and
vertical lines will not be shown.
NOTE:If both “Display channel name leftmost”and “Value of R line is left to Value of
C line”is selected, the sequence in the name area of analog channel is (from left to right):
Analog channel name--Value of R line--Value of C line.
If both “Display channel name leftmost”and “Value of R line is left to Value of C line”
Chapter 2 Usage Instruction
NR ELECTRIC CO., LTD.66
is not selected, the sequence in the name area of analog channel is (from left to right):
Value of C line--Value of R line--Analog channel name.
If “Display channel name leftmost”is selected and “Value of R line is left to Value of
C line”is not selected, the sequence in the name area of analog channel is (from left toright): Analog channel name--Value of C line--Value of R line.
If “Display channel name leftmost”is not selected and “Value of R line is left to Valueof C line”is selected, the sequence in the name area of analog channel is (from left to
right): Value of R line--Value of C line--Analog channel name.
2.7.5 Default Setup
Click the button “Default setup”to set all the parameters in the dialog “Configure WaveEv… ”to
default values.
Chapter 3 Manual Release History
NR ELECTRIC CO., LTD. 67
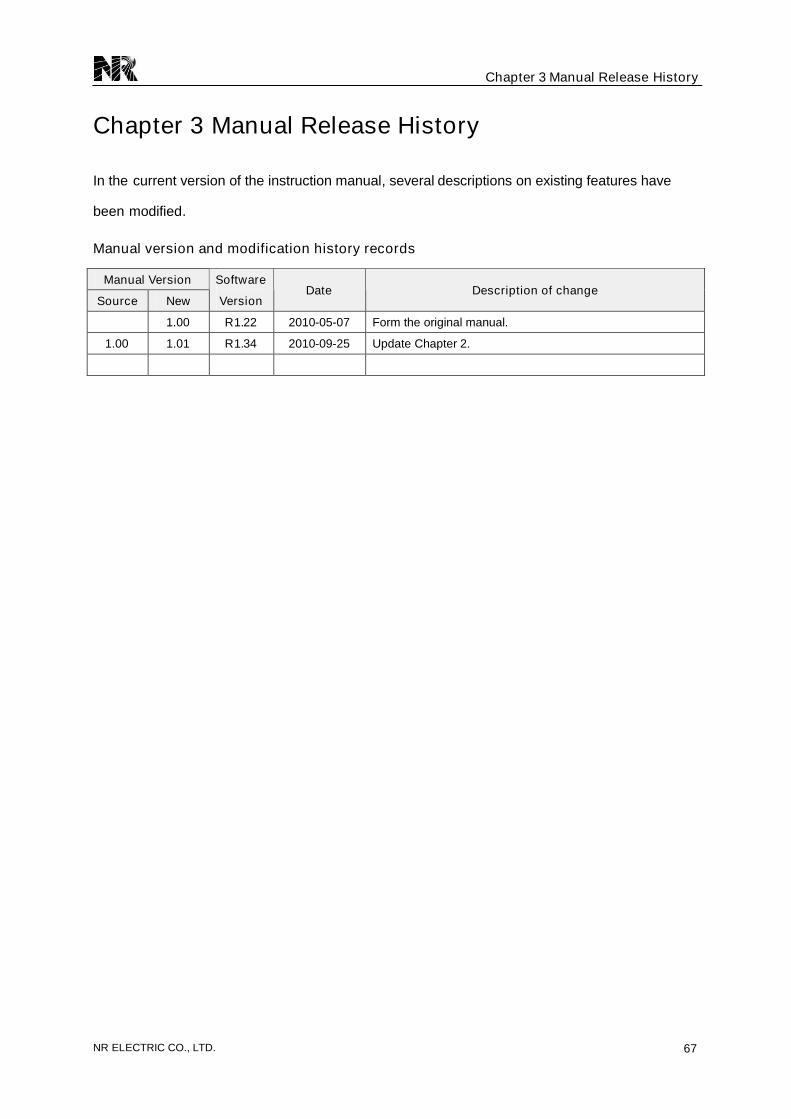
Chapter 3 Manual Release History
In the current version of the instruction manual, several descriptions on existing features have
been modified.
Manual version and modification history records
Manual Version
Source New
Software
VersionDate Description of change
1.00 R1.22 2010-05-07 Form the original manual.
1.00 1.01 R1.34 2010-09-25 Update Chapter 2.