wave energy resource - dr valentin heller valentin heller_files/heller_wave... · economics of a...
TRANSCRIPT

1
Wave Energy Resource
Fluid Mechanics Section, Department of Civil and Environmental Engineering
Dr Valentin Heller
4th CoastLab Teaching School, Wave and Tidal Energy, Porto, 17-20th January 2012
Content
• Introduction
• What is wave energy?
• Methods to evaluate the resource
• Data bases
• Conclusions
This lecture excludes (see Barstow et al. 2008; Mackay 2012):
• Methods to evaluate extremes (survival)
• Detailed description of sea states
2
2
Introduction
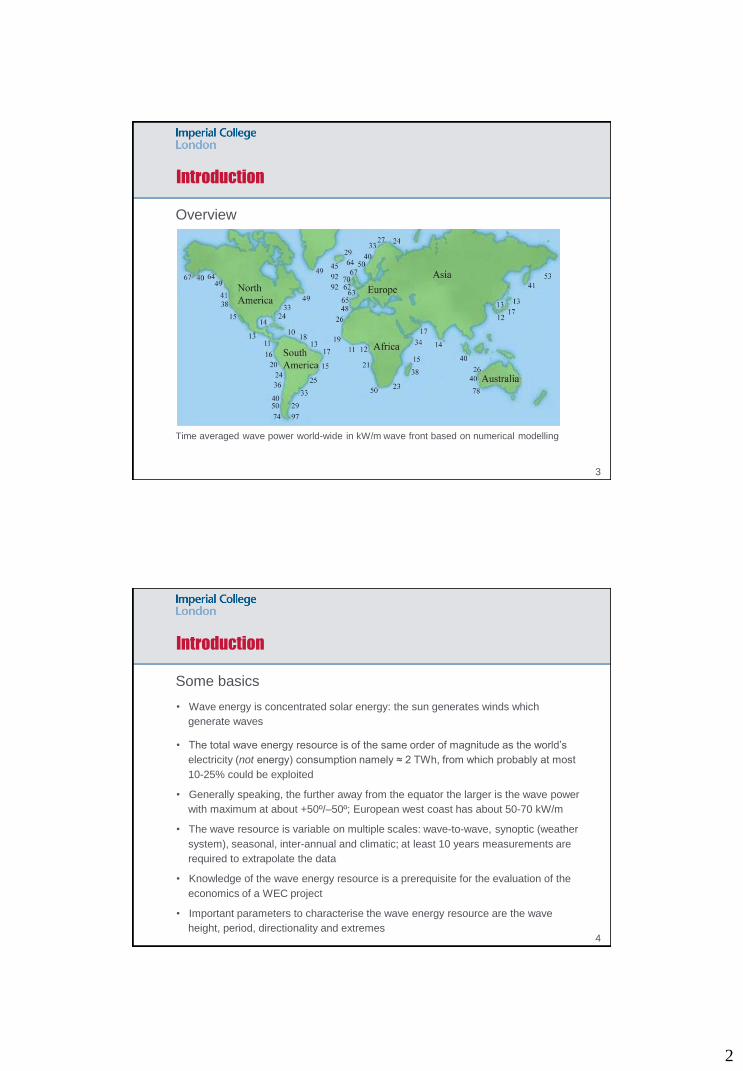
Overview
Time averaged wave power world-wide in kW/m wave front based on numerical modelling
3
Introduction
• Wave energy is concentrated solar energy: the sun generates winds which
generate waves
• The total wave energy resource is of the same order of magnitude as the world’s
electricity (not energy) consumption namely ≈ 2 TWh, from which probably at most
10-25% could be exploited
• Generally speaking, the further away from the equator the larger is the wave power
with maximum at about +50º/–50º; European west coast has about 50-70 kW/m
• The wave resource is variable on multiple scales: wave-to-wave, synoptic (weather
system), seasonal, inter-annual and climatic; at least 10 years measurements are
required to extrapolate the data
• Knowledge of the wave energy resource is a prerequisite for the evaluation of the
economics of a WEC project
• Important parameters to characterise the wave energy resource are the wave
height, period, directionality and extremes
Some basics
4
3
Introduction
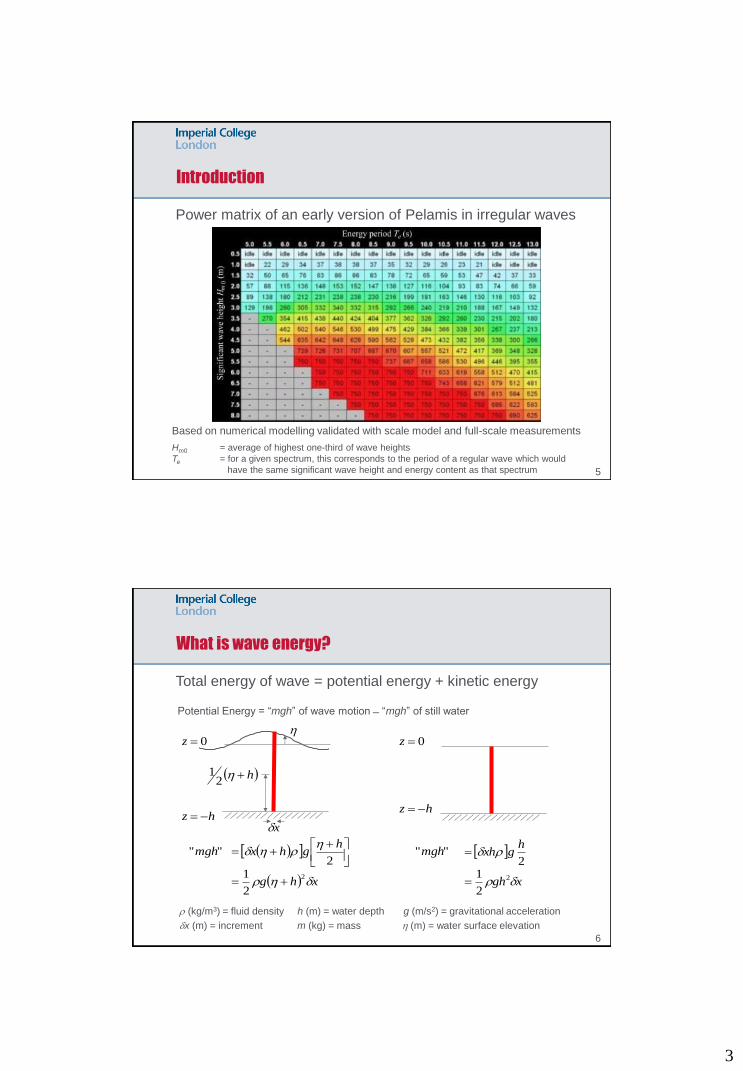
Power matrix of an early version of Pelamis in irregular waves
Based on numerical modelling validated with scale model and full-scale measurements
Hm0 = average of highest one-third of wave heights
Te = for a given spectrum, this corresponds to the period of a regular wave which would
have the same significant wave height and energy content as that spectrum 5
What is wave energy?
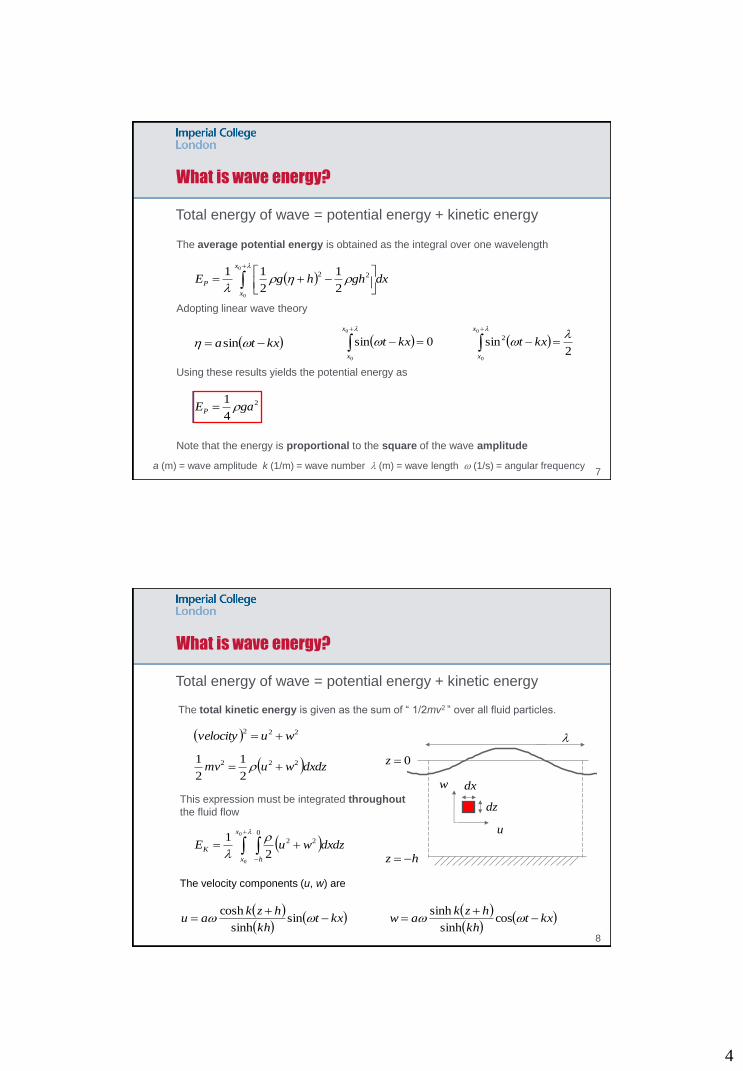
Total energy of wave = potential energy + kinetic energy
6
r (kg/m3) = fluid density h (m) = water depth g (m/s2) = gravitational acceleration
dx (m) = increment m (kg) = mass h (m) = water surface elevation
Potential Energy = “mgh” of wave motion ̶ “mgh” of still water
h
hz
0z
hz
0z
""mgh
2
hghxh
rhd
xhg dhr2
2
1
2
hgxhrd""mgh
xgh dr 2
2
1
hh2
1
xd
4
The average potential energy is obtained as the integral over one wavelength
Adopting linear wave theory
Using these results yields the potential energy as
Note that the energy is proportional to the square of the wave amplitude
2
4
1gaEP r
What is wave energy?
Total energy of wave = potential energy + kinetic energy
7 a (m) = wave amplitude k (1/m) = wave number l (m) = wave length w (1/s) = angular frequency
dxghhgE
x
x
P
l
rhrl
0
0
22
2
1
2
11
kxta wh sin 0sin0
0
l
w
x
x
kxt 2
sin0
0
2 lw
l
x
x
kxt
What is wave energy?
Total energy of wave = potential energy + kinetic energy
8
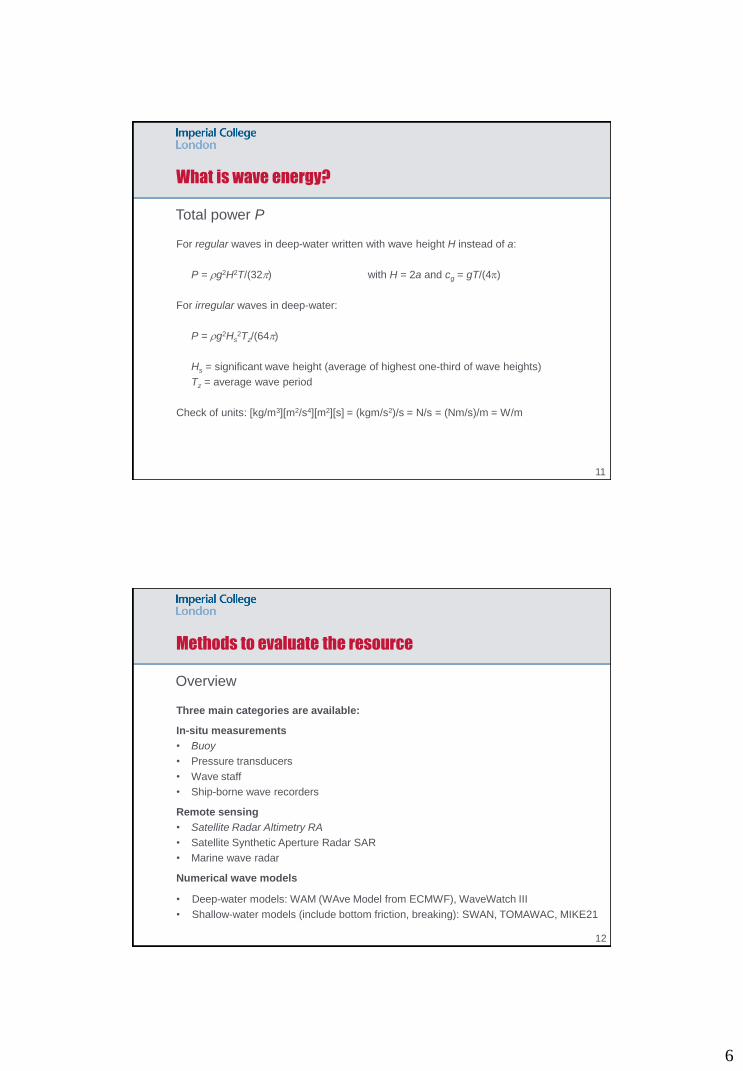
The total kinetic energy is given as the sum of “ 1/2mv2 ” over all fluid particles.
l
u
w
dz
dx
dxdzwumv 222
2
1
2
1 r
222wuvelocity
This expression must be integrated throughout
the fluid flow
lr
l
0
0
0
22
2
1x
x h
K dxdzwuE
The velocity components (u, w) are
kxtkh
hzkau
ww sin
sinh
cosh
kxtkh
hzkaw
ww cos
sinh
sinh
hz
0z

5
Substituting the expressions for (u, w) yields the kinetic energy as
and the total wave energy is
Often it is useful to express the energy as energy per unit wavelength
Assuming deep water condition with gives
2
2
1gaEEE KP r
2
4
1gaEK r
What is wave energy?
Total energy of wave = potential energy + kinetic energy
9
lrll2
2
1gaEE
gk2w
222
4
1TagE r
l
gg cgaEcP 2
2
1r
What is wave energy?
Total energy of wave = potential energy + kinetic energy
10
The energy calculated so far is associated with the total fluid motion and this relates to
water that (averaged over time) remains at the same location
What is the transport of energy across vertical sections of water?
An expression relevant for the energy that is carried forward (transfer of energy) is the
group velocity
where c is the phase velocity
The transmitted power is the product of the energy and the group velocity
)2sinh(
21
2 kh
khccg
kc
w
6
What is wave energy?
For regular waves in deep-water written with wave height H instead of a:
P = rg2H2T/(32) with H = 2a and cg = gT/(4)
For irregular waves in deep-water:
P = rg2Hs2Tz/(64)
Hs = significant wave height (average of highest one-third of wave heights)
Tz = average wave period
Check of units: [kg/m3][m2/s4][m2][s] = (kgm/s2)/s = N/s = (Nm/s)/m = W/m
Total power P
11
Methods to evaluate the resource
Three main categories are available:
In-situ measurements
• Buoy
• Pressure transducers
• Wave staff
• Ship-borne wave recorders
Remote sensing
• Satellite Radar Altimetry RA
• Satellite Synthetic Aperture Radar SAR
• Marine wave radar
Numerical wave models
• Deep-water models: WAM (WAve Model from ECMWF), WaveWatch III
• Shallow-water models (include bottom friction, breaking): SWAN, TOMAWAC, MIKE21
Overview
12

7
Methods to evaluate the resource: In-situ measurements
• Applied to measure waves since the early 1960s
• Work with motion sensors such as accelerometers
• About 3000 buoys are currently under operation
• Buoys can be moored or free floating
Example: significant wave height Hs measured for 31 days with a buoy at EMEC, Scotland
Waverider buoy
Mackay (2012)
13
Methods to evaluate the resource: In-situ measurements
Advantages:
• Measure wave height, period, mean direction,
position, water temperature, wind speed, at-
mospheric pressure as temporal averages
• Direct and accurate measurement at 4 Hz
• Work up to 3 years without service
• Often used to calibrate/validate other systems
Disadvantages:
• Point measurement
• Long-term buoy wave measurement net-
works are relatively few and far between
• Relatively expensive to measure large areas
Ideal for:
• Local measurement next to a WEC
• Calibration and validation of other systems
Waverider buoy
14

8
Methods to evaluate the resource: In-situ measurements
Buoys are mainly operated by meteorological organisations (not all of them
measure wave data) and data are available from e.g.:
• Data Buoy Cooperation Panel DBCP
(joint body of the World Meteorological
Organisation and Intergovernmental
Oceanographic Commission of UNESCO)
• E-SURFMAR
(Surface Marine observation programme
of the Network of European Meteorologi-
cal Services)
• ECMWF
(European Centre for Medium-range
Weather Forecast)
Buoys
E-SURFMAR buoy network in March 2010 15
Methods to evaluate the resource: In-situ measurements
Buoys in Europe (Meyers et al. 2011)
Baltic Sea: Swedish Met Office Portugal: Portuguese Hydrographical Institute 16

9
Methods to evaluate the resource: In-situ measurements
Buoys in Europe (Meyers et al. 2011)
UK and Ireland: UK’s Met
Office and U.S. National
Data Buoy Center
Spain: Spanish National
Ports & Harbours Authority
17
Methods to evaluate the resource: In-situ measurements
Buoys in Europe (Meyers et al. 2011)
Italy and Greece: Vicinanza et al. (2009)
and POSEIDON programme
France and of South UK: U.S. National
Data Buoy Center
18
10
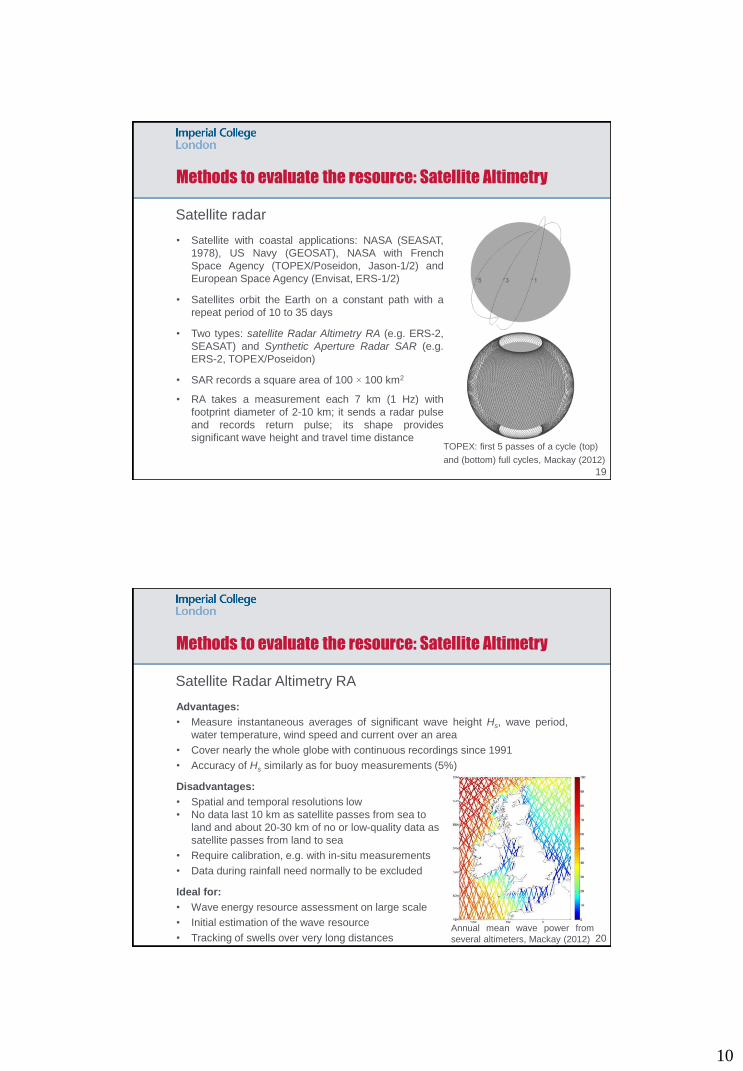
Methods to evaluate the resource: Satellite Altimetry
• Satellite with coastal applications: NASA (SEASAT,
1978), US Navy (GEOSAT), NASA with French
Space Agency (TOPEX/Poseidon, Jason-1/2) and
European Space Agency (Envisat, ERS-1/2)
• Satellites orbit the Earth on a constant path with a
repeat period of 10 to 35 days
• Two types: satellite Radar Altimetry RA (e.g. ERS-2,
SEASAT) and Synthetic Aperture Radar SAR (e.g.
ERS-2, TOPEX/Poseidon)
• SAR records a square area of 100 × 100 km2
• RA takes a measurement each 7 km (1 Hz) with
footprint diameter of 2-10 km; it sends a radar pulse
and records return pulse; its shape provides
significant wave height and travel time distance
Satellite radar
TOPEX: first 5 passes of a cycle (top)
and (bottom) full cycles, Mackay (2012)
19
Methods to evaluate the resource: Satellite Altimetry
Advantages:
• Measure instantaneous averages of significant wave height Hs, wave period,
water temperature, wind speed and current over an area
• Cover nearly the whole globe with continuous recordings since 1991
• Accuracy of Hs similarly as for buoy measurements (5%)
Disadvantages:
• Spatial and temporal resolutions low
• No data last 10 km as satellite passes from sea to
land and about 20-30 km of no or low-quality data as
satellite passes from land to sea
• Require calibration, e.g. with in-situ measurements
• Data during rainfall need normally to be excluded
Ideal for:
• Wave energy resource assessment on large scale
• Initial estimation of the wave resource
• Tracking of swells over very long distances
Satellite Radar Altimetry RA
20 Annual mean wave power from
several altimeters, Mackay (2012)

11
ERS-1 GEOSAT TOPEX/POSEIDON
1991 - 1996 1986 - 1989 1992 - 2005
Operated by European Spa- Operated by US Navy Operated by NASA and CNES
ce Agency, with RA system (mainly classified data) RA system
Methods to evaluate the resource: Satellite Altimetry
Examples satellites
21
Methods to evaluate the resource: Satellite Altimetry
Annual mean wave power between 1996-2007 from several
satellite altimeters binned in 2° (latitude) × 2° (longitude)
Mackay (2012)
22
Power kW/m
12
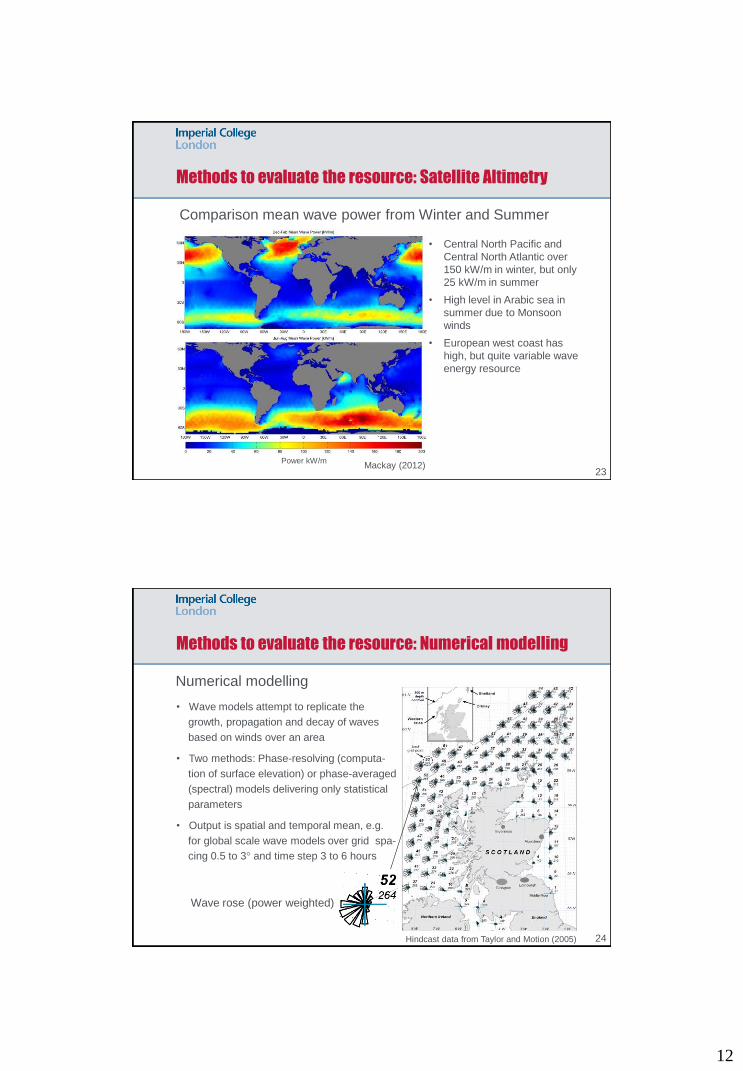
Methods to evaluate the resource: Satellite Altimetry
Mackay (2012)
Comparison mean wave power from Winter and Summer
• Central North Pacific and
Central North Atlantic over
150 kW/m in winter, but only
25 kW/m in summer
• High level in Arabic sea in
summer due to Monsoon
winds
• European west coast has
high, but quite variable wave
energy resource
23
Power kW/m
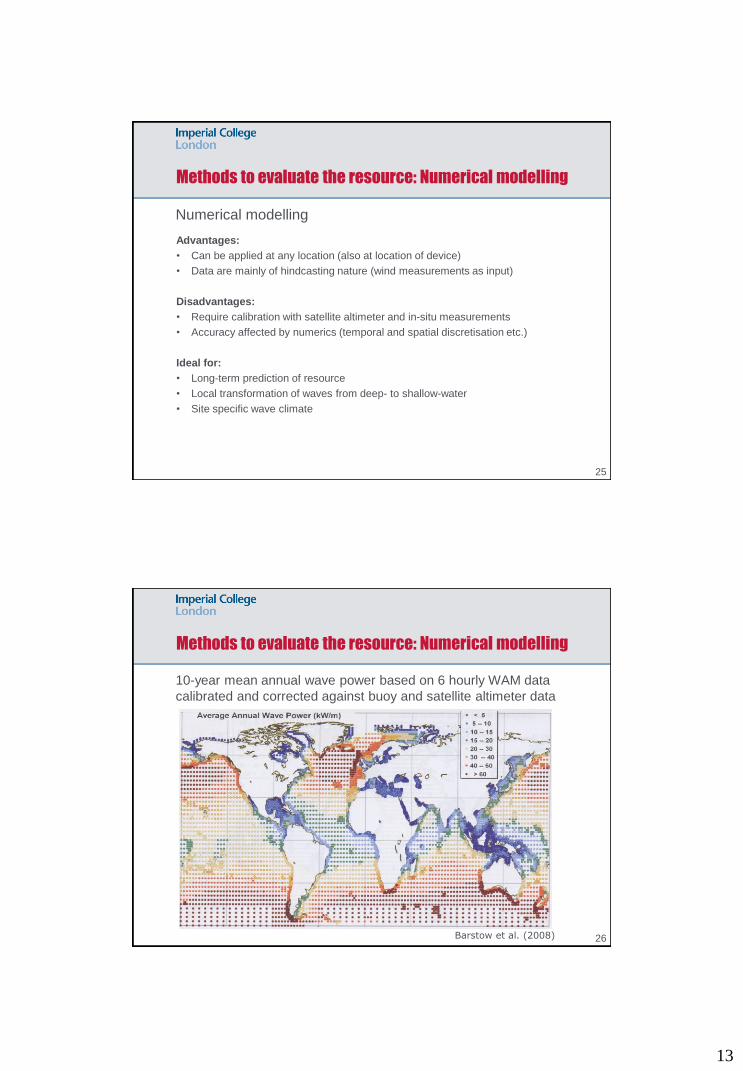
Methods to evaluate the resource: Numerical modelling
• Wave models attempt to replicate the
growth, propagation and decay of waves
based on winds over an area
• Two methods: Phase-resolving (computa-
tion of surface elevation) or phase-averaged
(spectral) models delivering only statistical
parameters
• Output is spatial and temporal mean, e.g.
for global scale wave models over grid spa-
cing 0.5 to 3° and time step 3 to 6 hours
Numerical modelling
Hindcast data from Taylor and Motion (2005) 24
Wave rose (power weighted)
13
Methods to evaluate the resource: Numerical modelling
Advantages:
• Can be applied at any location (also at location of device)
• Data are mainly of hindcasting nature (wind measurements as input)
Disadvantages:
• Require calibration with satellite altimeter and in-situ measurements
• Accuracy affected by numerics (temporal and spatial discretisation etc.)
Ideal for:
• Long-term prediction of resource
• Local transformation of waves from deep- to shallow-water
• Site specific wave climate
Numerical modelling
25
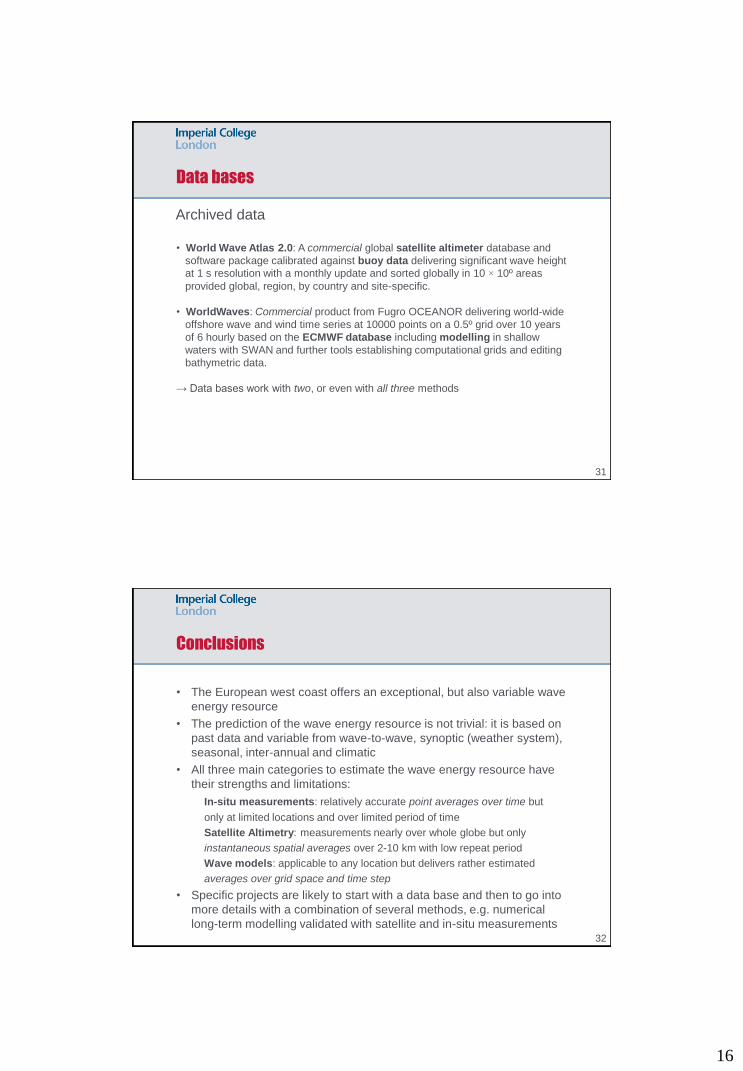
Methods to evaluate the resource: Numerical modelling
10-year mean annual wave power based on 6 hourly WAM data
calibrated and corrected against buoy and satellite altimeter data
Barstow et al. (2008) 26

14
Methods to evaluate the resource: Numerical modelling
10-year mean wave power based on 6 hourly WAM data calibrated
and corrected against buoy and satellite altimeter data
Barstow et al. (2008)
January July
→ Similar conclusions as for summer and winter data of Satellite Altimetry
27
Methods to evaluate the resource: Numerical modelling
10-year mean annual wave power based on 6 hourly WAM data
calibrated and corrected against buoy and satellite altimeter data
28 Barstow et al. (2008)

15
Methods to evaluate the resource: Numerical modelling
Ratio of maximum 100-year significant wave height to mean, based
on 6 hourly WAM data → indication of design cost of a device relative to its income (resource)
29 Barstow et al. (2008)
Data bases
• EuroWaves: A tool based on the model WAM/SWAN which can be used for the
evaluation of wave conditions at any European coastal location (deep- and
shallow-water) calibrated by in-situ and satellite altimeter measurements.
• GlobeWave: The project provides free access to satellite wave data and
products in a common format, both historical and in near real time from various
European and American satellites. It also provides comparisons with in-situ
measurements and interactive data analysis tools.
• WERATLAS (European wave energy atlas): It characterises wave climate and
wave energy statistics in European seas at particular points in the offshore region
based on model predictions and in-situ and satellite altimeter measurements.
Archived data (see Meyers et al. 2010 for more extensive list)
30
16
Data bases
• World Wave Atlas 2.0: A commercial global satellite altimeter database and
software package calibrated against buoy data delivering significant wave height
at 1 s resolution with a monthly update and sorted globally in 10 × 10º areas
provided global, region, by country and site-specific.
• WorldWaves: Commercial product from Fugro OCEANOR delivering world-wide
offshore wave and wind time series at 10000 points on a 0.5º grid over 10 years
of 6 hourly based on the ECMWF database including modelling in shallow
waters with SWAN and further tools establishing computational grids and editing
bathymetric data.
→ Data bases work with two, or even with all three methods
Archived data
31
Conclusions
• The European west coast offers an exceptional, but also variable wave
energy resource
• The prediction of the wave energy resource is not trivial: it is based on
past data and variable from wave-to-wave, synoptic (weather system),
seasonal, inter-annual and climatic
• All three main categories to estimate the wave energy resource have
their strengths and limitations:
In-situ measurements: relatively accurate point averages over time but
only at limited locations and over limited period of time
Satellite Altimetry: measurements nearly over whole globe but only
instantaneous spatial averages over 2-10 km with low repeat period
Wave models: applicable to any location but delivers rather estimated
averages over grid space and time step
• Specific projects are likely to start with a data base and then to go into
more details with a combination of several methods, e.g. numerical
long-term modelling validated with satellite and in-situ measurements
32
17
References
Barstow, S., Mørk, G., Mollison, D., Cruz, J. (2008). The wave energy resource. In:
Ocean wave energy, Cruz, J. (Ed.), p. 93-132, Springer, Berlin.
Kahma, K., Hauser, D., Krogstad, H.E., Lehner, S., Monbaliu, J.A.J., Wyatt, L.,
editors (2005). Measuring and analysing the directional spectra of ocean
waves.
Mackay, E. (2012). Resource assessment for wave energy. In: Ocean Energy,
Bahaj, A.S. (Ed.), Elsevier (in press).
Myers, L.E., Bahaj, A.S., Heller, V., Retzler, C., Dhedin, J.-F., Ricci, P., Duperray, O.,
Mendia, J.L. (2010). Site matching and interaction effects. D5.4 of Equitable
testing and evaluation of marine energy extraction devices in terms of
performance, cost and environmental impact (EquiMar). FP7 of EC, Brussels.
Spinneken, J. (2011). Introduction to wave power A Resource assessment. Slide to
module CI441: Floating body hydrodynamics & Wave energy extraction, Imperial
College London.
Taylor, J.R.M., Motion, A.G. (2005). Estimating wave energy in Scottish waters from
hindcast data. Proceeding of the 6th European Wave and Tidal Energy Conference
EWTEC, Glasgow, p. 501-508.
Vicinanza, D., Cappietti, L., Contestabile, P. (2009). Assessment of Wave Energy around
Italy. Proc. of the 8th European Wave and Tidal Energy Conference, p. 256-262,
Uppsala, Sweden.
There are many further case studies for particular countries or regions available. 33