water/energy nexus strategies
TRANSCRIPT

Water/Energy
Nexus
Strategies
CPUC Water/Energy Workshop
March 20, 2013
Richard W. Harris
Water Conservation Manager
Overview
• EBMUD Energy Management
• EBMUD and PG&E Partnering
• W/E Technology Deployment Synergies
• Challenges & Opportunities
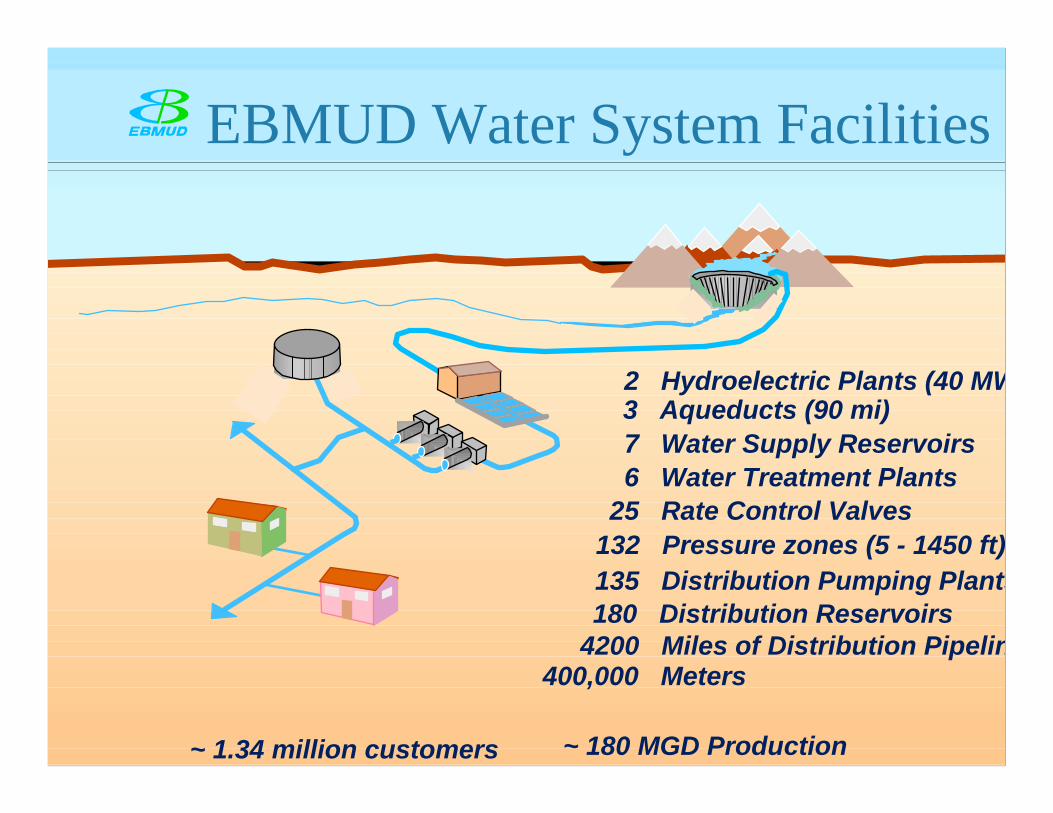
EBMUD Water System Facilities
180 Distribution Reservoirs
3 Aqueducts (90 mi)7 Water Supply Reservoirs6 Water Treatment Plants
25 Rate Control Valves
135 Distribution Pumping Plants
4200 Miles of Distribution Pipelin
2 Hydroelectric Plants (40 MW
132 Pressure zones (5 - 1450 ft)
400,000 Meters
~ 1.34 million customers ~ 180 MGD Production

EBMUD Background
• EBMUD annual energy expense ~$11 million*
• 90% of water supply from Mokelumne River Watershed
• Pre-Drought – Approximately 220 MGD average water production
• Post-Drought – Approximately 180 MGD average water production
*Potable water treatment and distribution only
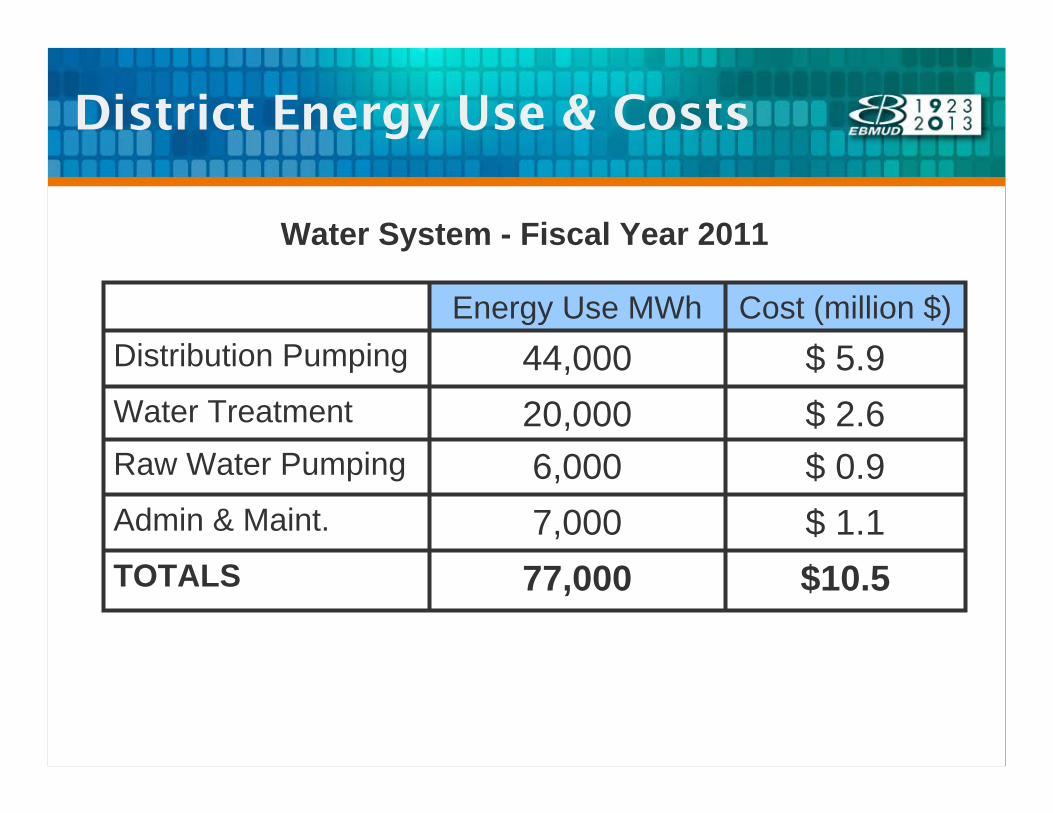
District Energy Use & Costs
$10.577,000TOTALS$ 1.17,000Admin & Maint.$ 0.96,000Raw Water Pumping$ 2.620,000Water Treatment$ 5.944,000Distribution Pumping
Cost (million $)Energy Use MWh
Water System - Fiscal Year 2011

EBMUD Energy Use (kWh/MG)
3,950
917
1,610
1,423
Dry Year*Normal YearWater System
Supply/Conveyance 177
Treatment 156
Distribution 917
TOTAL 1,250
* Dry Year Scenario: Includes Mokelumne supply, supplemental water supply, desalination, groundwater and recycled water
• Gravity Water Customers (~55%)= ~ 400 kWh / MG
• Pumped Water Customers (~45%) ~ 2000 kWh/ MG
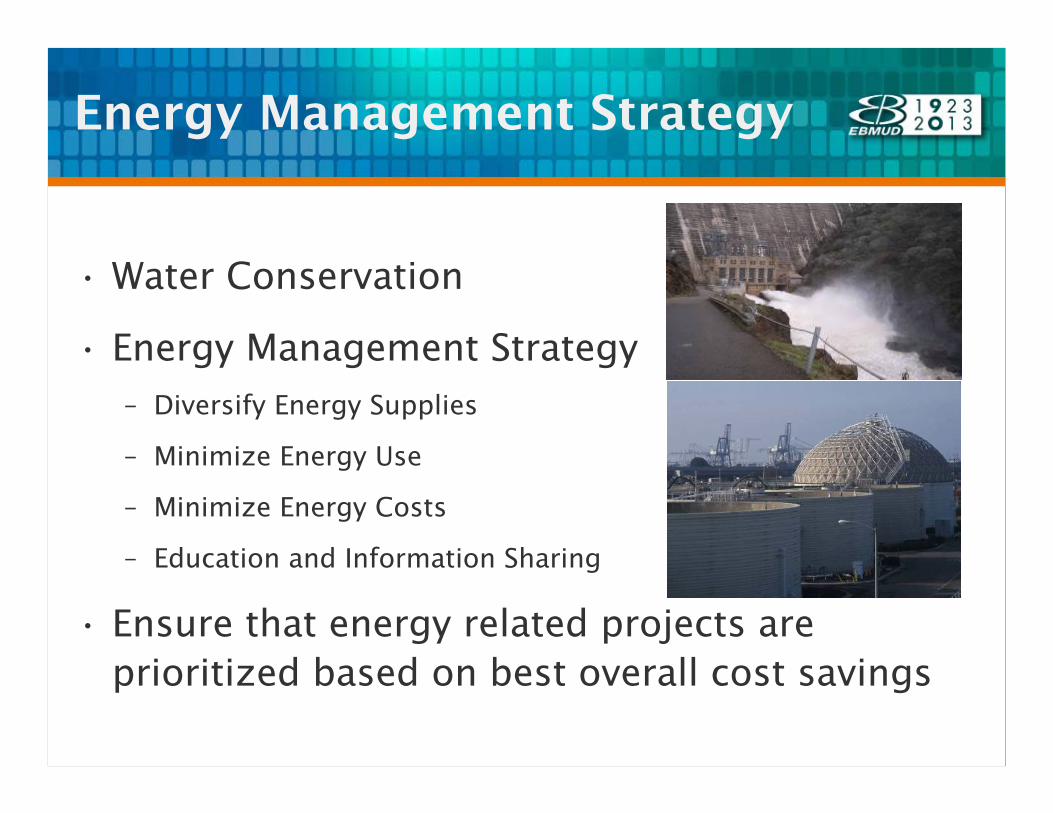
Energy Management Strategy
• Water Conservation
• Energy Management Strategy– Diversify Energy Supplies
– Minimize Energy Use
– Minimize Energy Costs
– Education and Information Sharing
• Ensure that energy related projects are prioritized based on best overall cost savings
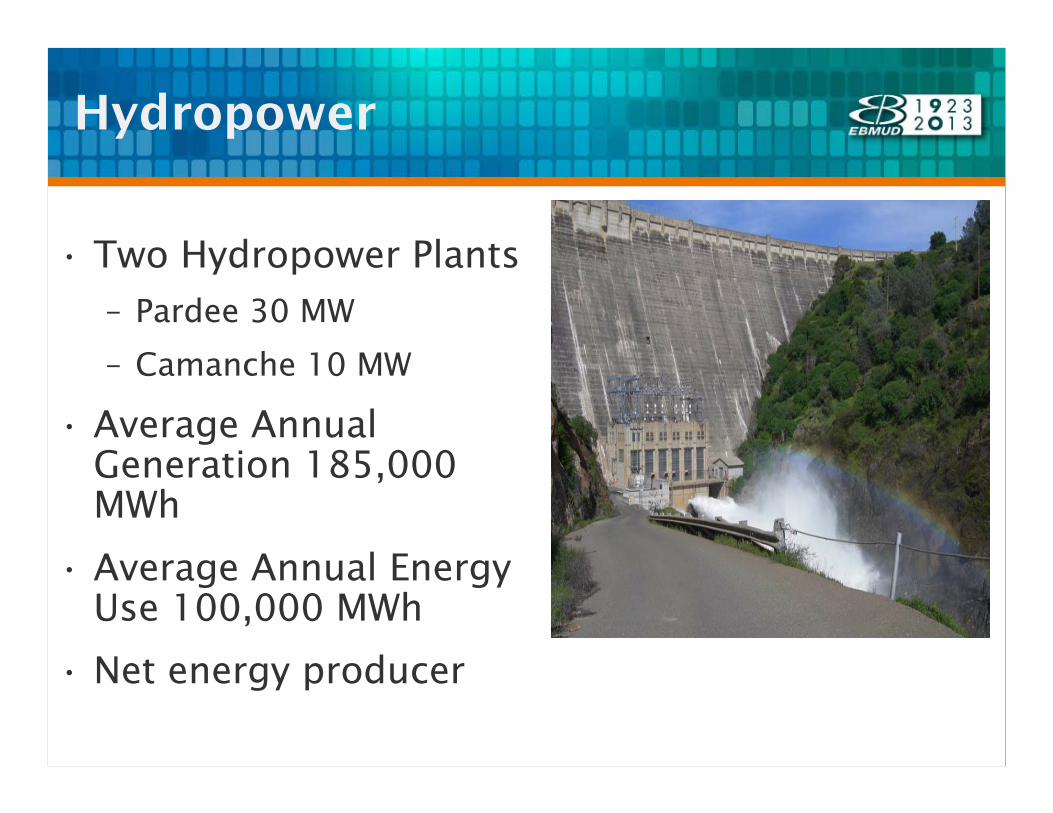
Hydropower
• Two Hydropower Plants– Pardee 30 MW
– Camanche 10 MW
• Average Annual Generation 185,000 MWh
• Average Annual Energy Use 100,000 MWh
• Net energy producer

Wastewater Cogeneration
• Renewable energy production doubled from 2 MW to 4.5 MW
• Power plant capacity expansion to 11 MW completed in 2010
• 2012 - “Net energy producer” generating more renewable electricity onsite than required for demand.

PV Power Purchase Agreements
• Purchase of electricity from a third party owned & operated PV system on District property
– No capital investment or maintenance costs
– Investors keep tax credits, Rebates, GHG and REC
– Performance based, pay for power produced
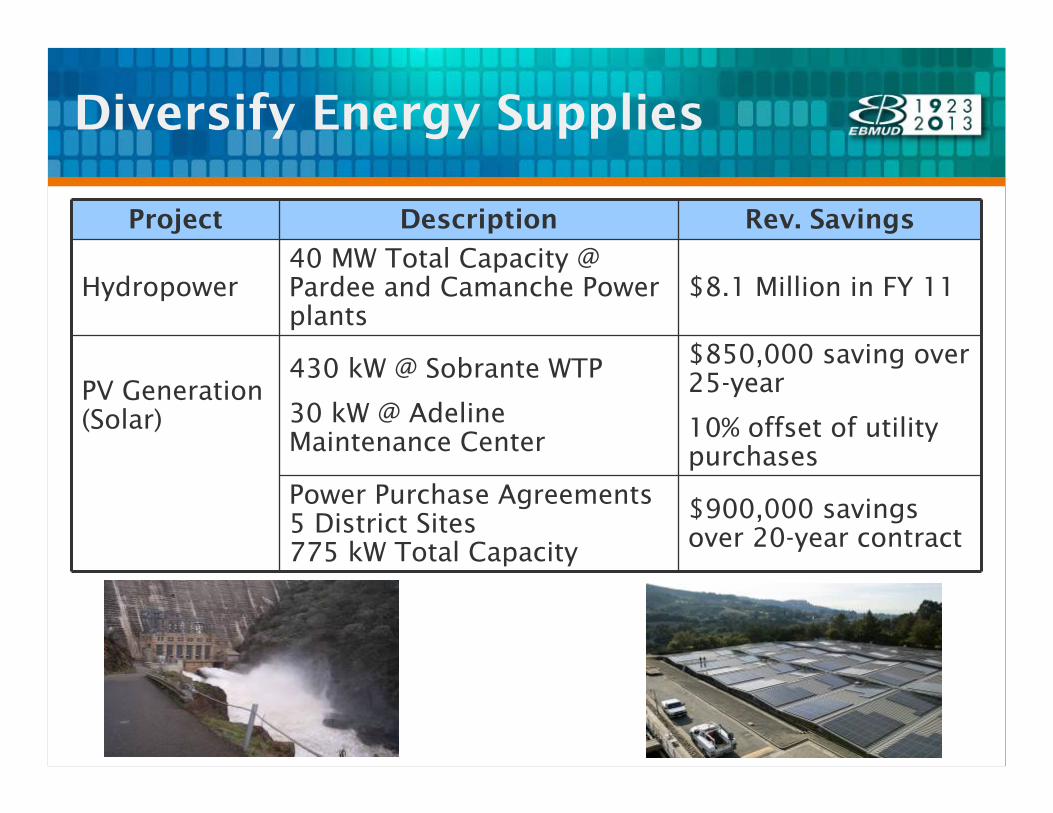
Diversify Energy Supplies
Project Description Rev. Savings
Hydropower40 MW Total Capacity @ Pardee and Camanche Power plants
$8.1 Million in FY 11
PV Generation (Solar)
430 kW @ Sobrante WTP
30 kW @ Adeline Maintenance Center
$850,000 saving over 25-year
10% offset of utility purchases
Power Purchase Agreements 5 District Sites 775 kW Total Capacity
$900,000 savings over 20-year contract
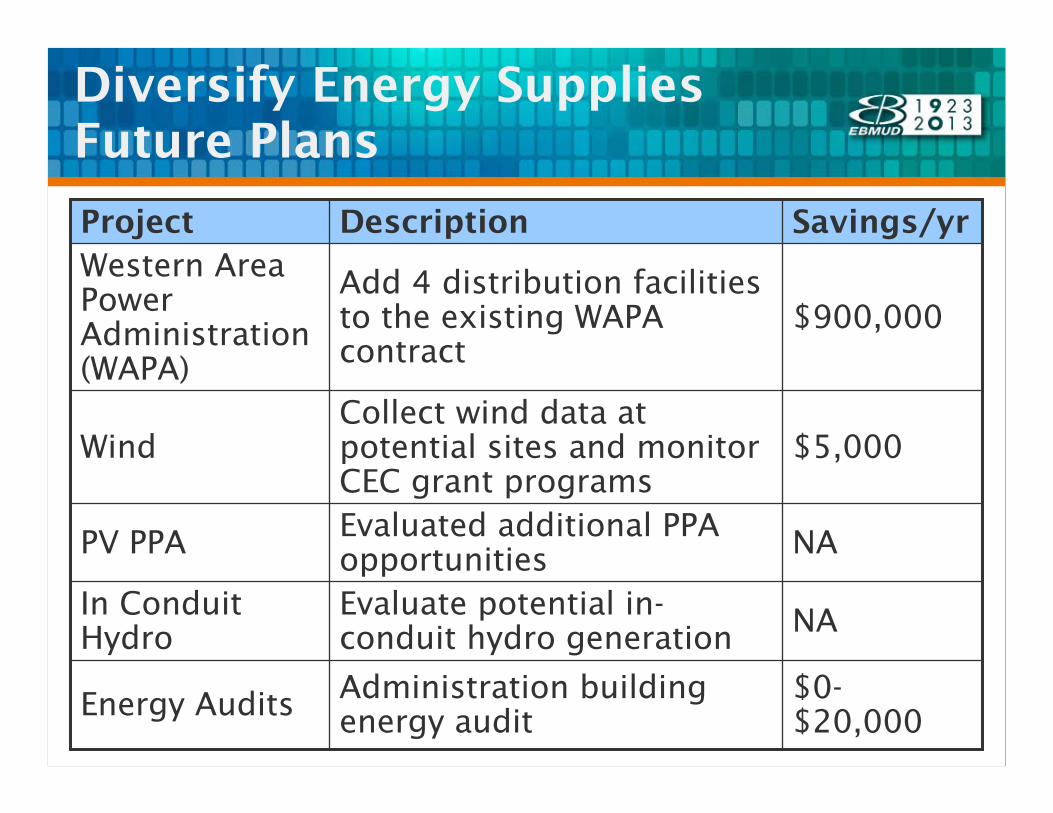
Diversify Energy SuppliesFuture Plans
NAEvaluated additional PPA opportunitiesPV PPA
NAEvaluate potential in-conduit hydro generation
In Conduit Hydro
$5,000Collect wind data at potential sites and monitor CEC grant programs
Wind
$0-$20,000
Administration building energy auditEnergy Audits
$900,000Add 4 distribution facilities to the existing WAPA contract
Western Area Power Administration (WAPA)
Savings/yrDescriptionProject

Minimize Energy CostsEnergy Optimization Software
• EBMUD: > 30% ~$1M savings over 4 years
• Interface with SCADA System
• State Estimator Data Scrubber
• Water Demand Forecast
• Water Quality Module
• Energy Cost Forecast
• Pump Schedule Optimization
• System Monitoring & Alarm
Medium Size Electric Accounts
-
4,000
8,000
12,000
16,000
20,000
0 4 8 12 16 20 24
Time of the Day
KW
$-
$0.1000
$0.2000
$0.3000
$0.4000
$ / K
Wh
Load Electric Rates
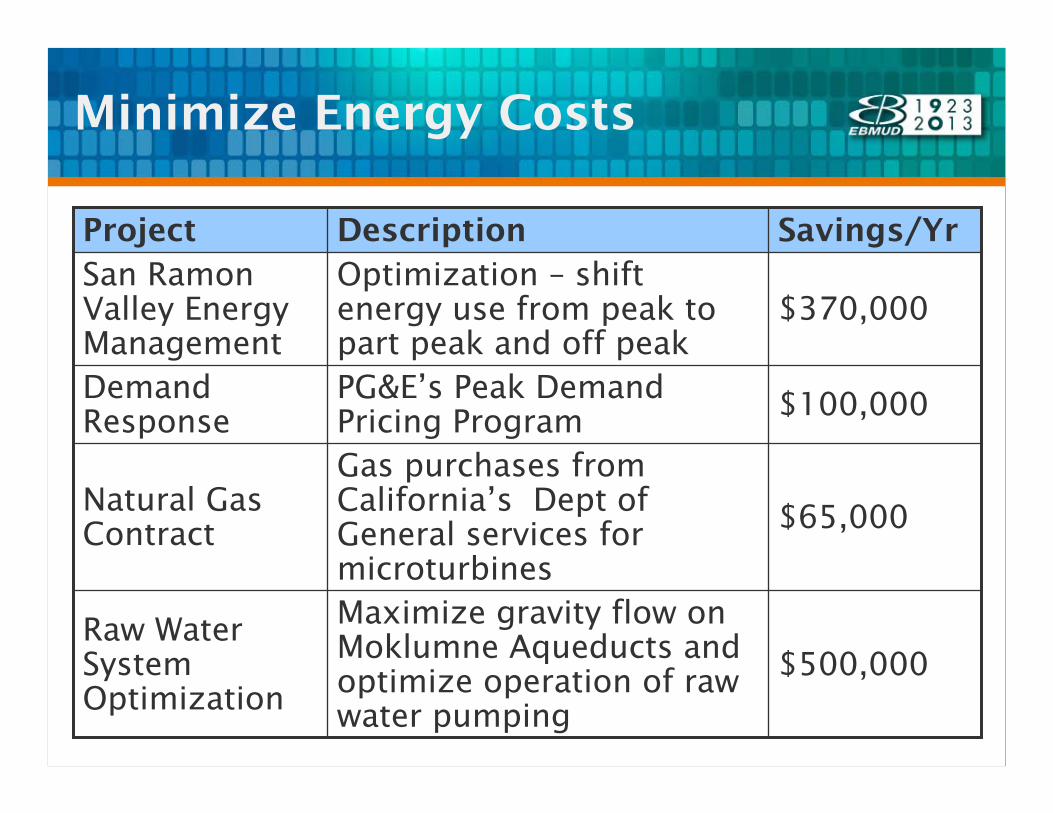
Minimize Energy Costs
$65,000
Gas purchases from California’s Dept of General services for microturbines
Natural Gas Contract
$500,000
Maximize gravity flow on Moklumne Aqueducts and optimize operation of raw water pumping
Raw Water System Optimization
$100,000PG&E’s Peak Demand Pricing Program
Demand Response
$370,000Optimization – shift energy use from peak to part peak and off peak
San Ramon Valley Energy Management
Savings/YrDescriptionProject

Minimize Energy Use
$ 35,000Toyota hybrid fleetHybrid Fleet
$44,000High efficiency lightning replacement at Lafayette, Orinda and Sobrante WTP
WTP Lightning Upgrades
$125,000600 kW @ admin buildingNatural Gas Microturbines
Savings/YrDescriptionProject

Energy Management Strategy Summary
• Net Energy Producer (157,000 MWh excess generation in FY11)
• Savings to Date
– $ 1.2 million per year
– PV Projects $1.8 million over 20/25 years
• Future Savings
– Additional $1.0 million - $1.2 million per year

Energy Management Strategy Summary
• Energy use will continue to be a significant factor in the future
– Climate change may alter existing supplies and current energy use
– Supplemental supplies typically require more energy
– Cost of energy sources from fossil fuel difficult for water utilities to control
– Renewable energy projects and water conservation mitigate greenhouse gas emissions and stabilize energy use

EBMUD – PG&E Partnerships
• Water/energy rebate for residential clotheswashers
• Joint customer water/energy audits/referral program
• Joint research with Food Service Technology Center– Ice machines
– Connectionless Steamers
– Pre-Rinse Spray Valves
• Energy rebates for utility scale projects (PV, micro-turbines, biodiesel, in-conduit hydro, etc.)
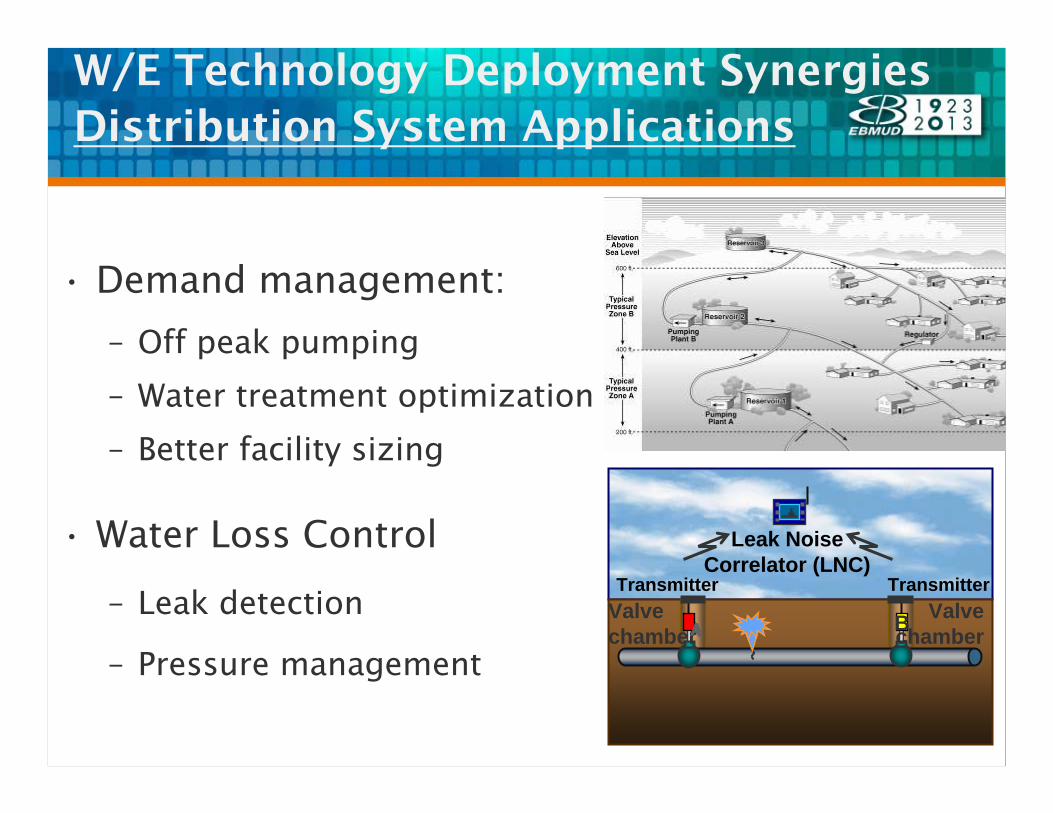
W/E Technology Deployment SynergiesDistribution System Applications
• Demand management:
– Off peak pumping
– Water treatment optimization
– Better facility sizing
• Water Loss Control
– Leak detection
– Pressure management
Transmitter Transmitter
Leak Noise Correlator (LNC)
AValvechamber
ValvechamberBA

W/E Technology Deployment SynergiesSmart Metering Infrastructure
• Potential to share/integrate
infrastructure and/or services
• Provide customers with integrated
website/usage reports
• Pursue water/energy and
embedded energy savings

EBMUD WaterSmart Toolbox

• Food Service & Hospitality Sectors– Self-contained (connectionless) food steamers– Commercial dishwashers– Pre-rinse spray valves– Air-cooled ice machines
• Health Care/Medical Sector– X-ray film & photo processors– Steam sterilizers
• General Application– Weather-based irrigation controllers– Hot water delivery systems– Laundry equipment – Car washing– Gray water systems
W/E Technology Deployment SynergiesEnd User Applications

W/E Technology Deployment SynergiesLandscape Irrigation Water Budgets

Salvador Bloom123 Main StreetEverytown, USA
W/E Technology Deployment SynergiesHome Water-Energy Reports

Challenges and Opportunites
Challenges
• Need to address efficiency gains and GHG/carbon credits double counting perceptions
• Cost of energy sources from fossil fuel difficult for water utilities to control
• Differential in water and energy costs and ROI
Opportunities
• Advance utility, market and consumer awareness
• Improve and expand on W/E data collection and metrics
• Analyze and promote incentive funding for cold and hot water efficiency programs that save energy
• Expand public-private efficiency partnerships