waterbirds in the uk 2011/12 - bto · chas holt (bto), andy musgrove (bto), david stroud (jncc),...
TRANSCRIPT
Waterbirds in the UK 2011/12 1
Waterbirds in the UK 2011/12
The annual report of the Wetland Bird Survey
in associationwith

Waterbirds in the UK 2011/122
WATERBIRDS IN THE UK 2011/12Th is is the 31st annual report of the Wetland Bird Survey (WeBS), produced in conjunction with an online report at www.bto.org/webs-reporting. WeBS is the principal scheme for monitoring the populations of the UK’s wintering waterbirds, providing an important indicator of the status of waterbird populations and the health of wetlands.
British Trust for Ornithology The Nunnery Thetford Norfolk IP24 2PU www.bto.org
Joint Nature Conservation Committee Monkstone House City Road Peterborough PE1 1JY www.jncc.defra.gov.uk
Royal Society for the Protection of Birds The Lodge Sandy Bedfordshire SG19 2DL www.rspb.org.uk
Report design and production was by the WeBS
team, with article contributions from Olivia Crowe
(I-WeBS, page 27) and Kane Brides (Pochards,
page 33). We are grateful to Kate Risely and Jane
Waters for their help in preparation of the report.
This report was printed by Swallowtail Print, using
paper from responsible sources.
THE WeBS PARTNERSHIPTh e Wetland Bird Survey (WeBS) is run by the British Trust for Ornithology (BTO). It is a partnership funded by the BTO, the Royal Society for the Protection of Birds (RSPB) and the Joint Nature Conservation Committee (JNCC) (the last on behalf of the statutory nature conservation agencies: Natural England, Natural Resources Wales and Scottish Natural Heritage and the Department of the Environment Northern Ireland), in association with the Wildfowl & Wetlands Trust (WWT).
Th e members of the WeBS Steering Committee in 2011/12 were Chas Holt (BTO), Andy Musgrove (BTO), David Stroud (JNCC), Simon Wotton (RSPB) and Richard Hearn (WWT).
THE WeBS TEAM AT THE BTOChas Holt - WeBS National CoordinatorHeidi Mellan - Counter Network OrganiserNeil Calbrade - Low Tide Count OrganiserGraham Austin - Database ManagerWarren Read - Web Software DeveloperAndy Musgrove - Head of BTO Monitoring Email: fi [email protected]
General enquiries to WeBS: WeBS, The Nunnery, BTO, Thetford, Norfolk IP24 2PUEmail: [email protected] Tel: 01842 750050
WeBS website: www.bto.org/webs
Other contacts:Goose & Swan Monitoring Programme - organised and funded by WWT, JNCC and SNH. Email: [email protected] national waterbird surveys - details of (and contacts for) other waterbird surveys can be obtained via the websites of the WeBS partner organisations.
Committee (WeBS LOAC) in 2011/12 were:
John Armitage, Neil Bielby, Gladys Grant, Andrew
King, Ian Lees, Nick Mason, Dave Shackleton and
Shane Wolsey. See the back cover of this report
for a list of all WeBS Local Organisers, to whom
we send our hearty thanks.
We are very grateful to the JNCC for funding the
development of the online interface produced in
conjunction with this paper report. The BTO IS
Team continue to develop and provide support
for the WeBS Online data submission system.
The painting of three Turnstones used as the
cover of Waterbirds in the UK 2011/12 is by Ray
Scally. More of Ray’s artwork can be seen at
www.rayscally.co.uk.
ACKNOWLEDGEMENTS
We are indebted to the efforts of all WeBS
Counters and grateful to the following for
providing technical assistance, supplementary
information, additional data, or particularly
invaluable help in 2011/12: Carl Barimore, Bob
Blogg,, Niall Burton, Lee Cadwell, Mark Collier,
Aonghais Cook, Olivia Crowe, Iain Downie,
Norman Elkins, Simon Gillings, Colette Hall, Paul
Harvey, Martin Heubeck, Menno Hornman,
Andrew Joys, Maria Knight, John Marchant,
Veronica Mendez, Carl Mitchell, Nick Moran,
Deborah Procter, John Shillitoe, SOTEAG, Rick
Vonk, Colin Wells, Chris Waltho and Karen Wright.
Grateful thanks to all and apologies to anyone
who has been inadvertently missed.
Members of the WeBS Local Organiser Advisory
Wildfowl & Wetlands TrustSlimbridge Slimbridge Gloucestershire Gloucestershire GL2 7BT GL2 7BT www.wwt.org.uk
Waterbirds in the UK 2011/12 3
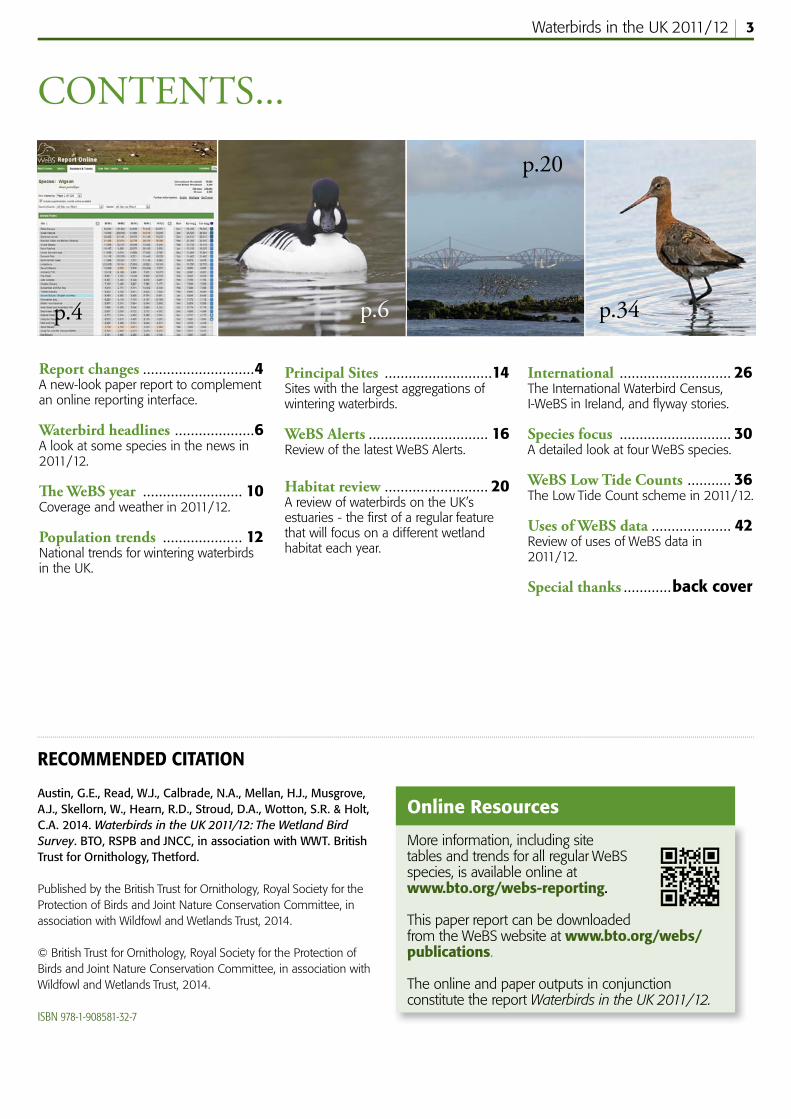
Report changes ............................4A new-look paper report to complement an online reporting interface.
Waterbird headlines ....................6A look at some species in the news in 2011/12.
Th e WeBS year ......................... 10Coverage and weather in 2011/12.
Population trends .................... 12National trends for wintering waterbirds in the UK.
CONTENTS...
RECOMMENDED CITATION
Austin, G.E., Read, W.J., Calbrade, N.A., Mellan, H.J., Musgrove, Austin, G.E., Read, W.J., Calbrade, N.A., Mellan, H.J., Musgrove, A.J., Skellorn, W., Hearn, R.D., Stroud, D.A., Wotton, S.R. & Holt, A.J., Skellorn, W., Hearn, R.D., Stroud, D.A., Wotton, S.R. & Holt, C.A. 2014. C.A. 2014. Waterbirds in the UK 2011/12: The Wetland Bird Waterbirds in the UK 2011/12: The Wetland Bird SurveySurvey. BTO, RSPB and JNCC, in association with WWT. British . BTO, RSPB and JNCC, in association with WWT. British Trust for Ornithology, Thetford.Trust for Ornithology, Thetford.
Published by the British Trust for Ornithology, Royal Society for the Published by the British Trust for Ornithology, Royal Society for the Protection of Birds and Joint Nature Conservation Committee, in Protection of Birds and Joint Nature Conservation Committee, in association with Wildfowl and Wetlands Trust, 2014.association with Wildfowl and Wetlands Trust, 2014.
© British Trust for Ornithology, Royal Society for the Protection of © British Trust for Ornithology, Royal Society for the Protection of Birds and Joint Nature Conservation Committee, in association with Birds and Joint Nature Conservation Committee, in association with Wildfowl and Wetlands Trust, 2014.Wildfowl and Wetlands Trust, 2014.
ISBN 978-1-908581-32-7ISBN 978-1-908581-32-7
Principal Sites ...........................14Sites with the largest aggregations of wintering waterbirds.
WeBS Alerts .............................. 16Review of the latest WeBS Alerts.
Habitat review .......................... 20A review of waterbirds on the UK’s estuaries - the fi rst of a regular feature that will focus on a different wetland habitat each year.
International ............................ 26The International Waterbird Census, I-WeBS in Ireland, and fl yway stories.
Species focus ............................ 30A detailed look at four WeBS species.
WeBS Low Tide Counts ........... 36The Low Tide Count scheme in 2011/12.
Uses of WeBS data .................... 42Review of uses of WeBS data in 2011/12.
Special thanks ............back cover
p.4 p.6
p.20
p.34
Online Resources
More information, including site tables and trends for all regular WeBS species, is available online at www.bto.org/webs-reporting.
This paper report can be downloaded from the WeBS website at www.bto.org/webs/publications.
The online and paper outputs in conjunction constitute the report Waterbirds in the UK 2011/12.
Waterbirds in the UK 2011/124
THE NEW REPORT
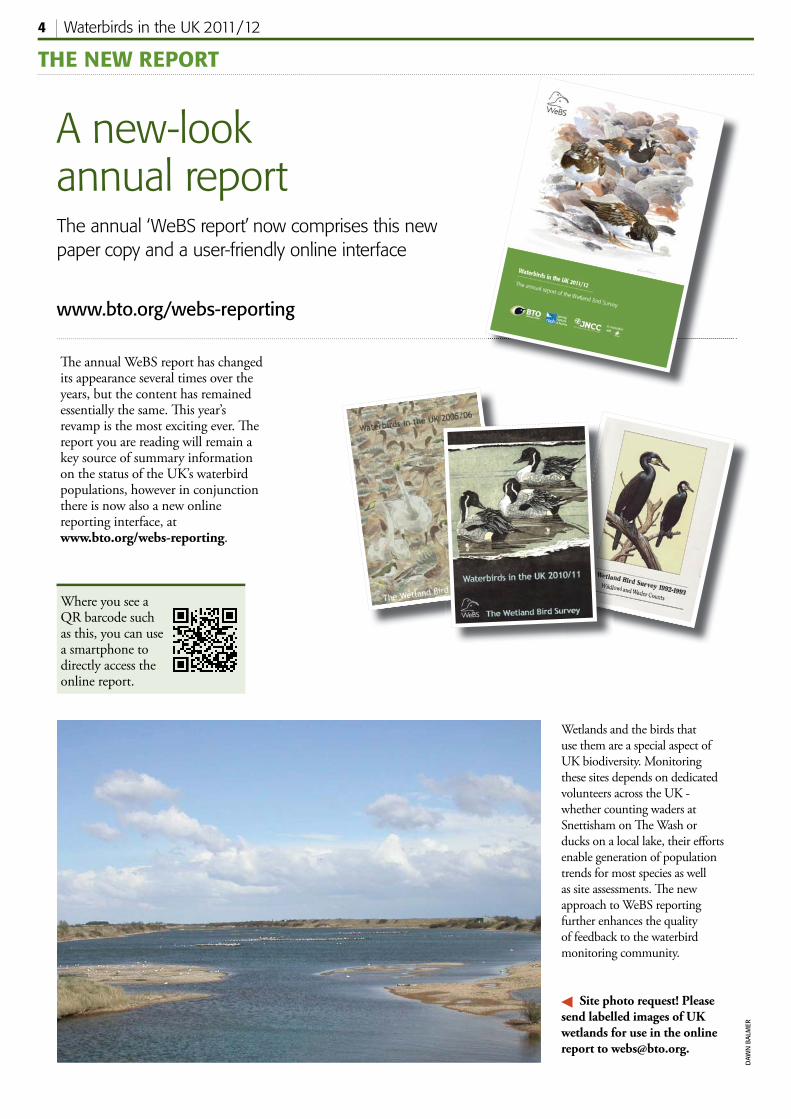
A new-look annual reportThe annual ‘WeBS report’ now comprises this new paper copy and a user-friendly online interface
Th e annual WeBS report has changed its appearance several times over the years, but the content has remained essentially the same. Th is year’s revamp is the most exciting ever. Th e report you are reading will remain a key source of summary information on the status of the UK’s waterbird populations, however in conjunction there is now also a new online reporting interface, at www.bto.org/webs-reporting.
Wetlands and the birds that use them are a special aspect of UK biodiversity. Monitoring these sites depends on dedicated volunteers across the UK - whether counting waders at Snettisham on Th e Wash or ducks on a local lake, their eff orts enable generation of population trends for most species as well as site assessments. Th e new approach to WeBS reporting further enhances the quality of feedback to the waterbird monitoring community.
Site photo request! Please send labelled images of UK wetlands for use in the online report to [email protected].
DAW
N B
ALM
ER
Where you see a QR barcode suchas this, you can use a smartphone to directly access the online report.
www.bto.org/webs-reporting
Waterbirds in the UK 2011/12 5
FIND OUT MUCH MORE...
For the online report, see www.bto.org/webs-reporting
The Numbers & Trends section features species trends (for the UK and Constituent Countries) and site tables for all species (with facility to fi lter by country, county and habitat), alongside sections on Low Tide Counts and WeBS Alerts. There is also a Help section containing tutorials.
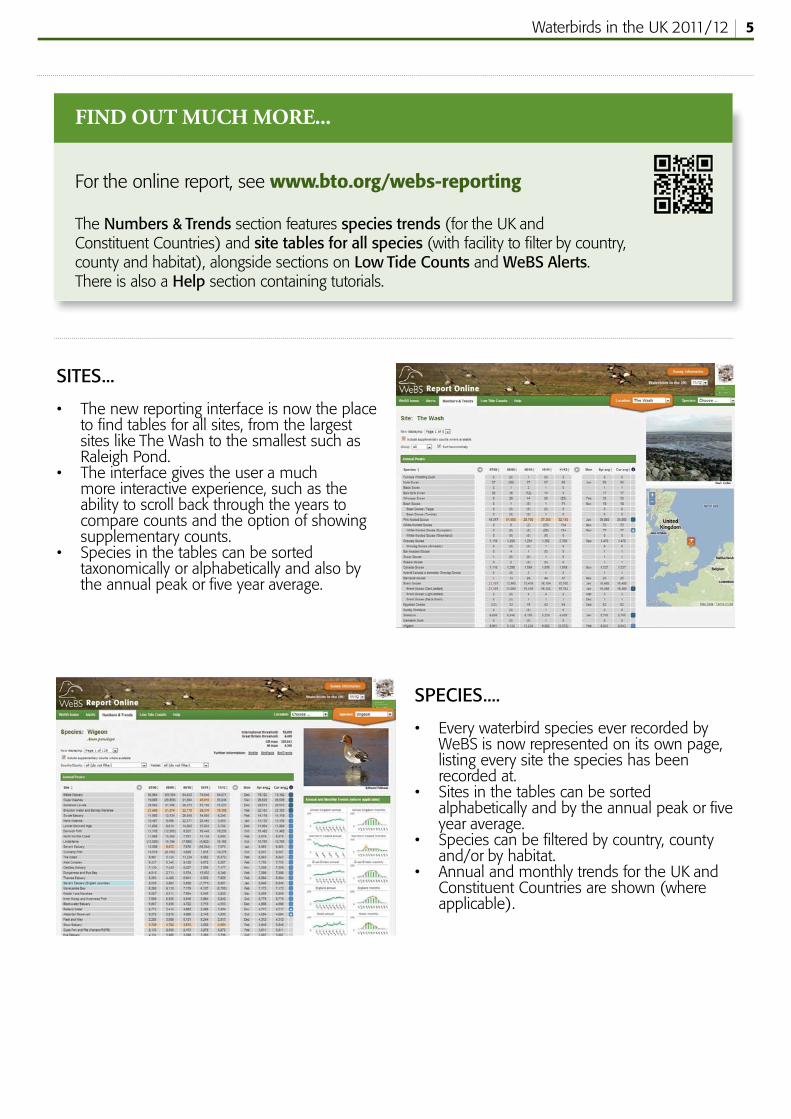
SITES...
• The new reporting interface is now the place to fi nd tables for all sites, from the largest sites like The Wash to the smallest such as Raleigh Pond.
• The interface gives the user a much more interactive experience, such as the ability to scroll back through the years to compare counts and the option of showing supplementary counts.
• Species in the tables can be sorted taxonomically or alphabetically and also by the annual peak or fi ve year average.
SPECIES....
• Every waterbird species ever recorded by WeBS is now represented on its own page, listing every site the species has been recorded at.
• Sites in the tables can be sorted alphabetically and by the annual peak or fi ve year average.
• Species can be fi ltered by country, county and/or by habitat.
• Annual and monthly trends for the UK and Constituent Countries are shown (where applicable).
Waterbirds in the UK 2011/126
Waterbird headlines from 2011/12
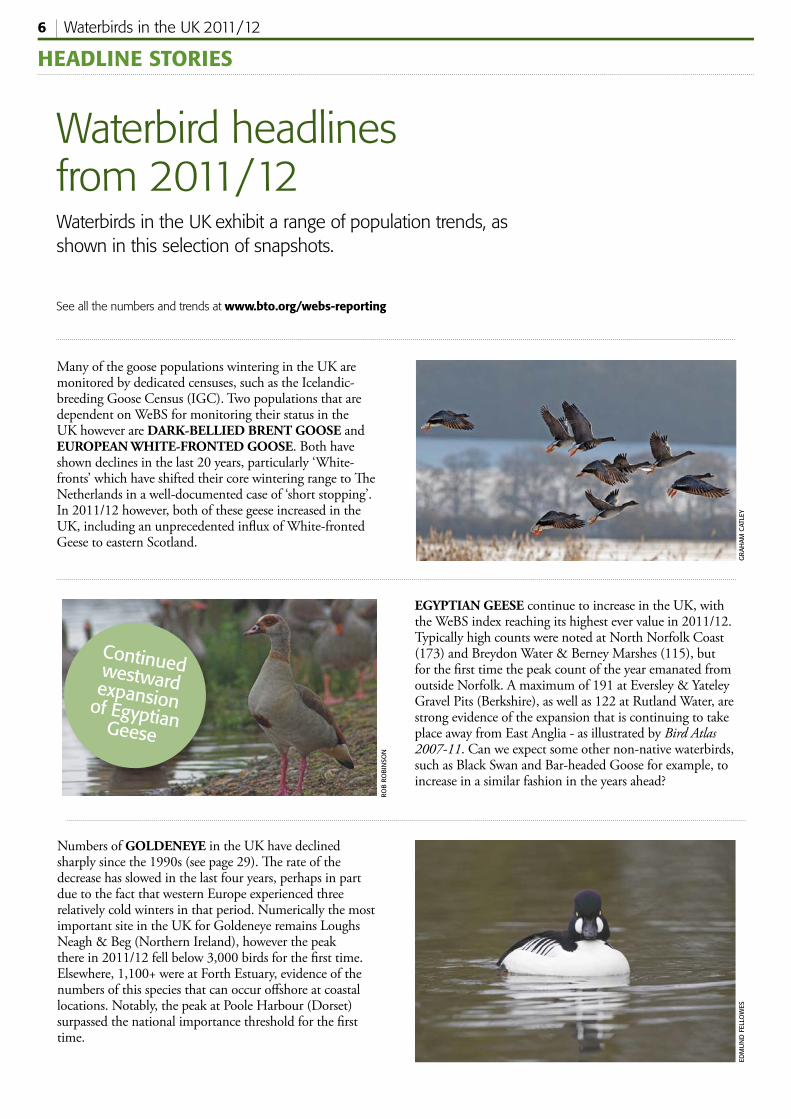
Many of the goose populations wintering in the UK are monitored by dedicated censuses, such as the Icelandic-breeding Goose Census (IGC). Two populations that are dependent on WeBS for monitoring their status in the UK however are DARK-BELLIED BRENT GOOSE and EUROPEAN WHITE-FRONTED GOOSE. Both have shown declines in the last 20 years, particularly ‘White-fronts’ which have shifted their core wintering range to Th e Netherlands in a well-documented case of ‘short stopping’. In 2011/12 however, both of these geese increased in the UK, including an unprecedented infl ux of White-fronted Geese to eastern Scotland.
Waterbirds in the UK exhibit a range of population trends, as shown in this selection of snapshots.
HEADLINE STORIES
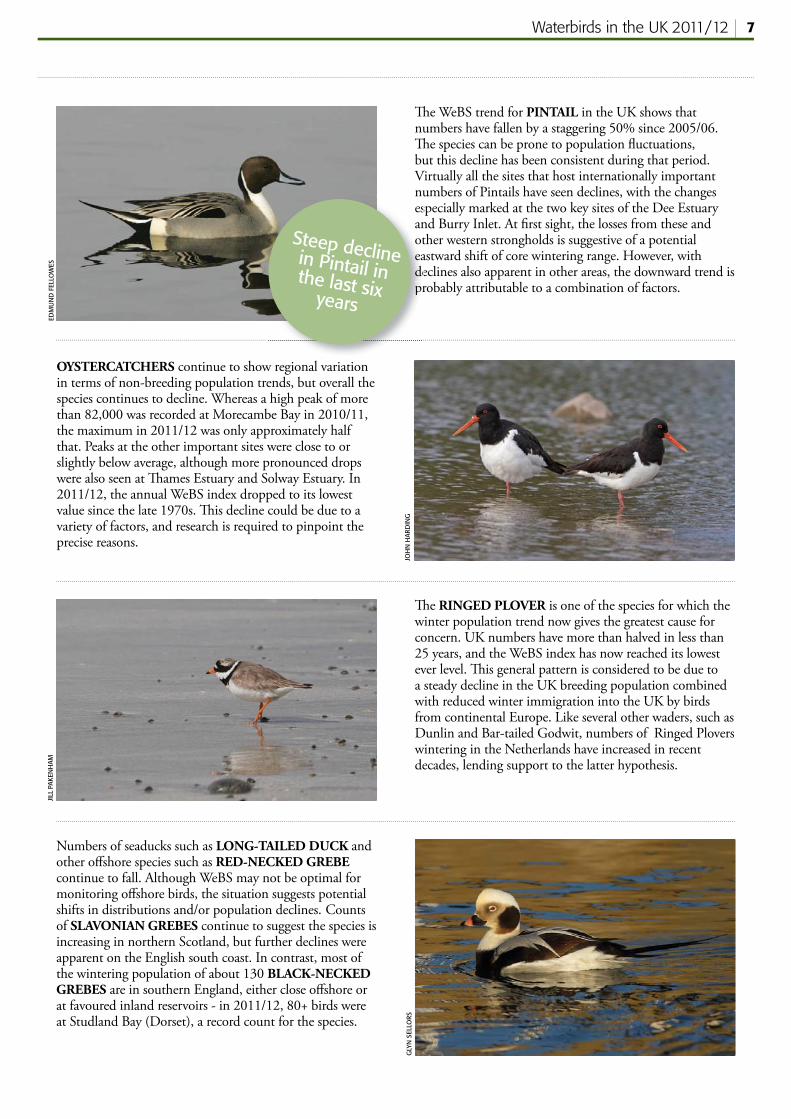
EGYPTIAN GEESE continue to increase in the UK, with the WeBS index reaching its highest ever value in 2011/12. Typically high counts were noted at North Norfolk Coast (173) and Breydon Water & Berney Marshes (115), but for the fi rst time the peak count of the year emanated from outside Norfolk. A maximum of 191 at Eversley & Yateley Gravel Pits (Berkshire), as well as 122 at Rutland Water, are strong evidence of the expansion that is continuing to take place away from East Anglia - as illustrated by Bird Atlas 2007-11. Can we expect some other non-native waterbirds, such as Black Swan and Bar-headed Goose for example, to increase in a similar fashion in the years ahead?
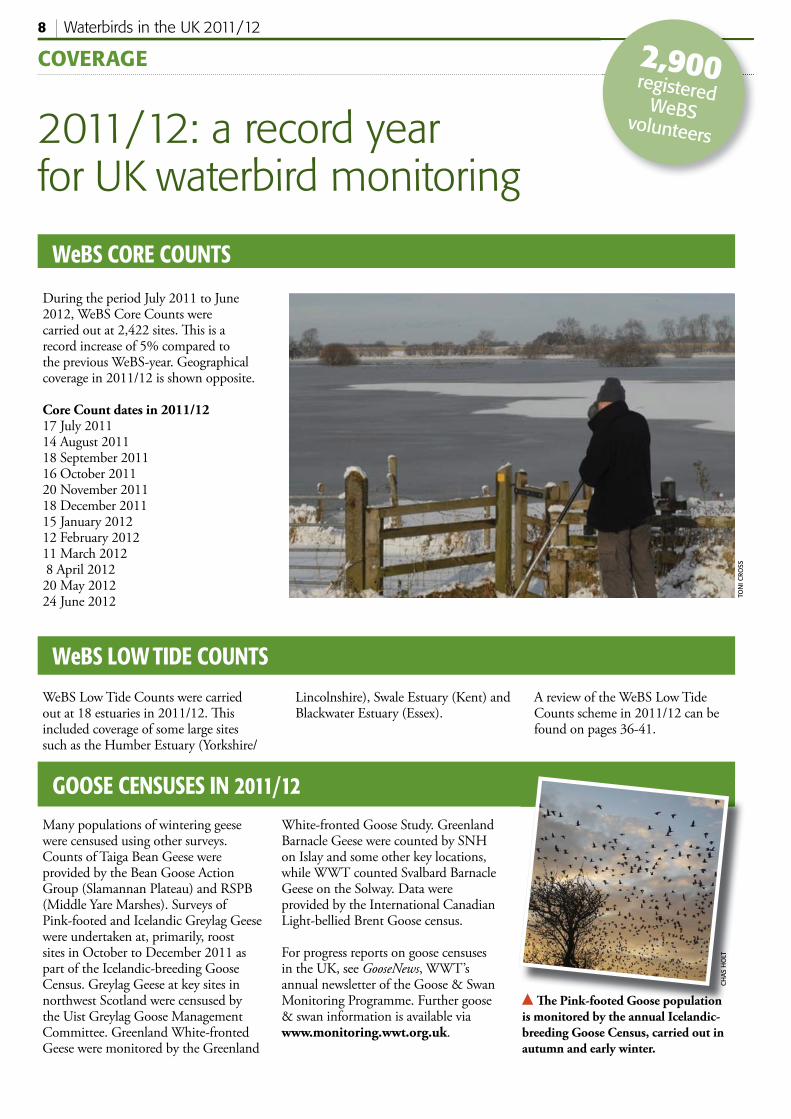
Numbers of GOLDENEYE in the UK have declined sharply since the 1990s (see page 29). Th e rate of the decrease has slowed in the last four years, perhaps in part due to the fact that western Europe experienced three relatively cold winters in that period. Numerically the most important site in the UK for Goldeneye remains Loughs Neagh & Beg (Northern Ireland), however the peak there in 2011/12 fell below 3,000 birds for the fi rst time. Elsewhere, 1,100+ were at Forth Estuary, evidence of the numbers of this species that can occur off shore at coastal locations. Notably, the peak at Poole Harbour (Dorset) surpassed the national importance threshold for the fi rst time.
GR
AHAM
CAT
LEY
ROB
RO
BIN
SON
EDM
UN
D F
ELLO
WES
See all the numbers and trends at www.bto.org/webs-reporting
Continued westward expansion of Egyptian Geese
Waterbirds in the UK 2011/12 7
OYSTERCATCHERS continue to show regional variation in terms of non-breeding population trends, but overall the species continues to decline. Whereas a high peak of more than 82,000 was recorded at Morecambe Bay in 2010/11, the maximum in 2011/12 was only approximately half that. Peaks at the other important sites were close to or slightly below average, although more pronounced drops were also seen at Th ames Estuary and Solway Estuary. In 2011/12, the annual WeBS index dropped to its lowest value since the late 1970s. Th is decline could be due to a variety of factors, and research is required to pinpoint the precise reasons.
Th e RINGED PLOVER is one of the species for which the winter population trend now gives the greatest cause for concern. UK numbers have more than halved in less than 25 years, and the WeBS index has now reached its lowest ever level. Th is general pattern is considered to be due to a steady decline in the UK breeding population combined with reduced winter immigration into the UK by birds from continental Europe. Like several other waders, such as Dunlin and Bar-tailed Godwit, numbers of Ringed Plovers wintering in the Netherlands have increased in recent decades, lending support to the latter hypothesis.
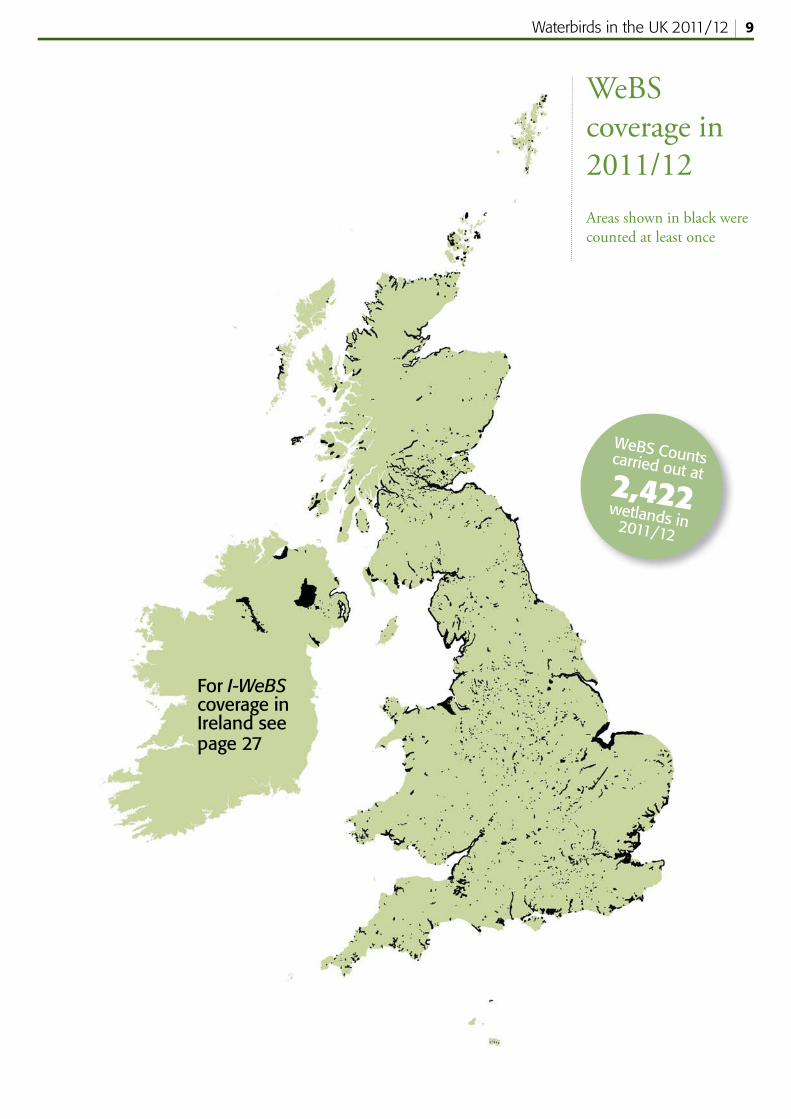
Numbers of seaducks such as LONG-TAILED DUCK and other off shore species such as RED-NECKED GREBE continue to fall. Although WeBS may not be optimal for monitoring off shore birds, the situation suggests potential shifts in distributions and/or population declines. Counts of SLAVONIAN GREBES continue to suggest the species is increasing in northern Scotland, but further declines were apparent on the English south coast. In contrast, most of the wintering population of about 130 BLACK-NECKED GREBES are in southern England, either close off shore or at favoured inland reservoirs - in 2011/12, 80+ birds were at Studland Bay (Dorset), a record count for the species.
Th e WeBS trend for PINTAIL in the UK shows that numbers have fallen by a staggering 50% since 2005/06. Th e species can be prone to population fl uctuations, but this decline has been consistent during that period. Virtually all the sites that host internationally important numbers of Pintails have seen declines, with the changes especially marked at the two key sites of the Dee Estuary and Burry Inlet. At fi rst sight, the losses from these and other western strongholds is suggestive of a potential eastward shift of core wintering range. However, with declines also apparent in other areas, the downward trend is probably attributable to a combination of factors.
EDM
UN
D F
ELLO
WES
JILL
PAKE
NH
AM
GLY
N S
ELLO
RSJO
HN
HAR
DIN
G
esanoteadepr
Steep decline in Pintail in the last six years
Waterbirds in the UK 2011/128
COVERAGE
Many populations of wintering geese were censused using other surveys. Counts of Taiga Bean Geese were provided by the Bean Goose Action Group (Slamannan Plateau) and RSPB (Middle Yare Marshes). Surveys of Pink-footed and Icelandic Greylag Geese were undertaken at, primarily, roost sites in October to December 2011 as part of the Icelandic-breeding Goose Census. Greylag Geese at key sites in northwest Scotland were censused by the Uist Greylag Goose Management Committee. Greenland White-fronted Geese were monitored by the Greenland
2011/12: a record year for UK waterbird monitoring
GOOSE CENSUSES IN 2011/12White-fronted Goose Study. Greenland Barnacle Geese were counted by SNH on Islay and some other key locations, while WWT counted Svalbard Barnacle Geese on the Solway. Data were provided by the International Canadian Light-bellied Brent Goose census.
For progress reports on goose censuses in the UK, see GooseNews, WWT’s annual newsletter of the Goose & Swan Monitoring Programme. Further goose & swan information is available via www.monitoring.wwt.org.uk.
Th e Pink-footed Goose population is monitored by the annual Icelandic-breeding Goose Census, carried out in autumn and early winter.
During the period July 2011 to June 2012, WeBS Core Counts were carried out at 2,422 sites. Th is is a record increase of 5% compared to the previous WeBS-year. Geographical coverage in 2011/12 is shown opposite.
Core Count dates in 2011/1217 July 201114 August 201118 September 201116 October 201120 November 201118 December 201115 January 201212 February 201211 March 2012 8 April 201220 May 201224 June 2012
WeBS CORE COUNTS
WeBS LOW TIDE COUNTS
WeBS Low Tide Counts were carried out at 18 estuaries in 2011/12. Th is included coverage of some large sites such as the Humber Estuary (Yorkshire/
Lincolnshire), Swale Estuary (Kent) and Blackwater Estuary (Essex).
A review of the WeBS Low Tide Counts scheme in 2011/12 can be found on pages 36-41.
2,900 registered WeBS volunteers
CH
AS H
OLT
TON
I CRO
SS
Waterbirds in the UK 2011/12 9
WeBS Counts carried out at 2,422 wetlands in 2011/12
For I-WeBS coverage in Ireland see page 27
WeBS coverage in 2011/12Areas shown in black were counted at least once
Waterbirds in the UK 2011/1210
WEATHER & BREEDING PRODUCTIVITY
2011/12: a mild winter after previous year’s big freeze
Winter 2011/12 proved to be relatively mild, in keeping with the general trend of climatic amelioration in recent decades. Th is was in marked contrast to winter 2010/11 which had been the coldest across northwest Europe for 35 years.
Th e following 2011/12 summary is collated from the Meteorological Offi ce website at www.metoffi ce.gov.uk.
July 2011 saw a mixture of cool, unsettled weather, with some heavy rain in places. Mean temperatures were lower than average, it being the coldest July since 1980.
August 2011 was predominantly unsettled. Mean temperatures were below average. Over twice the normal amount of rain fell across parts of England.
During September 2011 a changeable ‘westerly’ weather type prevailed for most of the month. Th e fi nal week saw a fi ne, very warm spell with some unusually high temperatures.
In October 2011, westerly or southerly airstreams brought rain to the north and west. Th e mean temperature was 2.2oC above the 1971-2000 average, making it the seventh warmest October in the last 100 years.
November 2011 saw airstreams from a southerly quarter bring mild, settled weather in the fi rst three weeks. Mean temperature was 2.8oC above the 30-year average, making it the second warmest November in last 100 years.
An Atlantic airstream in December 2011 brought mild, stormy weather to southern areas in the last ten days. Mean temperature was 0.9oC above the 30-year average, making it the mildest December since 2006 and 6oC warmer than December 2010.
In January 2012, a mild start was followed by a brief cold spell around mid-month. Th e mean temperature was 1.5oC above the 1971-2000 average, making it signifi cantly milder than Januaries 2009 to 2011. Rainfall was less than 75% of normal across eastern and southern regions.
In February 2012, high pressure across northern Europe resulted in cold conditions during the fi rst half of the month with sharp frosts and snow. Atlantic airstreams dominated during the last ten days.
Most of March 2012 was dominated by high pressure; it was consequently dry and sunny. UK mean temperature was 2.3oC above the 1981-2010 average, ranking it the warmest March since 1957. A maximum temperature of 24oC was recorded in Aberdeenshire.
April 2012 saw low pressure over UK for most of the month. Th ere was snow in northern areas early in the month and rain especially in the last week. It was the coldest April since 1989.
May 2012 was predominantly cool and unsettled, off set by a very warm spell at the end of the month.
June 2012 was dominated by low pressure, with associated high rainfall and cool conditions. Th ere was almost a complete absence of warm, settled spells.
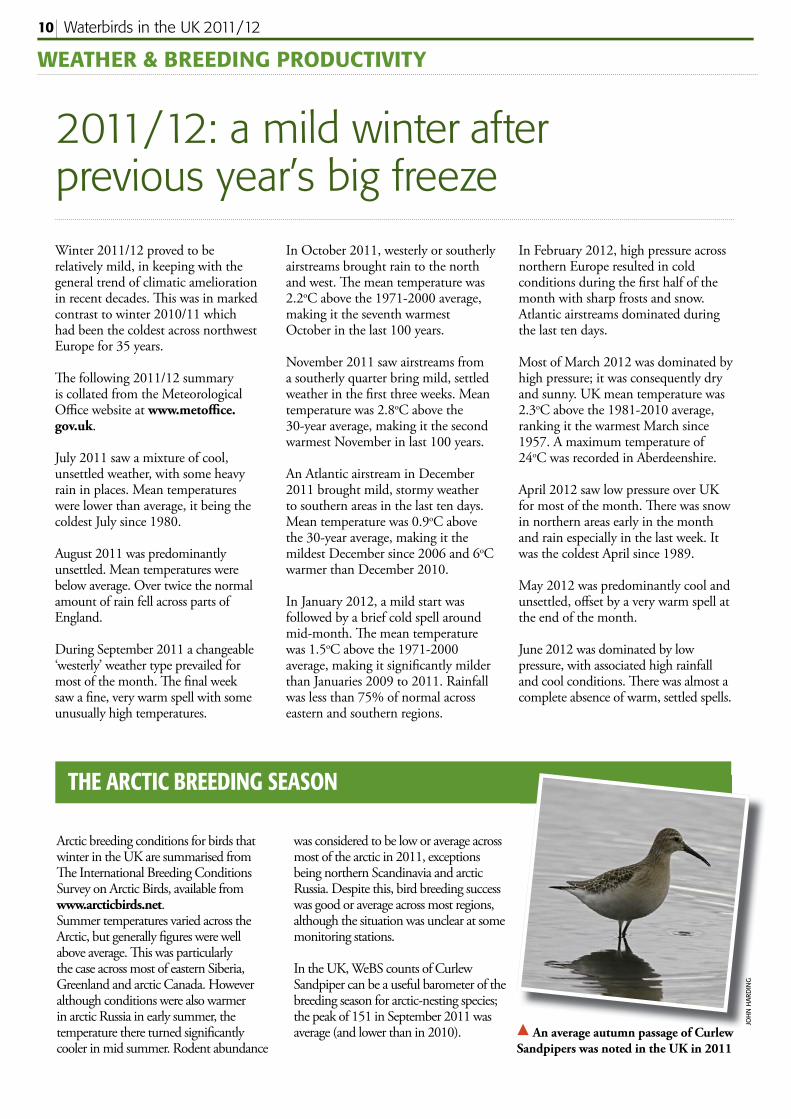
Arctic breeding conditions for birds that winter in the UK are summarised from Th e International Breeding Conditions Survey on Arctic Birds, available from www.arcticbirds.net.Summer temperatures varied across the Arctic, but generally fi gures were well above average. Th is was particularly the case across most of eastern Siberia, Greenland and arctic Canada. However although conditions were also warmer in arctic Russia in early summer, the temperature there turned signifi cantly cooler in mid summer. Rodent abundance
THE ARCTIC BREEDING SEASON
was considered to be low or average across most of the arctic in 2011, exceptions being northern Scandinavia and arctic Russia. Despite this, bird breeding success was good or average across most regions, although the situation was unclear at some monitoring stations.
In the UK, WeBS counts of Curlew Sandpiper can be a useful barometer of the breeding season for arctic-nesting species; the peak of 151 in September 2011 was average (and lower than in 2010). An average autumn passage of Curlew
Sandpipers was noted in the UK in 2011
JOH
N H
ARD
ING
Waterbirds in the UK 2011/12 11
The Wetland Bird Survey (WeBS) aims to monitor non-breeding waterbirds in the UK in order to provide the principal data on which the conservation of their populations is based. To this end, WeBS has three main objectives:
- to assess the size of non-breeding waterbird populations in the UK;- to assess trends in their numbers and distribution; and- to assess the importance of individual sites for waterbirds.
These results also form the basis for informed decision-making by conservation bodies, planners and developers, and contribute to the sustainable use and management of wetlands and their dependent waterbirds. The data and this annual WeBS report also fulfi l some of the objectives of the international wetland related Conventions and Directives to which the UK is a signatory. WeBS also provides data to Wetlands International to assist their function of coordinating and reporting upon waterbird status at an international fl yway scale.
WeBS continues the traditions of two, long-running count schemes which formed the mainstay of UK waterbird monitoring since 1947. WeBS Core Counts are carried out
at a wide variety of wetlands Coordinated, synchronous counts are advocated to prevent double-counting or birds being missed. Priority dates are recommended nationally, but due to differences in tidal regimes around the UK, counts at some estuaries on other dates in order to match the most suitable conditions. Weather and counter availability also sometimes result in count being undertaken on alternative dates.
In addition, WeBS Low Tide Counts are undertaken on selected estuaries with the aim of identifying key areas used during the low tide period, principally by feeding birds; areas not otherwise noted for their importance from data collected during Core Counts which are normally conducted at or close to high tide.
The success and growth of these count schemes refl ects the enthusiasm and dedication of the several thousands of participating volunteer ornithologists. It is largely due to their efforts that waterbird monitoring in the UK is held in such high regard internationally.
Full details of WeBS fi eld and analytical methodologies are available via the WeBS website: www.bto.org/webs
This annual WeBS report presents a synthesis of data collected between July 2011 and June 2012, thereby updating data presented in previous years, in line with the WeBS objectives. It forms a dual publication in conjunction with the online report available at www.bto.org/webs.
Within the dual publication, data from other national and local waterbird monitoring schemes, notably the WWT/JNCC/SNH Goose & Swan Monitoring Programme, are included where WeBS data alone are insuffi cient to fulfi l specifi ed aims. The annual WeBS report therefore provides a single, comprehensive source of information on waterbird status and distribution in the UK.
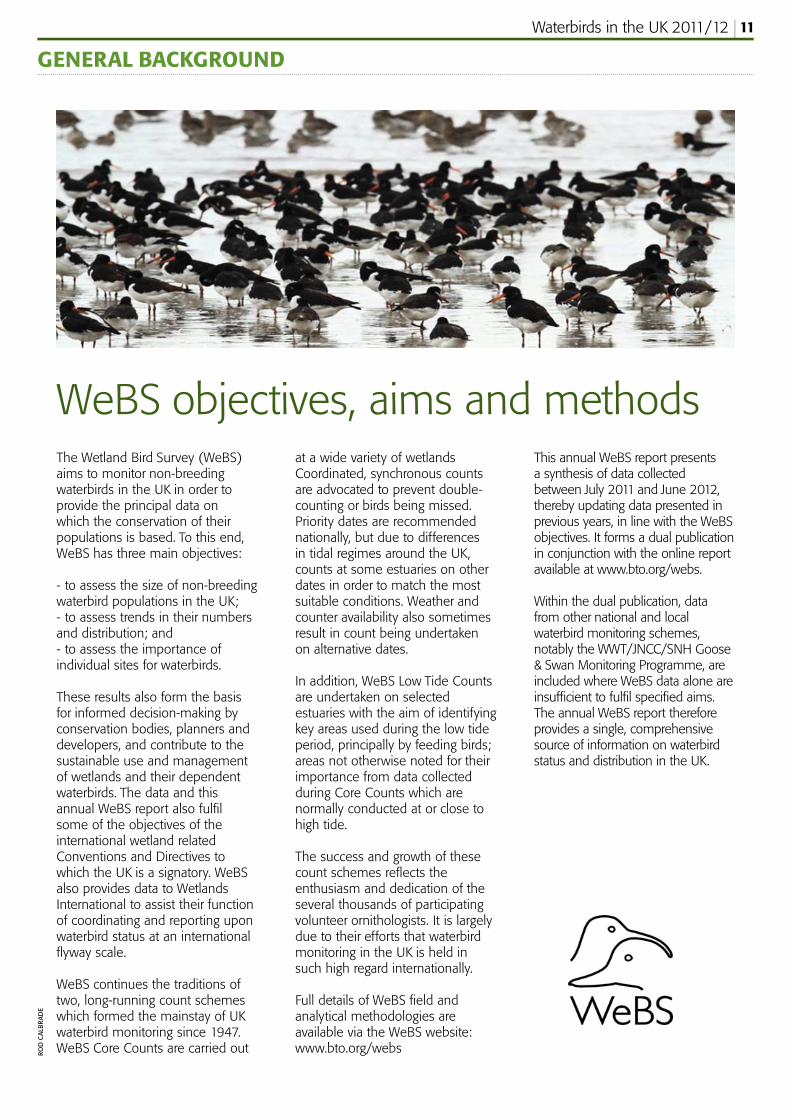
GENERAL BACKGROUNDRO
D C
ALB
RAD
E
WeBS objectives, aims and methods
Waterbirds in the UK 2011/1212
National trends
POPULATION TRENDS
JILL
PAKE
NH
AM
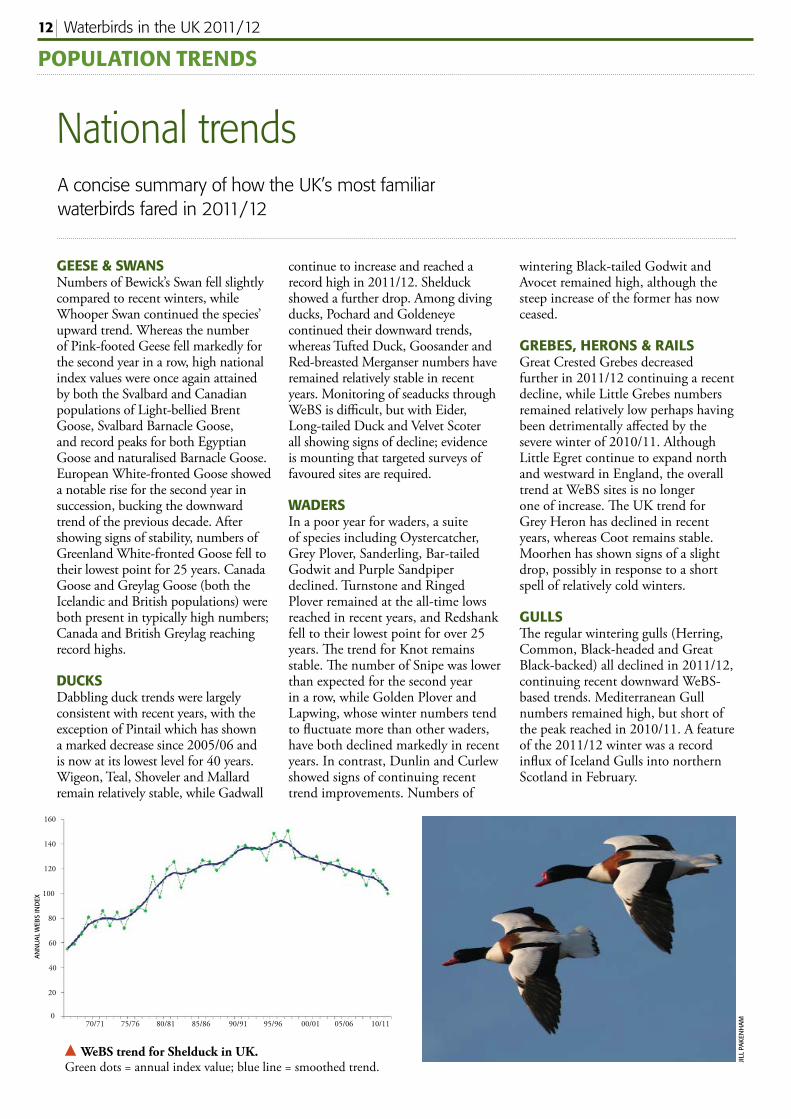
GEESE & SWANSNumbers of Bewick’s Swan fell slightly compared to recent winters, while Whooper Swan continued the species’ upward trend. Whereas the number of Pink-footed Geese fell markedly for the second year in a row, high national index values were once again attained by both the Svalbard and Canadian populations of Light-bellied Brent Goose, Svalbard Barnacle Goose, and record peaks for both Egyptian Goose and naturalised Barnacle Goose. European White-fronted Goose showed a notable rise for the second year in succession, bucking the downward trend of the previous decade. After showing signs of stability, numbers of Greenland White-fronted Goose fell to their lowest point for 25 years. Canada Goose and Greylag Goose (both the Icelandic and British populations) were both present in typically high numbers; Canada and British Greylag reaching record highs.
DUCKSDabbling duck trends were largely consistent with recent years, with the exception of Pintail which has shown a marked decrease since 2005/06 and is now at its lowest level for 40 years. Wigeon, Teal, Shoveler and Mallard remain relatively stable, while Gadwall
continue to increase and reached a record high in 2011/12. Shelduck showed a further drop. Among diving ducks, Pochard and Goldeneye continued their downward trends, whereas Tufted Duck, Goosander and Red-breasted Merganser numbers have remained relatively stable in recent years. Monitoring of seaducks through WeBS is diffi cult, but with Eider, Long-tailed Duck and Velvet Scoter all showing signs of decline; evidence is mounting that targeted surveys of favoured sites are required.
WADERSIn a poor year for waders, a suite of species including Oystercatcher, Grey Plover, Sanderling, Bar-tailed Godwit and Purple Sandpiper declined. Turnstone and Ringed Plover remained at the all-time lows reached in recent years, and Redshank fell to their lowest point for over 25 years. Th e trend for Knot remains stable. Th e number of Snipe was lower than expected for the second year in a row, while Golden Plover and Lapwing, whose winter numbers tend to fl uctuate more than other waders, have both declined markedly in recent years. In contrast, Dunlin and Curlew showed signs of continuing recent trend improvements. Numbers of
wintering Black-tailed Godwit and Avocet remained high, although the steep increase of the former has now ceased.
GREBES, HERONS & RAILSGreat Crested Grebes decreased further in 2011/12 continuing a recent decline, while Little Grebes numbers remained relatively low perhaps having been detrimentally aff ected by the severe winter of 2010/11. Although Little Egret continue to expand north and westward in England, the overall trend at WeBS sites is no longer one of increase. Th e UK trend for Grey Heron has declined in recent years, whereas Coot remains stable. Moorhen has shown signs of a slight drop, possibly in response to a short spell of relatively cold winters.
GULLSTh e regular wintering gulls (Herring, Common, Black-headed and Great Black-backed) all declined in 2011/12, continuing recent downward WeBS-based trends. Mediterranean Gull numbers remained high, but short of the peak reached in 2010/11. A feature of the 2011/12 winter was a record infl ux of Iceland Gulls into northern Scotland in February.
A concise summary of how the UK’s most familiar waterbirds fared in 2011/12
WeBS trend for Shelduck in UK. Green dots = annual index value; blue line = smoothed trend.
ANN
UAL
WEB
S IN
DEX
160
140
120
100
80
60
40
20
010/1105/0600/0195/9690/9185/8680/8175/7670/71
Waterbirds in the UK 2011/12 13
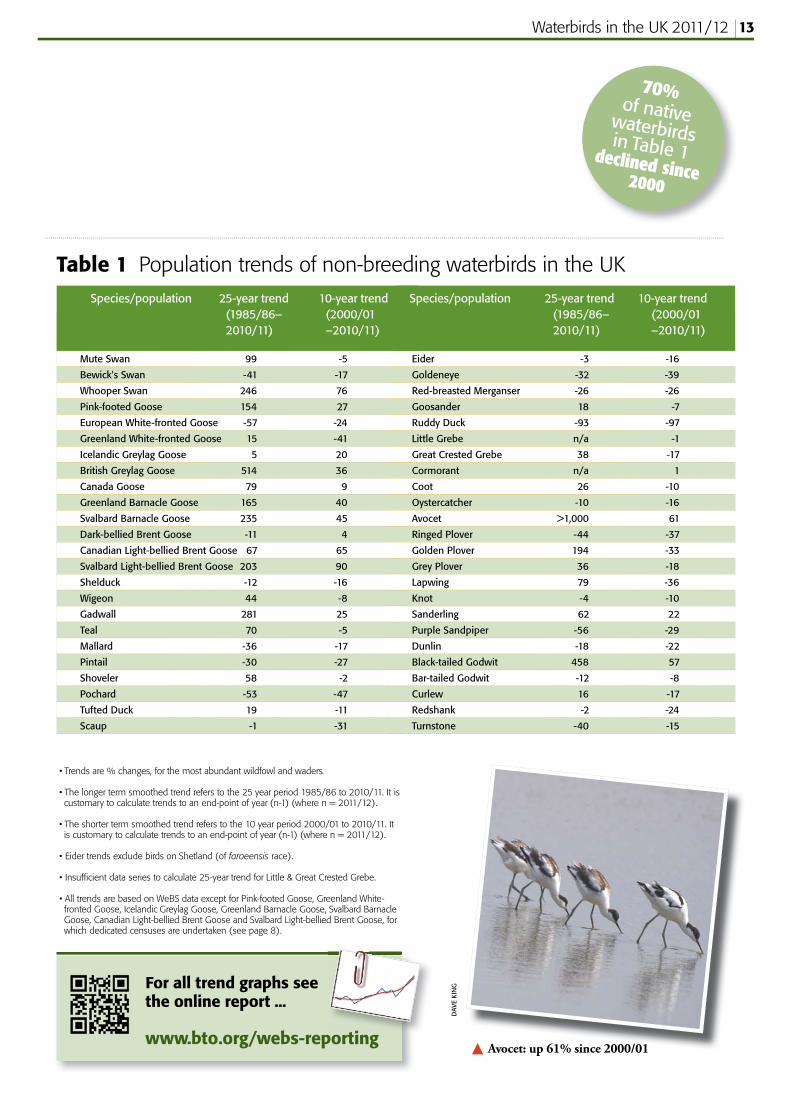
• Trends are % changes, for the most abundant wildfowl and waders.
• The longer term smoothed trend refers to the 25 year period 1985/86 to 2010/11. It is customary to calculate trends to an end-point of year (n-1) (where n = 2011/12).
• The shorter term smoothed trend refers to the 10 year period 2000/01 to 2010/11. It is customary to calculate trends to an end-point of year (n-1) (where n = 2011/12).
• Eider trends exclude birds on Shetland (of faroeensis race).
• Insuffi cient data series to calculate 25-year trend for Little & Great Crested Grebe.
• All trends are based on WeBS data except for Pink-footed Goose, Greenland White-fronted Goose, Icelandic Greylag Goose, Greenland Barnacle Goose, Svalbard Barnacle Goose, Canadian Light-bellied Brent Goose and Svalbard Light-bellied Brent Goose, for which dedicated censuses are undertaken (see page 8).
Avocet: up 61% since 2000/01
DAV
E KI
NG
Table 1 Population trends of non-breeding waterbirds in the UK
For all trend graphs see the online report ...
www.bto.org/webs-reportingti
70% of native waterbirds in Table 1 declined since 2000
Mute Swan 99 -5
Bewick's Swan -41 -17
Whooper Swan 246 76
Pink-footed Goose 154 27
European White-fronted Goose -57 -24
Greenland White-fronted Goose 15 -41
Icelandic Greylag Goose 5 20
British Greylag Goose 514 36
Canada Goose 79 9
Greenland Barnacle Goose 165 40
Svalbard Barnacle Goose 235 45
Dark-bellied Brent Goose -11 4
Canadian Light-bellied Brent Goose 67 65
Svalbard Light-bellied Brent Goose 203 90
Shelduck -12 -16
Wigeon 44 -8
Gadwall 281 25
Teal 70 -5
Mallard -36 -17
Pintail -30 -27
Shoveler 58 -2
Pochard -53 -47
Tufted Duck 19 -11
Scaup -1 -31
Species/population 25-year trend 10-year trend (1985/86– (2000/01 2010/11) –2010/11)
Species/population 25-year trend 10-year trend (1985/86– (2000/01 2010/11) –2010/11)
Eider -3 -16
Goldeneye -32 -39
Red-breasted Merganser -26 -26
Goosander 18 -7
Ruddy Duck -93 -97
Little Grebe n/a -1
Great Crested Grebe 38 -17
Cormorant n/a 1
Coot 26 -10
Oystercatcher -10 -16
Avocet >1,000 61
Ringed Plover -44 -37
Golden Plover 194 -33
Grey Plover 36 -18
Lapwing 79 -36
Knot -4 -10
Sanderling 62 22
Purple Sandpiper -56 -29
Dunlin -18 -22
Black-tailed Godwit 458 57
Bar-tailed Godwit -12 -8
Curlew 16 -17
Redshank -2 -24
Turnstone -40 -15
Waterbirds in the UK 2011/1214
Largest waterbird aggregations
PRINCIPAL SITES
Millions of waterbirds are dependent on the UK’s wetlands each winter.
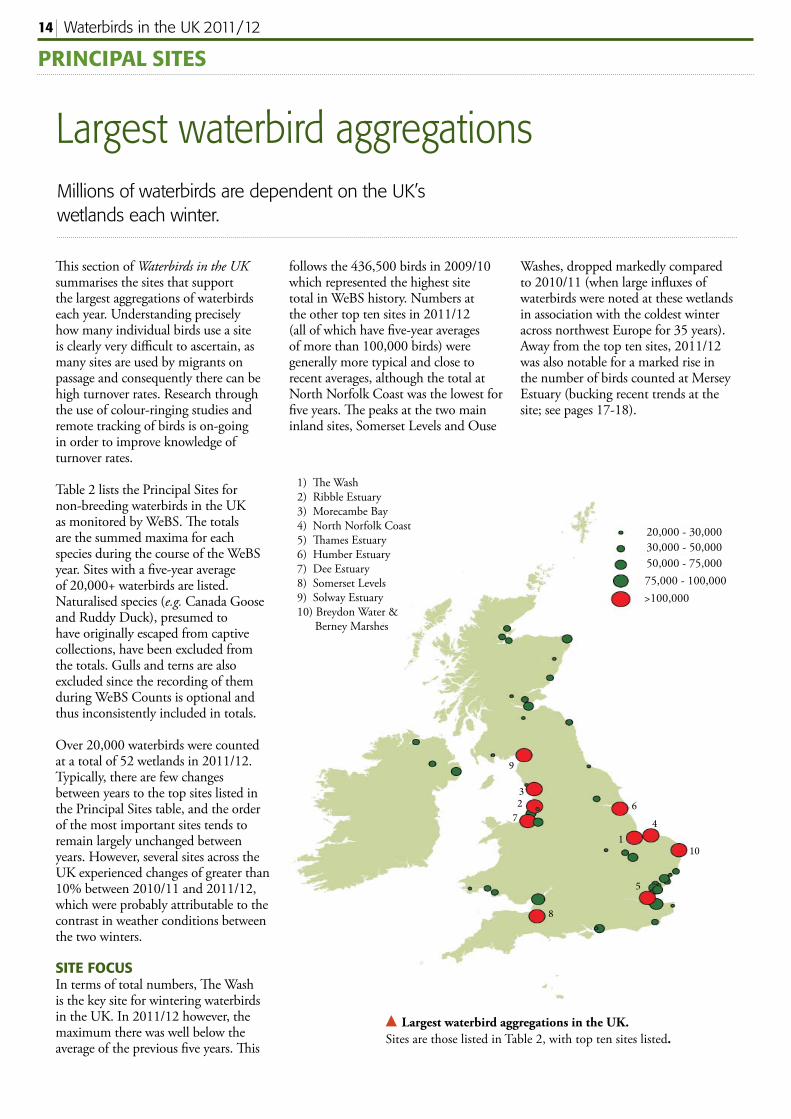
Th is section of Waterbirds in the UK summarises the sites that support the largest aggregations of waterbirds each year. Understanding precisely how many individual birds use a site is clearly very diffi cult to ascertain, as many sites are used by migrants on passage and consequently there can be high turnover rates. Research through the use of colour-ringing studies and remote tracking of birds is on-going in order to improve knowledge of turnover rates.
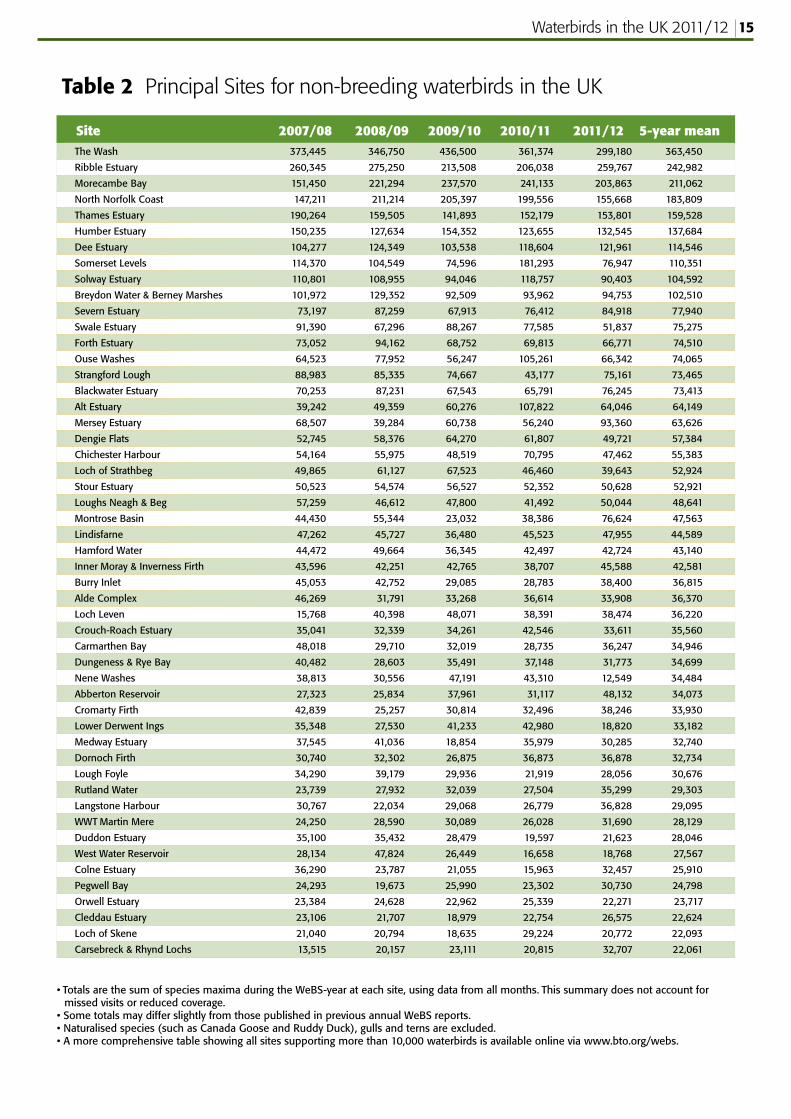
Table 2 lists the Principal Sites for non-breeding waterbirds in the UK as monitored by WeBS. Th e totals are the summed maxima for each species during the course of the WeBS year. Sites with a fi ve-year average of 20,000+ waterbirds are listed. Naturalised species (e.g. Canada Goose and Ruddy Duck), presumed to have originally escaped from captive collections, have been excluded from the totals. Gulls and terns are also excluded since the recording of them during WeBS Counts is optional and thus inconsistently included in totals.
Over 20,000 waterbirds were counted at a total of 52 wetlands in 2011/12. Typically, there are few changes between years to the top sites listed in the Principal Sites table, and the order of the most important sites tends to remain largely unchanged between years. However, several sites across the UK experienced changes of greater than 10% between 2010/11 and 2011/12, which were probably attributable to the contrast in weather conditions between the two winters.
SITE FOCUSIn terms of total numbers, Th e Wash is the key site for wintering waterbirds in the UK. In 2011/12 however, the maximum there was well below the average of the previous fi ve years. Th is
follows the 436,500 birds in 2009/10 which represented the highest site total in WeBS history. Numbers at the other top ten sites in 2011/12 (all of which have fi ve-year averages of more than 100,000 birds) were generally more typical and close to recent averages, although the total at North Norfolk Coast was the lowest for fi ve years. Th e peaks at the two main inland sites, Somerset Levels and Ouse
Washes, dropped markedly compared to 2010/11 (when large infl uxes of waterbirds were noted at these wetlands in association with the coldest winter across northwest Europe for 35 years). Away from the top ten sites, 2011/12 was also notable for a marked rise in the number of birds counted at Mersey Estuary (bucking recent trends at the site; see pages 17-18).
Largest waterbird aggregations in the UK. Sites are those listed in Table 2, with top ten sites listed.
20,000 - 30,00030,000 - 50,00050,000 - 75,00075,000 - 100,000>100,000
1
23
4
5
67
8
9
10
1) Th e Wash2) Ribble Estuary3) Morecambe Bay4) North Norfolk Coast5) Th ames Estuary6) Humber Estuary7) Dee Estuary8) Somerset Levels9) Solway Estuary10) Breydon Water & Berney Marshes
Waterbirds in the UK 2011/12 15
The Wash 373,445 346,750 436,500 361,374 299,180 363,450
Ribble Estuary 260,345 275,250 213,508 206,038 259,767 242,982
Morecambe Bay 151,450 221,294 237,570 241,133 203,863 211,062
North Norfolk Coast 147,211 211,214 205,397 199,556 155,668 183,809
Thames Estuary 190,264 159,505 141,893 152,179 153,801 159,528
Humber Estuary 150,235 127,634 154,352 123,655 132,545 137,684
Dee Estuary 104,277 124,349 103,538 118,604 121,961 114,546
Somerset Levels 114,370 104,549 74,596 181,293 76,947 110,351
Solway Estuary 110,801 108,955 94,046 118,757 90,403 104,592
Breydon Water & Berney Marshes 101,972 129,352 92,509 93,962 94,753 102,510
Severn Estuary 73,197 87,259 67,913 76,412 84,918 77,940
Swale Estuary 91,390 67,296 88,267 77,585 51,837 75,275
Forth Estuary 73,052 94,162 68,752 69,813 66,771 74,510
Ouse Washes 64,523 77,952 56,247 105,261 66,342 74,065
Strangford Lough 88,983 85,335 74,667 43,177 75,161 73,465
Blackwater Estuary 70,253 87,231 67,543 65,791 76,245 73,413
Alt Estuary 39,242 49,359 60,276 107,822 64,046 64,149
Mersey Estuary 68,507 39,284 60,738 56,240 93,360 63,626
Dengie Flats 52,745 58,376 64,270 61,807 49,721 57,384
Chichester Harbour 54,164 55,975 48,519 70,795 47,462 55,383
Loch of Strathbeg 49,865 61,127 67,523 46,460 39,643 52,924
Stour Estuary 50,523 54,574 56,527 52,352 50,628 52,921
Loughs Neagh & Beg 57,259 46,612 47,800 41,492 50,044 48,641
Montrose Basin 44,430 55,344 23,032 38,386 76,624 47,563
Lindisfarne 47,262 45,727 36,480 45,523 47,955 44,589
Hamford Water 44,472 49,664 36,345 42,497 42,724 43,140
Inner Moray & Inverness Firth 43,596 42,251 42,765 38,707 45,588 42,581
Burry Inlet 45,053 42,752 29,085 28,783 38,400 36,815
Alde Complex 46,269 31,791 33,268 36,614 33,908 36,370
Loch Leven 15,768 40,398 48,071 38,391 38,474 36,220
Crouch-Roach Estuary 35,041 32,339 34,261 42,546 33,611 35,560
Carmarthen Bay 48,018 29,710 32,019 28,735 36,247 34,946
Dungeness & Rye Bay 40,482 28,603 35,491 37,148 31,773 34,699
Nene Washes 38,813 30,556 47,191 43,310 12,549 34,484
Abberton Reservoir 27,323 25,834 37,961 31,117 48,132 34,073
Cromarty Firth 42,839 25,257 30,814 32,496 38,246 33,930
Lower Derwent Ings 35,348 27,530 41,233 42,980 18,820 33,182
Medway Estuary 37,545 41,036 18,854 35,979 30,285 32,740
Dornoch Firth 30,740 32,302 26,875 36,873 36,878 32,734
Lough Foyle 34,290 39,179 29,936 21,919 28,056 30,676
Rutland Water 23,739 27,932 32,039 27,504 35,299 29,303
Langstone Harbour 30,767 22,034 29,068 26,779 36,828 29,095
WWT Martin Mere 24,250 28,590 30,089 26,028 31,690 28,129
Duddon Estuary 35,100 35,432 28,479 19,597 21,623 28,046
West Water Reservoir 28,134 47,824 26,449 16,658 18,768 27,567
Colne Estuary 36,290 23,787 21,055 15,963 32,457 25,910
Pegwell Bay 24,293 19,673 25,990 23,302 30,730 24,798
Orwell Estuary 23,384 24,628 22,962 25,339 22,271 23,717
Cleddau Estuary 23,106 21,707 18,979 22,754 26,575 22,624
Loch of Skene 21,040 20,794 18,635 29,224 20,772 22,093
Carsebreck & Rhynd Lochs 13,515 20,157 23,111 20,815 32,707 22,061
Table 2 Principal Sites for non-breeding waterbirds in the UK
• Totals are the sum of species maxima during the WeBS-year at each site, using data from all months. This summary does not account for missed visits or reduced coverage.
• Some totals may differ slightly from those published in previous annual WeBS reports. • Naturalised species (such as Canada Goose and Ruddy Duck), gulls and terns are excluded. • A more comprehensive table showing all sites supporting more than 10,000 waterbirds is available online via www.bto.org/webs.
Site 2007/08 2008/09 2009/10 2010/11 2011/12 5-year mean
Waterbirds in the UK 2011/1216
ALERTS - UK OVERVIEW
WeBS Alerts: all changeRegional differences in waterbird trends on the UK’s network of Special Protection Areas
Th e monitoring of wildlife populations and the sites on which they depend is an essential component of eff ective conservation management. Th e WeBS Alerts system provides one means of monitoring waterbird populations, and has already been instrumental in highlighting a range of conservation priorities. A new WeBS Alerts report was published in 2013.
Th e Alerts system adopts a standardized method for identifying the direction and magnitude of changes in bird numbers at a range of spatial and temporal scales. A range of waterbird species are assessed; those for which suffi cient WeBS data are available. Th is represents an eff ective monitoring protocol, by which the UK can look to conserve and manage the internationally important numbers of waterbirds to which it plays host. To fl ag population changes, High- and Medium- Alerts are issued if population declines exceed 50% and 25%, respectively. Alerts are intended to be advisory and, subject to interpretation, should therefore be used as a basis on which to direct research and subsequent conservation eff orts if required. Some of the key fi ndings from the recent Alerts analysis within the UK are presented, country by country, on pages 18-19.
FOCUSING RESEARCHTh e WeBS Alerts system has been instrumental in highlighting several species which have undergone marked re-distributions in their populations. For example, several wader species have declined in the west of the UK but have tended to increase in the east. Such patterns, revealed through Alerts analyses at the site level but examined at larger
spatial scales, have sometimes been a catalyst for further research. For example, it is now well established that population shifts fi rst revealed through the WeBS Alerts process have been in response to climate change. On average, estuaries on the south and east coasts of Britain have muddier sediments than those on the west coast, and thus support a higher biomass of invertebrate prey for waders. With winter temperatures having warmed by approximately 1.5 oC since the mid 1980s, the risk of weather-induced mortality on the colder east coasts
has diminished. Consequently many wader populations have shifted in an easterly direction.
ALERTS ARE ONLINETh e full WeBS Alerts report is available in the same way as the standard annual report via the new online interface at www.bto.org/webs-reporting-alerts.
In conjunction with a planned interactive Low Tide Counts facility, the online report is a fundamental resource for WeBS counters, researchers and conservationists.
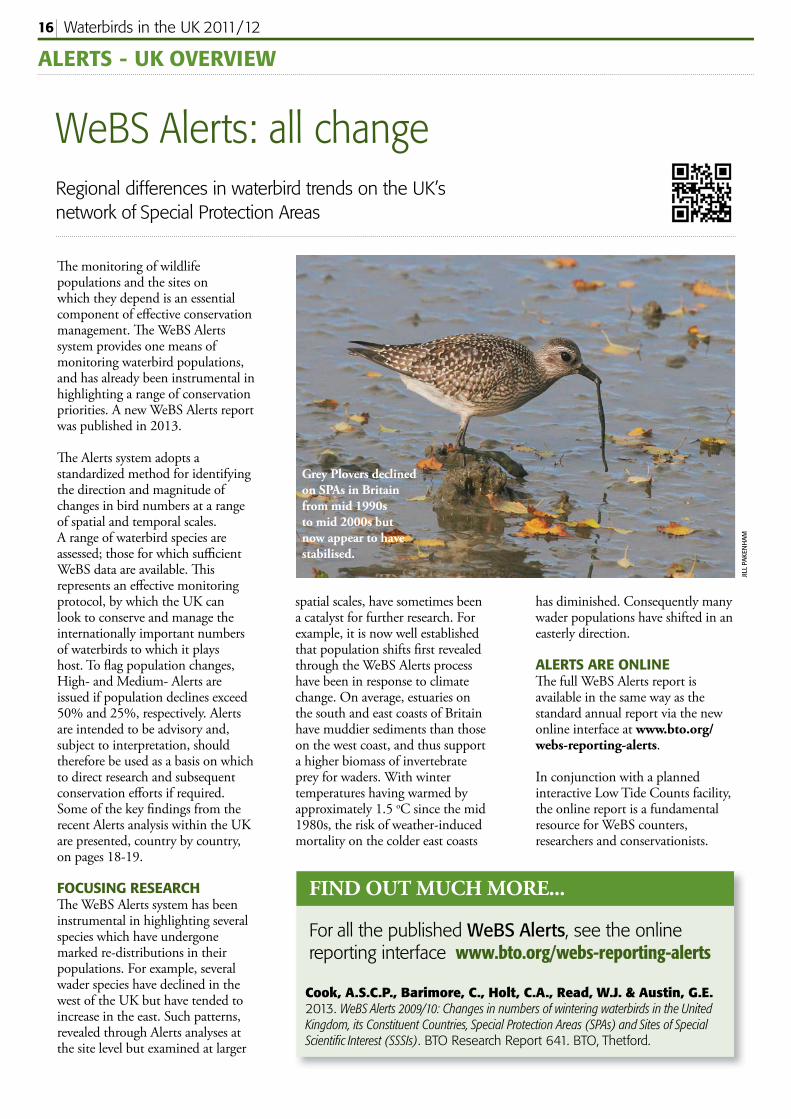
Grey Plovers declined on SPAs in Britain from mid 1990s to mid 2000s but now appear to have stabilised.
FIND OUT MUCH MORE...
For all the published WeBS Alerts, see the online reporting interface www.bto.org/webs-reporting-alerts
Cook, A.S.C.P., Barimore, C., Holt, C.A., Read, W.J. & Austin, G.E. 2013. WeBS Alerts 2009/10: Changes in numbers of wintering waterbirds in the United Kingdom, its Constituent Countries, Special Protection Areas (SPAs) and Sites of Special Scientifi c Interest (SSSIs). BTO Research Report 641. BTO, Thetford.
JILL
PAKE
NH
AM

Waterbirds in the UK 2011/12 17
Long-term Alerts status at UK wetlands in SPA network. Sites are listed ascendingly by proportion of species for which negative Alerts were reported by Cook et al. (2013). Red = High Alert (large decrease), orange = Medium Alert (moderate decrease), grey = stable, pale green = moderate increase, dark green = large increase. Sites marked with asterisk are part of Mid-Essex Phase 2 SPA.
WeBS Alerts www.bto.org/
webs-reporting-alerts
Carlingford LoughUpper Lough Erne
Larne LoughLavan Sands, Conwy Bay
Lee ValleyDungeness to Pett Level
Portsmouth HarbourTamar Estuaries Complex
Chesil Beach and The FleetChew Valley Lake
Deben EstuaryMinsmere and Walberswick
Hornsea MereRiver Spey - Insh Marshes
Loch of StrathbegDornoch Firth and Loch Fleet
Loch EyeThanet Coast and Sandwich Bay
Crouch and Roach Estuaries*Benfl eet and Southend Marshes
Hamford WaterInner Clyde Estuary
Ythan Estuary, Forvie & MeikleArun Valley
Southwest London WaterbodiesPagham Harbour
Avon ValleySomerset Levels and Moors
Blackwater Estuary*North Norfolk Coast
Rutland WaterWalmore Common
Cromarty FirthExe Estuary
Foulness*Colne Estuary*Nene Washes
Northumbria CoastRibble and Alt Estuaries
Duddon EstuaryThams Estuary and Marshes
Dengie*Teesmouth and Cleveland Coast
Loch LevenOuse Washes
Montrose BasinBreydon Water
Solent and Southampton WaterLower Derwent Valley
Poole HarbourHumber Estuary
Martin MereBelfast Lough
Burry InletStour and Orwell Estuaries
Abberton ReservoirInner Moray Firth
The WashFirth of Tay and Eden Estuary
BroadlandMersey Estuary
Morecambe BayMedway Estuary and Marshes
Severn EstuaryLindisfarne
Chichester and Langstone HarboursStrangford LoughThe Dee Estuary
Lough Neagh and Lough BegUpper Solway Flats and Marshes
Waterbirds in the UK 2011/1218
WEBS ALERTS - COUNTRY SNAPSHOTS
WeBS Alerts triggered for a high proportion of species on protected sites in northwest England
FIND OUT MORE...
Ross-Smith, V.H., Calbrade, N.A., Wright, L.J. & Austin, G.E. 2013. Analysis of waterbird population trends in the Mersey Estuary SPA, Mersey Narrows & North Wirral Foreshore pSPA and Ribble & Alt Estuaries SPA. BTO Research Report No. 640. BTO, Thetford.
England
Th ere are over 80 SPAs in England that are designated at least in part due to their wintering waterbird populations. Some of the most important of these areas in terms of overall numbers of birds are listed in the Principal Sites section (page 15), although the precise boundaries of the areas reported by WeBS may diff er to those statutorily recognised as SPAs.
Th e WeBS Alerts system has illustrated distributional movements at the national scale (see page 17). Many of these shifts in species’ distributions, generally in an easterly direction, are thought to be a response to climate change. However, it is important not to merely assume this
is the cause. Site-specifi c studies are important to ensure more local issues are not overlooked.
Recent years have seen marked declines in numbers of waterbirds using SPAs in northwest England, with disproportionately high numbers of Alerts triggered for species on Mersey Estuary SPA, Ribble & Alt SPA, Dee Estuary SPA and Morecambe Bay SPA. Th is has led to a number of assessments of potential reasons for these changes. On the Mersey Estuary and adjacent areas, Natural England commissioned a detailed analysis of local waterbird trends (Ross-Smith et al. 2013) and an investigation into relevant local issues and pressures
WalesMixed waterbird trends evident for the major estuarine SPAs in Wales
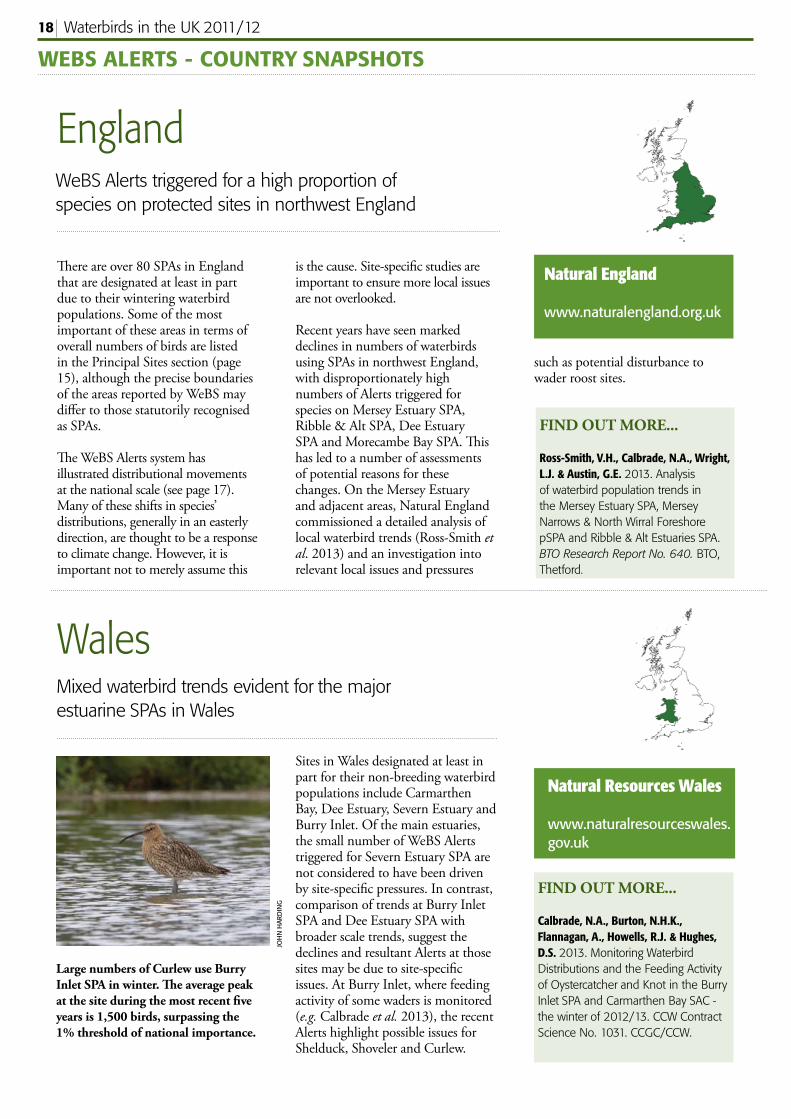
Sites in Wales designated at least in part for their non-breeding waterbird populations include Carmarthen Bay, Dee Estuary, Severn Estuary and Burry Inlet. Of the main estuaries, the small number of WeBS Alerts triggered for Severn Estuary SPA are not considered to have been driven by site-specifi c pressures. In contrast, comparison of trends at Burry Inlet SPA and Dee Estuary SPA with broader scale trends, suggest the declines and resultant Alerts at those sites may be due to site-specifi c issues. At Burry Inlet, where feeding activity of some waders is monitored (e.g. Calbrade et al. 2013), the recent Alerts highlight possible issues for Shelduck, Shoveler and Curlew.
FIND OUT MORE...
Calbrade, N.A., Burton, N.H.K., Flannagan, A., Howells, R.J. & Hughes, D.S. 2013. Monitoring Waterbird Distributions and the Feeding Activity of Oystercatcher and Knot in the Burry Inlet SPA and Carmarthen Bay SAC - the winter of 2012/13. CCW Contract Science No. 1031. CCGC/CCW.
Large numbers of Curlew use Burry Inlet SPA in winter. Th e average peak at the site during the most recent fi ve years is 1,500 birds, surpassing the 1% threshold of national importance.
Natural England
www.naturalengland.org.uk
Natural Resources Wales
www.naturalresourceswales.gov.uk
JOH
N H
ARD
ING
such as potential disturbance to wader roost sites.
Waterbirds in the UK 2011/12 19
WEBS ALERTS - COUNTRY SNAPSHOTS
ScotlandWeBS Alerts for 22 out of 36 species on the cross-border Upper Solway Flats & Marshes SPA
SPAs in Scotland that are designated at least in part for their wintering waterbird populations include several comprising estuarine habitat, such as Upper Solway Flats & Marshes SPA and Firth of Forth SPA. A feature of the latest WeBS Alerts is the decline of Oystercatchers at several sites, contributing to an overall drop in the WeBS index for the species in Scotland. Th e rate of decline is notably steeper than in other parts of the UK.
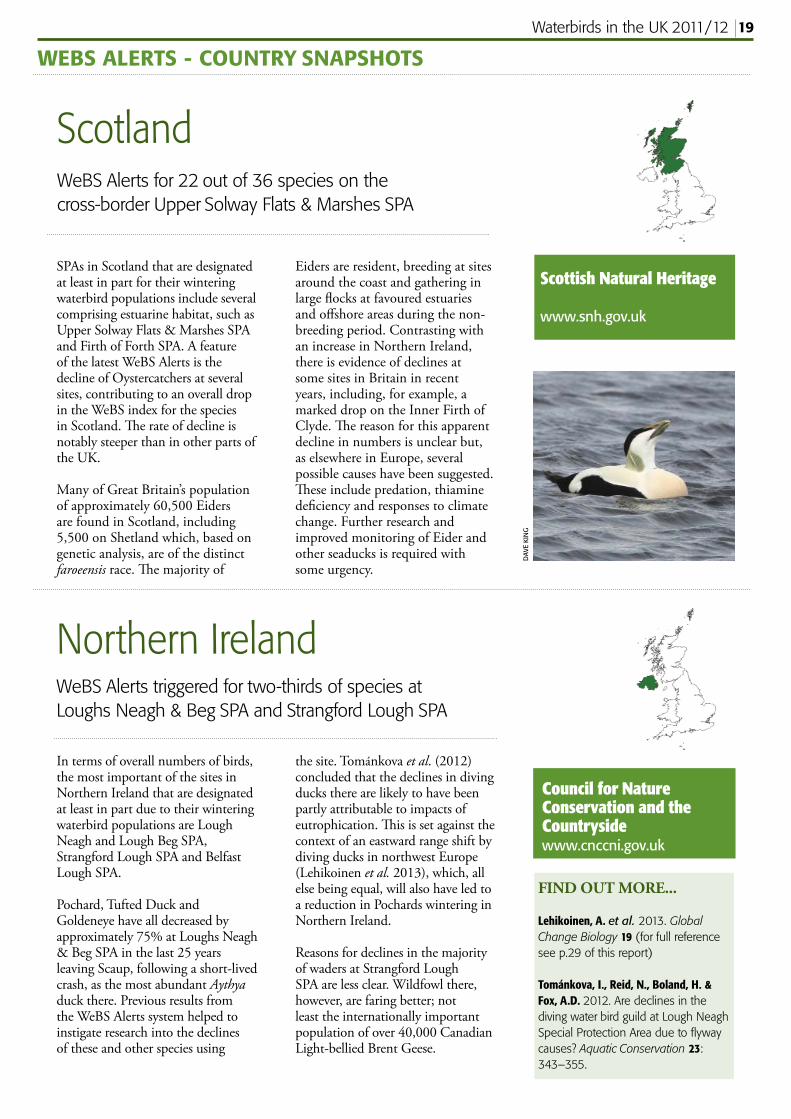
Many of Great Britain’s population of approximately 60,500 Eiders are found in Scotland, including 5,500 on Shetland which, based on genetic analysis, are of the distinct faroeensis race. Th e majority of
Eiders are resident, breeding at sites around the coast and gathering in large fl ocks at favoured estuaries and off shore areas during the non-breeding period. Contrasting with an increase in Northern Ireland, there is evidence of declines at some sites in Britain in recent years, including, for example, a marked drop on the Inner Firth of Clyde. Th e reason for this apparent decline in numbers is unclear but, as elsewhere in Europe, several possible causes have been suggested. Th ese include predation, thiamine defi ciency and responses to climate change. Further research and improved monitoring of Eider and other seaducks is required with some urgency.
Northern IrelandWeBS Alerts triggered for two-thirds of species at Loughs Neagh & Beg SPA and Strangford Lough SPA
In terms of overall numbers of birds, the most important of the sites in Northern Ireland that are designated at least in part due to their wintering waterbird populations are Lough Neagh and Lough Beg SPA, Strangford Lough SPA and Belfast Lough SPA.
Pochard, Tufted Duck and Goldeneye have all decreased by approximately 75% at Loughs Neagh & Beg SPA in the last 25 years leaving Scaup, following a short-lived crash, as the most abundant Aythya duck there. Previous results from the WeBS Alerts system helped to instigate research into the declines of these and other species using
the site. Tománkova et al. (2012) concluded that the declines in diving ducks there are likely to have been partly attributable to impacts of eutrophication. Th is is set against the context of an eastward range shift by diving ducks in northwest Europe (Lehikoinen et al. 2013), which, all else being equal, will also have led to a reduction in Pochards wintering in Northern Ireland.
Reasons for declines in the majority of waders at Strangford Lough SPA are less clear. Wildfowl there, however, are faring better; not least the internationally important population of over 40,000 Canadian Light-bellied Brent Geese.
Scottish Natural Heritage
www.snh.gov.uk
Council for Nature Conservation and the Countryside www.cnccni.gov.uk
DAV
E KI
NG
FIND OUT MORE...
Lehikoinen, A. et al. 2013. Global Change Biology 19 (for full reference see p.29 of this report)
Tománkova, I., Reid, N., Boland, H. & Fox, A.D. 2012. Are declines in the diving water bird guild at Lough Neagh Special Protection Area due to fl yway causes? Aquatic Conservation 23: 343–355.
Waterbirds in the UK 2011/1220
HABITAT FOCUS... ESTUARIES
Internationally important estuariesA look at the latest status and trends of three species strongly associated with UK estuaries
Estuaries are one of the UK’s most internationally important bird habitats. However, even though the UK is well endowed with estuaries, estuarine habitat is still scarce in its total context if compared to the presence of other wildlife habitats.
Western European estuaries are of major international importance for the wintering and migrant waders and wildfowl that they support. Th ese birds breed over a very wide area of the arctic, sub-arctic and temperate breeding regions, from as far west as northern Canada and Greenland to as far east as northern Scandinavia and western and mid Siberia. Many species are dependent on European estuaries for winter resources, and several wader populations use sites, particularly those in western Britain and around the southern North Sea, as staging areas at which to moult their body and fl ight feathers and to accumulate large reserves of fat and muscle protein that are needed for long-distance migrations. Some of these populations migrate further south to overwinter in western Africa, while many others remain to overwinter at UK latitude.
Th e Principal Sites table (page 15), listing the top sites in the UK in terms of total numbers of non-breeding waterbirds, is largely comprised of estuaries. Th ese estuaries support several million waterbirds during the course of a year, including the bulk of the estimated total wintering populations of several species nationwide. Many estuaries support internationally important numbers of birds, and several others are used by at least one species in nationally important numbers. Th ese wetlands therefore represent priorities for
conservation, being designated under the Ramsar Convention and as Special Protection Areas (SPAs) (see WeBS Alerts, page 16-17).Th e UK has estuaries on all its coastlines. Many estuaries are on the long indented coastline of southern and western Britain, but the shallow shores and fl at coastal plains of eastern Britain have resulted in the formation of many important estuaries along a much shorter coastline adjacent to the North Sea. In combination with the Wadden Sea in the Netherlands/Germany/Denmark, the estuaries of the North Sea are particularly important to wintering waders in Europe. Approximately one-third of the estimated total west European fl yway population of 3.5 million waders wintering on the coasts of western Europe occur on North Sea estuaries. Moreover, some individual species are especially reliant on UK estuaries.
KNOTSAll Knots of the sub-species islandica (that breeds in high arctic Canada and Greenland) overwinter on the coasts and estuaries of northwest
Europe. In midwinter over 80% are on just 15 British estuaries. Elsewhere, the Delta and Wadden Sea areas on the Dutch side of the North Sea also support major wintering numbers of Knots. Th e Wadden Sea is also of particular importance to the species during other seasons, particularly as a moulting and staging area in autumn and spring (Hornman et al. 2012), while numbers of Knot in the UK peak between September and December, following a general westerly movement of birds that have moulted on the Wadden Sea.
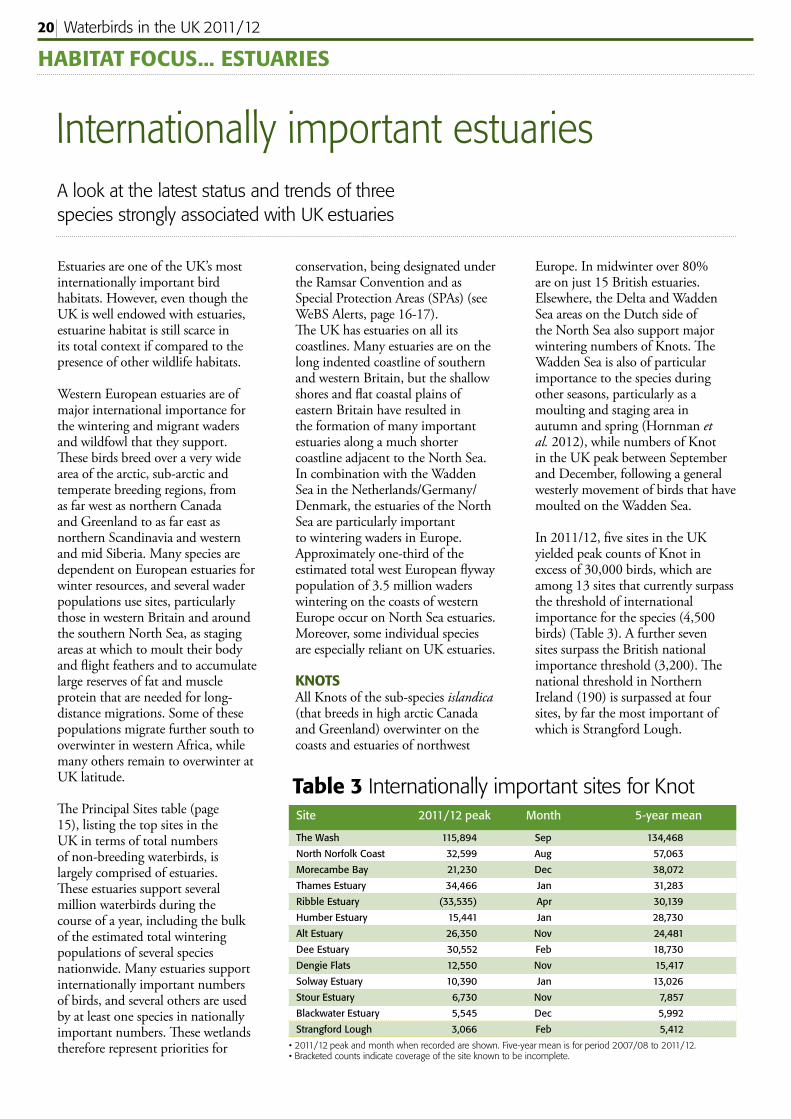
In 2011/12, fi ve sites in the UK yielded peak counts of Knot in excess of 30,000 birds, which are among 13 sites that currently surpass the threshold of international importance for the species (4,500 birds) (Table 3). A further seven sites surpass the British national importance threshold (3,200). Th e national threshold in Northern Ireland (190) is surpassed at four sites, by far the most important of which is Strangford Lough.
Table 3 Internationally important sites for Knot
The Wash 115,894 Sep 134,468
North Norfolk Coast 32,599 Aug 57,063
Morecambe Bay 21,230 Dec 38,072
Thames Estuary 34,466 Jan 31,283
Ribble Estuary (33,535) Apr 30,139
Humber Estuary 15,441 Jan 28,730
Alt Estuary 26,350 Nov 24,481
Dee Estuary 30,552 Feb 18,730
Dengie Flats 12,550 Nov 15,417
Solway Estuary 10,390 Jan 13,026
Stour Estuary 6,730 Nov 7,857
Blackwater Estuary 5,545 Dec 5,992
Strangford Lough 3,066 Feb 5,412
Site 2011/12 peak Month 5-year mean
• 2011/12 peak and month when recorded are shown. Five-year mean is for period 2007/08 to 2011/12.• Bracketed counts indicate coverage of the site known to be incomplete.
Waterbirds in the UK 2011/12 21D
AWN
BAL
MER
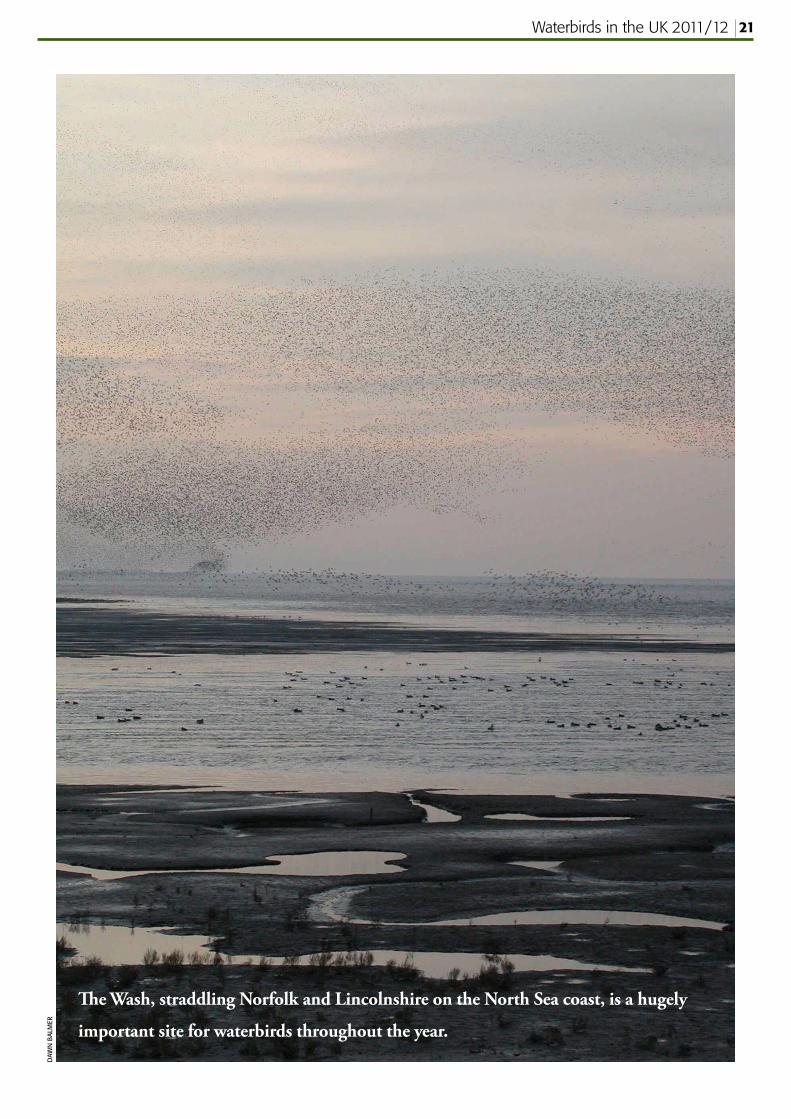
Th e Wash, straddling Norfolk and Lincolnshire on the North Sea coast, is a hugely
important site for waterbirds throughout the year.
Waterbirds in the UK 2011/1222
DARK-BELLIED BRENT GOOSEAlmost all of the world’s population of Dark-bellied Brent Geese, which breeds in northern Siberia, occurs in spring on the Wadden Sea in Th e Netherlands. However, most of these birds will have overwintered further west on the milder estuaries of Britain and western France. An on-going collaboration between European monitoring schemes is in the process of updating the status of this population and providing a detailed review of its distribution and numbers along the fl yway.
Th e British population is estimated to be 91,000 birds representing approximately half the world population, the size of which in winter varies between years, largely dependent on breeding success during the previous summer. For example, the principal reason for a decline in the WeBS trend during the mid-1990s to mid-2000s was considered to be a sustained period of poor breeding success possibly combined with the eff ects of milder winter conditions and improved foraging conditions further east. Th e latter caused birds to ‘short stop’ and so remain further east, principally in the Netherlands, during the winter.
In the last few years however, the WeBS trend has indicated stability in the UK’s wintering population, and 2011/12 saw a marked rise with the index reaching its highest value for over 15 years. Reports from the breeding grounds, including the majority of monitoring stations in the Russian tundra, indicate that rodent abundance was relatively high in 2011, with large numbers of young Dark-bellied Brent Geese fl edging as a consequence. Results from age assessments at wintering sites in the UK (co-ordinated by WWT) confi rm this pattern. Th e overall proportion of young birds (16.2%) was the highest recorded for six years, and the mean brood size of 2.26 goslings was also noteworthy.
Although estuaries provide a vital resource for Dark-bellied Brent Geese in the UK, there has been a slight shift in preferred feeding
habitats during the last two decades. Grassland and arable land has been increasingly used, possibly due to reduced availability of traditional intertidal feeding areas. Winter cereals tend to be the most frequently used non-estuarine habitat, followed by permanent and intensively managed grassland, with amenity and recreational land also sometimes used. Continued assessment of winter feeding distribution and site use is therefore necessary to inform future management and protection of Dark-bellied Brent Goose habitat.
Previous research has shown that the trends at most of the sites in Britain that are of international or national importance for Dark-bellied Brent Goose tend to be strongly correlated with the trend of the population as a whole. Th is suggests that there are probably not sub-populations existing within the fl yway with associated variation in population parameters and fi delity to certain parts of the range, as is the case in Greenland White-fronted Geese, for example.
HABITAT FOCUS... ESTUARIES
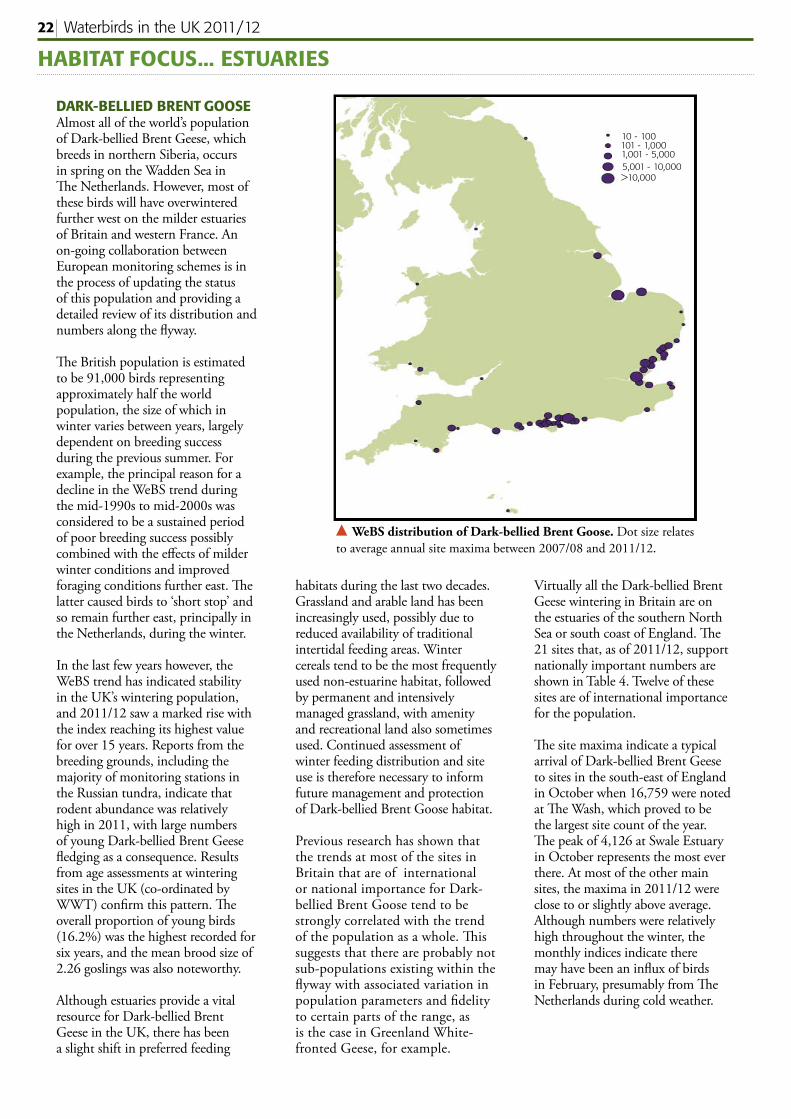
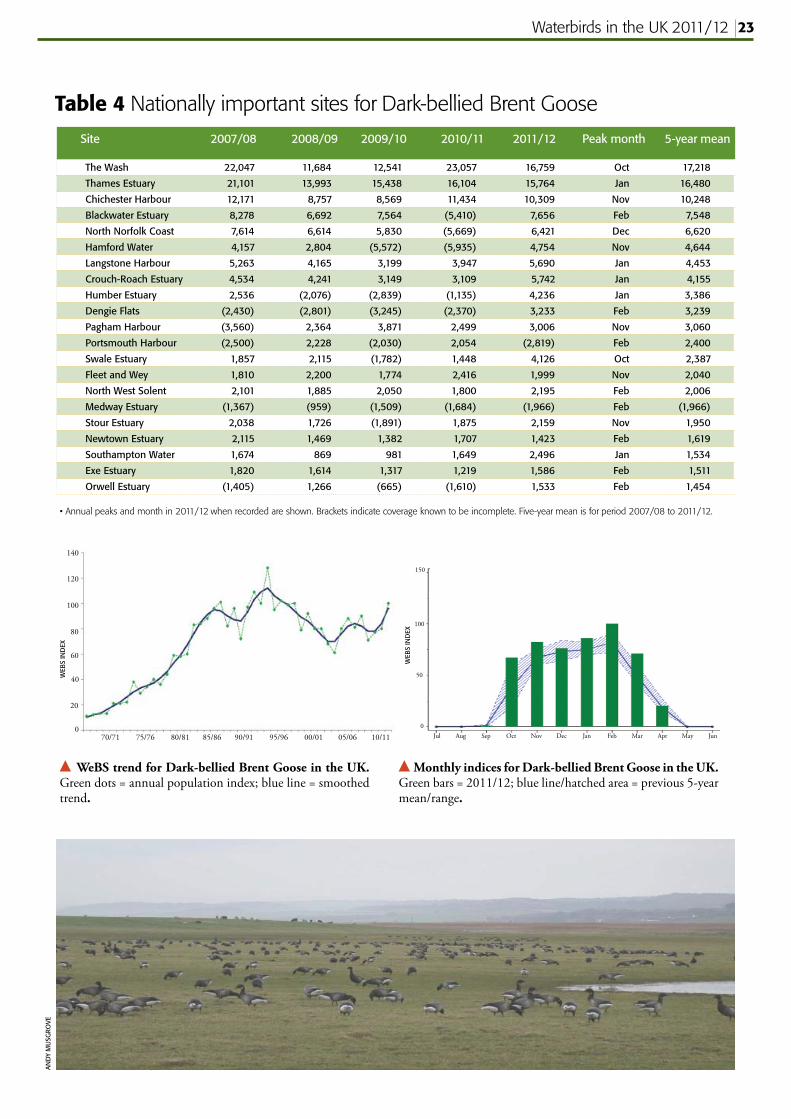
Virtually all the Dark-bellied Brent Geese wintering in Britain are on the estuaries of the southern North Sea or south coast of England. Th e 21 sites that, as of 2011/12, support nationally important numbers are shown in Table 4. Twelve of these sites are of international importance for the population.
Th e site maxima indicate a typical arrival of Dark-bellied Brent Geese to sites in the south-east of England in October when 16,759 were noted at Th e Wash, which proved to be the largest site count of the year. Th e peak of 4,126 at Swale Estuary in October represents the most ever there. At most of the other main sites, the maxima in 2011/12 were close to or slightly above average. Although numbers were relatively high throughout the winter, the monthly indices indicate there may have been an infl ux of birds in February, presumably from Th e Netherlands during cold weather.
WeBS distribution of Dark-bellied Brent Goose. Dot size relates to average annual site maxima between 2007/08 and 2011/12.
1,001 - 5,000
10 - 100101 - 1,000
5,001 - 10,000>10,000
Waterbirds in the UK 2011/12 23
Table 4 Nationally important sites for Dark-bellied Brent Goose
The Wash 22,047 11,684 12,541 23,057 16,759 Oct 17,218
Thames Estuary 21,101 13,993 15,438 16,104 15,764 Jan 16,480
Chichester Harbour 12,171 8,757 8,569 11,434 10,309 Nov 10,248
Blackwater Estuary 8,278 6,692 7,564 (5,410) 7,656 Feb 7,548
North Norfolk Coast 7,614 6,614 5,830 (5,669) 6,421 Dec 6,620
Hamford Water 4,157 2,804 (5,572) (5,935) 4,754 Nov 4,644
Langstone Harbour 5,263 4,165 3,199 3,947 5,690 Jan 4,453
Crouch-Roach Estuary 4,534 4,241 3,149 3,109 5,742 Jan 4,155
Humber Estuary 2,536 (2,076) (2,839) (1,135) 4,236 Jan 3,386
Dengie Flats (2,430) (2,801) (3,245) (2,370) 3,233 Feb 3,239
Pagham Harbour (3,560) 2,364 3,871 2,499 3,006 Nov 3,060
Portsmouth Harbour (2,500) 2,228 (2,030) 2,054 (2,819) Feb 2,400
Swale Estuary 1,857 2,115 (1,782) 1,448 4,126 Oct 2,387
Fleet and Wey 1,810 2,200 1,774 2,416 1,999 Nov 2,040
North West Solent 2,101 1,885 2,050 1,800 2,195 Feb 2,006
Medway Estuary (1,367) (959) (1,509) (1,684) (1,966) Feb (1,966)
Stour Estuary 2,038 1,726 (1,891) 1,875 2,159 Nov 1,950
Newtown Estuary 2,115 1,469 1,382 1,707 1,423 Feb 1,619
Southampton Water 1,674 869 981 1,649 2,496 Jan 1,534
Exe Estuary 1,820 1,614 1,317 1,219 1,586 Feb 1,511
Orwell Estuary (1,405) 1,266 (665) (1,610) 1,533 Feb 1,454
Site 2007/08 2008/09 2009/10 2010/11 2011/12 Peak month 5-year mean
AND
Y M
USG
ROVE
Monthly indices for Dark-bellied Brent Goose in the UK. Green bars = 2011/12; blue line/hatched area = previous 5-year mean/range.
WeBS trend for Dark-bellied Brent Goose in the UK. Green dots = annual population index; blue line = smoothed trend.
WEB
S IN
DEX
WEB
S IN
DEX
• Annual peaks and month in 2011/12 when recorded are shown. Brackets indicate coverage known to be incomplete. Five-year mean is for period 2007/08 to 2011/12.
10/1105/0600/0195/9690/9185/8680/8175/7670/71
140
120
100
80
60
40
20
0
150
100
50
0Jul Aug Sep Oct Nov Dec Jan Feb Mar Apr May Jun
Waterbirds in the UK 2011/1224
HABITAT FOCUS... ESTUARIES
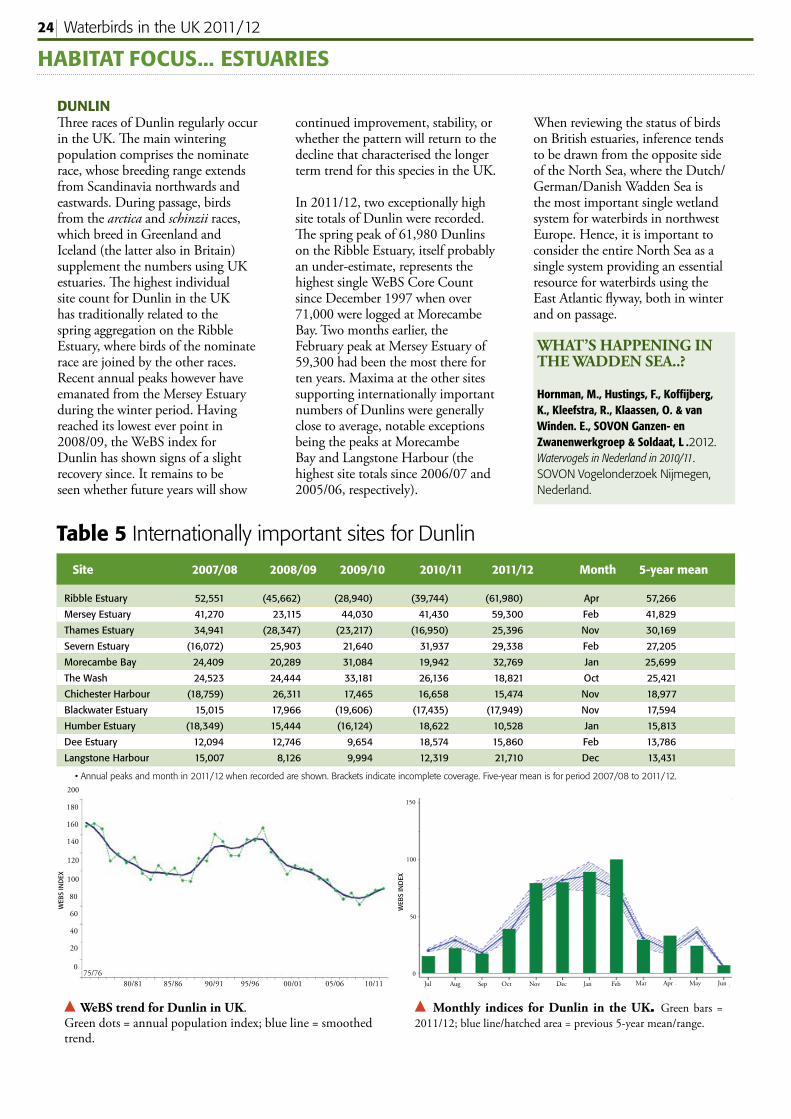
DUNLINTh ree races of Dunlin regularly occur in the UK. Th e main wintering population comprises the nominate race, whose breeding range extends from Scandinavia northwards and eastwards. During passage, birds from the arctica and schinzii races, which breed in Greenland and Iceland (the latter also in Britain) supplement the numbers using UK estuaries. Th e highest individual site count for Dunlin in the UK has traditionally related to the spring aggregation on the Ribble Estuary, where birds of the nominate race are joined by the other races. Recent annual peaks however have emanated from the Mersey Estuary during the winter period. Having reached its lowest ever point in 2008/09, the WeBS index for Dunlin has shown signs of a slight recovery since. It remains to be seen whether future years will show
continued improvement, stability, or whether the pattern will return to the decline that characterised the longer term trend for this species in the UK.
In 2011/12, two exceptionally high site totals of Dunlin were recorded. Th e spring peak of 61,980 Dunlins on the Ribble Estuary, itself probably an under-estimate, represents the highest single WeBS Core Count since December 1997 when over 71,000 were logged at Morecambe Bay. Two months earlier, the February peak at Mersey Estuary of 59,300 had been the most there for ten years. Maxima at the other sites supporting internationally important numbers of Dunlins were generally close to average, notable exceptions being the peaks at Morecambe Bay and Langstone Harbour (the highest site totals since 2006/07 and 2005/06, respectively).
When reviewing the status of birds on British estuaries, inference tends to be drawn from the opposite side of the North Sea, where the Dutch/German/Danish Wadden Sea is the most important single wetland system for waterbirds in northwest Europe. Hence, it is important to consider the entire North Sea as a single system providing an essential resource for waterbirds using the East Atlantic fl yway, both in winter and on passage.
Table 5 Internationally important sites for Dunlin
Ribble Estuary 52,551 (45,662) (28,940) (39,744) (61,980) Apr 57,266
Mersey Estuary 41,270 23,115 44,030 41,430 59,300 Feb 41,829
Thames Estuary 34,941 (28,347) (23,217) (16,950) 25,396 Nov 30,169
Severn Estuary (16,072) 25,903 21,640 31,937 29,338 Feb 27,205
Morecambe Bay 24,409 20,289 31,084 19,942 32,769 Jan 25,699
The Wash 24,523 24,444 33,181 26,136 18,821 Oct 25,421
Chichester Harbour (18,759) 26,311 17,465 16,658 15,474 Nov 18,977
Blackwater Estuary 15,015 17,966 (19,606) (17,435) (17,949) Nov 17,594
Humber Estuary (18,349) 15,444 (16,124) 18,622 10,528 Jan 15,813
Dee Estuary 12,094 12,746 9,654 18,574 15,860 Feb 13,786
Langstone Harbour 15,007 8,126 9,994 12,319 21,710 Dec 13,431
Site 2007/08 2008/09 2009/10 2010/11 2011/12 Month 5-year mean
Jul Aug Sep Oct Nov Dec Jan Feb Mar Apr May Jun0
50
100
150
WHAT’S HAPPENING IN THE WADDEN SEA..?
Hornman, M., Hustings, F., Koffi jberg, K., Kleefstra, R., Klaassen, O. & van Winden. E., SOVON Ganzen- en Zwanenwerkgroep & Soldaat, L .2012. Watervogels in Nederland in 2010/11. SOVON Vogelonderzoek Nijmegen, Nederland.
WeBS trend for Dunlin in UK. Green dots = annual population index; blue line = smoothed trend.
Monthly indices for Dunlin in the UK. Green bars = 2011/12; blue line/hatched area = previous 5-year mean/range.
WEB
S IN
DEX
WEB
S IN
DEX
• Annual peaks and month in 2011/12 when recorded are shown. Brackets indicate incomplete coverage. Five-year mean is for period 2007/08 to 2011/12.
10/1105/0600/0195/9690/9185/8680/8175/76
200
180
20
40
60
80
100
120
140
160
0
Waterbirds in the UK 2011/12 25RI
CH
ARD
JOH
NSO
N
Waterbirds in the UK 2011/1226
INTERNATIONAL 2011/12 - FLYWAY MONITORING
International Waterbird Census An annual update about monitoring of the fl yway’s waterbird populations
Th e WeBS Core Counts undertaken in January 2012 contributed to the International Waterbird Census (IWC), coordinated by Wetlands International and the African-Eurasian Waterbird Monitoring Partnership. Th e UK is fortunate in that it runs a funded waterbird monitoring scheme which counts the nation’s major wetlands on a monthly basis during winter, and indeed at many sites monthly coverage is maintained throughout the year. Relatively few countries are in such a position; neighbouring the UK, Ireland and Th e Netherlands represent the obvious exceptions. Th e majority of national waterbird monitoring schemes however are limited to undertaking counts in January, thereby satisfying requirements of the IWC.
Th e collation of January waterbird data from national monitoring schemes across around the world allows a robust approach to the derivation of population estimates and trends. July 2012 saw
production of the latest Waterbird Population Estimates, now online at wpe.wetlands.org, where data for all waterbird species across all fl yways are accessible. Th is resource is updated by Wetlands International every six years. Th e population estimates are used to derive the 1% thresholds used to identify wetlands of international importance for particular species or populations. Another signifi cant fl yway scale output during the 2011/12 reporting period was publication of results from the latest pan-European census of Golden Plovers. Th is survey is traditionally undertaken in October (rather than the standard IWC month of January) as most Golden Plovers are concentrated in northwest Europe at that time. Based on WeBS data combined with sightings from Bird Atlas 2007-11 and the BirdTrack online observation system, Gillings et al. (2012) reported a total of 152,000 Golden Plovers in the UK, contributing to an estimated total population of over one million across Europe.
Th e African-Eurasian Waterbird Monitoring Partnership aims to both help ensure and optimise the collection of waterbird information and the subsequent delivery by Wetlands International of the associated reporting products for the fl yway. Th e WeBS Partnership, and both WWT and BTO are all actively supporting this initiative (see WeBS News 29: 17).
RIC
HAR
D JO
HN
SON
FIND OUT MORE...
Gillings, S., Avontins, A., Crowe, O., Dalakchieva, S., Devos, K., Elts, J., Green, M., Gunnarsson, T.G., Kleefstra, R., Kubelka, V., Lehtiniemi, T., Meissner, W., Pakstyte, E., Rasmussen, L., Szimuly, G. & Wahl, J. 2012. Results of a coordinated count of Eurasian Golden Plovers Pluvialis apricaria in Europe during October 2008. Wader Study Group Bulletin 119: 125–128.
Wetlands International, 2012. “Waterbird Population Estimates”. wpe.wetlands.org
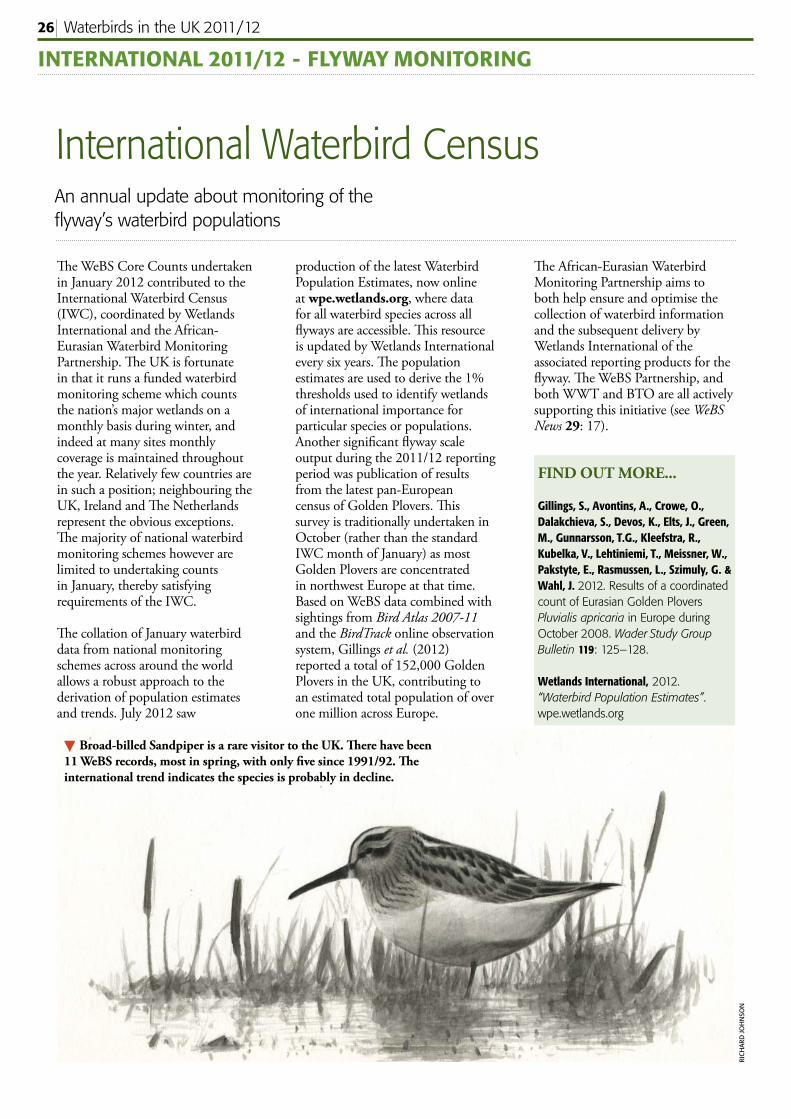
Broad-billed Sandpiper is a rare visitor to the UK. Th ere have been 11 WeBS records, most in spring, with only fi ve since 1991/92. Th e international trend indicates the species is probably in decline.
Waterbirds in the UK 2011/12 27
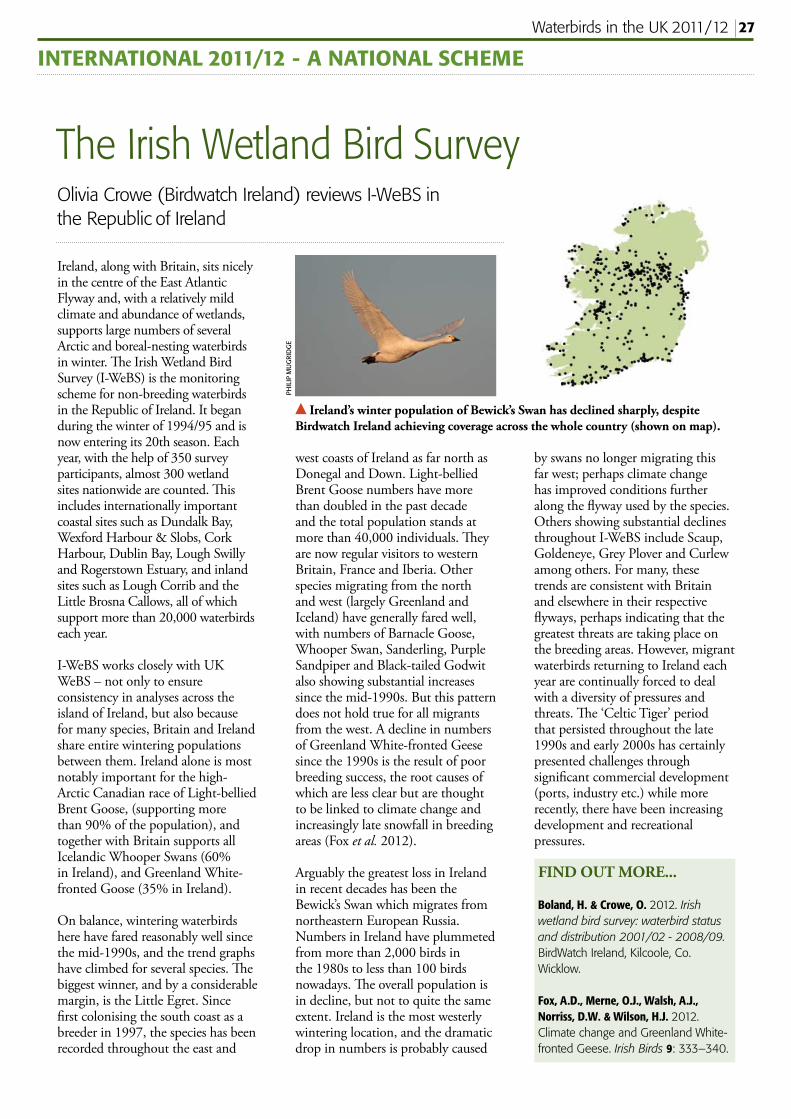
Ireland’s winter population of Bewick’s Swan has declined sharply, despite Birdwatch Ireland achieving coverage across the whole country (shown on map).
INTERNATIONAL 2011/12 - A NATIONAL SCHEME
The Irish Wetland Bird Survey Olivia Crowe (Birdwatch Ireland) reviews I-WeBS in the Republic of Ireland
Ireland, along with Britain, sits nicely in the centre of the East Atlantic Flyway and, with a relatively mild climate and abundance of wetlands, supports large numbers of several Arctic and boreal-nesting waterbirds in winter. Th e Irish Wetland Bird Survey (I-WeBS) is the monitoring scheme for non-breeding waterbirds in the Republic of Ireland. It began during the winter of 1994/95 and is now entering its 20th season. Each year, with the help of 350 survey participants, almost 300 wetland sites nationwide are counted. Th is includes internationally important coastal sites such as Dundalk Bay, Wexford Harbour & Slobs, Cork Harbour, Dublin Bay, Lough Swilly and Rogerstown Estuary, and inland sites such as Lough Corrib and the Little Brosna Callows, all of which support more than 20,000 waterbirds each year.
I-WeBS works closely with UK WeBS – not only to ensure consistency in analyses across the island of Ireland, but also because for many species, Britain and Ireland share entire wintering populations between them. Ireland alone is most notably important for the high-Arctic Canadian race of Light-bellied Brent Goose, (supporting more than 90% of the population), and together with Britain supports all Icelandic Whooper Swans (60% in Ireland), and Greenland White-fronted Goose (35% in Ireland).
On balance, wintering waterbirds here have fared reasonably well since the mid-1990s, and the trend graphs have climbed for several species. Th e biggest winner, and by a considerable margin, is the Little Egret. Since fi rst colonising the south coast as a breeder in 1997, the species has been recorded throughout the east and
west coasts of Ireland as far north as Donegal and Down. Light-bellied Brent Goose numbers have more than doubled in the past decade and the total population stands at more than 40,000 individuals. Th ey are now regular visitors to western Britain, France and Iberia. Other species migrating from the north and west (largely Greenland and Iceland) have generally fared well, with numbers of Barnacle Goose, Whooper Swan, Sanderling, Purple Sandpiper and Black-tailed Godwit also showing substantial increases since the mid-1990s. But this pattern does not hold true for all migrants from the west. A decline in numbers of Greenland White-fronted Geese since the 1990s is the result of poor breeding success, the root causes of which are less clear but are thought to be linked to climate change and increasingly late snowfall in breeding areas (Fox et al. 2012).
Arguably the greatest loss in Ireland in recent decades has been the Bewick’s Swan which migrates from northeastern European Russia. Numbers in Ireland have plummeted from more than 2,000 birds in the 1980s to less than 100 birds nowadays. Th e overall population is in decline, but not to quite the same extent. Ireland is the most westerly wintering location, and the dramatic drop in numbers is probably caused
by swans no longer migrating this far west; perhaps climate change has improved conditions further along the fl yway used by the species. Others showing substantial declines throughout I-WeBS include Scaup, Goldeneye, Grey Plover and Curlew among others. For many, these trends are consistent with Britain and elsewhere in their respective fl yways, perhaps indicating that the greatest threats are taking place on the breeding areas. However, migrant waterbirds returning to Ireland each year are continually forced to deal with a diversity of pressures and threats. Th e ‘Celtic Tiger’ period that persisted throughout the late 1990s and early 2000s has certainly presented challenges through signifi cant commercial development (ports, industry etc.) while more recently, there have been increasing development and recreational pressures.
FIND OUT MORE...
Boland, H. & Crowe, O. 2012. Irish wetland bird survey: waterbird status and distribution 2001/02 - 2008/09. BirdWatch Ireland, Kilcoole, Co. Wicklow.
Fox, A.D., Merne, O.J., Walsh, A.J., Norriss, D.W. & Wilson, H.J. 2012. Climate change and Greenland White-fronted Geese. Irish Birds 9: 333–340.
PHIL
IP M
UG
RID
GE
Waterbirds in the UK 2011/1228
RESEARCH IN THE FLYWAY
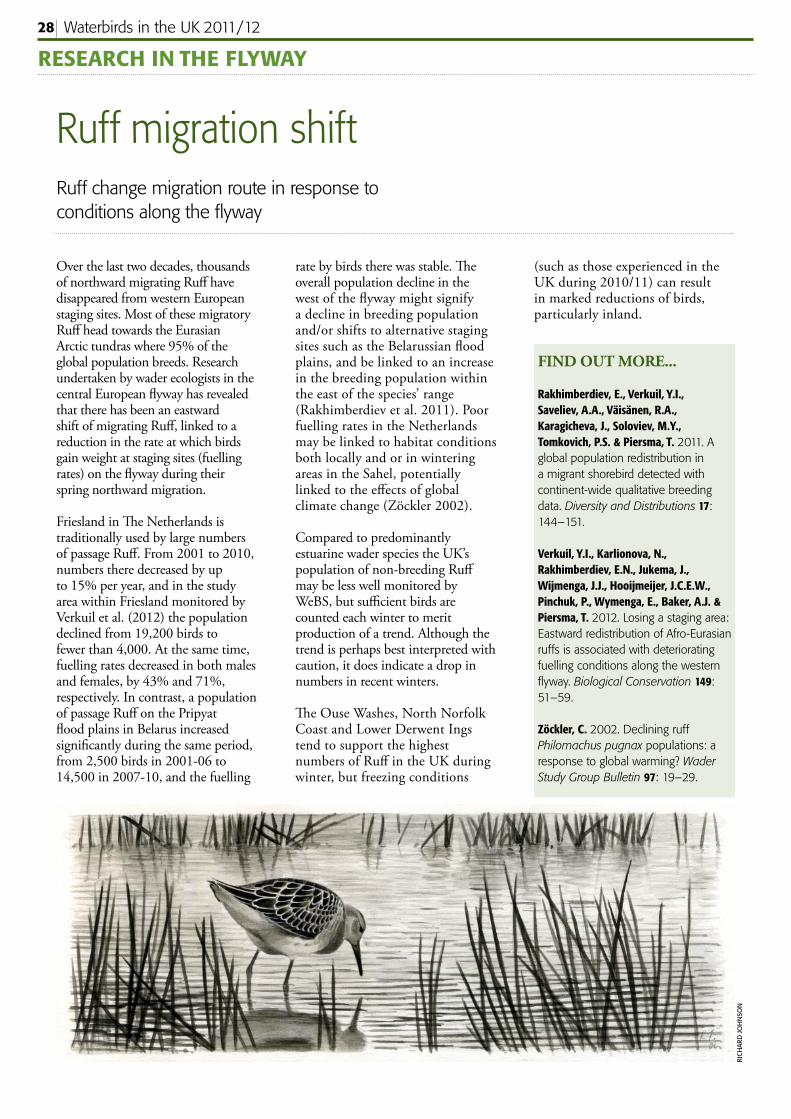
Ruff migration shiftRuff change migration route in response to conditions along the fl yway
Over the last two decades, thousands of northward migrating Ruff have disappeared from western European staging sites. Most of these migratory Ruff head towards the Eurasian Arctic tundras where 95% of the global population breeds. Research undertaken by wader ecologists in the central European fl yway has revealed that there has been an eastward shift of migrating Ruff , linked to a reduction in the rate at which birds gain weight at staging sites (fuelling rates) on the fl yway during their spring northward migration. Friesland in Th e Netherlands is traditionally used by large numbers of passage Ruff . From 2001 to 2010, numbers there decreased by up to 15% per year, and in the study area within Friesland monitored by Verkuil et al. (2012) the population declined from 19,200 birds to fewer than 4,000. At the same time, fuelling rates decreased in both males and females, by 43% and 71%, respectively. In contrast, a population of passage Ruff on the Pripyat fl ood plains in Belarus increased signifi cantly during the same period, from 2,500 birds in 2001-06 to 14,500 in 2007-10, and the fuelling
rate by birds there was stable. Th e overall population decline in the west of the fl yway might signify a decline in breeding population and/or shifts to alternative staging sites such as the Belarussian fl ood plains, and be linked to an increase in the breeding population within the east of the species’ range (Rakhimberdiev et al. 2011). Poor fuelling rates in the Netherlands may be linked to habitat conditions both locally and or in wintering areas in the Sahel, potentially linked to the eff ects of global climate change (Zöckler 2002). Compared to predominantly estuarine wader species the UK’s population of non-breeding Ruff may be less well monitored by WeBS, but suffi cient birds are counted each winter to merit production of a trend. Although the trend is perhaps best interpreted with caution, it does indicate a drop in numbers in recent winters.
Th e Ouse Washes, North Norfolk Coast and Lower Derwent Ings tend to support the highest numbers of Ruff in the UK during winter, but freezing conditions
RIC
HAR
D JO
HN
SON
FIND OUT MORE...
Rakhimberdiev, E., Verkuil, Y.I., Saveliev, A.A., Väisänen, R.A., Karagicheva, J., Soloviev, M.Y., Tomkovich, P.S. & Piersma, T. 2011. A global population redistribution in a migrant shorebird detected with continent-wide qualitative breeding data. Diversity and Distributions 17: 144–151.
Verkuil, Y.I., Karlionova, N., Rakhimberdiev, E.N., Jukema, J., Wijmenga, J.J., Hooijmeijer, J.C.E.W., Pinchuk, P., Wymenga, E., Baker, A.J. & Piersma, T. 2012. Losing a staging area: Eastward redistribution of Afro-Eurasian ruffs is associated with deteriorating fuelling conditions along the western fl yway. Biological Conservation 149: 51–59.
Zöckler, C. 2002. Declining ruff Philomachus pugnax populations: a response to global warming? Wader Study Group Bulletin 97: 19–29.
(such as those experienced in the UK during 2010/11) can result in marked reductions of birds, particularly inland.
Waterbirds in the UK 2011/12 29
RESEARCH IN THE FLYWAY
Diving ducks and climate changeCollaborative research reveals changing duck distributions across Europe are due to winter temperatures
WeBS data are playing an important part in research into the eff ects of climate change on waterbirds across the fl yway. Th ree decades of data from across northwest Europe, spanning the period 1980 to 2010, have been used to examine responses by three common diving ducks (Goldeneye, Tufted Duck and Goosander). Th e analysis of January counts from nine countries/regions (Finland, Sweden, Denmark, Germany, Th e Netherlands, Switzerland, France, the island of Ireland and Great Britain), have been published by Lehikoinen et al. (2013). Note, for the purpose of this research, WeBS Counts from Northern Ireland were pooled with Irish I-WeBS data to generate the information for the island of Ireland (biologically, the most appropriate spatial area).
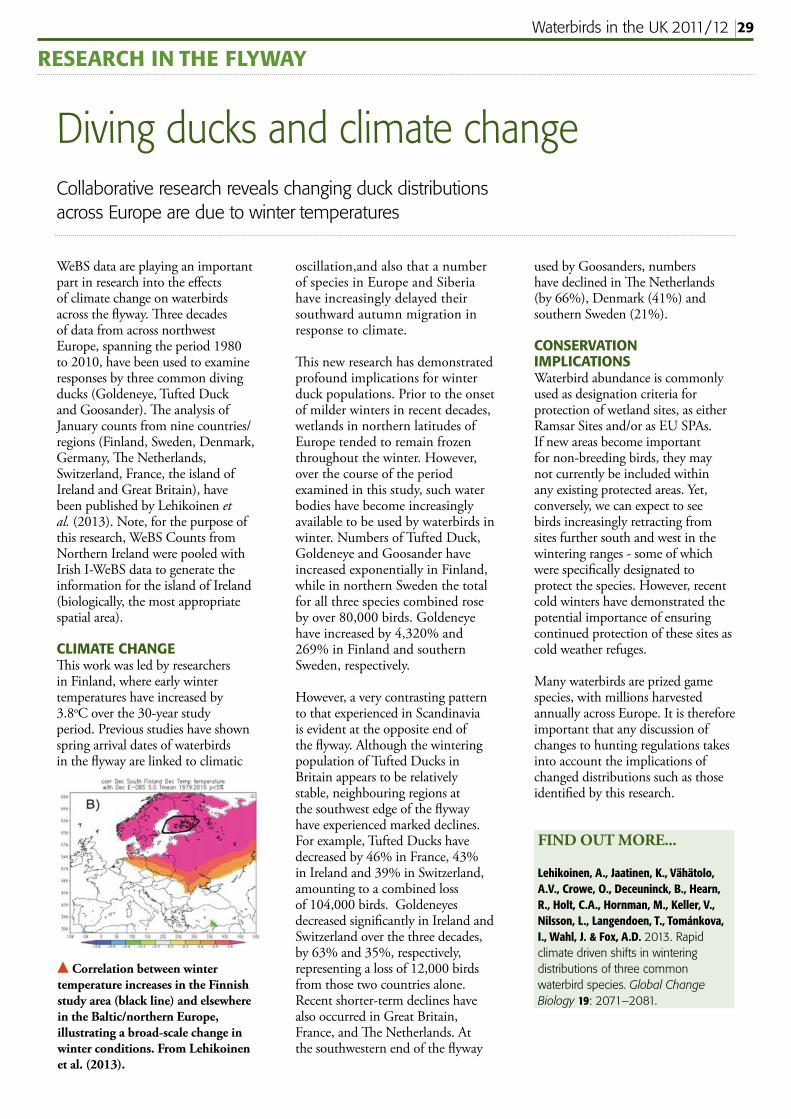
CLIMATE CHANGETh is work was led by researchers in Finland, where early winter temperatures have increased by 3.8oC over the 30-year study period. Previous studies have shown spring arrival dates of waterbirds in the fl yway are linked to climatic
Correlation between winter temperature increases in the Finnish study area (black line) and elsewhere in the Baltic/northern Europe, illustrating a broad-scale change in winter conditions. From Lehikoinen et al. (2013).
oscillation,and also that a number of species in Europe and Siberia have increasingly delayed their southward autumn migration in response to climate.
Th is new research has demonstrated profound implications for winter duck populations. Prior to the onset of milder winters in recent decades, wetlands in northern latitudes of Europe tended to remain frozen throughout the winter. However, over the course of the period examined in this study, such water bodies have become increasingly available to be used by waterbirds in winter. Numbers of Tufted Duck, Goldeneye and Goosander have increased exponentially in Finland, while in northern Sweden the total for all three species combined rose by over 80,000 birds. Goldeneye have increased by 4,320% and 269% in Finland and southern Sweden, respectively.
However, a very contrasting pattern to that experienced in Scandinavia is evident at the opposite end of the fl yway. Although the wintering population of Tufted Ducks in Britain appears to be relatively stable, neighbouring regions at the southwest edge of the fl yway have experienced marked declines. For example, Tufted Ducks have decreased by 46% in France, 43% in Ireland and 39% in Switzerland, amounting to a combined loss of 104,000 birds. Goldeneyes decreased signifi cantly in Ireland and Switzerland over the three decades, by 63% and 35%, respectively, representing a loss of 12,000 birds from those two countries alone. Recent shorter-term declines have also occurred in Great Britain, France, and Th e Netherlands. At the southwestern end of the fl yway
used by Goosanders, numbers have declined in Th e Netherlands (by 66%), Denmark (41%) and southern Sweden (21%).
CONSERVATION IMPLICATIONSWaterbird abundance is commonly used as designation criteria for protection of wetland sites, as either Ramsar Sites and/or as EU SPAs. If new areas become important for non-breeding birds, they may not currently be included within any existing protected areas. Yet, conversely, we can expect to see birds increasingly retracting from sites further south and west in the wintering ranges - some of which were specifi cally designated to protect the species. However, recent cold winters have demonstrated the potential importance of ensuring continued protection of these sites as cold weather refuges.
Many waterbirds are prized game species, with millions harvested annually across Europe. It is therefore important that any discussion of changes to hunting regulations takes into account the implications of changed distributions such as those identifi ed by this research.
FIND OUT MORE...
Lehikoinen, A., Jaatinen, K., Vähätolo, A.V., Crowe, O., Deceuninck, B., Hearn, R., Holt, C.A., Hornman, M., Keller, V., Nilsson, L., Langendoen, T., Tománkova, I., Wahl, J. & Fox, A.D. 2013. Rapid climate driven shifts in wintering distributions of three common waterbird species. Global Change Biology 19: 2071–2081.
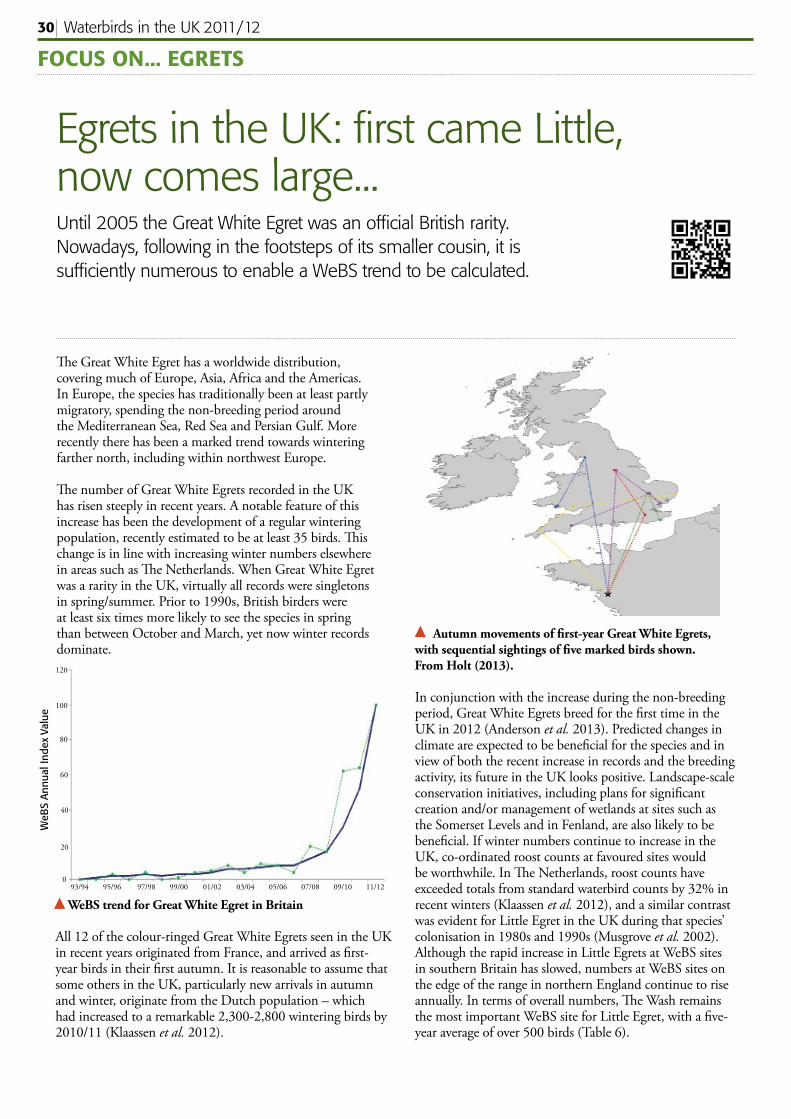
Waterbirds in the UK 2011/1230
Egrets in the UK: fi rst came Little, now comes large...
Th e Great White Egret has a worldwide distribution, covering much of Europe, Asia, Africa and the Americas. In Europe, the species has traditionally been at least partly migratory, spending the non-breeding period around the Mediterranean Sea, Red Sea and Persian Gulf. More recently there has been a marked trend towards wintering farther north, including within northwest Europe.
Th e number of Great White Egrets recorded in the UK has risen steeply in recent years. A notable feature of this increase has been the development of a regular wintering population, recently estimated to be at least 35 birds. Th is change is in line with increasing winter numbers elsewhere in areas such as Th e Netherlands. When Great White Egret was a rarity in the UK, virtually all records were singletons in spring/summer. Prior to 1990s, British birders were at least six times more likely to see the species in spring than between October and March, yet now winter records dominate.
In conjunction with the increase during the non-breeding period, Great White Egrets breed for the fi rst time in the UK in 2012 (Anderson et al. 2013). Predicted changes in climate are expected to be benefi cial for the species and in view of both the recent increase in records and the breeding activity, its future in the UK looks positive. Landscape-scale conservation initiatives, including plans for signifi cant creation and/or management of wetlands at sites such as the Somerset Levels and in Fenland, are also likely to be benefi cial. If winter numbers continue to increase in the UK, co-ordinated roost counts at favoured sites would be worthwhile. In Th e Netherlands, roost counts have exceeded totals from standard waterbird counts by 32% in recent winters (Klaassen et al. 2012), and a similar contrast was evident for Little Egret in the UK during that species’ colonisation in 1980s and 1990s (Musgrove et al. 2002). Although the rapid increase in Little Egrets at WeBS sites in southern Britain has slowed, numbers at WeBS sites on the edge of the range in northern England continue to rise annually. In terms of overall numbers, Th e Wash remains the most important WeBS site for Little Egret, with a fi ve-year average of over 500 birds (Table 6).
Until 2005 the Great White Egret was an offi cial British rarity. Nowadays, following in the footsteps of its smaller cousin, it is suffi ciently numerous to enable a WeBS trend to be calculated.
FOCUS ON... EGRETS
WeBS trend for Great White Egret in Britain
All 12 of the colour-ringed Great White Egrets seen in the UK in recent years originated from France, and arrived as fi rst-year birds in their fi rst autumn. It is reasonable to assume that some others in the UK, particularly new arrivals in autumn and winter, originate from the Dutch population – which had increased to a remarkable 2,300-2,800 wintering birds by 2010/11 (Klaassen et al. 2012).
Autumn movements of fi rst-year Great White Egrets, with sequential sightings of fi ve marked birds shown. From Holt (2013).
WeB
S An
nual
Inde
x Va
lue
20
40
60
80
100
120
011/1209/1007/0805/0603/0401/0299/0097/9895/9693/94
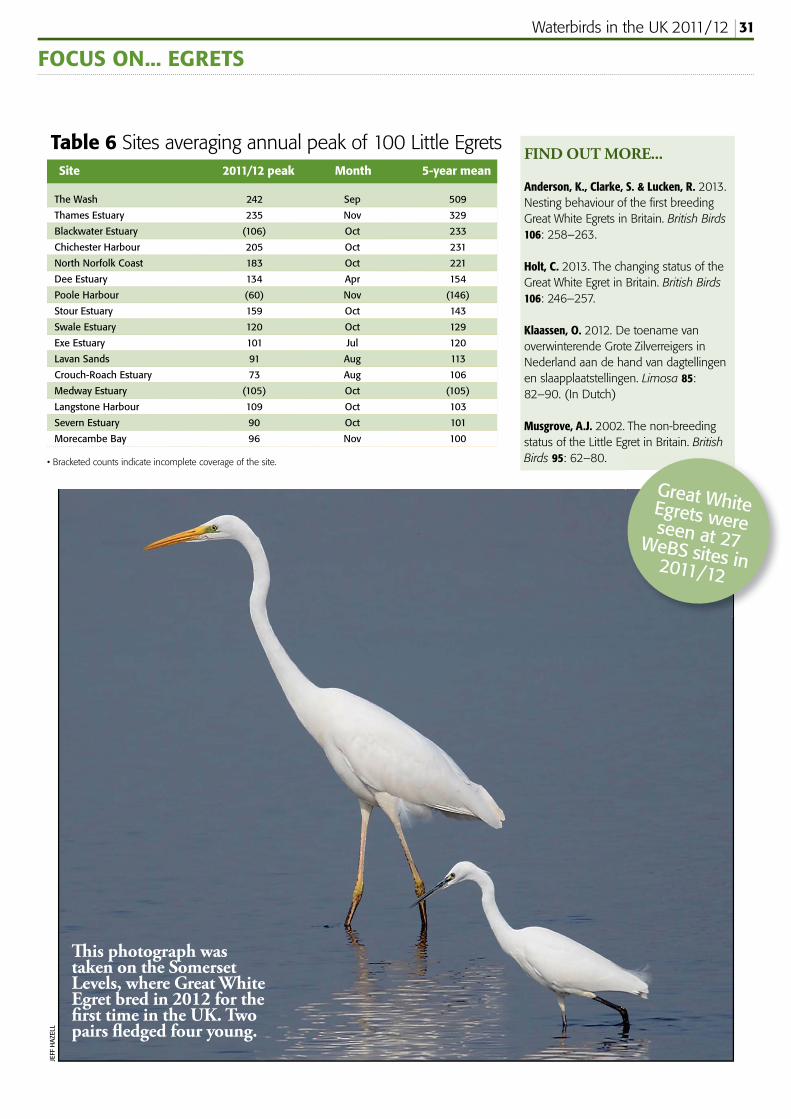
Waterbirds in the UK 2011/12 31
FOCUS ON... EGRETSJE
FF H
AZEL
L
Th is photograph was taken on the Somerset Levels, where Great White Egret bred in 2012 for the fi rst time in the UK. Two pairs fl edged four young.
FIND OUT MORE...
Anderson, K., Clarke, S. & Lucken, R. 2013. Nesting behaviour of the fi rst breeding Great White Egrets in Britain. British Birds 106: 258–263.
Holt, C. 2013. The changing status of the Great White Egret in Britain. British Birds 106: 246–257.
Klaassen, O. 2012. De toename van overwinterende Grote Zilverreigers in Nederland aan de hand van dagtellingen en slaapplaatstellingen. Limosa 85: 82–90. (In Dutch)
Musgrove, A.J. 2002. The non-breeding status of the Little Egret in Britain. British Birds 95: 62–80.
Table 6 Sites averaging annual peak of 100 Little Egrets
The Wash 242 Sep 509
Thames Estuary 235 Nov 329
Blackwater Estuary (106) Oct 233
Chichester Harbour 205 Oct 231
North Norfolk Coast 183 Oct 221
Dee Estuary 134 Apr 154
Poole Harbour (60) Nov (146)
Stour Estuary 159 Oct 143
Swale Estuary 120 Oct 129
Exe Estuary 101 Jul 120
Lavan Sands 91 Aug 113
Crouch-Roach Estuary 73 Aug 106
Medway Estuary (105) Oct (105)
Langstone Harbour 109 Oct 103
Severn Estuary 90 Oct 101
Morecambe Bay 96 Nov 100
Site 2011/12 peak Month 5-year mean
Great White Egrets were seen at 27 WeBS sites in 2011/12
• Bracketed counts indicate incomplete coverage of the site.
Waterbirds in the UK 2011/1232
UK wintering Pochards reach record low
Th e Pochard remains a familiar species to many WeBS counters and numerous at the population scale (there are an estimated 300,000 in the North-west European population), but there is growing concern over its conservation status. It is the UK’s fastest declining wintering duck and numbers are also falling at a population scale. It is currently on the Amber list of the UK’s Birds of Conservation Concern (BoCC) (Eaton et al. 2009), but the UK decline has reached a 50% drop in the last 25 years. It is therefore possible that the Pochard could be Red-listed when the next BoCC lists are assessed in 2014.
Th e trends for Pochard in Britain and Northern Ireland indicate that this alarming situation began in the 1990s. WeBS Alerts show that long-term declines have occurred at seven of the 12 Special Protection Areas designated for this species in the UK. At a further three sites there have been short-term declines. Th is includes a 76% decline at the most important wintering site, Lough Neagh and Lough Beg SPA (see p.19), in Northern Ireland, which appears to be continuing. Whilst that site remains an internationally important site for the species, the number there has decreased from 40,000 just 20 years ago. More than 10,000 were seen in 2011/12, but the updated fi ve-year average for Loughs Neagh & Beg has fallen to just 7,823 birds (Table 7). In England, the WeBS Alerts show that the largest long-term declines at SPAs have been at Poole Harbour (-68%), Broadland (-61%) and Severn Estuary (-58%).
Away from the UK, a similar decline has also taken place in Th e Netherlands, yet further east in Sweden numbers have strongly increased (Nilsson 2008). Th is suggests that the decline in the UK is due to distribution change - the so-called ‘short stopping’ phenomenon that is happening increasingly among migrant waterbirds. However, analyses of data collated for the International Waterbird Census (see p. 26) has indicated that the North-west European population of Pochards has shown a signifi cant long-term decline overall, although not as large as that found in the UK. Furthermore, a long term decline has also been detected in the Central Europe, Black Sea and Mediterranean population. Th us it would appear that the decline detected in the UK by WeBS counters is due to a combination of genuine decline at the population scale and
a shift away from western wintering areas such as the UK. Th e latter has recently been demonstrated by Lehikoinen et al. (2013) to have taken place with other species of diving duck; see page 29. Mild winters are also known to reduce distances of within-winter movements by Pochards (Keller et al. 2009).
It is therefore vital that the high quality of our monitoring of Pochard in the UK is maintained, and there may be an increased need to collect additional information on this species in the near future as potential research and conservation actions required to safeguard it are considered. Furthermore, WWT and BTO, through work with the African-Eurasian Waterbird Monitoring Partnership, will be helping to ensure counts elsewhere in the fl yway are maintained and developed, so that the overall population trend can be tracked. Such improved monitoring is an essential step in developing future research and conservation needs for the species.
Kane Brides (WWT) asks why the UK’s wintering population of Pochards has halved in the last 25 years. Looking outside the British Isles may help to provide at least part of the answer.
FOCUS ON... POCHARD
FIND OUT MORE...
Eaton, M.A., Brown, A.F., Noble, D.G., Musgrove, A.J., Hearn, R., Aebischer, N.J., Gibbons, D.W., Evans, A. & Gregory, R.D. 2009. Birds of Conservation Concern 3: the population status of birds in the United Kingdom, Channel Islands and the Isle of Man. British Birds 102: 296–341.
Keller, I., Korner-Nievergelt, F. & Jenni, L. 2009. Within-winter movements: a common phenomenon in the Common Pochard Aythya ferina. Journal of Ornithology 150: 483–494.
Lehikoinen, A., Jaatinen, K., Vähätolo, A.V., Crowe, O., Deceuninck, B., Hearn, R., Holt, C.A., Hornman, M., Keller, V., Nilsson, L., Langendoen, T., Tománkova, I., Wahl, J. & Fox, A.D. 2013. Rapid climate driven shifts in wintering distributions of three common waterbird species. Global Change Biology 19: 2071–2081.
Nilsson, L. 2008. Changes in numbers and distribution of wintering waterfowl in Sweden. Ornis Svecica 18: 135–226.
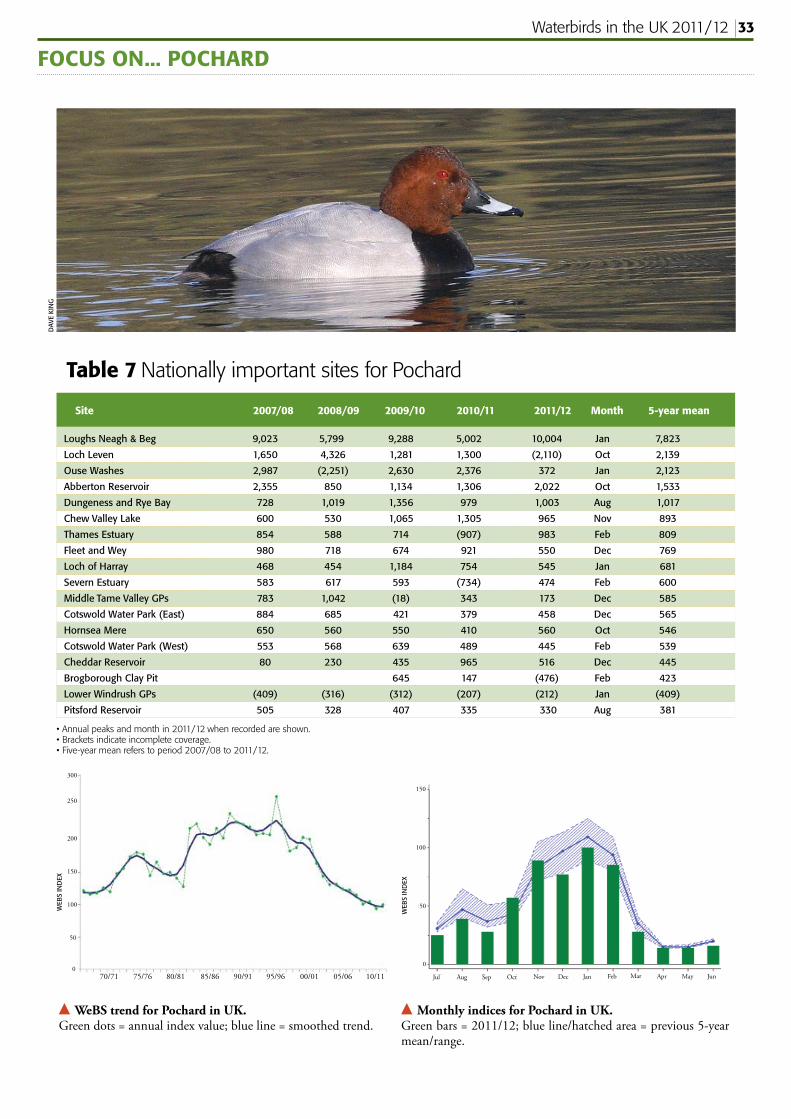
Waterbirds in the UK 2011/12 33
FOCUS ON... POCHARDD
AVE
KIN
G
Loughs Neagh & Beg 9,023 5,799 9,288 5,002 10,004 Jan 7,823
Loch Leven 1,650 4,326 1,281 1,300 (2,110) Oct 2,139
Ouse Washes 2,987 (2,251) 2,630 2,376 372 Jan 2,123
Abberton Reservoir 2,355 850 1,134 1,306 2,022 Oct 1,533
Dungeness and Rye Bay 728 1,019 1,356 979 1,003 Aug 1,017
Chew Valley Lake 600 530 1,065 1,305 965 Nov 893
Thames Estuary 854 588 714 (907) 983 Feb 809
Fleet and Wey 980 718 674 921 550 Dec 769
Loch of Harray 468 454 1,184 754 545 Jan 681
Severn Estuary 583 617 593 (734) 474 Feb 600
Middle Tame Valley GPs 783 1,042 (18) 343 173 Dec 585
Cotswold Water Park (East) 884 685 421 379 458 Dec 565
Hornsea Mere 650 560 550 410 560 Oct 546
Cotswold Water Park (West) 553 568 639 489 445 Feb 539
Cheddar Reservoir 80 230 435 965 516 Dec 445
Brogborough Clay Pit 645 147 (476) Feb 423
Lower Windrush GPs (409) (316) (312) (207) (212) Jan (409)
Pitsford Reservoir 505 328 407 335 330 Aug 381
Table 7 Nationally important sites for Pochard
Site 2007/08 2008/09 2009/10 2010/11 2011/12 Month 5-year mean
Monthly indices for Pochard in UK. Green bars = 2011/12; blue line/hatched area = previous 5-year mean/range.
WeBS trend for Pochard in UK. Green dots = annual index value; blue line = smoothed trend.
WEB
S IN
DEX
WEB
S IN
DEX
• Annual peaks and month in 2011/12 when recorded are shown.• Brackets indicate incomplete coverage. • Five-year mean refers to period 2007/08 to 2011/12.
Jul Aug Sep Oct Nov Dec Jan Feb Mar Apr May Jun
0
50
100
150
0
50
100
150
200
250
300
10/1105/0600/0195/9690/9185/8680/8175/7670/71
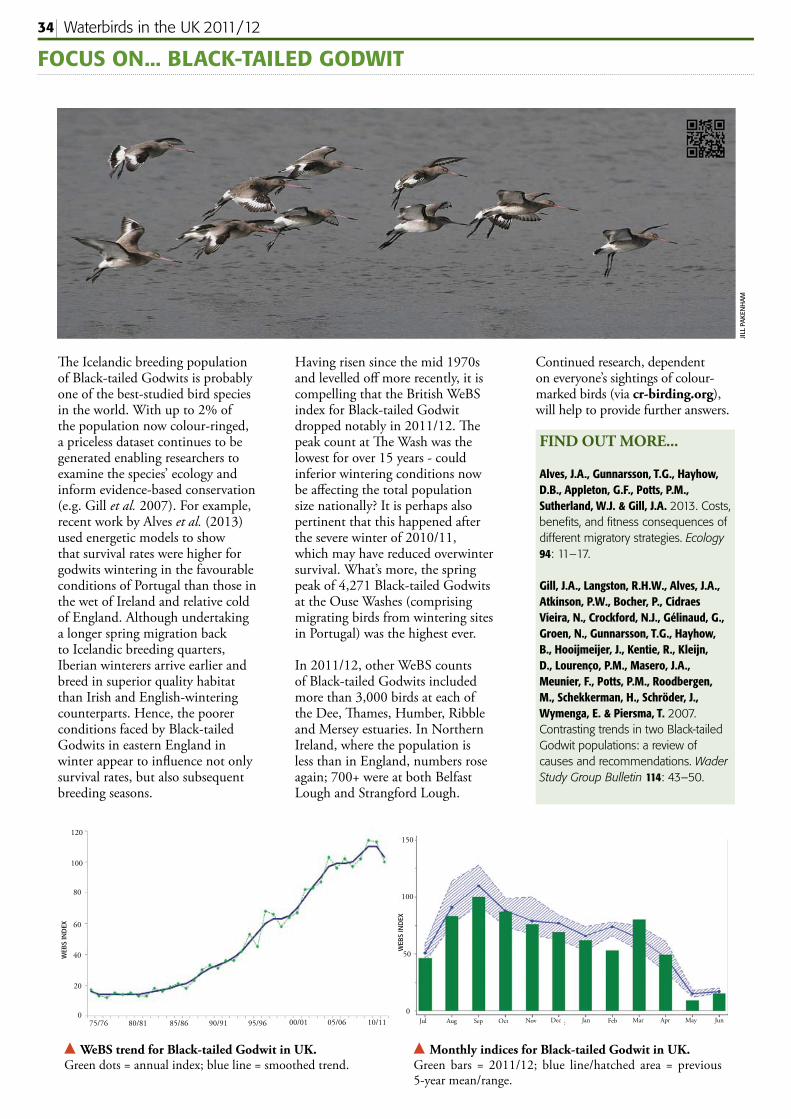
Waterbirds in the UK 2011/1234
FOCUS ON... BLACK-TAILED GODWIT
JILL
PAKE
NH
AM
Th e Icelandic breeding population of Black-tailed Godwits is probably one of the best-studied bird species in the world. With up to 2% of the population now colour-ringed, a priceless dataset continues to be generated enabling researchers to examine the species’ ecology and inform evidence-based conservation (e.g. Gill et al. 2007). For example, recent work by Alves et al. (2013) used energetic models to show that survival rates were higher for godwits wintering in the favourable conditions of Portugal than those in the wet of Ireland and relative cold of England. Although undertaking a longer spring migration back to Icelandic breeding quarters, Iberian winterers arrive earlier and breed in superior quality habitat than Irish and English-wintering counterparts. Hence, the poorer conditions faced by Black-tailed Godwits in eastern England in winter appear to infl uence not only survival rates, but also subsequent breeding seasons.
Having risen since the mid 1970s and levelled off more recently, it is compelling that the British WeBS index for Black-tailed Godwit dropped notably in 2011/12. Th e peak count at Th e Wash was the lowest for over 15 years - could inferior wintering conditions now be aff ecting the total population size nationally? It is perhaps also pertinent that this happened after the severe winter of 2010/11, which may have reduced overwinter survival. What’s more, the spring peak of 4,271 Black-tailed Godwits at the Ouse Washes (comprising migrating birds from wintering sites in Portugal) was the highest ever.
In 2011/12, other WeBS counts of Black-tailed Godwits included more than 3,000 birds at each of the Dee, Th ames, Humber, Ribble and Mersey estuaries. In Northern Ireland, where the population is less than in England, numbers rose again; 700+ were at both Belfast Lough and Strangford Lough.
FIND OUT MORE...
Alves, J.A., Gunnarsson, T.G., Hayhow, D.B., Appleton, G.F., Potts, P.M., Sutherland, W.J. & Gill, J.A. 2013. Costs, benefi ts, and fi tness consequences of different migratory strategies. Ecology 94: 11–17.
Gill, J.A., Langston, R.H.W., Alves, J.A., Atkinson, P.W., Bocher, P., Cidraes Vieira, N., Crockford, N.J., Gélinaud, G., Groen, N., Gunnarsson, T.G., Hayhow, B., Hooijmeijer, J., Kentie, R., Kleijn, D., Lourenço, P.M., Masero, J.A., Meunier, F., Potts, P.M., Roodbergen, M., Schekkerman, H., Schröder, J., Wymenga, E. & Piersma, T. 2007. Contrasting trends in two Black-tailed Godwit populations: a review of causes and recommendations. Wader Study Group Bulletin 114: 43–50.
Continued research, dependent on everyone’s sightings of colour-marked birds (via cr-birding.org), will help to provide further answers.
WeBS trend for Black-tailed Godwit in UK. Green dots = annual index; blue line = smoothed trend.
Monthly indices for Black-tailed Godwit in UK. Green bars = 2011/12; blue line/hatched area = previous 5-year mean/range.
WEB
S IN
DEX
WEB
S IN
DEX
20
40
60
80
100
120
010/1105/0600/0195/9690/9185/8680/8175/76
0
50
100
150
Jul Aug Sep Oct Nov Dec Jan Feb Mar Apr May Jun
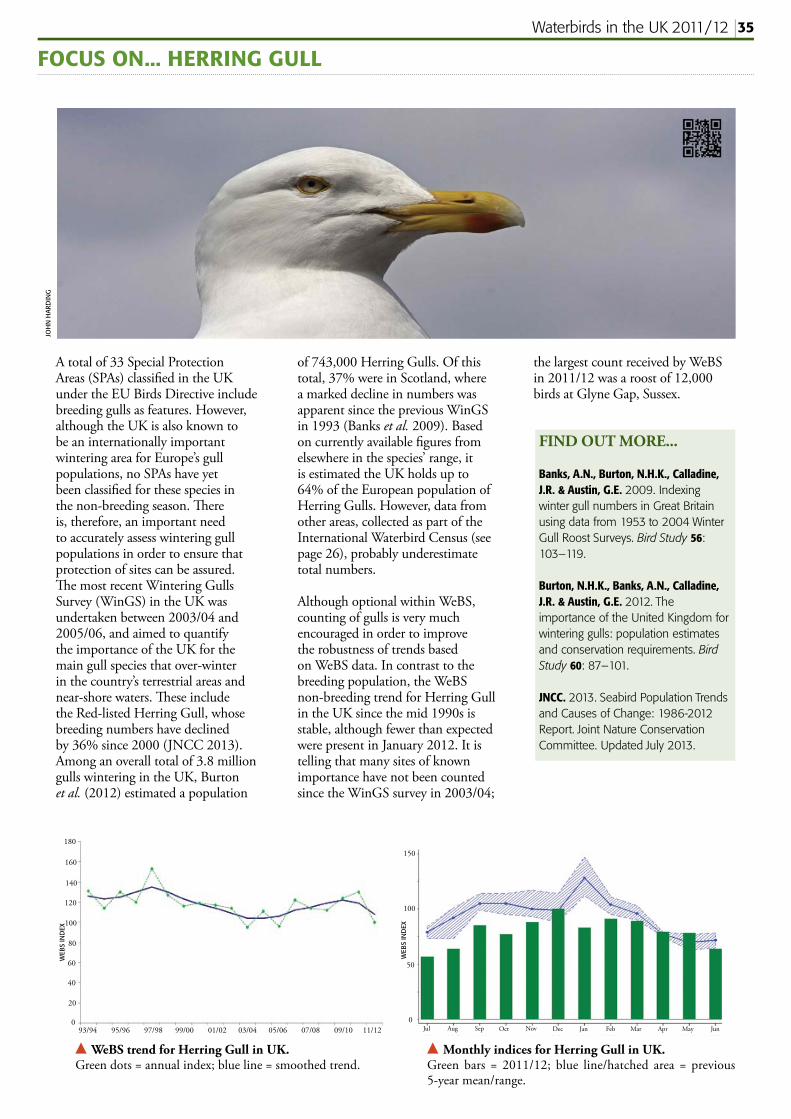
Waterbirds in the UK 2011/12 35
FOCUS ON... HERRING GULL JO
HN
HAR
DIN
G
A total of 33 Special Protection Areas (SPAs) classifi ed in the UK under the EU Birds Directive include breeding gulls as features. However, although the UK is also known to be an internationally important wintering area for Europe’s gull populations, no SPAs have yet been classifi ed for these species in the non-breeding season. Th ere is, therefore, an important need to accurately assess wintering gull populations in order to ensure that protection of sites can be assured. Th e most recent Wintering Gulls Survey (WinGS) in the UK was undertaken between 2003/04 and 2005/06, and aimed to quantify the importance of the UK for the main gull species that over-winter in the country’s terrestrial areas and near-shore waters. Th ese include the Red-listed Herring Gull, whose breeding numbers have declined by 36% since 2000 (JNCC 2013). Among an overall total of 3.8 million gulls wintering in the UK, Burton et al. (2012) estimated a population
of 743,000 Herring Gulls. Of this total, 37% were in Scotland, where a marked decline in numbers was apparent since the previous WinGS in 1993 (Banks et al. 2009). Based on currently available fi gures from elsewhere in the species’ range, it is estimated the UK holds up to 64% of the European population of Herring Gulls. However, data from other areas, collected as part of the International Waterbird Census (see page 26), probably underestimate total numbers.
Although optional within WeBS, counting of gulls is very much encouraged in order to improve the robustness of trends based on WeBS data. In contrast to the breeding population, the WeBS non-breeding trend for Herring Gull in the UK since the mid 1990s is stable, although fewer than expected were present in January 2012. It is telling that many sites of known importance have not been counted since the WinGS survey in 2003/04;
the largest count received by WeBS in 2011/12 was a roost of 12,000 birds at Glyne Gap, Sussex.
FIND OUT MORE...
Banks, A.N., Burton, N.H.K., Calladine, J.R. & Austin, G.E. 2009. Indexing winter gull numbers in Great Britain using data from 1953 to 2004 Winter Gull Roost Surveys. Bird Study 56: 103–119.
Burton, N.H.K., Banks, A.N., Calladine, J.R. & Austin, G.E. 2012. The importance of the United Kingdom for wintering gulls: population estimates and conservation requirements. Bird Study 60: 87–101.
JNCC. 2013. Seabird Population Trends and Causes of Change: 1986-2012 Report. Joint Nature Conservation Committee. Updated July 2013.
WeBS trend for Herring Gull in UK. Green dots = annual index; blue line = smoothed trend.
Monthly indices for Herring Gull in UK. Green bars = 2011/12; blue line/hatched area = previous 5-year mean/range.
WEB
S IN
DEX
WEB
S IN
DEX
Jul Aug Sep Oct Nov Dec Jan Feb Mar Apr May Jun0
50
100
150
93/94 95/96 97/98 99/00 01/02 03/04 05/06 07/08 09/10 11/12
20
40
60
80
100
0
120
140
160
180

Waterbirds in the UK 2011/1236
LOW TIDE COUNTS - REVIEW
UK Low Tide Counts 2011/12Nineteen UK estuaries were counted at low tide generating important data about feeding areas
Th e WeBS Low Tide Count Scheme facilitates the collection of important information on the use of the UK’s estuaries by waterbirds at low tide. Th e scheme has fl ourished since its inception in the winter of 1992/93, with all the major estuaries in the UK having been counted at least once. Th e scheme aims to principally monitor, assess and regularly update information on the relative importance of inter-tidal feeding areas of UK estuaries for wintering waterbirds, and in doing so complements information gathered through the WeBS Core Counts. Information collected during low tide represent an important contribution to the conservation of waterbirds, by providing supporting information for the establishment and management of UK Ramsar Sites and Special Protection Areas,
other site designations, and whole estuary conservation plans.
LOW TIDE COUNT METHODSOn most estuaries, numbers of waterbirds feeding on predefi ned sectors of inter-tidal habitat are counted. WeBS aims to count most individual estuaries at low tide once every six years, although on some sites more frequent counts are undertaken. Coordinated counts of waterbirds are made each month from November to February inclusive in the period two hours either side of low tide. Each counted sector is divided into a maximum of three distinct habitat components: inter-tidal, sub-tidal, and non-tidal. Species data are then divided among these habitats depending on the usual habitat preferences of the species
concerned. Presentation of WeBS low tide information typically takes two forms: (i) tabulated statistics of peak numbers and mean densities of each species, and (ii) dot density maps to give a visual representation of species’ foraging densities across a site. Individual dots do not represent the precise positions of individual birds; dots are assigned to habitat components proportionally and randomly placed within those areas. No information about distribution of birds at a fi ner scale than the count sector level should be inferred from the dot density map. For all maps presented here, one dot is equivalent to one bird; the size of individual dots has no relevance other than for clarity.
2011/12 COVERAGEDuring the winter of 2011/12, WeBS Low Tide Counts were carried out at 18 estuaries. Th ese included the Humber, Blackwater and Swale, which were counted for the fi rst time since 2003/04, 2005/06 and 2001/02 respectively, and the Glaslyn Estuary (Traeth Bach) which was counted for the fi rst time under the WeBS Low Tide Count scheme. Results from the counts at Strangford Lough and Humber Estuary are presented on pages 38-39 and 40-41, respectively.
Further information about WeBS Low Tide Counts, including data summaries and distribution maps for combinations of diff erent estuaries and species, are available online via www.bto.org/webs-reporting-lowtide. In the future, this Low Tide Count information will be available interactively site-by-site through the WeBS reporting interface.
Th e Orwell Estuary in Suff olk was counted at low tide in 2011/12
AND
Y M
USG
ROVE
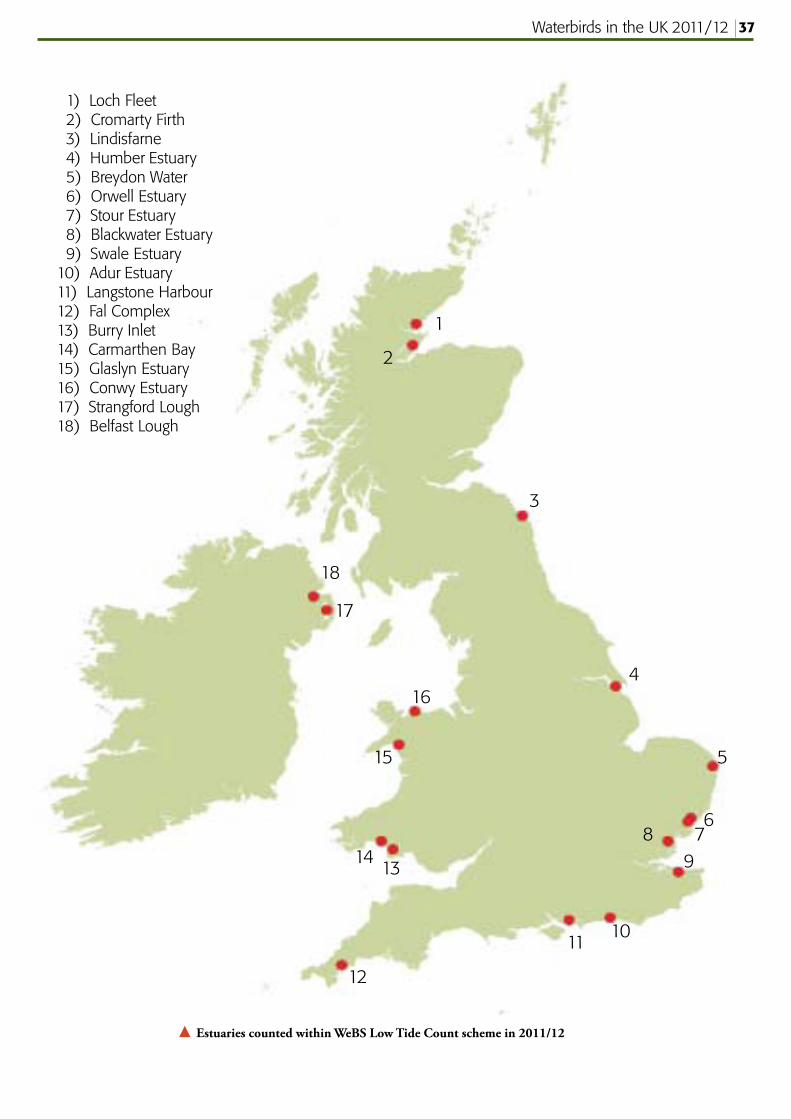
Waterbirds in the UK 2011/12 37
1) Loch Fleet 2) Cromarty Firth 3) Lindisfarne 4) Humber Estuary 5) Breydon Water 6) Orwell Estuary 7) Stour Estuary 8) Blackwater Estuary 9) Swale Estuary10) Adur Estuary 11) Langstone Harbour 12) Fal Complex13) Burry Inlet14) Carmarthen Bay 15) Glaslyn Estuary 16) Conwy Estuary17) Strangford Lough18) Belfast Lough
1
2
3
4
5
678
9
1011
12
1314
15
16
17
18
Estuaries counted within WeBS Low Tide Count scheme in 2011/12
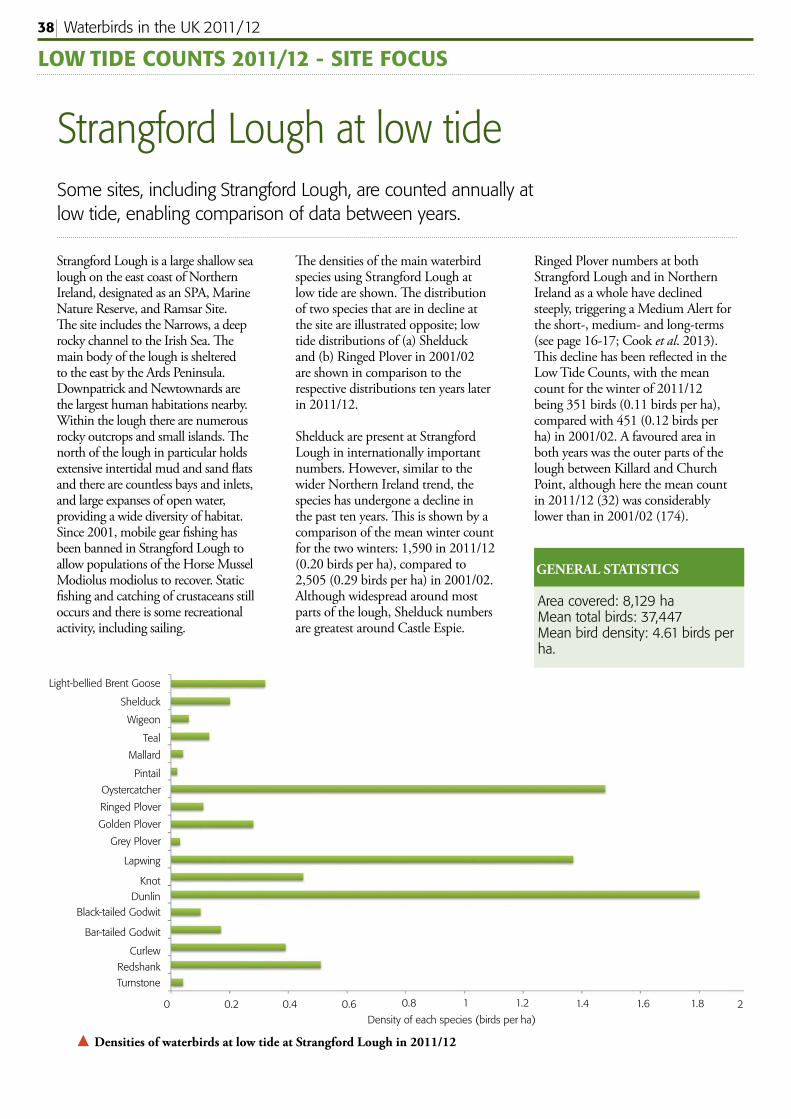
Waterbirds in the UK 2011/1238
Light-bellied Brent Goose
Shelduck
Wigeon
Teal
Mallard
Pintail
Oystercatcher
Ringed Plover
Golden Plover
Grey Plover
Lapwing
KnotDunlin
Black-tailed Godwit
Bar-tailed Godwit
Curlew
Redshank
Turnstone
0 0.2 0.4 0.6 0.8 1 2Density of each species (birds per ha)
1.2 1.4 1.6 1.8
LOW TIDE COUNTS 2011/12 - SITE FOCUS
Strangford Lough at low tideSome sites, including Strangford Lough, are counted annually at low tide, enabling comparison of data between years.
Th e densities of the main waterbird species using Strangford Lough at low tide are shown. Th e distribution of two species that are in decline at the site are illustrated opposite; low tide distributions of (a) Shelduck and (b) Ringed Plover in 2001/02 are shown in comparison to the respective distributions ten years later in 2011/12.
Shelduck are present at Strangford Lough in internationally important numbers. However, similar to the wider Northern Ireland trend, the species has undergone a decline in the past ten years. Th is is shown by a comparison of the mean winter count for the two winters: 1,590 in 2011/12 (0.20 birds per ha), compared to 2,505 (0.29 birds per ha) in 2001/02. Although widespread around most parts of the lough, Shelduck numbers are greatest around Castle Espie.
Ringed Plover numbers at both Strangford Lough and in Northern Ireland as a whole have declined steeply, triggering a Medium Alert for the short-, medium- and long-terms (see page 16-17; Cook et al. 2013). Th is decline has been refl ected in the Low Tide Counts, with the mean count for the winter of 2011/12 being 351 birds (0.11 birds per ha), compared with 451 ( 0.12 birds per ha) in 2001/02. A favoured area in both years was the outer parts of the lough between Killard and Church Point, although here the mean count in 2011/12 (32) was considerably lower than in 2001/02 (174).
Strangford Lough is a large shallow sea lough on the east coast of Northern Ireland, designated as an SPA, Marine Nature Reserve, and Ramsar Site. Th e site includes the Narrows, a deep rocky channel to the Irish Sea. Th e main body of the lough is sheltered to the east by the Ards Peninsula. Downpatrick and Newtownards are the largest human habitations nearby. Within the lough there are numerous rocky outcrops and small islands. Th e north of the lough in particular holds extensive intertidal mud and sand fl ats and there are countless bays and inlets, and large expanses of open water, providing a wide diversity of habitat. Since 2001, mobile gear fi shing has been banned in Strangford Lough to allow populations of the Horse Mussel Modiolus modiolus to recover. Static fi shing and catching of crustaceans still occurs and there is some recreational activity, including sailing.
Densities of waterbirds at low tide at Strangford Lough in 2011/12
Area covered: 8,129 haMean total birds: 37,447 Mean bird density: 4.61 birds per ha.
GENERAL STATISTICS
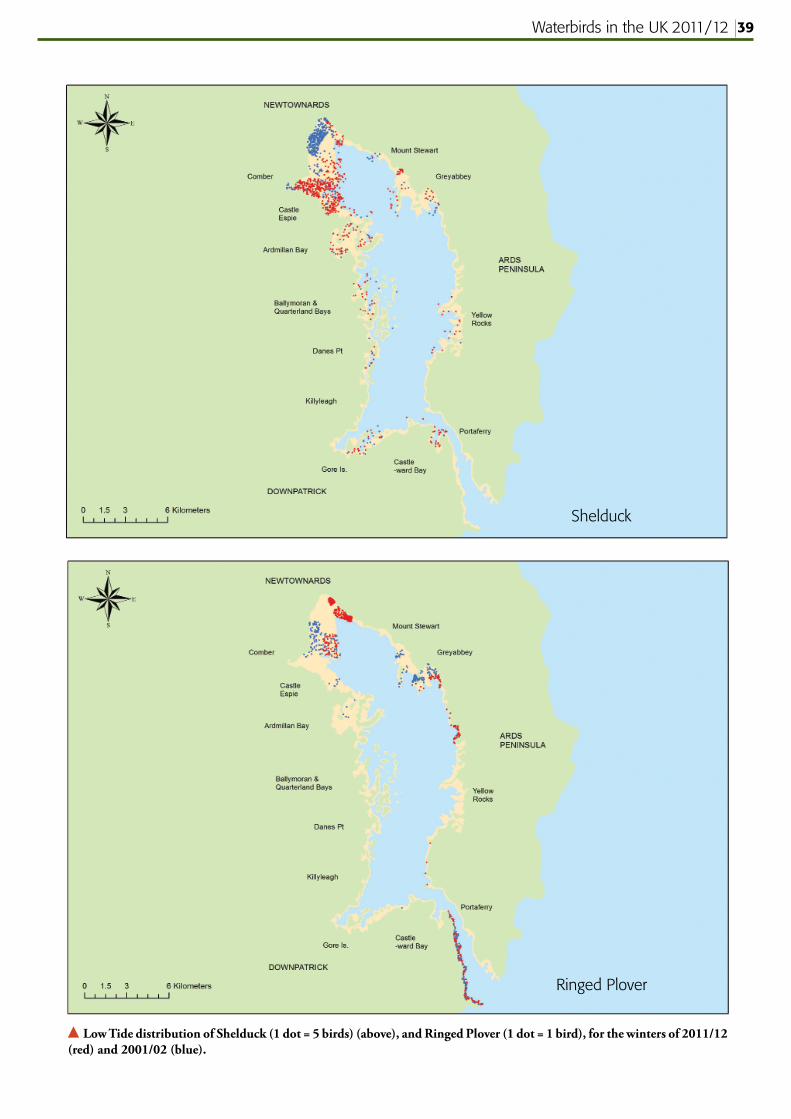
Waterbirds in the UK 2011/12 39
Low Tide distribution of Shelduck (1 dot = 5 birds) (above), and Ringed Plover (1 dot = 1 bird), for the winters of 2011/12 (red) and 2001/02 (blue).
Shelduck
Ringed Plover
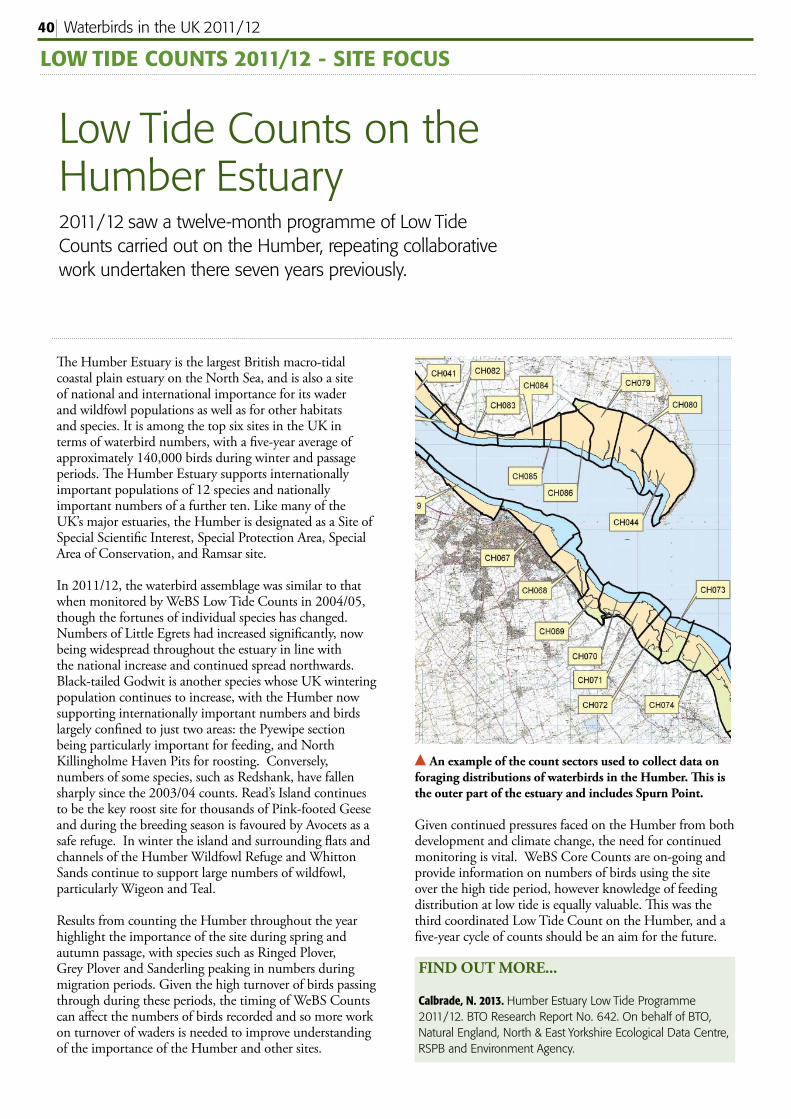
Waterbirds in the UK 2011/1240
Low Tide Counts on the Humber Estuary
LOW TIDE COUNTS 2011/12 - SITE FOCUS
Th e Humber Estuary is the largest British macro-tidal coastal plain estuary on the North Sea, and is also a site of national and international importance for its wader and wildfowl populations as well as for other habitats and species. It is among the top six sites in the UK in terms of waterbird numbers, with a fi ve-year average of approximately 140,000 birds during winter and passage periods. Th e Humber Estuary supports internationally important populations of 12 species and nationally important numbers of a further ten. Like many of the UK’s major estuaries, the Humber is designated as a Site of Special Scientifi c Interest, Special Protection Area, Special Area of Conservation, and Ramsar site.
In 2011/12, the waterbird assemblage was similar to that when monitored by WeBS Low Tide Counts in 2004/05, though the fortunes of individual species has changed. Numbers of Little Egrets had increased signifi cantly, now being widespread throughout the estuary in line with the national increase and continued spread northwards. Black-tailed Godwit is another species whose UK wintering population continues to increase, with the Humber now supporting internationally important numbers and birds largely confi ned to just two areas: the Pyewipe section being particularly important for feeding, and North Killingholme Haven Pits for roosting. Conversely, numbers of some species, such as Redshank, have fallen sharply since the 2003/04 counts. Read’s Island continues to be the key roost site for thousands of Pink-footed Geese and during the breeding season is favoured by Avocets as a safe refuge. In winter the island and surrounding fl ats and channels of the Humber Wildfowl Refuge and Whitton Sands continue to support large numbers of wildfowl, particularly Wigeon and Teal.
Results from counting the Humber throughout the year highlight the importance of the site during spring and autumn passage, with species such as Ringed Plover, Grey Plover and Sanderling peaking in numbers during migration periods. Given the high turnover of birds passing through during these periods, the timing of WeBS Counts can aff ect the numbers of birds recorded and so more work on turnover of waders is needed to improve understanding of the importance of the Humber and other sites.
FIND OUT MORE...
Calbrade, N. 2013. Humber Estuary Low Tide Programme 2011/12. BTO Research Report No. 642. On behalf of BTO, Natural England, North & East Yorkshire Ecological Data Centre, RSPB and Environment Agency.
2011/12 saw a twelve-month programme of Low Tide Counts carried out on the Humber, repeating collaborative work undertaken there seven years previously.
An example of the count sectors used to collect data on foraging distributions of waterbirds in the Humber. Th is is the outer part of the estuary and includes Spurn Point.
Given continued pressures faced on the Humber from both development and climate change, the need for continued monitoring is vital. WeBS Core Counts are on-going and provide information on numbers of birds using the site over the high tide period, however knowledge of feeding distribution at low tide is equally valuable. Th is was the third coordinated Low Tide Count on the Humber, and a fi ve-year cycle of counts should be an aim for the future.
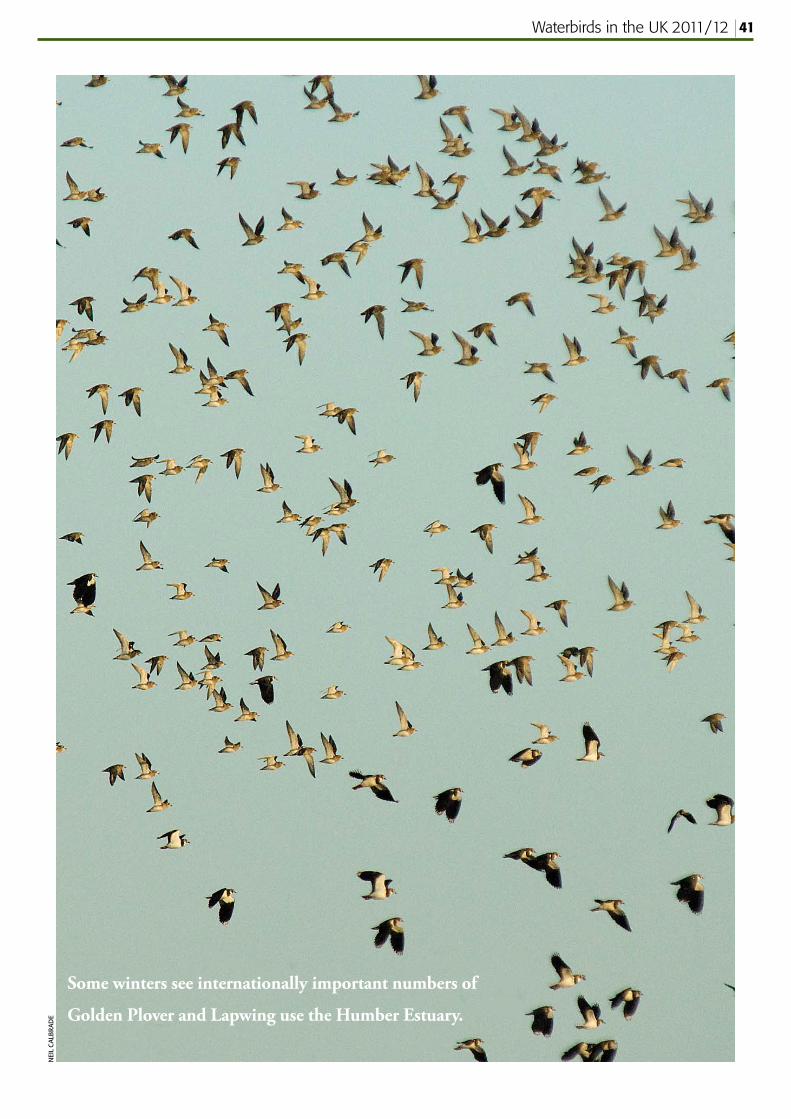
Waterbirds in the UK 2011/12 41N
EIL
CAL
BR
ADE
Some winters see internationally important numbers of
Golden Plover and Lapwing use the Humber Estuary.

Waterbirds in the UK 2011/1242
WEBS DATA REQUESTS 221WeBS Data Requests in 2011/12Uses of WeBS data 2011/12
WeBS DATA REQUESTS
More information about the WeBS Data Request Service is available at www.bto.org/webs/data where you can see coverage by WeBS of different sites, check data request charges, and view examples of data that can be provided.
With the UK host to internationally important numbers of over-wintering waterbirds, one of the principal aims of WeBS is to provide data to facilitate their conservation. Indeed, there have been many high-profi le examples over the years in which WeBS data have proved to be fundamental in securing the protection of important wetland sites.
A summary of site-based WeBS information is presented on the online interface, but fi ner level data (both spatial and temporal) are available in a user-friendly format through a bespoke WeBS Data Request. Any WeBS based information that is to be incorporated into site evaluation work, such as Environmental Impact Assessments (EIAs), should be sourced through a WeBS Data Request.
Th e graph shows the number of Data Requests processed by the WeBS offi ce each year since 2005/06. Th ese are from a range of stakeholder groups, including country conservation agencies, environmental consultancies, academic researchers and bird clubs. Summarised WeBS data are also provided to several online environmental data portals. January WeBS data are supplied to Wetlands
International for use inclusion in the International Waterbird Census (IWC), and summaries are used in IWC outputs such as National Totals lists and the Critical Sites Network Tool.
Th e WeBS Partnership is keen to encourage WeBS data use within environmental research. A variety of scientifi c papers and reports that have used WeBS data in recent years are referenced within the pages of this annual report, and there is of course an extensive suite of other research
WeBS Data Requests 2005/06 to 2011/12
250
200
150
100
50
0
Num
ber o
f req
uest
s
2005/06 2006/07 2009/10 2010/11 2011/12
Commercial Counter/Research/EducationWeBS Partner
2007/08 2008/09
questions relating to waterbird ecology and wider wetland management issues to which WeBS data would lend themselves, at national and international scales. Academic researchers, prospective students and potential collaborators can email the WeBS Secretariat at [email protected].
Waterbirds in the UK 2011/12 43
Further reading Recent studies that have used WeBS data and not referenced elsewhere in this reportBaillie, S.R., Marchant, J.H., Leech, D.I., Massimino, D., Eglington, S.M., Johnston, A., Noble, D.G., Barimore, C., Kew, A.J., Downie, I.S., Risely, K. & Robinson, R.A. 2013. BirdTrends 2012: trends in numbers, breeding success and survival for UK breeding birds. BTO Research Report 644. BTO, Thetford. (www.bto.org/birdtrends).
Balmer, D.E., Gillings, S., Caffrey, B.J., Swann, R.L., Downie, I.S. & Fuller, R.J. 2013. Bird Atlas 2007-11: the breeding and wintering birds of Britain and Ireland. British Trust for Ornithology, BTO Books, Thetford.
Chamberlain, D.E., Austin, G.E., Green, R.E., Hulme, M.F. & Burton, N.H.K. 2013. Improved estimates of population trends of Cormorant Phalacrocorax carbo in England and Wales for effective management of a protected species at the centre of a human-wildlife confl ict. Bird Study 60: 335-344.
Chamberlain, D.E., Austin, G.E., Newson, S.E., Johnston, A.J. & Burton, N.H.K. 2013. Licensed control does not reduce local Cor-morant Phalacrocorax carbo population size in winter. Journal of Ornithology 154: 739–750.
Dalby, L., Fox, A.D., Petersen, I.K., Delany, S. & Svenning, J-C. 2013. Temperature does not dictate the wintering distributions of European dabbling duck species. Ibis 155: 80–88.
Eaton, M.A., Balmer, D.E., Bright, J., Cuthbert, R., Grice, P.V., Hall, C., Hayhow, D.B., Hearn, R.D., Holt, C.A., Knipe, A., Mavor, R., Noble, D.G., Oppel, S., Risely, K., Stroud, D.A. & Wotton, S. 2013. The state of the UK’s birds 2013. RSPB, BTO, WWT, NRW, JNCC, NE, NIEA and SNH, Sandy, Bedfordshire. (www.bto.org/sites/default/fi les/u16/downloads/SUKB/State_UK_Birds_2013.pdf).
Hall, C., Reed, J., Boland, H., Einarsson, O., Holt, C., McElwaine, G., Spray, C. & Rees, E. 2012. Population size and breeding success of Icelandic Whooper Swans: results of the 2010 international census. Wildfowl 62: 73–96.
Harvey, P.V. & Heubeck, M. 2012. Changes in the wintering popu-lation and distribution of Slavonian Grebes in Shetland. British Birds 105: 704-715.
Holt, C.A., Austin, G.E., Calbrade, N.A., Mellan, H.J., Hearn, R.D., Stroud, D.A., Wotton, S.R. & Musgrove, A.J. 2012. Waterbirds in the UK 2010/11: The Wetland Bird Survey. BTO/RSPB/JNCC. BTO, Thetford.
Mendez, V., Gill, J.A., Burton, N.H.K., Austin, G.E., Petchey, O.L. & Davies, R.G. 2012. Functional diversity across space and time: trends in wader communities on British estuaries. Diversity and Distributions 18: 356–365.
Mitchell, C., Hearn, R. & Stroud, D. 2012.The merging of popula-tions of Greylag Geese breeding in Britain. British Birds 105: 498-505.
Musgrove, A.J., Aebischer, N.J., Eaton, M.A., Hearn, R.D., Newson, S.E., Noble, D.G., Parsons, M., Risely, K. & Stroud, D.A. 2013. Population estimates of birds in Great Britain and the United Kingdom. British Birds 106: 64–100.
Musgrove, A.J., Austin, G.E., Hearn, R.D., Holt, C.A., Stroud, D.A. & Wotton, S.R. 2013. Population estimates of British non-breeding waterbirds. British Birds 104: 364–397.
WALESAnglesey Ian SimsBreconshire Andrew KingBurry Inlet Alastair FlannaganCaernarfonshire Rhion PritchardCaernarfonshire (Foryd Bay) Simon Hugheston-RobertsCardigan (incl Dyfi Estuary) Dick Squires (now Russell Jones) Carmarthenshire Ian Hainsworth (now Terry Wells)Clwyd (coastal) VACANTClwyd (inland) VACANTEast Glamorgan Daniel Jenkins-JonesGwent (excl Severn Estuary) Chris Jones (now Al Venables)Merioneth (estuaries) Jim DustowMerioneth (other sites) Trefor OwenMontgomeryshire Jane KelsallPembrokeshire Annie HaycockRadnorshire Peter JenningsSevern Estuary (Wales) Niall Burton (now Al Venables)West Glamorgan Alastair Flannagan
NORTHERN IRELANDAntrim (Larne Lough) Doreen HilditchAntrim (other sites) VACANTArmargh (excl Loughs Neagh and Beg)
VACANT
Belfast Lough Shane WolseyDown (Carlingford Lough) VACANTDown (Dundrum Bay) Malachy Martin (now Patrick Lynch)Down (other sites) VACANTDown (Outer Ards) NIEADown (South Down Coast) VACANTDown (Strangford Lough) Kerry MackieFermanagh VACANTLondonderry (Bann Estuary) Hill DickLondonderry (Lough Foyle) Matthew TicknerLondonderry (other sites) VACANTLoughs Neagh and Beg NIEATyrone (excl Loughs Neagh and Beg)
VACANT
CHANNEL ISLANDSAlderney Alderney Wildlife Trust EcologistChannel Islands (inland) Glyn YoungGuernsey Coast Mary SimmonsJersey Coast Roger Noel
ISLE OF MAN
Isle of Man Pat Cullen
We would be grateful for help organising WeBS in areas currently without a Local Organiser (marked VACANT). If you live in one of these areas and would be interested in taking on the role, please let us know. Email: [email protected]
In 2011/12, the WeBS Local Organiser Advisory Committee (WeBS LOAC) was comprised of John Armitage, Neil Bielby, Gladys Grant, Andrew King, Ian Lees, Nick Mason, Dave Shackleton and Shane Wolsey. Thanks to them for representing the wider LO network. Information about the WeBS LOAC can be found at www.bto.org/webs/loac
Continued from back page
WeBS Local Organisers in 2011/12
Further information, including site tables and trends for all the regular WeBS species, is available in the online report at www.bto.org/webs-reporting.
WeBS ONLINE REPORT
We wish to thank all surveyors and Local Organisers for making WeBS the success it is today. Unfortunately space does not permit all observers to be acknowledged individually, but we would especially like to credit the LOs for their efforts.
SPECIAL THANKS
British Trust for OrnithologyThe NunneryThetfordNorfolkIP24 2PU
01842 [email protected]/webs
WeBS Local Organisers in 2011/12
ISBN 978-1-908581-32-7ISBN 978-1-908581-32-7
ENGLANDAvon (excl Severn Estuary) Keith Fox (now Rupert Higgins)Bedfordshire Richard BashfordBerkshire Ken WhiteBuckinghamshire Roger WarrenCambridgeshire (incl Huntingdonshire)
Bruce Martin
Cambridgeshire (Nene Washes) Charlie KitchinCambridgeshire (Ouse Washes) Paul HarringtonCheshire (North) Vacant (now Kane Brides)Cheshire (South) David CooksonCleveland (excl Tees Estuary) Chris SharpeCleveland (Tees Estuary) Mike LeakeyCornwall (excl Tamar Complex) Ilya Maclean (now Pete
Roseveare)Cornwall (Tamar Complex) Gladys GrantCotswold Water Park Gareth HarrisCumbria (Duddon Estuary) Colin GayCumbria (excl estuaries) Dave ShackletonCumbria (Irt/Mite/Esk Estuary) Peter JonesDee Estuary Colin WellsDerbyshire Vacant (now Peter Gibbon)Devon (other sites) Pete ReayDevon (Taw/Torridge Estuary) Terry Chaplin (now Pete Reay)Dorset (excl estuaries) John JonesDorset (Poole Harbour) Paul MortonDorset (Radipole and Lodmoor) Nick Tomlinson (now Toby
Branston)Dorset (The Fleet and Portland Harbour)
Steve Groves
Durham VACANTEssex (Crouch/Roach Estuaries and South Dengie)
Peter Mason
Essex (Hamford Water) Julian NovorolEssex (North Blackwater) John ThorogoodEssex (other sites) VACANTEssex (South Blackwater and North Dengie)
Anthony Harbott
Gloucestershire Michael SmartGreater London (excl Thames Estuary)
Helen Baker
Greater Manchester Adrian Dancy (now Jamie Dunning)
Hampshire (Avon Valley) John ClarkHampshire (estuaries/coastal) John ShillitoeHampshire (excl Avon Valley) Keith WillsHerefordshire Chris RobinsonHertfordshire Jim TerryHumber Estuary (inner South) Keith ParkerHumber Estuary (mid South) Harriet Billanie (now Richard
Barnard)Humber Estuary (North) Nick CuttsHumber Estuary (outer South) John WalkerIsle of Wight Jim BaldwinKent (Dungeness area) David WalkerKent (East) Ken LodgeKent (North Kent estuaries) The late Gordon Allison (now
Geoff Orton)Kent (Pegwell Bay) Pete FindleyKent (West) VACANTLancashire (East Lancs and Fylde) Vacant (now Heather Hilton)Lancashire (North inland) Peter MarshLancashire (Ribble Estuary) Ken AbramLancashire (River Lune) Jean RobertsLancashire (West inland) Tom ClareLee Valley Cath PatrickLeicestershire and Rutland (excl Rutland Water)
Brian Moore
Leicestershire and Rutland (Rutland Water)
Tim Appleton
Lincolnshire (North inland) Chris GunnLincolnshire (South inland) Bob TitmanMerseyside (Alt Estuary) Steve WhiteMerseyside (inland) Steve Birch (now VACANT)Merseyside (Mersey Estuary) Graham Thomason (now
Dermot Smith)Morecambe Bay (North) Clive HartleyMorecambe Bay (South) Jean RobertsNorfolk (Breydon Water) Jim RoweNorfolk (excl estuaries) Tim StrudwickNorfolk (North Nofolk Coast) Michael RooneyNorthamptonshire Jim Williams (now VACANT)Northumberland (coastal) Daniel TurnerNorthumberland (inland) Steve HollidayNorthumberland (Lindisfarne) Andrew CraggsNottinghamshire Gary Hobson (now David
Parkin)Oxfordshire (North) Sandra Bletchly
Oxfordshire (South) Ian LeesSevern Estuary (England) Harvey RoseShropshire Michael WallaceSolway Estuary (inner South) Norman HoltonSolway Estuary (outer South) Dave ShackletonSomerset (other sites) Keith Fox (now Eve Tigwell)Somerset (Somerset Levels) Steve MeenStaffordshire Steve TurnerSuffolk (Alde Complex) Ian CastleSuffolk (Alton Water) John GlazebrookSuffolk (Blyth Estuary) Adam BurrowsSuffolk (Deben Estuary) Nick MasonSuffolk (Orwell Estuary) Mick WrightSuffolk (other sites) Alan MillerSuffolk (Stour Estuary) Rick VonkSurrey Penny WilliamsSussex (Chichester Harbour) Edward RowsellSussex (other sites) Richard BownThames Estuary (Foulness) Chris LewisThe Wash Jim ScottWarwickshire Matthew Griffi thsWest Midlands Nick LewisWiltshire Julian RollsWorcestershire Andrew WarrYorkshire (East and Scarborough) Shirley Pashby (now Jim
Morgan)Yorkshire (Harrogate and Yorkshire Dales)
Bill Haines
Yorkshire (Huddersfi eld/Halifax area)
VACANT
Yorkshire (Leeds area) Paul MorrisYorkshire (South) VACANTYorkshire (Wakefi eld area) Peter Smith
SCOTLANDAberdeenshire Rob MinshullAngus (excl Montrose Basin) Bruce Lynch (now VACANT)Angus (Montrose Basin) Anna CheshierArgyll Mainland Paul DawArran Jim CasselsAyrshire Dave GrantBadenoch and Strathspey Keith DuncanBorders Andrew BramhallBute Ian HopkinsCaithness The late Stan Laybourne (now
Sinclair Manson)Central (excl Forth Estuary) Neil BielbyClyde Estuary John ClarkDumfries and Galloway (Auchencairn and Orchardtown Bays)
Euan MacAlpine
Dumfries and Galloway (Fleet Bay) David HawkerDumfries and Galloway (Loch Ryan) Geoff Sheppard (now Paul
Collin)Dumfries and Galloway (other sites) Andy RichesDumfries and Galloway (Rough Firth)
Judy Baxter
Dumfries and Galloway (Wigtown Bay)
Paul Collin
Fife (excl estuaries) Allan BrownFife (Tay and Eden Estuaries) Norman ElkinsForth Estuary (inner) Michael BellForth Estuary (outer North) Alastair InglisForth (outer South) Duncan PriddleGlasgow/Renfrewshire/Lanarkshire John ClarkHarris and Lewis Vacant (now Yvonne Benting)Islay, Jura and Colonsay John ArmitageIsle of Cumbrae VACANTLochaber John DyeLothian (excl estuaries) Joan Wilcox (now Allan Brown)Lothian (Tyninghame Estuary) Bobby AndersonMoray and Nairn (inland) David LawMoray and Nairn (Lossie Estuary) Bob ProctorMoray Basin Coast Bob SwannMull Paul DawOrkney Eric MeekPerth and Kinross (excl Loch Leven) Michael BellPerth and Kinross (Loch Leven) Jeremy SquireShetland Paul HarveySkye and Lochalsh Robert MacmillanSolway Estuary (North) Andy RichesSutherland (excl Moray Basin) VACANTTiree and Coll John BowlerUists and Benbecula Yvonne BentingWest Inverness/Wester Ross VACANT
in associationwith