water treatment - micro and ultra filtration
DESCRIPTION
Water Treatment - Micro and Ultra FiltrationTRANSCRIPT

dissolved substances
water
colloïds
concentrate
membrane
permeate
Micro- and ultrafiltration
WATER TREATM
ENT
WATER TREATMENT
12
surface water drinking water
pre-treatment filtration
2. ultrafiltration of surface water
- ultrafiltration as a barrier for bacils and viruses
- change of filter phases
- adaptation of treatment neccesary
1. ultrafiltration of drinking water
- ultrafiltration as a barrier for bacils and viruses
- already a high quality of the raw water before ultrafiltration
- high flux ultrafiltration possible

FrameworkThis module explains micro- and ultrafiltration.
ContentsThis module has the following contents:
1. Introduction 2. Principle 2.1 Membrane material 2.2 Membrane module 2.3 Dead-end filtration mode 2.4 Inside-out filtration3 Theory 3.1 Mass balance 3.2 Kinetics 3.3 Membrane fouling 3.4 Cleaning4 Practice 4.1 Module design 4.2 Choosing a module design5 Operation 5.1 Constant pressure or constant flux mode 5.2 Cross-flow filtration 5.3 Fouling prevention
174
micro- and ultrafiltration water treatment

1 Introduction
Membrane filtration is a treatment process based on the physical separation of compounds from the water phase with the use of a semi-permeable membrane. Until recently membrane filtration was regarded as a futuristic, expensive and complica-ted treatment process. Because of the develop-ment of the technique during the past years, the process can be regarded as proven technology.The quality of the permeate of a membrane filtra-tion installation is excellent.The costs of membrane filtration have strongly decreased over the past ten years because of the decreased costs of membrane elements.
Membrane filtration can be divided into two catego-ries based on the pore sizes of the membrane:- micro- and ultrafiltration (MF and UF) remove
colloidal substances and microorganisms- nanofiltration and reverse osmosis (NF and
RO) remove colloidal substances and microor-ganisms but also dissolved substances like micropollutants and ions.
Micro- and ultrafiltration remove substances from the water phase by a sieve mechanism.
In Figure 1 an overview is given of the different fil-tration processes and the sizes of the compounds removed. Also, an indication of the applied pres-sure needed for the filtration process is given.
Microfiltration removes bacteria and the larger viruses (down to a size of 0.05 µm). Ultrafiltration also removes bacteria, but because of the smaller pore size all the larger viruses are removed. Also, all the colloidal particles are removed by UF as long as the membrane is not damaged. The removal of suspended solids (measured as a percentage of the feed concentration) of MF and UF is at least 99%.
The removal of microorganisms is referred to in log units. A removal of one log unit corresponds to a 90% removal. The removal of 4 log units cor-responds to a 99.99% removal. In Table 1 the log removal capacity of MF and UF is shown for different microorganisms.
The so-called molecular weight cut-off (MWCO) can also be used as an indication of the ability of membranes to reject compounds. MWCO is defined as the molecular weight of spherical mol-
Figure 1 - Overview of different filtration processes and sizes of compounds removed
approximatemolecularweight
relativesize ofmaterialsin water
treatment
size, µm0.001 0.01 0.1 1.0 10 100 1,000
100 200 1000 10,000 20,000 100,000 500,000
viruses bacils
dissolved salts algae
metal ions humic acids cysten sand
clay
ED and EDR
reverse osmosis
nanofiltration
ultrafiltrationmicrofiltration
conventional filtration processes
metal ionsarsenicnitratenitritecyanide
dissolved saltscalcium saltssulfate saltsmagnesium saltsaluminum salts
virusescontagious
hepatitis
humic acidstrihalomethane
precursors
bacilssalmonellashigellavibrio cholerae
cystenprotozoagiardiacryptosporidium
silt∆P (bar)
0.01
0.05
0.1
5
30
175
water treatment micro- and ultrafiltration

ecules which are 90% rejected by the membrane’s pores. The unit of MWCO is Dalton (1 Dalton is the mass of one hydrogen atom = 1.66x10⁻²⁷kg). The MWCO for MF/UF is in the range of 10,000 to 500,000 Dalton (10 to 500 kD).
MF/UF for drinking waterIn drinking water treatment, UF can be used in different stages of the process:- as a pre-treatment of surface water before infil-
tration in the dunes or as pre-treatment before NF/RO filtration
- as treatment of backwash water from rapid sand filtration
- treatment of surface water as the first step in drinking water production.
Drinking water can be produced from surface water with either a direct or an indirect process. An indirect treatment is defined as a process dur-ing which the water spends a certain residence time in the sub-surface. The soil passage guar-antees the bacteriological quality of the produced drinking water. With direct treatment (no soil passage), the bac-teriological quality must be guaranteed by several disinfection steps in the treatment process.
With a direct as well as an indirect treatment of surface water, MF and UF can be used as the first step in the treatment process. The goal of the pre-treatment is to remove sus-
pended solids, heavy metals, bacteria and viruses in order to prevent pollution of the dunes, or to prevent clogging of the NF/RO membranes. In some cases, the MF/UF installation is preceded by a conventional coagulation/flocculation/floc removal treatment process in order to reduce the risk of membrane fouling. Because of the improved membranes and the improved possibilities of fouling control, only an inline coagulation in front of the membranes will remain in the future as a pre-treatment for MF/UF.
MF/UF for backwash waterIn groundwater, high concentrations of ions (Fe2+, Mn2+, NH4
+) are present as a result of the long residence time in the sub-surface. These ions have to be removed in order to produce drinking water.
Figure 2 - American advertising brochure for ultrafil-tration
Particle Particle size(µm)
Log-elimination MF (pore size 0.2 µm)
Log-elimination UF (pore size 0.01 µm)
Protozoa
- Giardia Lamblia 5-12 6 6
- Cryptosporidium Parvum 4-7 6 6
Bacteria
- E.coli 0.5 - 2 5 5
- Pseudomonas 0.5 - 1.5 5 5
Viruses
- Enterovirus 0.02 0 4
- MS2 - virus 0.025 0 4
Table 1 - Log-removal capacity of MF and UF for different microorganisms
176
micro- and ultrafiltration water treatment

The treatment steps used are aeration and rapid sand filtration. The backwash water of the rapid sand filters is loaded with high concentrations of iron hydroxide and biomass. The backwash water can be concentrated by ultrafiltration. The permeate of ultrafiltration can then be used directly as drinking water or it can be treated further in the existing groundwater treat-ment process. In this way a significant amount of valuable water is saved.
2 Principle
The membrane is the barrier responsible for the separation of compounds out of the water phase. The membrane is semi-permeable. The pore size determines the removal of different compounds. The removed compounds remain at the raw wa-terside of the membrane and accumulate on the membrane. Three water streams can be distinguished: - the dirty water or raw water is called feed
water- the water passing the membrane is called
the permeate or product water. This water is particle free
- the water with the rejected particles is called concentrate or retentate.
2.1 MembranematerialMost of the membranes used are synthetic mem-branes made of organic polymers (also called polymeric membranes). The thermal, chemical and mechanical proper-ties of the polymer determine the properties of the material. There are several techniques to produce mem-brane materials. The production of membranes, however, will not be discussed here.
2.2 MembranemoduleIf a membrane was produced as a single, flat hori-zontal plate, a very large area is needed for the water production resulting in very high investment costs. Therefore, membranes are purchased as
Figure 3 - Possibilities for the use of MF and UF for drinking water production
12
surface water drinking water
pre-treatment filtration
2. ultrafiltration of surface water
- ultrafiltration as a barrier for bacils and viruses
- change of filter phases
- adaptation of treatment neccesary
1. ultrafiltration of drinking water
- ultrafiltration as a barrier for bacils and viruses
- already a high quality of the raw water before ultrafiltration
- high flux ultrafiltration possible
dissolved substances
water
colloïds
concentrate
membrane
permeate
Figure 4 - Membrane and the different flows
177
water treatment micro- and ultrafiltration

compact modules with as much filtration area as possible.
Different module designs are possible. It is pos-sible to compare modules based on the specific surface of the modules.
The specific surface is defined as:
memspec
2module
A n d LA1V D4
× π× ×= =
× π×
in which:Aspec = specific surface areaAmem = membrane areaVmodule = volume module (m3)n = number of membranes in module (-)d = diameter of membrane (m)L = length of membrane (m)D = diameter of membrane module (m)
The aim of a good design is to create a large membrane area in a small volume. Most modules are cylindrical. The length of a cylinder varies from 1 to 6 meters. The diam-eter of the cylinder varies from 1 to 12 inches (1 inch=0.0254 m).
2.3 Dead-endfiltrationmodeIn dead-end filtration, all the feed water is through the membrane. The suspended solids remain
on the feed side of the membrane. As a conse-quence, the resistance of permeation will increase in time. The water flux decreases if the pressure is constant, or the pressure increases if the flux is constant.
Periodically the membrane has to be cleaned in order to reduce the resistance of permeation. To clean the membrane different methods are used, which are described further on. The period of permeation is called filtration time. A filtration run is the filtration time together with the cleaning time (also called filtration cycle).
2.4 Inside-outfiltrationIn a configuration with inside-out filtration, feed water enters the inside of the capillaries or tubular membranes. The water is pushed from the inside to the outside of the membrane. Permeate is col-lected outside the membrane and transported to the permeate tube.
3 Theory
3.1 MassbalanceFor dead-end filtration the following mass balance
Figure 5 - Membranes put together in modules Figure 6 - Principle of dead-end filtration modules
time
flux
resistance
permeateinlet
filtration
178
micro- and ultrafiltration water treatment

can be defined:
f pQ Q=
in which:Qf = feed flow (m3/h)Qp = permeate flow (m3/h) For a filtration run, the mass balance is:
f p bwQ Q Q= +
in which:Qbw = backwash flow (m3/h)
RecoveryThe recovery is the amount of permeate divided by the amount of feed water used. With dead-end filtration the recovery is, of course, 100% during the filtration time. All the feed water is recovered as permeate during this period. But for a filtration run (filtration and cleaning), the recovery is less than 100% because the perme-ate is used for backwashing the membranes.
The recovery is now defined as:
p bw
p
V VV
γ-
=
in which:γ = recovery (-)Vp = volume of produced permeate (m3)Vbw = volume used for backwash (m3)
In order to achieve a high recovery (>90%), the filtration period should be extended and the backwash should be carried out with a minimum amount of permeate.
3.2 KineticsThe most important process parameter in MF- and UF installations is flux. Flux is defined as the water flow through a square meter of membrane surface.
= =ν ⋅mem tot
Q TMPJ
A R
in which: J = flux (m3/(m2.s))Q = volume flow (m3/h)Amem = membrane surface area (m2)TMP = trans membrane pressure (Pa)ν = dynamic viscosity (Pa/s)Rtot = total resistance (m)
Water passes through the membrane under the influence of pressure. The pressure difference across the membrane is called Trans Membrane Pressure (TMP). The temperature of the water influences the flux at a certain TMP. Each degree of temperature (ºC) increase gives 3% more flux at the same pressure. When the temperature of the water changes (e.g., with surface water or wastewater), the flux has to be normalized by:
1,5ref
cor measured 1,5measured
(42.5 T )J J
(42.5 T )+
= ×+
Figure 7 - Principle of inside-out filtration
feed
permeate
179
water treatment micro- and ultrafiltration

in which:Jcor = flux corrected for temperature
(l/(m2.h))Jmeasured = flux measured at temperature T
(l/(m2.h))Tref = reference temperature (°C)Tmeasured = measured temperature (°C)
In order to compare fluxes of different installa-tions, the flux is also normalized for the applied pressure (TMP).
Because the flux is linear, depending on the pres-sure, the normalized flux is:
r efnorm cor
measured
PJ J
P= ×
in which:Jnorm = normalized flux (l/(m2.h))Pref = reference pressure (bar)Pmeasured = actual pressure (bar)
Trans membrane pressureThe trans membrane pressure (TMP) is the pres-sure difference between permeate and the feed
side of the membrane expressed in bar (Figure 8).
hydrf perm
PTMP P P
2∆
= − −
in which:Pf = feed pressure (Pa)Phydr = hydraulic pressure loss (Pa)Pperm = permeate pressure (Pa)
The hydraulic pressure loss in an ultrafiltration module is small and can be ignored. The permeate pressure needed to transport the permeate is rather small (0.1 bar). The pressure on the feed side of the MF/UF mem-brane is typically 0.5 bar.
3.3 MembranefoulingDuring filtration the resistance increases as a result of fouling of the membrane surface. The resis-tance increases because the pores in the mem-brane are blocked and because caked suspended matter is built up on the membrane surface. This resistance increase is referred to as fouling. The definition of fouling, given by the IUPAC, is: the deposition of suspended or dissolved substances on the membrane surface or in front of the pores or in the membrane pores. From this definition it is clear that fouling can be subdivided into different mechanisms. In Figure 9 different resistances are defined:- membrane resistance- pore blocking- adsorption in the pores- cake resistance- high concentration of dissolved substances
near the surface.
The sum of all resistances is the total resistance (Rtot). Due to the accumulation of solids on and in the membrane during dead-end filtration, the total resistance increases with time. If the Rtot-time relation is known, the flux of an installation can be calculated. Prediction and minimization of the total resistance is an important research topic.
Figure 8 - Pressure difference between permeate and feed size
Pperm
P f P c
0.25c
2c
c
ccfhydr
Re0.316λ
L vrd2
λ PPDP
− ⋅ =
⋅ ⋅ ⋅ = − =
permhydr
fpermcf P
2P
PP2
PPTMD − ∆
− = − + =
dead-end filtration
⋅
180
micro- and ultrafiltration water treatment

Membrane resistanceAs a new membrane is permeated with deminer-alized water, the measured resistance is only the membrane resistance. There are no particles in the water to block the pores or to form a cake layer. The flux measured as a function of pressure gives a linear relation. From this the membrane resistance can be calculated. The membrane resistance can also be calculated using the theory of water flow through a packed bed (Hagen-Poiseuille):
τm 2
pore
8 lR
p d× ×=
×
in which:Rm = membrane resistance (m)p = porosity of the membrane (-)dpore = diameter of a pore (m)τ = tortuosity of the pores (-)l = thickness of the membrane (m)
The Rm of MF/UF-membranes is in the range of 1011-1014 m-1.
Sometimes the permeability of the membrane is used rather than the membrane resistance. The permeability constant K is defined as:
m
1KR
=
One of the goals of membrane manufacturers is to produce membranes with a high permeability together with a high rejection of the target com-pounds.
Adsorption, pore blocking and cake forma-tionAccumulation of compounds on the membrane surface and in the pores is a consequence of the rejection of these compounds by the membrane. With synthetic water (made from demineralized water with added compounds), the different mechanisms can be distinguished.
Because a range of compounds are present in the feed water, adsorption, pore blocking and cake formation will occur at the same time, and it is not possible to distinguish the different mechanisms. Therefore, the theoretical approach behind these resistances is presented together.
Filtration modelThe cake formation model is based on the as-sumption that the feed water has a constant concentration of particles with a constant size and shape. The cake resistance is calculated from the specific cake resistance (the specific cake resistance is constant because the particle concentration in the feed is constant) multiplied by the cake thickness:
c c cR l r= ×
in which:Rc = cake resistance (m)lc = thickness of the cake layer (m)rc = specific cake resistance (m-2)
The Kozeny-Carmen relation gives the specific cake resistance:
2
c 2 3s
(1 )r 180d
εε
-= ××
in which:ε = porosity of the cake layer (-)ds = diameter of a particle (m)Figure 9 - Resistance processes
181
water treatment micro- and ultrafiltration

The thickness of a cake layer is given by:
ρ εs
cs mem
ml
(1 ) A=
× - ×
in which:ms = cake mass (kg)ρs = density of the particles (kg/m3)
The mass of a cake layer is difficult to measure. The thickness of the cake layer also depends on the TMP. The thickness of the cake layer is in the range of several micrometers, depending on the rejected compounds.
3.4 CleaningAs a result of the dead-end mode, the membrane has to be cleaned often in order to remove the rejected compounds. The cleaning intervals can be constant in time or can be determined by a maximum pressure.
If possible, cleaning of membranes should be avoided because during the cleaning no permeate is produced. Also, permeate and energy are used for the cleaning. With specific cleanings chemicals are also used.
Different methods or a combination of methods can be used to clean a membrane module:to clean a membrane module::- forward flush (FF) - back flush (BF)- air flush (AF)- chemical enhanced flush (CEF) or enhanced
back flush (EBF)- cleaning in place (CIP) or chemical soaking
After a cleaning the clean water resistance (CWR) is measured in order to measure the effect of the chemical cleaning. The CWR is obtained by measuring the flux of demineralized water at a certain pressure. By comparing the CWR of a cleaned membrane with the CWR of the unused membrane, the cleaning can be judged.
The Reynolds number is an indication of the turbulence of the flow. If the Reynolds number is smaller than 2300, the flow is laminar and the shear at the membrane wall is low. If the Reynolds number exceeds 2300, then the flow is turbulent and accumulated compounds may be removed from the membrane surface.
0 h0
h
v d ReRe vdν
ν× ×= Þ =
in which:Re = Reynolds number (-)v0 = cross-flow rate (m/s)dh = hydraulic diameter (m)
With tubular or capillary membranes, the hy-draulic diameter is equal to the diameter of the membrane.
Forward flushParticles and compounds on the membrane sur-face can be removed with a forward flush. The forward flush is a turbulent cross-flow along the feed side of the membrane surface (Figure 10). This is the opposite of the filtration mode where the flow is through the membrane (flow direction perpendicular to the membrane surface).In Table 2 velocities are shown where a turbulent flow at 10oC is obtained with different, commer-cially available membrane sizes. Also, the needed pressure difference is calculated.
From this table it is clear that with the smaller diameters, high cross-flow rates are needed to obtain turbulent flow. This velocity is many times higher compared to the velocity during dead-end filtration. For a forward flush, feed water can be used to obtain a high recovery.
Figure 10 - Principle of forward flush
flush water
forward flush
feed
182
micro- and ultrafiltration water treatment

Back flushThe back flush or backwash resembles the back-wash of a rapid sand filter in the conventional treatment. The filtration direction is reversed so the filtration is now outside in (Figure 11). Perme-ate is used for the backwash in order to keep the permeate side of the membrane free of particles. With permeate the dirt is removed from the pores and from the membrane surface. The backwash flux is 2 to 2.5 times the flux during filtration.
After removing the particles from the pores and the membrane surface, the particles and the cake have to be transported out of the module. Because the amount of permeate used for a backwash is limited (because of the recovery), the transport of dirt may be insufficient. A combined back flush and forward flush can be used to overcome this problem. First, a back flush is used to clean the pores and to lift the cake. Then, a forward flush is used to transport the dirt out of the module.
With the backwash, the recovery of the system
decreases because permeate is used to remove the accumulated compounds.
Air/water flushAn air/water flush can be used to clean the mem-brane wall from adhering fouling. The air/water flush is commercialized as AirFlush and is actually a forward flush with a combination of air and water (Figure 12). The air is used to create a turbulent flow in the membrane under process conditions where no turbulence is attained with the water flow.
The cleaning efficiency depends on the kind of two-phase flow obtained in the membranes (Figure 13). If the water/air ratio is high, only small air bubbles
Figure 11 - Back flush schedule
flush waterback flush
product
inlet
back flush with forward flush
product
flush water
d (mm)Rear flow at the end of a module
(m/s)
Required time for flushing a
module (s)5.2 0.05 19
1.5 0.19 5
1.0 0.28 4
0.7 0.40 3
Table 3 - Cross-flow rate at the rear end of a 1 meter module with a back flush flux of 250 l/(m2•h)
water
air
Figure 12 - Principle of air flush
Diameter (mm)
Cross-flow rate (m/s)
Pressure difference (Pa)
5.2 0.58 1473
1.5 2.01 61,370
1.0 3.01 207,120
0.7 4.3 603,850
Table 2 - Needed cross-flow rate in order to get turbu-lence (L = 1 m)
183
water treatment micro- and ultrafiltration

are present in the water and the turbulence is only slightly enhanced. When the water/air ratio is too small, the air flows through the middle of the mem-brane (chimney effect) and the cleaning effect is low. The best cleaning is obtained with bullet-like air bubbles (Figure 13).
Chemical cleaningIf forward flush, back flush and air flush are not enough to clean the membrane, a chemical clean-ing (often called enhanced back flush or chemical back flush) can also decrease the clean water resistance. There is, however, a cost factor to consider with the use of chemicals.
This kind of cleaning means that the module is soaked with a solution of hypochloric acid, hydro-gen chloride, hydrogen peroxide or a specially developed mixture of chemicals. After the soak-ing, a backwash or a forward flush removes the dissolved dirt. The main draw- back of chemical cleaning is that the membranes age because of the chemicals, and the lifetime of the membranes, therefore will be shortened. Also, the chemicals
are a cost factor and with a chemical cleaning a chemical waste stream should be discharged. Besides the periodical chemical cleaning which is part of the automated process control of the installation, a more intensive chemical cleaning might also be necessary. The so-called “clean-ing in place” (CIP) can last from a few hours to several days and is typically not automated. If the CIP is not able to clean the membranes, they are replaced by new ones.
4 Practice
4.1 ModuledesignThere are several module concepts. In a module design, a large surface area (a high specific sur-face area results in low investment costs) is com-bined with a low fouling behavior (clogging results in high cleaning and replacement costs). The membrane manufacturers commercialize several module designs. Two different systems can be distinguished: the tubular-shaped membranes and the flat sheet membranes. These two systems are described further below in Table 4.
Tubular-shaped membranesIn a module, one to several thousand membranes are combined. The rear ends of the membranes are glued in the module (this is called potting) in order to fix the membranes in the module (Figure 14). The potting is 2 to 3 centimeters thick.
Tubular membranesTubular membranes have a diameter of more than 5 mm. Tubular membranes are not self-supporting. The membrane material is not strong enough to resist the pressure during filtration and especially not during the backwash (the backwash pressure is
Figure 13 - Different types of air bubbles in waterwith the type in the middle providing the best clearing
Tubular- shaped mem-branes
Flat sheet membranes
Tubular membranes Plate membranes
Capillary membranes Cushion membranes
Hollow fiber membranes Spiral-wound membranes
Table 4 - Subdivision of different MF/UF systems
184
micro- and ultrafiltration water treatment

higher and is outside-in).The membrane is therefore fixed on a support layer. The specific surface area of a module is low (about 400 m2/m3) because of the large diameter of the tube. Because of this low specific surface area and because the membranes are built with two layers (membrane and support layer), the investmenthe investment costs of these membranes are high..
The benefit of a large diameter is that the mem-branes are not very sensitive to fouling. The application of these membranes is in water environments with a high load of suspended solids (backwash water from rapid sand filtration or other wastewater) or in industrial locations.
Tubular membranes can be cleaned well. Because of their large diameter, there are low cross-flow rates required for turbulent conditions. A forward flush can clean the membrane surface because of the turbulent conditions. Also, the tubular mem-branes can be backwashed (also called back flush).
Capillary membranesCapillary membranes have a tubular shape and a diameter between 0.5 and 5.0 mm. The capillary membranes are self-supporting, so they are strong enough to resist the pressure du-ring filtration and backwash.
With the smaller diameter of the capillary mem-branes, the specific surface area of a module is large (about 2000 m2/m3). This influences the in-vestment costs, which are low compared to tubu-lar membranes. The capillary membranes are more sensitive to fouling because of the small diameter.
Capillary membranes can be backwashed but the forward flush is less effective because the cross-flow is only turbulent at very high velocities. There-fore, the forward flush is used to transport the dirt after a backwash rather than to remove the fouling from the surface.
Hollow-fiber membranesThe diameter of a hollow-fiber membrane is only about 100 micrometers. Hollow-fiber membranes resemble the diameter of a human hair. Because of the small diameter, the specific surface area of a module is very high (up to 100,000 m2/m3), but at a large risk for clogging is high. Hollow-fiber membranes are not backwashed. That is why these membranes are only used with reverse osmosis and not for micro- or ultrafiltration.
Flat sheet membranesSpacers separate flat sheet membranes from each other. Spacers and membranes are put together alternately.
Plate membranes
Figure 14 - Tubular membranes
Figure 15 - Capillary membranes
185
water treatment micro- and ultrafiltration
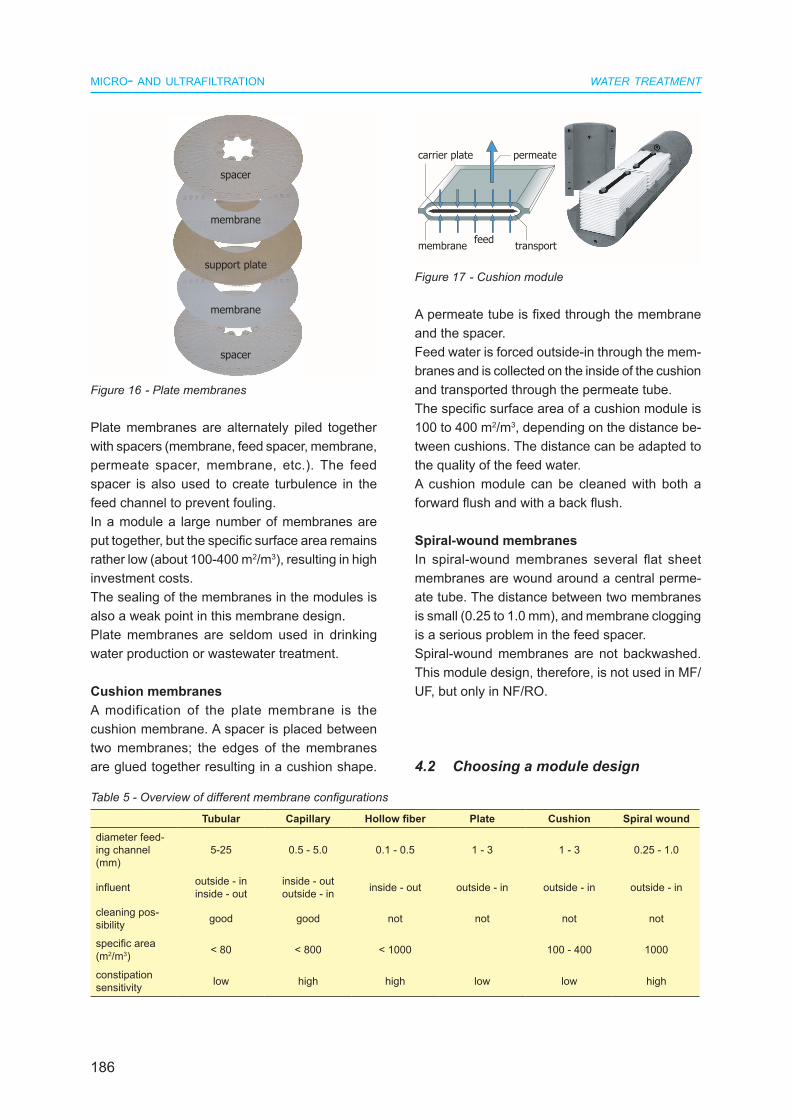
Plate membranes are alternately piled together with spacers (membrane, feed spacer, membrane, permeate spacer, membrane, etc.). The feed spacer is also used to create turbulence in the feed channel to prevent fouling. In a module a large number of membranes are put together, but the specific surface area remains rather low (about 100-400 m2/m3), resulting in high investment costs. The sealing of the membranes in the modules is also a weak point in this membrane design. Plate membranes are seldom used in drinking water production or wastewater treatment.
Cushion membranesA modification of the plate membrane is the cushion membrane. A spacer is placed between two membranes; the edges of the membranes are glued together resulting in a cushion shape.
A permeate tube is fixed through the membrane and the spacer.Feed water is forced outside-in through the mem-branes and is collected on the inside of the cushion and transported through the permeate tube. The specific surface area of a cushion module is 100 to 400 m2/m3, depending on the distance be-tween cushions. The distance can be adapted to the quality of the feed water. A cushion module can be cleaned with both a forward flush and with a back flush.
Spiral-wound membranesIn spiral-wound membranes several flat sheet membranes are wound around a central perme-ate tube. The distance between two membranes is small (0.25 to 1.0 mm), and membrane clogging is a serious problem in the feed spacer. Spiral-wound membranes are not backwashed. This module design, therefore, is not used in MF/UF, but only in NF/RO.
4.2 Choosingamoduledesign
spacer
membrane
support plate
membrane
spacer
Figure 16 - Plate membranes
permeate
transportmembrane
carrier plate
feed
Figure 17 - Cushion module
Tubular Capillary Hollow fiber Plate Cushion Spiral wounddiameter feed-ing channel (mm)
5-25 0.5 - 5.0 0.1 - 0.5 1 - 3 1 - 3 0.25 - 1.0
influent outside - ininside - out
inside - outoutside - in inside - out outside - in outside - in outside - in
cleaning pos-sibility good good not not not not
specific area (m2/m3) < 80 < 800 < 1000 100 - 400 1000
constipation sensitivity low high high low low high
Table 5 - Overview of different membrane configurations
186
micro- and ultrafiltration water treatment

The choice of a module design will be determined by economical reasons. There is a difference between investment costs and exploitation costs. The investment costs are minimal with modules having the highest specific surface area and low module costs. The exploita-tion costs are minimal at low energy costs and a high fouling resistance. Depending on the type of feed water, an eco-nomical configuration can be found. In many cases comprehensive research is needed in order to find an optimal configuration.
In Table 5 an overview is given of different mem-brane configurations and the main criteria for an optimal choice of a membrane design.
5 Operation
5.1 Constantpressureorconstantfluxmode
Dead-end filtration can be performed in two modes: with a constant flux or with a constant pressure. With a constant flux mode the pressure is increas-ing in time.In constant pressure mode the flux is decreasing in time (Figure 18).
Constant pressure mode is not preferred because water production is not constant. It is better to in-crease the pressure during permeation to keep the flux (and the production) constant. The backwash can be started either at a constant time or if a maximum pressure is reached. The filtration time in dead-end mode depends on the
suspended solid concentration, usually 15 to 20 minutes. Cleaning lasts several seconds to one minute. Depending on the type of cleaning, feed water (for-ward flush) or permeate (backwash) is used. The pressure during a cleaning is in the range of 0 to 1 bar. For the treatment of surface water, a flux of 70 l/(m2.h) is used. Backwash water of rapid sand filtration is treated with a flux of 120 l/(m2.h).
5.2 Cross-flowfiltrationFor water with a high suspended solids concentra-tion, often cross-flow filtration is used. With cross- flow filtration the majority of the water (90%) flows across the membrane and a small part permeates through the membrane (10%). The cross-flow rate is high because the cake layer thickness can be minimized, but the permeate production is low. Particles on the membrane are removed by the high cross-flow rate and, therefore, removed from the module.
The drawback of a cross-flow mode is that it uses more energy compared to the dead-end mode. This energy is used to pump 90% of the feed water across the membrane. The energy consumption of a cross-flow system is about 5 kWh/m3 permeate. For dead-end filtration the energy consumption is only 0.1 to 0.2 kWh/m3 permeate.
The typical flux-time diagram for cross-flow filtra-tion is drawn in Figure 20. The flux decreases as a function of time which is a result of the cake build-up and the pore blocking. Because of the high cross-flow rate, the cake layer thickness is constant after a while and the flux does not de-
time
constant flux constant pressure
time
fluxTMD
Figure 18 - Constant pressure versus constant flux mode
Figure 19 - Flows in cross-flow filtration
permeate
concentrate
feed
187
water treatment micro- and ultrafiltration

crease as fast as in the dead-end mode.Critical flux is the flux achieved at a certain cross-flow rate. At this rate the cake layer has a certain thickness. If the cross-flow rate is increased, the cake layer decreases as a result of the high shear stresses and the flux increases (Figure 21). The increase in flux is rather small. Above a certain cross-flow rate the flux will become constant.
Membrane systems with cross-flow mode are also cleaned. Backwash and chemical cleaning are used in the same way as in a dead-end system.
5.3 FoulingpreventionIn order to protect the pores of the membranes from blocking iron or aluminum, coagulation can be used. Coagulant dosing is used to make larger
particles incapable of penitrating the membrane and can, therefore, be removed more easily.In Figure 22 the flux decrease is shown (constant pressure mode) for two UF modules. One is fed with coagulated water and the other with non-coagulated water. Because the smaller particles are captured in the iron flocs, the production is higher in the module with coagulant compared to the module without coagulant.
Figure 21 - Flux at different cross-flow veloci-
time (min)
flux
(l/m
2 h)
0 50 100 150 200 250
140
120
100
80
60
40
20
0
vcr= 2.4 m/s vcr= 1 m/s
19-02 26-02 5-03 12-03 19-03 26-03 2-04 9-04 16-04 23-04 30-04 7-05date
0
200
400
600
800
1000
1200
flux
(l/m
2 h at
100 C
and
1 ba
r)
no flocculation aid added FeCl3 added
Figure 22 - Flux decline with and without FeCl3-dosing
fouling
concentrationpolarization
time
flux
Figure 20 - Flux decline with cross-flow filtration
Further reading
• Water treatment: Principles and design, MWH (2005), (ISBN 0 471 11018 3) (1948 pgs)
188
micro- and ultrafiltration water treatment