water stewardship a treasury perspective · water stewardship –a treasury perspective ... •...
TRANSCRIPT

Water Stewardship – a Treasury Perspective
Presentation to Water Stewardship Regional Workshop
Presenter: Sarah McPhail Director: Water Policy, Public Finance, National Treasury | October 2015

• National Treasury’s role is to support the optimal allocation and utilisation
of financial resources. In the Water Sector this broadly includes:
– Budget allocations to DWS
– Guarantees and Borrowing limit approvals for State Owned Entities
– Budget allocations to Local Government
– Municipal budget analysis and tariffs
– Inter-governmental Relations
– Public private partnerships
– Policy analysis
• Key risks to sustainability in the water sector:
– Ageing, poorly maintained and often ill-equipped infrastructure
– General under-pricing of water across the value chain
2

Public- sector Infrastructure
3
Water Infrastructure
• Water resources infrastructure: WTE and TCTA
• Bulk and Reticulation: Water Boards, Regional Bulk Infrastructure Grant
(RBIG) and Municipal Infrastructure Grant, Municipal own revenue
(tariffs, loans), Direct user contributions (e.g. mines)
• Grant funding provided for ‘social’ infrastructure and co-funding required
for ‘economic’ infrastructure
• Social Component: infrastructure cost that provides for basic domestic
use, associated social requirements (such as schools and clinics)
• Economic Component: infrastructure cost that provides for services
higher than basic and/ or commercial/ industrial use
4
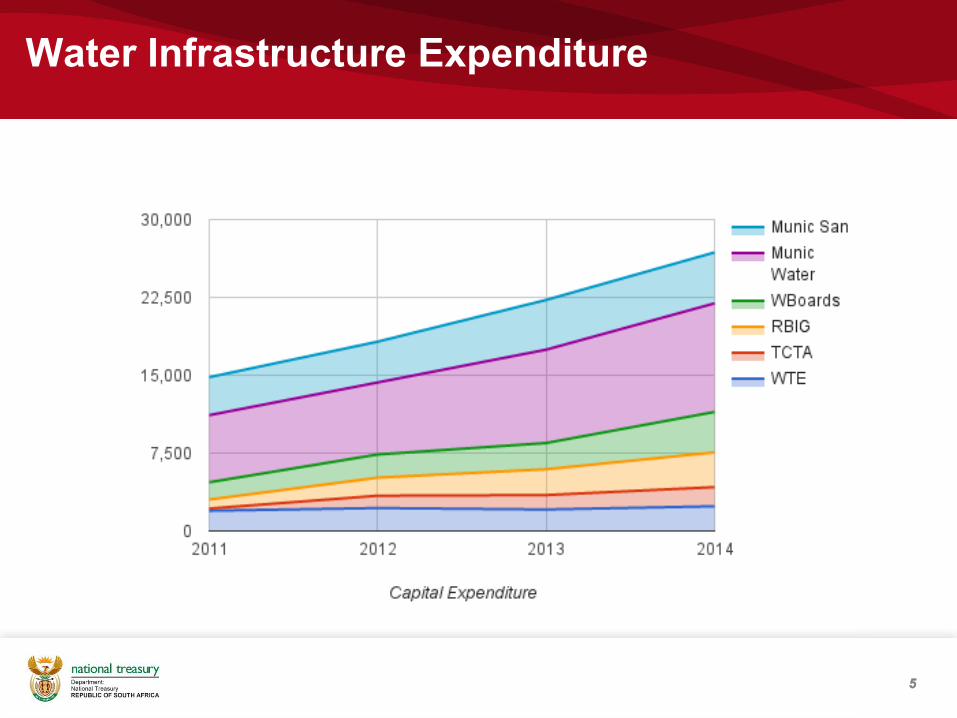
Water Infrastructure Expenditure
5
DWS Infrastructure Reporting in Budget
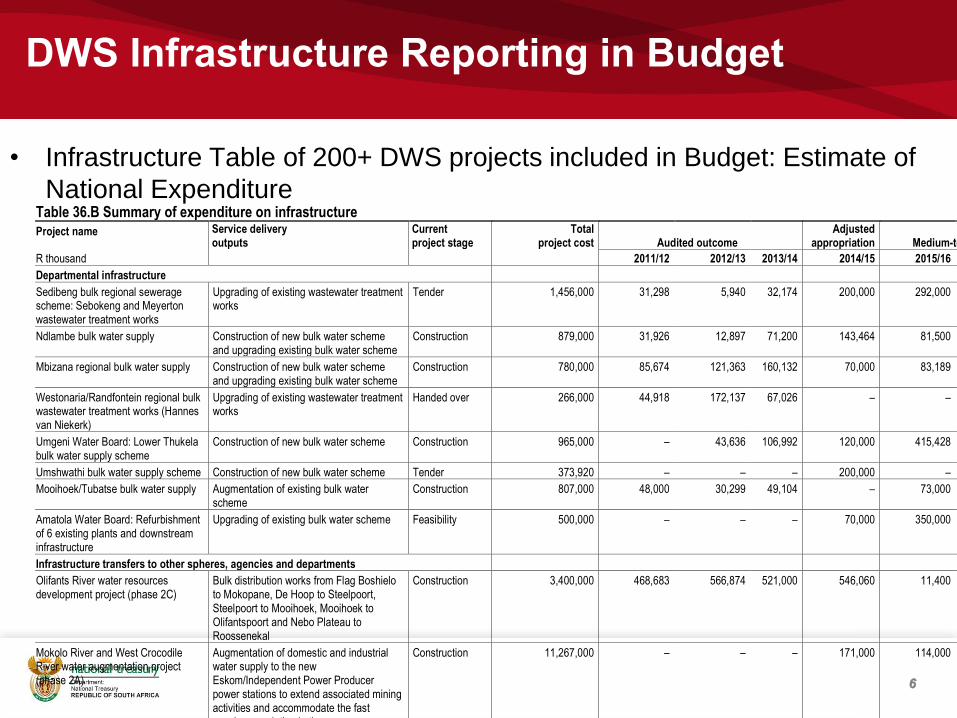
• Infrastructure Table of 200+ DWS projects included in Budget: Estimate of
National Expenditure
6
Table 36.B Summary of expenditure on infrastructure Project name Service delivery
outputs Current project stage
Total project cost Audited outcome
Adjusted appropriation Medium-term expenditure estimate
R thousand 2011/12 2012/13 2013/14 2014/15 2015/16 2016/17 2017/18
Departmental infrastructure
Sedibeng bulk regional sewerage scheme: Sebokeng and Meyerton wastewater treatment works
Upgrading of existing wastewater treatment works
Tender 1,456,000 31,298 5,940 32,174 200,000 292,000 307,000 210,000
Ndlambe bulk water supply Construction of new bulk water scheme and upgrading existing bulk water scheme
Construction 879,000 31,926 12,897 71,200 143,464 81,500 110,000 190,000
Mbizana regional bulk water supply Construction of new bulk water scheme and upgrading existing bulk water scheme
Construction 780,000 85,674 121,363 160,132 70,000 83,189 139,000 161,346
Westonaria/Randfontein regional bulk wastewater treatment works (Hannes van Niekerk)
Upgrading of existing wastewater treatment works
Handed over 266,000 44,918 172,137 67,026 – – – –
Umgeni Water Board: Lower Thukela bulk water supply scheme
Construction of new bulk water scheme Construction 965,000 – 43,636 106,992 120,000 415,428 190,912 –
Umshwathi bulk water supply scheme Construction of new bulk water scheme Tender 373,920 – – – 200,000 – 231,847 300,000
Mooihoek/Tubatse bulk water supply Augmentation of existing bulk water scheme
Construction 807,000 48,000 30,299 49,104 – 73,000 90,000 140,000
Amatola Water Board: Refurbishment of 6 existing plants and downstream infrastructure
Upgrading of existing bulk water scheme Feasibility 500,000 – – – 70,000 350,000 – –
Infrastructure transfers to other spheres, agencies and departments
Olifants River water resources development project (phase 2C)
Bulk distribution works from Flag Boshielo to Mokopane, De Hoop to Steelpoort, Steelpoort to Mooihoek, Mooihoek to Olifantspoort and Nebo Plateau to Roossenekal
Construction 3,400,000 468,683 566,874 521,000 546,060 11,400 11,400 –
Mokolo River and West Crocodile River water augmentation project (phase 2A)
Augmentation of domestic and industrial water supply to the new Eskom/Independent Power Producer power stations to extend associated mining activities and accommodate the fast growing population in the area
Construction 11,267,000 – – – 171,000 114,000 91,200 228,000
Total 124,292,209 3,569,345 5,685,754 5,400,580 6,468,311 8,511,835 9,655,967 9,488,357

Water tariffs
• Raw water tariffs are capped through policy for agriculture sector
• Further reduced through consultations for all users
• Domestic and industrial users in only four of nine catchments pay full
cost for water resource management
• Infrastructure charge: Irrigators pay from an average 25% - 85% of
budget requirement
• For domestic and industrial users: from 65% to 97% of full cost.
• Water Boards costs increase from 12% to 19% over past three years
whereas tariffs increases have only been on average 10%
• Similarly municipal tariff increases are lower than cost increases
7

Action and Engagement
• Leverage grant funding for infrastructure through Water Boards,
municipalities and DWS regional offices
• Representation and inputs at tariff consultations
• Support existing Programmes: WCDM, War on Leaks, No Drop
• Services-in-kind, non-financial returns
• Promote transparency and accountability mechanisms, not ring-fencing
• Strengthen partnerships and coordination
• Shifting Budget priorities: sustainability, reducing losses, pollution control
8

Thank you
9