water scarcity in the levant - professional ma in … sea of galilee or lake tiberias is israel’s...
TRANSCRIPT

Water Scarcity in the Levant
1
Water Scarcity in the Levant
Alvarado Martha and Liviero Natalia
ISS 6926 - Capstone
MAGG Program – Cohort III
Florida International University
Agency: SOCOM
April 16, 2015
Introduction
The Levant is one of the most water stressed regions in the planet. The decrease in water
recharge from decreased rainfall, a current deficit of 2,458 million cubic meters (mcm) of water,
the pollution of the soil, the salinity of certain rivers and aquifers, population growth, and the
political conflicts and unrest in the area (including the protracted Israeli-Palestinian/Israeli-Arab
conflict, the civil war in Syria, and the Islamic State in Iraq and Syria), only exacerbate the
availability of natural resources, and reduce the possibilities for cooperation and for a just and
peaceful resolution to regional hostilities.
In addition, the effects of Climate Change forecasting a reduction of precipitations of
20% to 25% and an increase in temperatures of 2ºC to 2.75ºC by the year 2050, and an estimated
population growth of 20% for the region by 2020, makes it imperative for the governments to
take action and implement measures to alleviate the current and future water scarcity in the
Levant.
The following synopsis reviews the literature pertaining to the physical, geographical and
environmental aspects of four specific countries or entities. They include Israel, The Palestinian
Territories, Jordan, Lebanon, and the Syrian Republic. The themes covered for each country or

Water Scarcity in the Levant
2
entity will include physical locations/geographic extent of water resources, water supply and
demand, water transportation, water treatment prior to direct supply for consumption, and
desalination. The Appendix section has five tables with key statistics for all the studied countries
and territories.
Israel
According to the CIA, in 2014 the population of Israel was 7,821,850 million (CIA,
2014). In 2006, the entire population had access to drinking water and to improved sanitation
(FAO 2015, 2008). According to AQUASTAT, FAO’s global water information system, the
total area occupied by Israel is about 20,770 km2. It is bordered by Egypt and the Gaza Strip in
the southwest and south, the Syrian Arab Republic and Lebanon in the north, and Jordan and the
Palestinian Occupied territories in the West Bank, in the east. It has coastlines in the west on the
Mediterranean, and in the south on the Gulf of Eilat/Aqaba.
Israel is divided into four regions: 1) the Mediterranean coastal plain stretching from the
north on the Lebanese border to the south in the Gaza Strip; 2) the central highland region, with
the mountains and hills of Upper and Lower Galilee in the north, the Samarian Hills with several
fertile valleys in the south, and the hills of Judea in the south of Jerusalem. The central highland
region also has several valleys, including the Jezreel/Yizreel Valley/Plain; 3) the Jordan Rift
Valley which is located east of the central highlands and includes the Jordan River, the Dead
Sea, and the Sea of Galilee or lake Kinneret also known as Lake Tiberias by the Israelis; and, 4)
the Negev Desert in the south (FAO 2015, 2008). See Map 1.

Water Scarcity in the Levant
3
Map 1. Israel’s Geographical maps, 2008. Source: AQUASTAT. Retrieved January 31,
2015, from
http://www.fao.org/nr/water/AQUASTAT/countries_regions/ISR/ISR-map_detailed.pdf

Water Scarcity in the Levant
4
Israel’s climate is characterized by short, cool, rainy winters and long, hot, dry summers,
modified locally by latitude and altitude. The coldest month is January with temperatures ranging
from 41°F to 50°F, and the hottest month is August with temperatures ranging from 64°F to
100°F. The months with the highest precipitations are November and March and the dry months
are June through August. Rainfall is irregularly spread and differs from region to region (less in
the southern areas), from season to season, as well as from year to year. Rainfall is usually
presented in the form of violent storms, producing flooding and erosion (FAO 2015, 2008).
A report prepared by the Hydrological Service of Israel in 2012, concluded that Israel has
an average natural recharge of 1.6 to 1.8 billion m3/year. The natural recharge for the
recommended drinking water standard with concentrations of chloride under 400 mg/l is between
1.4 and 1.6 billion m3/year. The study also shows that over the past 40 years, the overall
recharge has decreased dramatically, and, due to regional climate and water resources, the
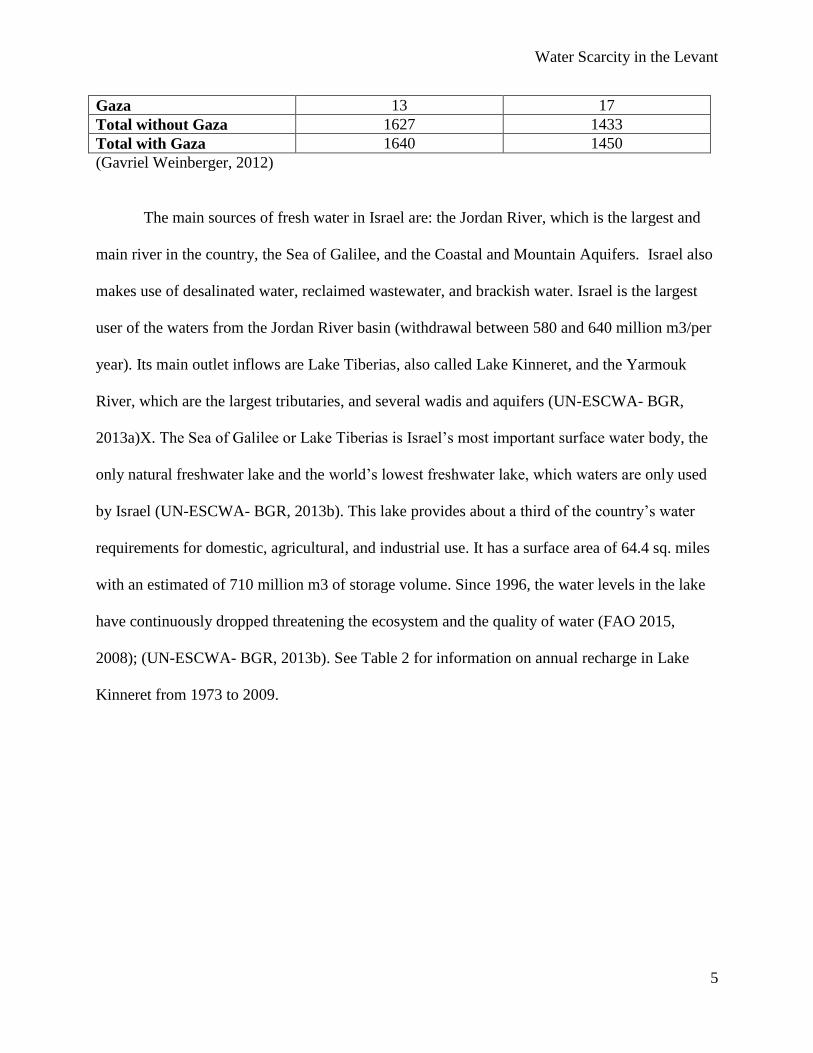
decreasing trend will continue for the next 25 years. Table 1 shows that all the basins except for
the Negev had a decrease in the average recharge from the period 1993-2009 compared to the
period 1973-1992 (Gavriel Weinberger, 2012).
Table 1. Comparison Between the Average Recharge from Rainfall Estimates for the
periods (1973-1992) and (1993-2009) with Chloride Concentration Below 400 mg/l.
Basin Average (1973-1992) Average (1993-2009)
Coastal 128 116
Western Mountain 369 333
Eastern Mountain 211 174
North Eastern Mountain 151 134
Lower Galilee 24 20
Western Galilee 109 102
Carmel 27 25
Negev 4 4
Kinneret 605 526
Water Scarcity in the Levant
5
Gaza 13 17
Total without Gaza 1627 1433
Total with Gaza 1640 1450
(Gavriel Weinberger, 2012)
The main sources of fresh water in Israel are: the Jordan River, which is the largest and
main river in the country, the Sea of Galilee, and the Coastal and Mountain Aquifers. Israel also
makes use of desalinated water, reclaimed wastewater, and brackish water. Israel is the largest
user of the waters from the Jordan River basin (withdrawal between 580 and 640 million m3/per
year). Its main outlet inflows are Lake Tiberias, also called Lake Kinneret, and the Yarmouk
River, which are the largest tributaries, and several wadis and aquifers (UN-ESCWA- BGR,
2013a)X. The Sea of Galilee or Lake Tiberias is Israel’s most important surface water body, the
only natural freshwater lake and the world’s lowest freshwater lake, which waters are only used
by Israel (UN-ESCWA- BGR, 2013b). This lake provides about a third of the country’s water
requirements for domestic, agricultural, and industrial use. It has a surface area of 64.4 sq. miles
with an estimated of 710 million m3 of storage volume. Since 1996, the water levels in the lake
have continuously dropped threatening the ecosystem and the quality of water (FAO 2015,
2008); (UN-ESCWA- BGR, 2013b). See Table 2 for information on annual recharge in Lake
Kinneret from 1973 to 2009.

Water Scarcity in the Levant
6
Table 2. Water Balance in the Kinneret Watershed (total recharge, including areas with
chloride concentrations above 400 mg/liter).
Hydrological year Total consumption
in the upstream
watershed (mcm)
Net available water
in Lake Kinneret
(mcm)
Recharge from Rain
to the watershed
(mcm)
2000/2001 180 69 249
2001/2002 186 267 453
2002/2003 197 942 1140
2003/2004 194 628 822
2004/2005 191 332 523
2005/2006 192 257 448
2006/2007 183 220 404
2007/2008 192 82 274
2008/2009 206 176 377
(Gavriel Weinberger, 2012)
The Coastal Aquifer is a 74 miles sandstone aquifer (underground water reserve) located
on the Mediterranean coastline and shared with the Gaza Strip and Egypt. This aquifer is an
important storage of water recharged naturally by rainfall and artificially by water from the
National Water Carrier (NWC) (FAO 2015, 2008). This aquifer is heavily exposed to microbial
pollutants, chemicals, heavy metals, and toxic organic compounds which increase the
concentration of chloride and nitrate levels, deteriorating the quantity and the quality of the
water. Around 15% of the total water pumped from the coastal aquifer lacks existing standards
for drinking water (FAO 2015, 2008). The average annual abstraction of this aquifer is about 390
mcm. Israel abstracts 400-480 mcm/year, or about 66% of its water; the Gaza Strip abstracts
150-180 mcm/year, or 23%; and Egypt abstracts 70-80 mcm/year, about 11% (UN-ESCWA -
BGR, 2013c). See Table C.
The limestone aquifer of the Mountain Aquifer (Yarkon-Taninim), located in the center
of Israel, is one of the most important sources of water for both Israel and the Palestinians. The
Mountain Aquifer is divided into three sub-aquifers: the northern basin (Harod - Beit She'an)
Water Scarcity in the Levant
7
with an average renewal of 145 million m3 /year, the western basin (Yarkon-Taninim) with an
average refill of 362 million m3 /year, and the eastern basin with an average renewal of 172
million m3 /year. This aquifer is recharged by annual renewable rainfall with an average of about
679 million m3 /year. However, the water levels in this aquifer have diminished due to
overexploitation. Israel also has small aquifers located in Western and Eastern Galilee, the Arava
valley and the Jordan Rift. (FAO 2015, 2008). Israel controls 100% of this aquifer, abstracting
368.7 mcm per year or 94% of its water from 1970 to 2008 and leaving 23.7 mcm per year or 6%
to the Palestinians from 1995 to 2011 (UN-ESCWA - BGR, 2013d). See Table C. Table 5 below
has information of water usage by Israel and by the Palestinians per aquifer.
With regards to water transportation, Israel built the National Water Carrier (NWC),
which is the largest (about 130 km) canal in Israel that consists of an underground pipe which
connects to the National Carrier and pumps, that drive water from the Sea of Galilee/Lake
Kinneret to Israel’s coastal region and to the Negev Desert in the south. Its construction began in
1964. About 80% of the water carried by this canal is for agricultural use and 20% for human
consumption (Mekorot, a); (UN-ESCWA- BGR, 2013a).
Israel has a relatively high proportion of treated collected wastewater according to a
Water Report on the Arab World by the World Bank in 2009. Approximately 80% of its
wastewater is treated; another 6% is discarded on site in central septic tank systems, and the
remainder is not treated. The study mentions that Israel had about 500 treatment plants by 1996.
The main waste treatment methods were oxidation ponds (18%) and mechanical biological
systems (14%). There is a “Third Line” which is a conveyance and distribution system, since it
is the third main water line supplying soil-aquifer treated (tertiary) reclaimed wastewater
connecting the center of Israel to the south (World Bank, 2009). See Table D Sewerage and

Water Scarcity in the Levant
8
Wastewater Treatment. The table shows that Israel collects 79% of its wastewater, a total of 296
mcm/year.
Water desalination is very well developed in Israel. A report by the Head of Desalination
Division of the Israeli Water Authority of 2010, provides details about Israel’s desalination
projects. The Israeli government has initiated a desalination program to cover and maintain a
sustainable water supply in the future for the growing demands for potable water in the State due
to its limited natural resources. This long-term program was introduced in 1999 and the first
large-scale desalination facility started in 2002 by the private sector. In 2005, the seawater
desalination program initiated its contribution of drinking water to the national water system. In
2010, the desalination program provided 320 million m3 of water (about 42% of the domestic
water demands). There are also several smaller groundwater wells’ desalination facilities in the
Arava, Eilat, and the southern coastal plain of the Mount Carmel (Tenne, 2010).
Currently, Israel counts on three main desalination facilities: 1) Ashkelon Desalination
Plant, situated south of the city of Ashkelon (southern Israel), which it was fully operational as of
December 2005; 2) Palmachim Desalination Plant, situated north of Kibbutz Palmachim (in the
central part of Israel); and, 3) Hadera Desalination Plant, situated west of the city of Hadera
(Mediterranean coast). Israel also has two planned desalination facilities: The Ashdod
Desalination Plant in south-central Israel and the Soreq (or Sorek) Desalination Plant in north-
central Israel (Tenne, 2010).
Furthermore, Israel has been working on a “New National Water Carrier” project that
was supposed to be launched in 2014 according to the Israel National Water Company, Mekorot.
This project consists on the desalinization of water from the Mediterranean Sea in the
desalinization plants of Hadera, Palmachim, Ashkelon and Ashdod, and to transport it through
Water Scarcity in the Levant
9
the National Carrier throughout Israel. Once this project is completed and the desalinization
plants connected to the National Carrier, desalinized water will be utilized to cover 75% of
domestic consumption in Israel. The project will add more than 100 mcm of water per year to the
national water system. This is the biggest and most extensive project in Israel that will restore its
natural water reserves (Mekorot, b); (Mekorot, c).
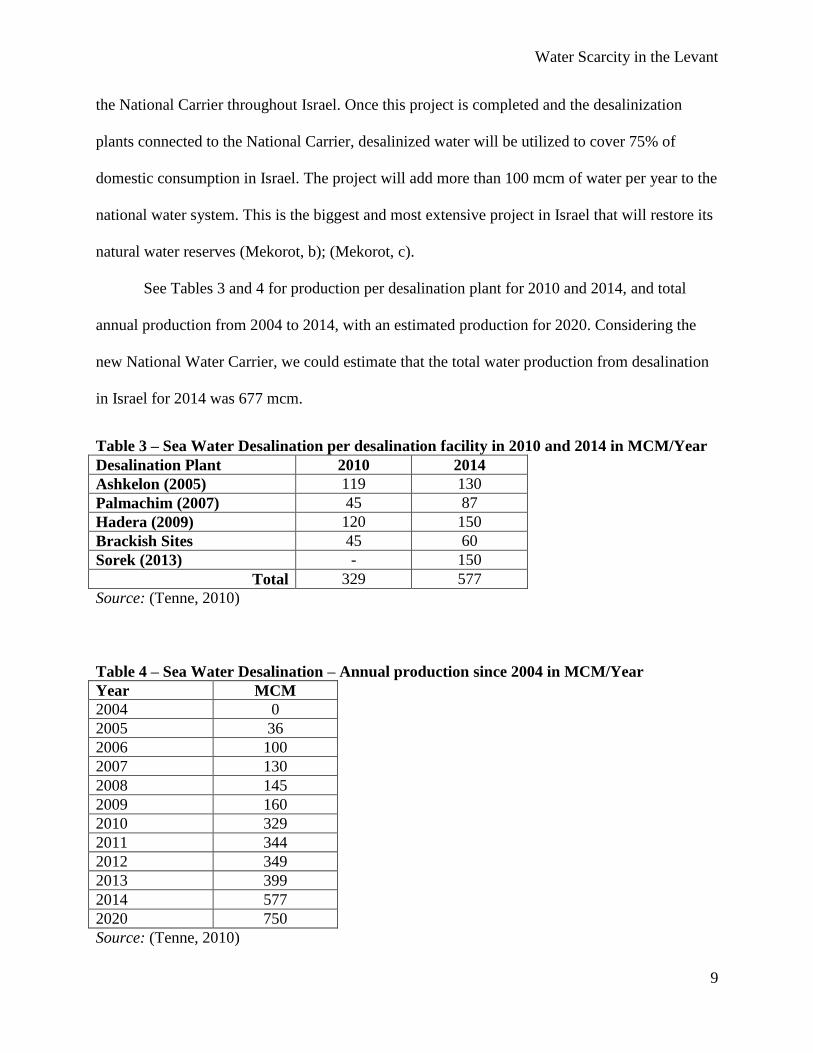
See Tables 3 and 4 for production per desalination plant for 2010 and 2014, and total
annual production from 2004 to 2014, with an estimated production for 2020. Considering the
new National Water Carrier, we could estimate that the total water production from desalination
in Israel for 2014 was 677 mcm.
Table 3 – Sea Water Desalination per desalination facility in 2010 and 2014 in MCM/Year
Desalination Plant 2010 2014
Ashkelon (2005) 119 130
Palmachim (2007) 45 87
Hadera (2009) 120 150
Brackish Sites 45 60
Sorek (2013) - 150
Total 329 577
Source: (Tenne, 2010)
Table 4 – Sea Water Desalination – Annual production since 2004 in MCM/Year
Year MCM
2004 0
2005 36
2006 100
2007 130
2008 145
2009 160
2010 329
2011 344
2012 349
2013 399
2014 577
2020 750
Source: (Tenne, 2010)
Water Scarcity in the Levant
10
Palestinian Territories (Gaza Strip, West Bank, and East Jerusalem)
The Palestinian territories have a total area of 6,020 km2 and include the territories of the
Gaza Strip, the West Bank, and the Eastern sector of Jerusalem. The Gaza Strip is a narrow
littoral strip on the Mediterranean Sea. Its total area is 365 km2 and it is surrounded in the north
and the east by Israel and in the south by Egypt. The West Bank is a landlocked area located on
the Jordan River’s west bank. Its total area is 5,655 km2 and it is bordered on the east by Jordan
and in the south by Israel (FAO 2015, 2008). See Map 2, which includes the aquifers in
Israel/Palestine.

Water Scarcity in the Levant
11
Map 2. Palestinian Territories Surface Water in Palestine. Source: Leslie Kanat
Professor of Geology, Israeli Underground Aquifers (Serious Games, 2002). Retrieved January
31, 2015, from http://kanat.jsc.vsc.edu/student/conant/content.htm

Water Scarcity in the Levant
12
The Palestinian territories’ climate is characterized by short, cool, rainy winters and long,
hot, dry summers. It has five major agro-ecological regions: The Jordan Valley, the Eastern
Slopes, the Central Highlands, the Semi-Coast, and the Coastal Plain (the Gaza Strip) (FAO
2015, 2008).
According to the Palestinian Central Bureau of Statistics (PCBS), by 2012, the total
population of the Palestinian Territories was estimated at 4.29 million: 2.65 million in the West
Bank and 1.64 million in the Gaza Strip (Palestinian Central Bureau of Statistics (PCBS), 2012).
According to the World Health Organization and UNICEF, in 2012, only 81.8% of the
population had access to improved drinking water (WHO/UNICEF, 2014). See Table A.
The Palestinian Territories’ water resources include mostly groundwater and some
surface water, which are shared with Israel. The groundwater system consists in several rock
formations that create different levels of depth of multi-aquifer and sub-aquifer in the Jordan
Valley area and the Gaza Strip. The main Gaza Aquifer is an extension of the Israel’s sandstone
coastal aquifer. The West Bank’s limestone hills absorb most of the rainfall on it to later emerge
in the valleys as springs (FAO 2015, 2008). There are four groundwater basins in the West
Bank/Gaza Strip areas: Coastal, Eastern, North-Eastern, and Western aquifers (PASSIA, 2009).
The Jordan River is the only permanent source of surface water in the West Bank.; however,
Palestine has no access to it (UN-ESCWA- BGR, 2013a; UN-ESCWA - BGR, 2013c).
As a result of the Oslo Peace Process, the Israeli-Palestinian Interim Agreement on the
West Bank and the Gaza Strip was signed between Israel and the Palestine Liberation
Organization (PLO) in 1995. The West Bank was divided in Areas A, full control by the
Palestinian Authority (PA), Area B with civilian control by the PA and joint control on security
with Israel, and Area C, full civilian and security control by Israel. Annex III, Art. 40 outlines the
Water Scarcity in the Levant
13
Water and Sewage rights and responsibilities for each party. The first paragraph states that
“Israel recognizes the Palestinian water rights in the West Bank,” but the final provisions were
going to be negotiated in a permanent status negotiations, which have not materialized yet. The
main points of the Interim Agreement are the acknowledgement of both sides of the need to
increase additional water quantity and sources for different uses, to respect each side’s powers
and responsibilities with regards to water and sewage in their areas while managing those aspects
in coordination between both parties in the West Bank.
The main principle of the agreement was to maintain the current amount of water
utilization while increasing the quantity of water for the Palestinians from the Eastern Aquifer
and other agreed sources in the West Bank to an estimated 70-80 mcm/year; to an immediate
increase of 28.6 mcm of water per year; and to prevent harm and deterioration of water utilizing
the resources in a sustainable manner. It also specified that Israel assumed the costs of
development for new water pipelines and drilling in Jenin, Bethlehem, and Hebron. The
agreement also established an Israeli-Palestinian Joint Water Committee (JWC) to coordinate
and regulate water and sewage in the Palestinian territory ( Ministry of Foreign Affairs of Israel,
1995). For data about Israeli Commitment and Palestinian Responsibility see Appendix 2
Paragraph 7; for data concerning aquifers see Appendix Schedule 10.
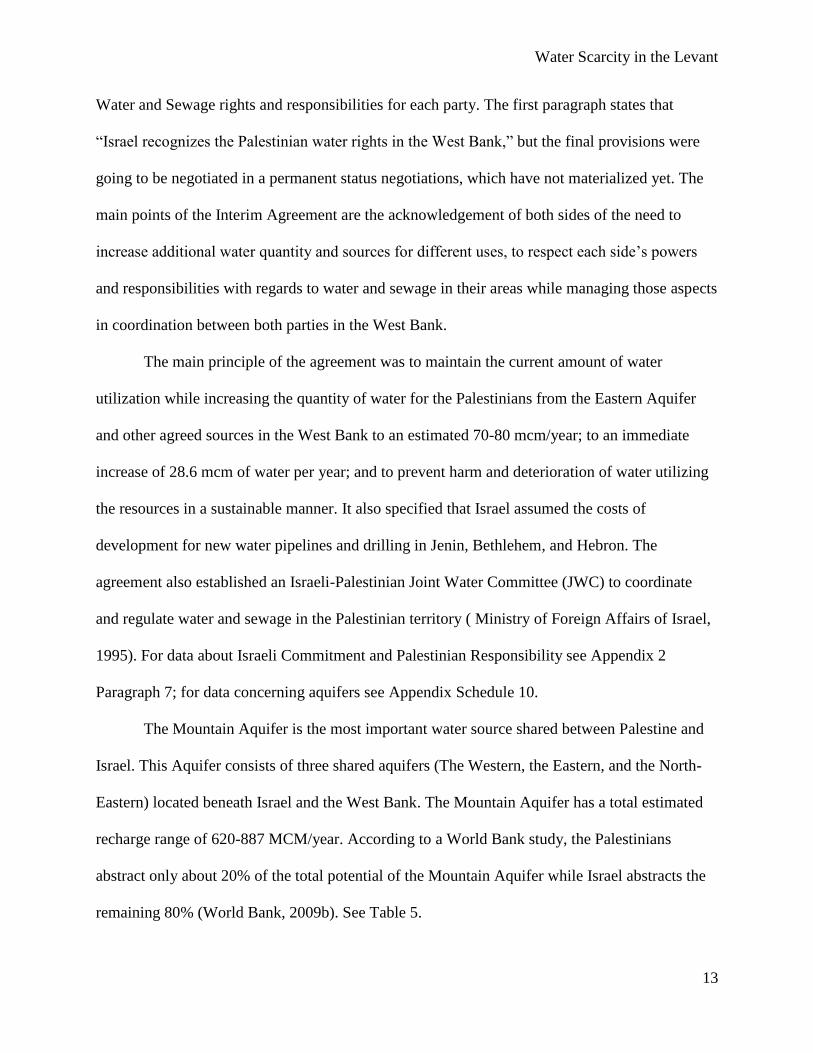
The Mountain Aquifer is the most important water source shared between Palestine and
Israel. This Aquifer consists of three shared aquifers (The Western, the Eastern, and the North-
Eastern) located beneath Israel and the West Bank. The Mountain Aquifer has a total estimated
recharge range of 620-887 MCM/year. According to a World Bank study, the Palestinians
abstract only about 20% of the total potential of the Mountain Aquifer while Israel abstracts the
remaining 80% (World Bank, 2009b). See Table 5.

Water Scarcity in the Levant
14
Table 5. Abstractions from the three shared aquifers within West Bank and Israel 1999
(MCM)
Source: World Bank, 2009b
X
The Gaza Strip depends almost entirely on the Coastal Aquifer Basin for its water supply;
however, the aquifer in the Gaza Strip is severely threatened by over-abstraction and pollution,
making its water unfit for drinking (UN-ESCWA - BGR, 2013c). (Information about the
recharge and usage has been provided in the Israel section above).
According to AQUASTAT, the total internal renewable water resource (IRWR) of
surface and groundwater for the Palestinians is 812 mcm/year. The overexploitation of the
aquifer in the Gaza Strip (the only water source in Gaza) has decreased the quality of the
groundwater. Also, inadequate farming practices such as the use of excessive amounts of
fertilizers and pesticides, are deteriorating the land and water resources (FAO 2015, 2008);
(OCHAoPt, 2014, p. 89). According to the UN, in the next 15 years, Gaza will lack drinking
water (PASSIA, 2009).
With regards to water consumption, in 2005, half of the total consumption of water was
from the agricultural sector (45 %). The remaining half of the consumption was distributed
between municipal (48%) and industrial purposes (7%) (PASSIA, 2009).
Abstractions Excess over Article 40
allocation
Aquifer “Estimated
Potential”
Total
Palestinian
Total
Israeli
Total
Abstracted
Palestinian Israeli Total
over-
extraction
Western 362.0 29.4 591.6 621.0 7.4 251.6 259.0
North
Eastern
145.0 36.9 146.1 184.0 (5.1) 44.1 39.0
Eastern 172.0 71.9 132.9 204.8 (2.6) 92.9 90.3
Total 679.0 138.2 871.6 1,009.8 (0.3) 388.6 388.6

Water Scarcity in the Levant
15
According to the World Bank study, when Israel occupied the West Bank in 1967, it took
hold of the water of the area and developed wells and a water piping system to connect the
settlements to its national carrier pipe with Mekorot. Israel also took away the Palestinians’
rights to water including those from the Jordan River. Out of the 75 mcm unofficially received
by the settlers from Mekorot, 44 mcm are taken from the West Bank (World Bank, 2009b). The
water transport system in the Palestinian Territories consists of several miles of open lined canals
and earthen buffer pools, which are in poor condition. Further, dams to collect natural runoff are
not allowed by the Israeli authorities (FAO 2015, 2008). See Annual Available Water Quantity
in Palestine by Region and Source in Table 6.
Table 6. Annual Available Water Quantity in Palestine by Region and Source, 2013 in
MCM
Unit : million m3
Source
Region Total
Water purchased from
Israeli Water
Company
(Mekorot)(1)
Springs Discharge Water Pumped from
Palestinian Wells
365.7 (2)63.3 39.5 262.9 Palestine(1)
163.1 (2)59.3 (4)39.5 (3)64.3 West Bank
202.6 4.0 _ 198.6 Gaza Strip
(1) Data exclude that part of Jerusalem, which was annexed forcefully by Israel following its occupation of the West
bank in 1967. (2)
Includes the pumped water from the wells which are located in the territories of the State of Palestine and
controlled by Mekorot company for domestic and agricultural uses, includes 4.4 million m3 for agricultural use in
Tubas. (3)
This does not include water abstracted from unlicensed wells. (4) This does not include Fashkha springs.
(-) Nill
Source: Palestinian Water Authority, 2014. Water Information System. Ramallah - Palestine.
Water Scarcity in the Levant
16
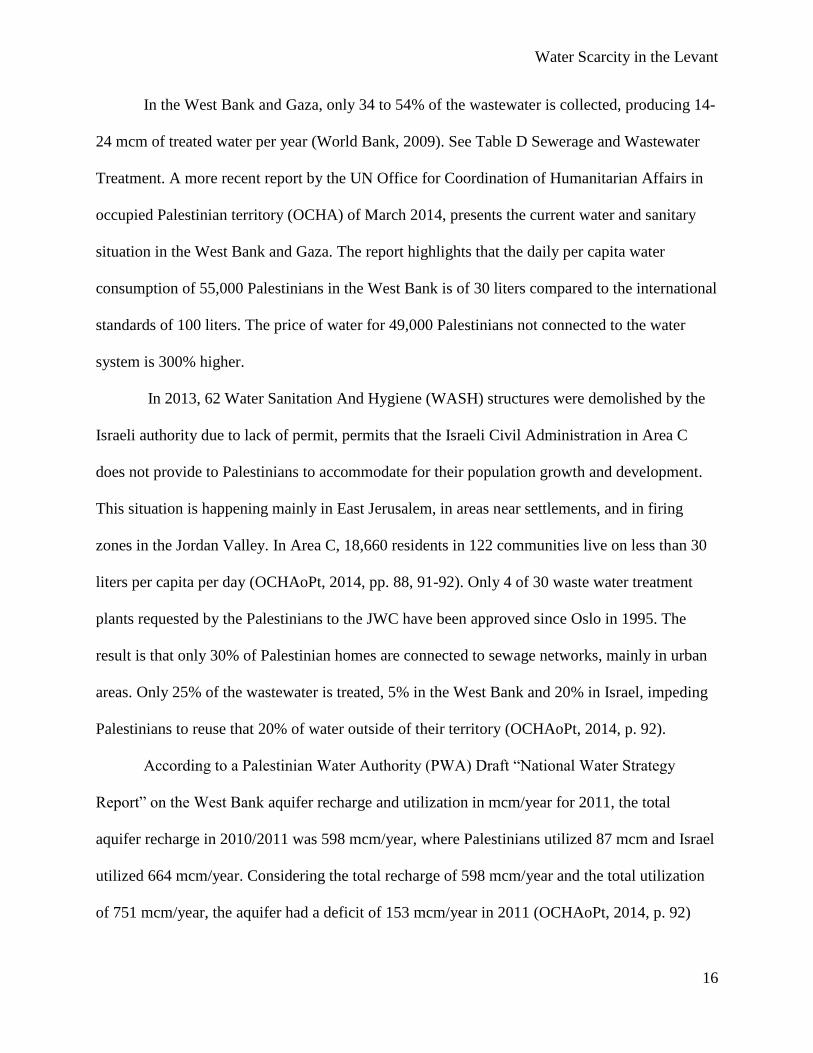
In the West Bank and Gaza, only 34 to 54% of the wastewater is collected, producing 14-
24 mcm of treated water per year (World Bank, 2009). See Table D Sewerage and Wastewater
Treatment. A more recent report by the UN Office for Coordination of Humanitarian Affairs in
occupied Palestinian territory (OCHA) of March 2014, presents the current water and sanitary
situation in the West Bank and Gaza. The report highlights that the daily per capita water
consumption of 55,000 Palestinians in the West Bank is of 30 liters compared to the international
standards of 100 liters. The price of water for 49,000 Palestinians not connected to the water
system is 300% higher.
In 2013, 62 Water Sanitation And Hygiene (WASH) structures were demolished by the
Israeli authority due to lack of permit, permits that the Israeli Civil Administration in Area C
does not provide to Palestinians to accommodate for their population growth and development.
This situation is happening mainly in East Jerusalem, in areas near settlements, and in firing
zones in the Jordan Valley. In Area C, 18,660 residents in 122 communities live on less than 30
liters per capita per day (OCHAoPt, 2014, pp. 88, 91-92). Only 4 of 30 waste water treatment
plants requested by the Palestinians to the JWC have been approved since Oslo in 1995. The
result is that only 30% of Palestinian homes are connected to sewage networks, mainly in urban
areas. Only 25% of the wastewater is treated, 5% in the West Bank and 20% in Israel, impeding
Palestinians to reuse that 20% of water outside of their territory (OCHAoPt, 2014, p. 92).
According to a Palestinian Water Authority (PWA) Draft “National Water Strategy
Report” on the West Bank aquifer recharge and utilization in mcm/year for 2011, the total
aquifer recharge in 2010/2011 was 598 mcm/year, where Palestinians utilized 87 mcm and Israel
utilized 664 mcm/year. Considering the total recharge of 598 mcm/year and the total utilization
of 751 mcm/year, the aquifer had a deficit of 153 mcm/year in 2011 (OCHAoPt, 2014, p. 92)

Water Scarcity in the Levant
17
In Gaza, 340,000 people consume drinking water of unhealthy quality. Out of the 55
mcm annual recharge from rainfall in the Coastal Aquifer, Palestinians abstract anywhere from
180 to 540 mcm/year, creating a water deficit of 125 to 485 mcm/year. As a consequence of the
over extraction, the intrusion of seawater in the aquifer makes 74% of the extracted water saline
and unsuitable for human consumption. Furthermore, the combination of nitrates and chloride as
a result of wastewater discharge and the use of fertilizers for farming, makes 94.5% of the water
in the Gaza Strip unsafe for drinking according to World Health Organization (WHO) standards.
To salvage this situation, according to the report, the Coastal Municipalities Water Utility
(CMWU) operates 14 desalination plants: 13 with brackish water and one with seawater, which
are insufficient in quality and quantity, and inefficient due to the lack of a proper conveyance
system and water management, and the electricity to operate them (OCHAoPt, 2014, pp. 88-90).
Waste Water Treatment Plants (WWTPs) operate in Gaza but are either temporary
structures for partial treatments or surpassed their capacity. This results in 90 million liters of
untreated or partially treated sewage discharged into the sea, contaminating the seawater,
beaches and fish. The lack of connectivity to an electrical grid aggravates the conditions
mentioned above since very often, there is no sufficient electrical power to support the water
system, desalination plants, and the wastewater treatment plants (OCHAoPt, 2014, p. 91).
The OCHA Humanitarian Overview for 2014 adds that the year 2014 was the most tragic
one due to the Israeli Operation Protective Edge in the Gaza Strip, where 1.8 million Palestinians
were affected in general terms: more than 1,500 Palestinian were killed, over 11,000 were
injured and about 100,000 are internally displaced; furthermore over 155,000 housing units were
destroyed. The isolation from the West Bank and the international community, and the lack of
Water Scarcity in the Levant
18
“access to agricultural land and fishing waters” makes food security a high humanitarian
concern. With regards to East Jerusalem and the West Bank, from 2012 to 1214, an average of
622 structures have been demolished every year by the Israeli authorities, with the consequential
displacement of people, which increased by 38% from 2012 to 2014, totaling 3197 displaced
people in that period (OCHAoPt, 2015).
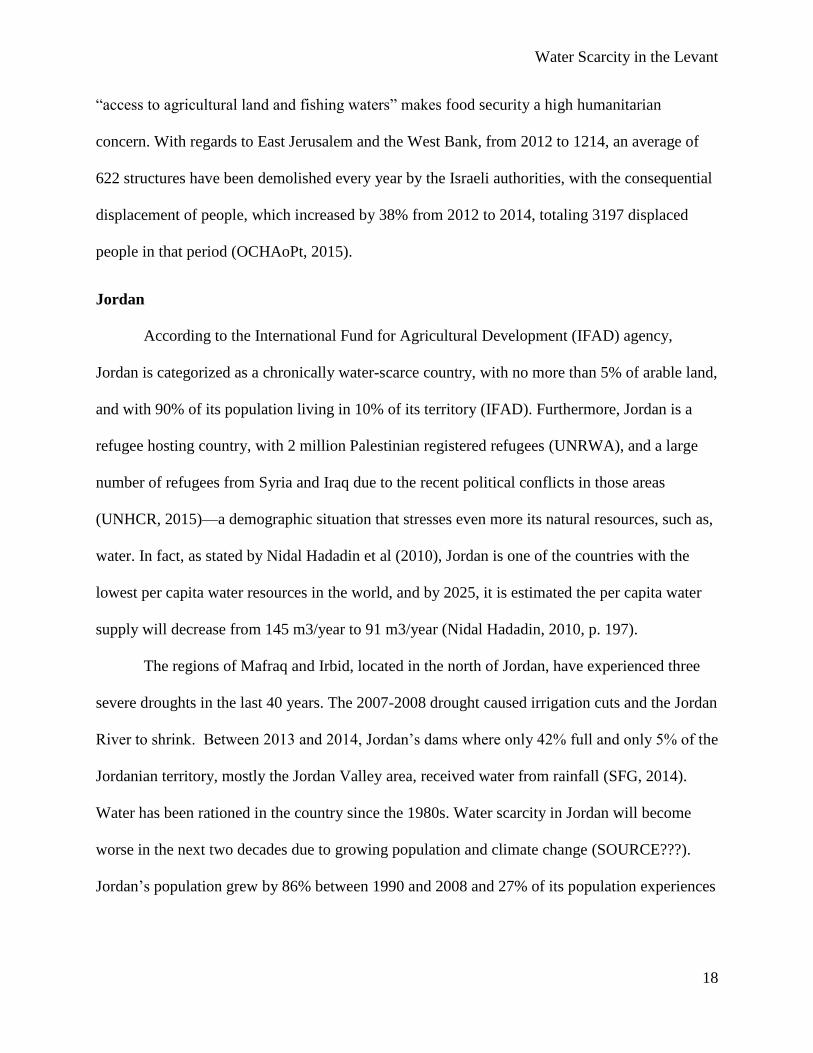
Jordan
According to the International Fund for Agricultural Development (IFAD) agency,
Jordan is categorized as a chronically water-scarce country, with no more than 5% of arable land,
and with 90% of its population living in 10% of its territory (IFAD). Furthermore, Jordan is a
refugee hosting country, with 2 million Palestinian registered refugees (UNRWA), and a large
number of refugees from Syria and Iraq due to the recent political conflicts in those areas
(UNHCR, 2015)—a demographic situation that stresses even more its natural resources, such as,
water. In fact, as stated by Nidal Hadadin et al (2010), Jordan is one of the countries with the
lowest per capita water resources in the world, and by 2025, it is estimated the per capita water
supply will decrease from 145 m3/year to 91 m3/year (Nidal Hadadin, 2010, p. 197).
The regions of Mafraq and Irbid, located in the north of Jordan, have experienced three
severe droughts in the last 40 years. The 2007-2008 drought caused irrigation cuts and the Jordan
River to shrink. Between 2013 and 2014, Jordan’s dams where only 42% full and only 5% of the
Jordanian territory, mostly the Jordan Valley area, received water from rainfall (SFG, 2014).
Water has been rationed in the country since the 1980s. Water scarcity in Jordan will become
worse in the next two decades due to growing population and climate change (SOURCE???).
Jordan’s population grew by 86% between 1990 and 2008 and 27% of its population experiences

Water Scarcity in the Levant
19
water insecurity (Mercy Corps, 2014); (SFG, 2014). Jordan’s estimated total population as of
2014 was 7,930,491 million (CIA, 2014).
Jordan has a total area of 88,780 km2 and is surrounded by the Syrian Arab Republic in
the north, Saudi Arabia in the south and the southeast, Iraq in the northeast, Israel and the West
Bank in the west, and the Gulf of Eilat or Aqaba in the southwest. Jordan is divided into four
physiographic areas: the Jordan Rift Valley (JRV), the Highlands to the east of JRV, the plains,
and the Al-Badiah desert region, an Arabian Desert’s extension of 69,000 km2, located in the
east of Jordan (FAO 2015, 2008). See Map 3 which includes Jordan water basins.
Map 3. Jordan. Source: UNESCO, Fourth World Water Development Report, Vol. 3, Chapter 39,
Paris March 2012, p.793. Retrieved from Politics matter: Jordan’s path to water security lies through
political reforms and regional cooperation. Copyright 2013 by NCCR Trade Working Paper.
Reprinted with permission.

Water Scarcity in the Levant
20
Due to its location in an arid–semi-arid climatic region, and to its limited precipitation, an
average of less than 100 mm/year on 80% in its territory, Jordan has been classified as a dry
country (Nidal Hadadin, 2010, p. 198). Jordan’s climate varies based on the different four
physiographic areas: warm summers and rainy winter in the JRV, moderate summers and
moderate to cool winters in the Highlands, and extremely dry and cold winters and hot summers
in the desert and the plains. Rainfall usually occurs between the months of October and May and
varies in the different areas with less than 200 mm of precipitation per year. In the northwest
quadrant of Jordan, the precipitation is the highest. Also, this quadrant has most of the water
resources of the country (FAO 2015, 2008).
According to Hadadin et al (2010), Jordan’s main water source is from rainfall since the
other water supplies (streams, rivers, and aquifers) have been over-exploited, drained, polluted or
dried out. Approximately 93% of the rainfall evaporates and almost 4% of the remaining water
recharges the groundwater. Jordan’s surface water is comprised of three main rivers: the Jordan,
saline and not suitable for human consumption or irrigation without prior treatment; the Zarqa,
with municipal, industrial and agricultural discharge which is not suitable for domestic or
irrigation uses except during flood periods; and the Yarmouk River, which waters are in better
condition although it also receives municipal wastewater (p. 198).
The Ministry of Water and Irrigation, created in 1988 due to the need for an integrated
water management system, includes the two most important entities dealing with water in
Jordan: the Water Authority of Jordan (WAJ), in charge of water & sewage systems, and the
Jordan Valley Authority (JVA), responsible for the socio-economic development of the Jordan
Rift Valley, including water development and distribution of irrigation (Ministry of Water and
Irrigation). The Ministry generated a report on the water sector: “Jordan Water Sector Facts and

Water Scarcity in the Levant
21
Figures 2013”. The most important indicators for this study are the following: Jordan has 15
surface water basins, 12 ground water basins, and more than 3000 wells; it has 750 mcm of
renewable water from different resources, a supply of 900 mcm/year and a demand of 1200
mcm/year for all sectors; the per capita water supply for all sectors is less than 15% compared to
international standards; 98.5% of the water meets the conformity of Jordan for drinking
consumption; and 40% of water resources are from trans-boundary waters. The tables below
present some of the important information of this report (Ministry of Water and Irrigation).
Table 7 indicates that 60% of the water used is abstracted from groundwater while 40% is
abstracted from surface water. With regards to the use, 54% is used for irrigation, 42% for
domestic consumption, and 4% for industry.
Table 7. Water Uses in 2013 (Million M3)
Uses Surface Water Groundwater Total Volume (MCM)
Domestic 123 257 381
Irrigation 225 250 475
Industry 7 32 39
Others 7 0 7
Total 362 540 902 Source: Jordan Water Sector Facts and Figures 2013
Jordan has a current situation of water deficit which is projected to double by 2030. See
Table 8. The Amman/Zarqa Basin, the most important basins, have had a deficit since 2005, with
a current deficit of 69 mcm/year. See Table 9.
Table 8. Projected Demand and Deficit 2013-2030 (MCM)
Water 2013 2014 2015 2020 2025 2030
Demand 1213 1243 1266 1384 1454 1532
Deficit 312 145 156 254 309 365 Source: Jordan Water Sector Facts and Figures 2013

Water Scarcity in the Levant
22
Table 9. Amman/Zarqa Basin Annual Total Groundwater Abstraction and the Safe Yield
(Million M3) (the most important in Jordan)
Amman-Zarqa
Basin
2005 2006 2007 2008 2009 2010 2011 2012 2013
Irrigation 61 58 63 59 65 64 65 67 64
Drinking Water 81 75 80 83 79 87 88 89 85
Industrial 7 6 7 7 7 8 8 7 7
Total 149 139 150 149 151 159 161 163 156
Safe Yield 88 88 88 88 88 88 88 88 88
Deficit -61 -52 -62 -61 -63 -71 -73 -75 -69 Source: Jordan Water Sector Facts and Figures 2013
The report also suggest that 8 out of 12 of Jordan’s aquifers had a combined deficit of
169.09 mcm in 2013. See Table 10.
Table 10. Groundwater Basin, Safe Yield, Abstraction and Deficit for 2013 (MCM)
Groundwater Basin
Name
Safe Yield Abstraction Deficit
Amman-Zarqa 87.5 156.3 -68.8
Araba North 3.5 6.5 N/A
Araba South 5.5 7.61 -2.11
Azraq 24 58.19 -34.19
Dead Sea 57 79 -22
Disi 125 96.3 28.7
Hammad 8 1.06 N/A
Jafer 27 28.83 -13.63
Jordan Side Valleys 15 29.14 -14.14
Jordan Valley 21 29.37 -8.37
Sirhan 5 1.73 N/A
Yarmouk 40 45.85 -5.85 Source: Jordan Water Sector Facts and Figures 2013
Jordan has a program for wastewater treatment for agricultural use in the Jordan Valley
but as mentioned above, the Zarqa and Yarmouk rivers receive contaminated waters from
industrial, agricultural and municipal wastewaters. Surface waters such as wadis, creeks, rivers
and dams are also affected. The main cause of water contamination is industry and overuse of
pesticides and fertilizers (Nidal Hadadin, 2010, p. 198). Table D shows that Jordan collects 88%

Water Scarcity in the Levant
23
of its wastewater, an equivalent of 72 mcm/year (World Bank, 2009). Another study indicates
that the majority of the wastewater treatment plants in Jordan are located in Irbid, the third
largest city in the country. In 2006, 75% of the treated wastewater was reused and the other 25%
was released into the wadis streaming into the Jordan and the Yarmouk rivers (SFG, 2014).
With regards to water transportation, Jordan built the King Abdullah Canal (KAC) in
1961. The KAC, located in the JRV, is Jordan’s largest irrigation system which is mainly fed by
the Yarmouk River (FAO 2015, 2008). This artificial water canal is one of the main agricultural
and drinking water supplies project for Jordan. The KAC has been extended three times between
1969 and 1987. Originally, the canal had a length of 65 km and today it is 110 km long (William
Alkhoury, 2010).
Another water transport system is the Disi aquifer, the main aquifer in Jordan, which is a
non-renewable sandstone fossil groundwater conveyance system. It is the Middle East’s largest
aquifer of its kind. This 320 kilometers long transboundary aquifer lies beneath the desert along
the boundary between Saudi Arabia and Jordan and has an estimated water yield of 125
mcm/year for the next five decades (FAO 2015, 2008); (Maden, 2013). There is no agreement
between Saudi Arabia and Jordan regarding the use of this aquifer (Maden, 2013).
In July 2013, the Disi Water Conveyance Project was inaugurated. This multi-million-
dinar project plans to pump 100 mcm of water through a 325 kilometer steel pipeline from the
southern Disi aquifer to the capital city, Amman. This project involves the drilling of wells to
extract water from the aquifer as a solution to the pressing water crisis in the country (Namrouqa,
2013). The construction of the project has not been agreed upon with Saudi Arabia, which may
lead to a future problem. On the other hand, the water in the Disi aquifer is not renewable with

Water Scarcity in the Levant
24
only enough water to be pumped for approximately 25 years when it will entirely dry out,
affecting the future generations (Maden, 2013) .
Desalination of water is another important water resource for Jordan. In 2011, Jordan had
36 water desalination facilities with capacity to desalinate 245.963 m3 of water per day: 1.10 %
of seawater, 98.10% of brackish water, and 0.48% of river water. Most of this water, 98.98%,
was for municipal use (IMIDA, 2012).X
Wadi Ma'in, Zara, and Mujib are the main desalination plants in the country (SIGMA,
2015). A strategic but controversial potential plan of seawater desalination in the country is the
Red Sea-Dead Sea Canal Project (also called the two Seas Canal). This ambitious project will be
the world's largest desalination plant and the solution to the water deficit in Jordan for the next
30 years that will also bring water to the disappearing Dead Sea due to the massive diversions of
its main fresh water source, the Jordan River. A desalination plant would be built at the Port of
Aqaba where it would produce 80 mcm of water per year. Israel would buy 50 mcm/year while
Jordan would keep the remainder 30 mcm. The controversy of the project lies with its high cost,
the ongoing political situation and the regional unrest, and the environment since the area is
highly seismic and if the pipe breaks, it could contaminate the grounds with saline water, amidst
the high cost to rebuild the infrastructure. The project is led by the World Bank and was signed
between, Jordan, Israel and the Palestinian Authority in December 2013. Construction is
expected to begin at the end of 2015 although it is uncertain if the project has been funded
(Josephs, 2013); (The Guardian, 2014). The news articles do not mention the water agreed for
the Palestinian Authority, and most likely, it will be purchased by Israel and be distributed by
Israel through its water system already in place.

Water Scarcity in the Levant
25
Jordan and Israel signed a peace treaty on October 26, 1994, at the Arava/Araba Crossing
Point. It was signed by Prime Minister Yitzhak Rabin, for the State of Israel and by Abdul Salam
Majali, Prime Minister for the Hashemite Kingdom of Jordan. In this treaty, Israel and Jordan
set-up the general principles of mutual recognition, sovereignty, territorial recognition and
international boundaries, political independence, security, water, navigation, access to ports, the
development of the Jordan Rift Valley, the environment, economic relations, and refugees,
among other issues. With this treaty, Jordan recovered the land previously occupied by Israel and
guaranteed an evenhanded share of water from the Yarmouk and Jordan rivers (Peacetreaty,
Documents, 1994).
Since the boundaries between Israel and Jordan fall primarily along transboundary water,
and because of the importance of tourism for both regions, the treaty sets the provisions for the
boundaries in Article 3 for the Jordan and Yarmouk Rivers, the Dead Sea, The Emek
Ha’arva/Wadi Araba, and the Gulf of Aqaba.
Article 6 refers to water and the specificities are detailed in Annex II. This article sets the
provisions for the equitable utilization of waters from the Jordan and Yarmouk rivers and ground
waters from the Araba/Arava region, recognizing the shortage of water and the need for
cooperation in the development of new sources of water and to preserve its quality. Annex II of
the treaty stipulates the water allocation, storage, water quality and protection, the conditions for
the use of the groundwaters in Emek Ha’rava/Wadi Arava region, and the guidelines for the
creation of a Joint Water Committee, among other aspects. During the summer and winter, Israel
may extract 12 mcm and 13 mcm from the Yarmouk River respectively; during the winter Jordan
is allowed to store 12 mcm of its water in Lake Tiberias in Israel to then be released back to
Jordan in summer. Annex IV sets-up the provisions for the Environment, in particular, for
Water Scarcity in the Levant
26
cooperation to preserve the ecology and biodiversity of the regions mentioned above
(Peacetreaty, Documents, 1994) & (Treaty Of Peace Between The State Of Israel And The
Hashemite Kingdom Of Jordan, 1994).
According to an article on the Science & Diplomacy on-line publication, the Israel-
Jordan Peace Agreement is seen as an example of successful water agreement and negotiation
regardless the political conflicts and sensitive issues in the region and around water. Both
countries have worked together to improve the water infrastructure to reduce water evaporation
and leakages, and to build storage capacity for Jordan (Susskind, 2012).
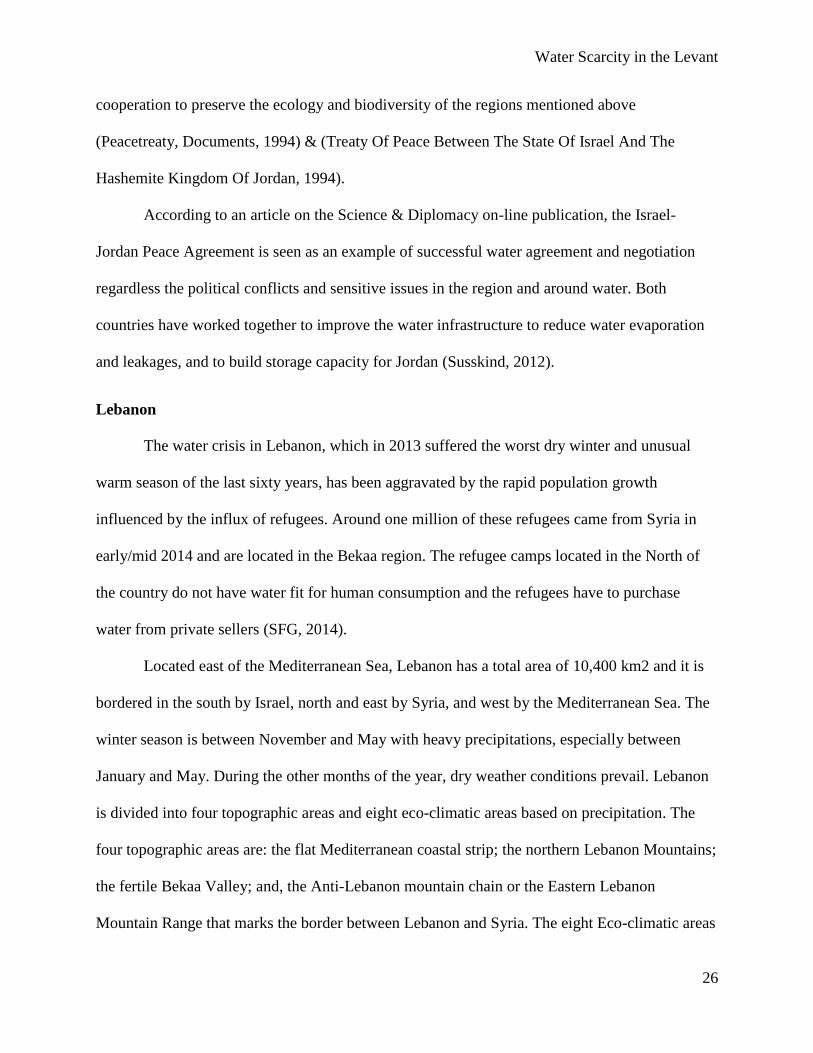
Lebanon
The water crisis in Lebanon, which in 2013 suffered the worst dry winter and unusual
warm season of the last sixty years, has been aggravated by the rapid population growth
influenced by the influx of refugees. Around one million of these refugees came from Syria in
early/mid 2014 and are located in the Bekaa region. The refugee camps located in the North of
the country do not have water fit for human consumption and the refugees have to purchase
water from private sellers (SFG, 2014).
Located east of the Mediterranean Sea, Lebanon has a total area of 10,400 km2 and it is
bordered in the south by Israel, north and east by Syria, and west by the Mediterranean Sea. The
winter season is between November and May with heavy precipitations, especially between
January and May. During the other months of the year, dry weather conditions prevail. Lebanon
is divided into four topographic areas and eight eco-climatic areas based on precipitation. The
four topographic areas are: the flat Mediterranean coastal strip; the northern Lebanon Mountains;
the fertile Bekaa Valley; and, the Anti-Lebanon mountain chain or the Eastern Lebanon
Mountain Range that marks the border between Lebanon and Syria. The eight Eco-climatic areas
Water Scarcity in the Levant
27
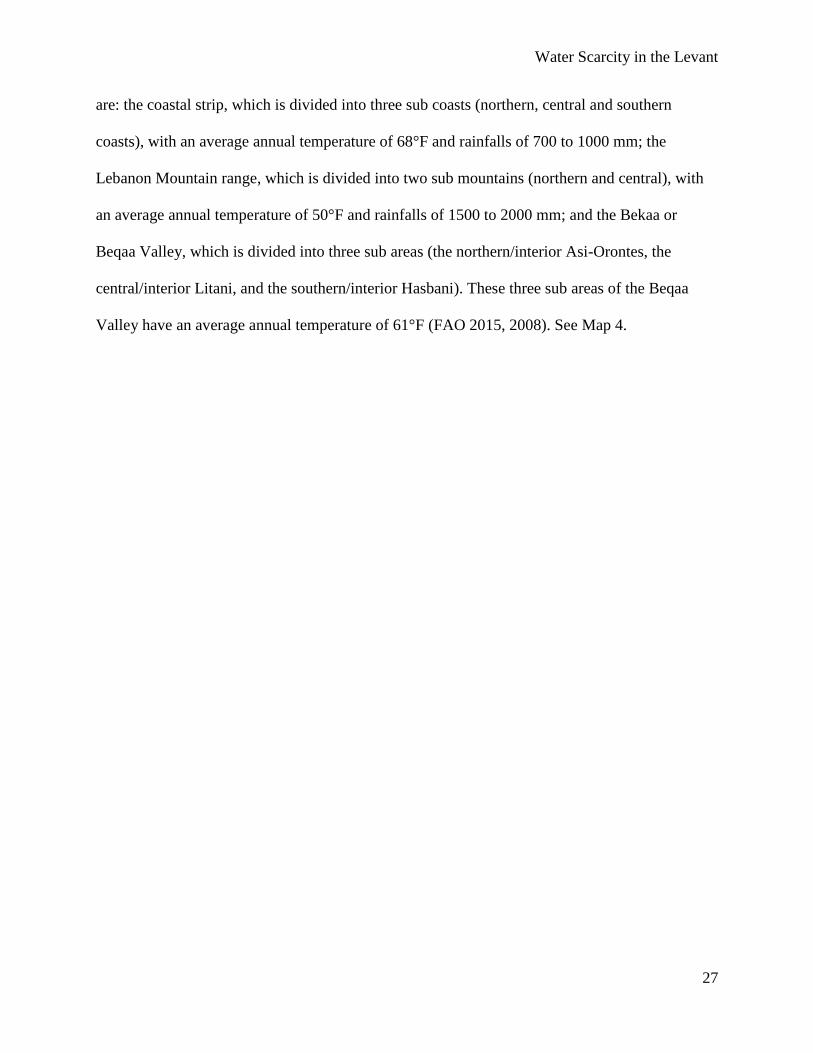
are: the coastal strip, which is divided into three sub coasts (northern, central and southern
coasts), with an average annual temperature of 68°F and rainfalls of 700 to 1000 mm; the
Lebanon Mountain range, which is divided into two sub mountains (northern and central), with
an average annual temperature of 50°F and rainfalls of 1500 to 2000 mm; and the Bekaa or
Beqaa Valley, which is divided into three sub areas (the northern/interior Asi-Orontes, the
central/interior Litani, and the southern/interior Hasbani). These three sub areas of the Beqaa
Valley have an average annual temperature of 61°F (FAO 2015, 2008). See Map 4.

Water Scarcity in the Levant
28
Map 4. Lebanon’s Geographical Map, 2008. Source: AQUASTAT. Retrieved January 31, 2015,
from
http://www.fao.org/nr/water/AQUASTAT/countries_regions/LBN/LBN-map_detailed.pdf

Water Scarcity in the Levant
29
Lebanon has a total population of 5,882,562 million (CIA, 2014). In 2006, 100% of the
population had access to drinking water (WHO/UNICEF, 2014). Regarding the water supply and
demand, through 2010, from a total of 1,589 mcm produced, 705 mcm or 44% of the water
consumed came from groundwater, 649 mcm or 41% from surface water, and 235 mcm or 15%
from dams. The total demand estimated in 2010 was of 1,515 mcm/year: 158 mcm or 11% for
industrial use, 810 mcm or 55% for agricultural use, and 505 mcm or 34% for domestic
consumption. With a population of 4.5 million, the per capita consumption was of 180 liters/day.
(UNESCWA, 2012, pp. 9-13). See Table A.
With regards to water resources, Lebanon has a total of 135 rivers and springs, and 668
wells (UNESCWA, 2012, p. 16). Its geological conditions (high mountains and remote valleys)
make the construction of storage dams difficult. Moreover, Lebanon’s higher elevation
(compared to its neighbors) makes the incoming surface water flow practically nonexistent. The
major water renewal comes from precipitation, snowmelt, and springs. The Mediterranean
coastal strip has about twelve permanent small rivers. The hydrographic system in Lebanon can
be divided into five areas. The first three areas, of which the corresponding basins cover
approximately 45% of Lebanon and include the three main rivers are: in the north, the Asi-
Orontes Basin; in the southeast, the Hasbani Basin; and in the east and south, the Litani Basin
(the longest river in Lebanon). The other two areas are: the coastal river basins which include the
El Kebir River Basin; and all the small and isolated surface stream flows (FAO 2015, 2008).
The aquifers have a total estimated volume of 1360 million m3 of water. These aquifers
are fed by snowmelt and rainwater (FAO 2015, 2008). Lebanon has about 2000 major springs
that produce an estimated flow of 1,150 mcm/year. These springs are usually located in the
submarine area or along the coast. Despite the difficulty of building dams, Lebanon has a few.

Water Scarcity in the Levant
30
The Qaraoun Reservoir is the largest artificial lake in the country. It is located on the Upper
Litani River in the southern region of the Bekaa Valley and it has a total capacity of around 220
million m3. The Shabrouh or Faraya-Chabrouh Dam is another Lebanon’s artificial reservoir
inaugurated in 2007 with a capacity for storing 8 million m3 of water (FAO 2015, 2008).
According to the National Water Sector Strategy of 2010 by the Lebanese Ministry of
Energy and Water, Lebanon groundwater aquifers are overexploited, in particular in Beirut,
Tripoli, South Lebanon and the Bekaa region. From the 500 mcm/year naturally replenished
water, 700 mcm/year are abstracted, producing a deficit of 200 mcm/year. To cover for this
deficit, the government is studying the possibility of an artificial recharge (Bassil, 2010)
Lebanon suffers contamination of its groundwater with high concentrations of chloride
mainly due to pesticide residues and fertilizers, in particular in the Bekaa Valley region, and
sodium, due to the over-extraction of water and the consequent intrusion of seawater (SFG,
2014).
According to the IMIDA report, by 2011, Lebanon had 13 water desalination facilities
with a capacity to desalinate 29.125 m3 of water per day: 90.6 % of seawater and 9.39% of
brackish water. The desalinated water is distributed in hydropower use, 65.81%, municipal use
31.29%, and tourism and industry 2.88% (IMIDA, 2012).
Because Lebanon lacks water treatment plants, the national water reform of 2012 gave
priority to these efforts (UNESCWA, 2012). A World Bank assessment of 2009 had reported that
only 2% of Lebanon’s wastewater is collected, producing just 4 mcm of treated water per year
(World Bank, 2009), and a report on hydro-insecure basins in the Middle East reported that in
the Bekaa region, 70% of wastewater was dumped without treatment, polluting the groundwaters
(SFG, 2014). See Table D Sewerage and Wastewater Treatment.

Water Scarcity in the Levant
31
The Syrian Arab Republic
The Syrian Arab Republic has a total area of 185,180 km2 and is bordered by Turkey in
the north, Jordan in the south, Lebanon and the Mediterranean Sea in the west, Iraq in the east
and southeast, and Israel to the southwest. It has four main physiographic areas: the coastal
region, the mountains and the highlands, the plains or interior, and the Badiah and the desert
plains (FAO 2015, 2008). See Map 5.

Water Scarcity in the Levant
32
Map 5. Syrian Arab Republic’s Geographical Map, 2008. Source: AQUASTAT
Retrieved January 31, 2015, from
http://www.fao.org/nr/water/AQUASTAT/countries_regions/SYR/SYR-map_detailed.pdf

Water Scarcity in the Levant
33
The climate in the Syrian Arab Republic is warm, with dry summers and cool, rainy
winters. The daily temperature varies between the interior and the coastal region. The average
annual precipitation in Syria is 252 mm unevenly distributed in the country, with a smaller
amount of precipitation in the northwest (from 100 to 150 mm) and more in the mountains (1400
mm) (FAO 2015, 2008).
Syria has a total estimated population of 17,951 million (CIA, 2014). In 2006, 89% of the
population had access to drinking water. Between 2012 and 2014, only 87% of the population
had access to drinking water sources (WHO/UNICEF, 2014). See Table A.
Syria’s water resources are derived from a number of sources including: precipitation,
snowfall, internal renewable surface water, and groundwater. Almost all the main groundwater
and surface water resources are contaminated by industrial and urban wastewater (FAO 2015,
2008).
Syria has seven main hydrographic basins: 1) Al Jazeera; 2) Aleppo and its sub-basins:
Al Jabbool and Quaick; 3) Al Badia and its sub-basins: Al Rassafa, Assabe’biar, Al Talf, Al Zelf,
Khanaser, Palmyra, and Wadi el Miah; 4) Al Yarmook or Horan.; 5) Damascus; 6) Asi-Orontes;
and, 7) Al Sahel. Furthermore, it has 16 main rivers, of which six are major international rivers,
with an estimated 28.515 km3/year of natural average surface runoff (FAO 2015, 2008). These
six major international rivers are The Euphrates or Al Furat, which is the largest river in the
country (680 km); it originates in Turkey and flows through Syria into Iraq; The Afrin, which
originates in Turkey, crosses Syria on the northwest of the country, turns south and reenters into
Turkey; The Asi-Orontes, which flows from Lebanon into Syria on the northeast; The Yarmouk,
located in the southwestern part of Syria, which marks the border between Jordan and Syria and
flows into the Jordan River; The El-Kabir which marks the border between Lebanon and Syria,

Water Scarcity in the Levant
34
and ends in the sea; and The Tigris, which marks the border between Turkey and Syria and has a
total annual flow of 18 km3 (Reem, 2007). The country heavily depends on the water of the
Euphrates--more than half of the water (65%) used in Syria is taken from its basin (UN-
ESCWA- BGR, 2013b)X. This river is in risk of reduction in its flow rates in recent years due to
decades of poor water management, lack of coordination between Turkey and Syria concerning
the river flow, and abandonment of water infrastructure of the river (Shamout, 2014). Among
Syria’s main lakes are: Al-Assad, the largest (674 km2), Jabbul, Qattineh, Autayba, Khatunieh,
Mzereeb, Al-Baath, and Masada, which is the smallest (1 km2) (Berndtsson, 2011, p. 96).
Syria’s main groundwater aquifer systems are the Anti-Lebanon Mountains or the
Eastern Lebanon Mountain Range that marks the border between Lebanon and Syria, and the
Alouite Mountains in the northwestern side of the country. These aquifer systems are recharged
by rainfall in the mountainous regions. The Damascus plain aquifer is another important aquifer
system in the south and east of Syria (FAO 2015, 2008). The total groundwater source from its
seven basins hold a total of 4811 mcm (SFG, 2014).
Syria has 141 dams with a storage capacity of 15,800 mcm (SFG, 2014); the largest and
longest being the Al Tabka dam on the Euphrates. Its construction led to the formation of the Al
Assad Lake that is the largest water reservoir in Syria. The majority of the medium-size dams are
located in the western part of Syria, which provide all the drinking water to Aleppo, the largest
city in the country (FAO 2015, 2008); (Shamout, 2014)X. Aleppo has the major water structure,
the Tishrin Dam with a capacity of 1.9 bcm. The country produces 1.2 bcm of drinking water.
About 30% of the water is lost due to evaporation and lack of infrastructure (SFG, 2014). Some
of these dams are Al Rastan, the Mouhardeh, the Qattinah, and the Taldo (FAO 2015, 2008).

Water Scarcity in the Levant
35
In 2003, most of the consumption of water was from the agricultural sector (87%). The
remaining 13% was distributed between municipal (9%) and industrial purposes (4%) (World
Bank, 2015). Regarding the water source, in 2003, 84% of the water consumed came from
surface water and groundwater. The remaining 16% was divided between reused agriculture
drainage treated water (13%) and reused treated waste water (3%) (FAO, 2008). In 2011, the
total renewable water resources was 16.8 cu km /year and the domestic water consumption per
capita was 767 cubic meters/year (CIA, 2014; FAO, 2015). See Table 4.
A more recent study in 2011 published at Air, Soil and Water Research, indicates that in
Syria, 44% of its population is suffering from “water insecurity.” The study yields a total water
deficit of 1,653 mcm for 2010, down to 453 mcm for 2050. The available water in 2010 for a
population of 21.15 million was 17,507 mcm, the demand was 17,306, and the evaporation 1,854
mcm, whereas the daily per capita consumption was 163 lpcd (Berndtsson, 2011, p. 98).
Sewerage and Wastewater Treatment. In Syria, 57-67% of its wastewater is collected,
producing 550 mcm of treated water per year (World Bank, 2009). See Table D . The 2011 study
presents different figures: as of 2008, the reclaimed water was approximately 2,306 mcm for
agriculture, or 15% of the water consumed in that sector, 671 mcm for domestic use or 55%, and
407 mcm, or 65%. Overall, both surface and groundwater in Syria are affected in quality and
quantity due to the lack of water treatment plants and bad agricultural practices (Berndtsson,
2011, p. 96).
With regards to water desalination, as of 2011, Syria had 8 desalting plants with a total
capacity of 7.893 m3/day plus 6 desalting plants, with a total capacity of 6.088 m3/day. The
estimated water desalination capacity is 13.981 m3/day, or less than 0,02 % of the renewable
water resources of the country according to the report conducted by IMIDA. The desalinated

Water Scarcity in the Levant
36
water production is mainly formed of brackish water 97.14 %, 280 m3/day of seawater, 2.00 %;
and 120 m3/day of river water, 0.86 % (IMIDA, 2012)
Climate Change and Water Security Implications
A study about Climate Change in the Arab World conducted by UNESCO in 2009,
assessed that resource management and population growth in a conflict context are more critical
to the water scarcity situation in the Middle East than climate change. The Middle East has been
the most water-stressed region in the world. Crises over water have increased in frequency in the
last two decades in Syria, Lebanon, Israel, Jordan, and the Palestinian territories. In fact, in 2008,
the last three countries each had their third water emergency since 1990 (Trondalen, 2009).
The scientific community has observed trends in temperature and sea-level increase, ice
and snow cover decrease, and different patterns of rainfall in the area. If these trends continue,
the Middle East will face saltwater intrusion and increased erosion. It will also face changes on
marine ecosystems, reduced freshwater storage and supply, floods, droughts, and changes in
vegetation. This situation can be intensified by the over abstractions of water. The aridity trends
may result in reduction of up to 20% to 25% of precipitation accompanied by temperature
increases of between 2 °C and 2.75 °C in Syria, Jordan and Israel by 2050.
The availability of water in the area is already extremely sensitive due to environmental
changes such as the decrease in precipitations and snowfall. Water is vulnerable to climate
change. Water decrease in quantity and quality would have a severe impact in the political
stability and in the economic and the social development in the Middle East. Poor populations
are the most vulnerable to face mass migration due to water shortages and the rising of sea
levels. Moreover, climate change could impact the water resources that would have a direct
effect on agricultural production. Rural economy and agriculture are important elements in the

Water Scarcity in the Levant
37
socioeconomic aspects of the Middle East. Approximate 88% of the economically active
population is employed in the agricultural sector, where the majority of the water is consumed.
This decline in agricultural production could lead also to economic and political conflict,
internally and across borders. The current and future global climate change would affect the
stability and management of the water in this already ‘conflict’ susceptible area; and may fuel
old tensions aggravating the current international disputes, exacerbating or creating new
international crisis and conflicts over water (Trondalen, 2009).
Conclusion
In an area where undesirable climate and soil characteristics are detrimental to the
availability and quality of water, the internal and cross-border conflicts, with the addition of an
estimated population growth of 20% by the year 2020 (GEOHIVE, 2015) makes this region
extremely vulnerable to human security-related issues. See Table E for population figures per
country.
The studied countries present similar challenges and problems: decrease in precipitation
and droughts; saline water; depletion of aquifers; water pollution due to inefficient agricultural
practices (excessive use of fertilizers and pesticides), over-extraction of water and intrusion of
seawater (Gaza and Lebanon in particular), and lack of wastewater treatment plants (except for
Israel); poor water management; poor joint management of transboundary waters, population
growth including refugees and internally displaced persons (except for Israel), and internal and
international political conflicts.
Some general solutions that could be taken into consideration would be to: implement
and/or increase the use of desalination plants; incorporate efficient agricultural practices; develop
a broader wastewater treatment plan; improve cooperation in the management of transboundary

Water Scarcity in the Levant
38
waters, implementing measures to ensure water sustainability for the riparian countries; and
work on a political solution to the internal unrest in Syria, a socio-political and military solution
for the IS phenomenon in Iraq and Syria; and a diplomatic solution to the Israeli-Palestinian,
Israeli-Arab conflict.
According to this study and the presented facts, the most affected country/territory is
Jordan, due to the aridity of its land, where 90% of its population lives on 10% of its territory
and the decrease in rainfall recharge makes water extremely scarce, with the addition of the
inflows of refugees from the conflicts in Syria, Gaza, and Iraq. The second most at risk territory
is the Palestinian West Bank and Gaza Strip, where the aquifers have been depleted and the lack
of surface water, technology and electrical power makes the availability of water very
challenging. The addition of the protracted conflict with Israel makes this situation even more
difficult. Palestinians have the alternative to buy water from Israel, but at an expensive cost.
Syria is the third country at risk: it is in hostilities with Israel on the Golan Heights, an important
source of water before the Israeli occupation of it upon the 1967 war. It also has some frictions
with Turkey over a dam being built by Turkey in the upstream stretches of the Euphrates River,
the main source of water for Syria. As well, besides the internal political turmoil since 2011,
Syria has the challenge of the Islamic State in the North and in the border with Iraq where water
has been used as a control tool. Lebanon is in 4th place; it is a smaller country that has a more
humid climate and the Mediterranean Sea as an option to develop a strong desalination program.
Lastly, Israel, once a country at high risk in water terms, has dealt with water scarcity through a
well-developed and planned strategy of desalination and conveyance to supply about 75% of its
population. In a hopeful spirit, water scarcity in the region could bring cooperation through
Water Scarcity in the Levant
39
technology transfer from Israel to its neighbors and help develop a water safe, more ‘peaceful
and human secure’ Levant region.

Water Scarcity in the Levant
40
Appendix 1
Tables
Table A. Key Statistics by Country
(1) Overlap between surface water and groundwater
(2) Israel Total available water by source and Consumption by type- State of Israel Water Authority - 2012
(3) Percentage of population access to safe water WHO/UNICEF JMP, 2014
(4) Availability per capita Cubic meters- World Bank 2014
(5) Total available water by source (except Israel) and Consumption by type (except Israel and Jordan) – FAO 2008
(6) Jordan Water Sector Facts and Figures 2013
(7) UNESCWA (2012)
Key Statistic
Countries
Total available water by source (5)
Consumption by type (5)
Annual recharge
rates by type of water
source
Availability
per capita
Cubic
meters
(4)
Percentage
of
population
access to
safe water
(3)
Surface
River
and Lake
Groundwater
Aquifer
Desali-
nation
Waste
Water
Recycling
Ind.
Agric.
Domestic
Surface
River
and
Lake
Ground-
water
Aquifer
Israel (2)
80%
7%
13%
6.7%
58%
35.3%
1.78 km 3 /year
230
100%
0.55
1.22
The Palestinian
Territories
Includes Gaza
and the West
Bank
0%
98%
0%
2%
7%
45%
48%
0.84 km 3 /year
193
81.8%
0.087
0.75
Syria
84%
0%
16%
13%
drained,
3% waste
4%
88%
9%
16.8 km 3 /year Overlap 2 (1)
767
87%
12.63
6.17
Jordan
31%
59%
1%
9%
4% (6)
54% (6)
42% (6)
0.94 km 3 /year Overlap 0.25 (1)
154(5)
91%
0.65
0.54
Lebanon
30.2%
53.4%
3.6%
12.8%
12.6 %
drained
0.2 % waste
11% (7)
55% (7)
34% (7)
4.5 km 3 /year Overlap 2.5 (1)
933.8
100%
3.8
3.2

Water Scarcity in the Levant
41
Table B. List of Main Shared Rivers
Source: UN-ESCWA; BGR, 2013
Shared river
Riparian
countries
Basin Areas Shares
Mean Annual Flow Volume
Comments
Euphrates River
Iraq, Syria, Turkey
Iraq 47%, Jordan 0.03%, Saudi Arabia 2.97%, Syria 22%,
Turkey 28%
Before damming (1930-1973): ~30 BCM After damming (1974-2010): ~25 BC
- Longest river in Western Asia.
Jordan River
Israel, Jordan,
Lebanon, Palestine,
Syria
Israel 10%, Jordan 40%,
Lebanon 4%, Palestine 9%,
Syria 37%
Natural conditions (1950s) Upper Jordan
River: 605 MCM Yarmouk River: 450-
500 MCM Lower Jordan River: 1,300 MCM
Current conditions Upper Jordan River: 616 MCM Yarmouk River: 83-99 MCM
Lower Jordan River: 20-200 MCM
-Palestine and Syria have no access to the
JR.
- Quality of water has severely deteriorated
in recent decades.
-Water quality in the Lower Jordan River is very low
Yarmouk River
Syria, Jordan, and Israel.
Syria 77), Jordan 22% ,and Israel(1%
*Range between 450 and 500 MCM *The mean annual flow dropped from 156
MCM for the period 1963-1984 to 83
MCM for the period 1985-2006
- Basin of the largest Jordan River tributary
Orontes River
Lebanon, Syria,
Turkey
Lebanon 8%, Syria
67%,Turkey 25%
1,200 MCM with negative trends
- The only permanent river in Western Asia
Nahr el Kabir
Alternative names:
Nahr el-Kebir or
simply as
the Kebir.
Lebanon, Syria
Lebanon 26%, Syria 74%
377 MCM
-Natural border between northern Lebanon and Syria.
-The river is severely polluted by widespread discharge of untreated sewage
and solid waste disposal.

Water Scarcity in the Levant
42
Table C. List of Main Shared Aquifers
Source: UN-ESCWA; BGR, 2013
Shared aquifer
system
Riparian countries
Renewability
Comments
Anti-Lebanon
Lebanon, Syria
Medium to high (20 - >100 mm/yr)
-Local abstractions and contamination in catchments may impact quantity and
quality of discharge.
Western Aquifer
Basin
Alternative names:
Palestine: Western
Mountain Aquifer,
Ras al Ain-Timsah
Aquifer
Israel: Yarkon-
Taninim Aquifer
Egypt, Israel, Palestine
Low to medium (2-100 mm/yr)
-Very good quality of water.
-The most productive water basin in Israel and Palestine.
-Key resource by Israelis and Palestinians.
Abstraction and Control: ~390 mcm/year
Israel controls 100% of the aquifer and abstracts 368.7 mcm/year or 94% (1970-
2008)
Palestinians abstract 23.7 mcm or 6% (1995-2011)
Coastal Aquifer
Basin
Egypt, Israel, Palestine
Medium to high (20 - >100 mm/yr)
-Fresh to brackish water -Over-abstraction resulting in lowering of the water and seawater intrusion;
pollution from sewage, agricultural runoff.
-The aquifer in the Gaza Strip is severely threatened by over-abstraction and pollution.
-The Gaza Strip depends almost entirely on the Coastal Aquifer Basin for its
water supply.
Abstraction: ~620-740 mcm/year
Israel 400-480 mcm/year or about 66%
The Gaza Strip 150-180 mcm/year or 23%
Egypt about 70-80 mcm/year or 11%.
Basalt Aquifer
System (West):
Yarmouk Basin
Jordan, Syria
High
- Mainly fresh water
-Over-exploitation of groundwater, reduced spring flow
- local groundwater pollution
Basalt Aquifer
System (South):
Azraq-Dhuleil Basin
Jordan, Syria
South: medium
North: high
-Mainly fresh, brackish water in some areas.
-Groundwater level decline and salinization due to over-abstraction

Water Scarcity in the Levant
43
Table D. Sewerage and Wastewater Treatment for the target countries/territories
Country
Sewerage rate (%)
Treatment
rate
(% collected)
Volume treated
(mcm/yr)
Type of
treatment
Notes
Urban Overall
Jordan 70 50 88 72 Secondary Lagoons and activated sludge;
overloading frequent
Lebanon 40 2 4 Secondary Planning treatment and reuse around
Beirut and Ba’albeck treatment plant
(tertiary)
Syria 96 71 57–67 550 Secondary Activated sludge, lagoons
Significant dumping of untreated
waste; Damascus upgrade for reuse
of tertiary-treated effluents
West Bank and
Gaza
25 23 34–54 14–24 Primary;
secondary
Sludge drying beds, ponds, frequent
overloading, O&M problems
Israel 92–95 79 296 Secondary;
some tertiary
Ponds, activated sludge, natural
filtration + recharge
Source: World Bank, 2009
Table E. Population in the Levant: 2010 and 2020
Country 2010 2020
Increase
%
Israel 7,420,368 8,507,223 14.65%
Jordan 6,454,554 8,086,739 25.29%
Lebanon 4,341,092 4,877,218 12.35%
Syria 21,532,647 25,735,631 19.52%
P. Territory 4,012,880 5,139,917 28%
Total 43,761,541 52,346,728 19.96% Source: GEOHIVE, 2015

Water Scarcity in the Levant
44
Appendix 2 – Agreements
THE ISRAELI-PALESTINIAN INTERIM AGREEMENT ON THE WEST BANK AND THE
GAZA STRIP, Annex III - Protocol Concerning Civil Affairs - 28 Sep 1995
ARTICLE 40
Water and Sewage
Paragraph 7. In this framework, and in order to meet the immediate needs of the Palestinians in
fresh water for domestic use, both sides recognize the necessity to make available to the
Palestinians during the interim period a total quantity of 28.6 mcm/year, as detailed below:
a. Israeli Commitment:
(1) Additional supply to Hebron and the Bethlehem area, including the construction of the
required pipeline - 1 mcm/year.
2) Additional supply to Ramallah area - 0.5 mcm/year.
(3) Additional supply to an agreed take-off point in the Salfit area - 0.6 mcm/year.
(4) Additional supply to the Nablus area - 1 mcm/year.
(5) The drilling of an additional well in the Jenin area - 1.4 mcm/year.
(6) Additional supply to the Gaza Strip - 5 mcm/year.
(7) The capital cost of items (1) and (5) above shall be borne by Israel.
b. Palestinian Responsibility:
(1) An additional well in the Nablus area - 2.1 mcm/year.
(2) Additional supply to the Hebron, Bethlehem and Ramallah areas from the Eastern Aquifer or
other agreed sources in the West Bank - 17 mcm/year.
(3) A new pipeline to convey the 5 mcm/year from the existing Israeli water system to the Gaza
Strip. In the future, this quantity will come from desalination in Israel.
(4) The connecting pipeline from the Salfit take-off point to Salfit.
(5) The connection of the additional well in the Jenin area to the consumers.
(6) The remainder of the estimated quantity of the Palestinian needs mentioned in paragraph 6
above, over the quantities mentioned in this paragraph (41.4 - 51.4 mcm/year), shall be
developed by the Palestinians from the Eastern Aquifer and other agreed sources in the West
Bank. The Palestinians will have the right to utilize this amount for their needs (domestic and
agricultural).
SCHEDULE 10
Data Concerning Aquifers
Pursuant to Article 40, paragraph 20 and Schedule 8 paragraph 1 of this Appendix:
The existing extractions, utilization and estimated potential of the Eastern, North-Eastern, and
Western Aquifers are as follows:
Eastern Aquifer:
- In the Jordan Valley, 40 mcm to Israeli users, from wells;

Water Scarcity in the Levant
45
- 24 mcm to Palestinians, from wells;
- 30 mcm to Palestinians, from springs;
- 78 mcm remaining quantities to be developed from the Eastern Aquifer;
- Total = 172 mcm.
North-Eastern Aquifer:
- 103 mcm to Israeli users, from the Gilboa and Beisan springs, including from wells; - 25 mcm
to Palestinian users around Jenin; - 17 mcm to Palestinian users from East Nablus springs;
- Total = 145 mcm.
Western Aquifer:
- 340 mcm used within Israel;
- 20 mcm to Palestinians;
- 2 mcm to Palestinians, from springs near Nablus,
- Total= 362 mcm.
All figures are average annual estimates.
The total annual recharge is 679 mcm.

Water Scarcity in the Levant
46
Bibliography Bassil, E. G. (2010). National Water Sector Strategy : A right for every citizen, a resource for the whole
country. Beirut: Ministry of Energy and Water.
Berndtsson, K. A. (2011). Syrian Water Resources between the Present and the Future. Air, Soil and
Water Research(4), 93-100. doi:10.4137/ASWR.S8076
CIA. (2014). The World Factbook. Retrieved from Central Intelligence Agency :
https://www.cia.gov/library/publications/the-world-factbook/geos/jo.html
FAO 2015. (2008). Israel. Retrieved from Aquastat, Food and Agriculture Organization of the United
Nations (FAO): http://www.fao.org/nr/water/aquastat/countries_regions/ISR/index.stm
FAO 2015. (2008). Jordan. Retrieved from Aquastat, Food and Agriculture Organization of the United
Nations (FAO): http://www.fao.org/nr/water/aquastat/countries_regions/JOR/index.stm
FAO 2015. (2008). Lebanon. Retrieved from AQUASTAT, Food and Agriculture Organization of the United
Nations (FAO): http://www.fao.org/nr/water/aquastat/countries_regions/LBN/index.stm
FAO 2015. (2008). Occupied Palestinian Territory. Retrieved from Aquastat, Food and Agriculture
Organization of the United Nations (FAO):
http://www.fao.org/nr/water/aquastat/countries_regions/PSE/index.stm
FAO 2015. (2008). Syrian Arab Republic. Retrieved from AQUASTAT - Food and Agriculture Organization
of the United Nations (FAO):
http://www.fao.org/nr/water/aquastat/countries_regions/SYR/index.stm
Gavriel Weinberger, Y. L. (2012). The Natural Water Resources Between The Mediterranean Sea And The
Jordan River. Jerusalem: Israel Hydrological Service.
GEOHIVE. (2015). Countries. Retrieved from GEOHIVE: http://www.geohive.com/cntry/
IFAD. (n.d.). Rural Poverty Portal. Retrieved from Rural Poverty in Jordan:
http://www.ruralpovertyportal.org/country/home/tags/syria
IMIDA. (2012). Report on Water Desalination Status in the Mediterranean Countries. Retrieved from
IMIDA - Instituto Murciano de Investigacion y Desarrollo Agrario y Alimenatrio:
http://www.imida.es/docs/publicaciones/06_REPORT_ON_WATER%20DESALINATION.pdf
Israel Water Authority. (2012b). Water Sector in Israel: IWRM Model. Retrieved from Israel Water
Authority: http://www.water.gov.il/Hebrew/ProfessionalInfoAndData/2012/02-
Israel%20Water%20Sector%20-%20IWRM%20Model.pdf
Josephs, J. (2013). Green Light for Red-Dead Sea Pipeline Project. Retrieved from Water World:
http://www.waterworld.com/articles/wwi/print/volume-28/issue-6/technology-case-
studies/water-provision/green-light-for-red-dead-sea-pipeline-project.html
Maden, D. T. (2013, July 28). Disi Water Conveyance Project in Jordan. Retrieved from Todays Zaman:
http://www.todayszaman.com/orsam_disi-water-conveyance-project-in-jordan_322014.html

Water Scarcity in the Levant
47
Mekorot. (a). The National Water Carrier. Retrieved from Mekorot; Israel National Water Co.:
http://www.mekorot.co.il/Eng/newsite/Projects/NWC/Pages/TheNationalWaterCarrier.aspx
Mekorot. (b). The New National Water Carrier. Retrieved from Mekorot; Israel National Water Co.:
http://www.mekorot.co.il/Eng/newsite/Projects/TheNewNationalWaterCarrier/Pages/TheNew
NationalWaterCarrier.aspx
Mekorot. (c). Desalination. Retrieved from Mekorot; Israel National Water Co.:
http://www.mekorot.co.il/Eng/newsite/Solutions/Desalination/Pages/default.aspx
Mercy Corps. (2014). Tapped Out: Water scarcity and refugee pressures in Jordan. Retrieved from Mercy
Corps: http://www.mercycorps.org/research-resources/tapped-out-water-scarcity-and-refugee-
pressures-jordan
Ministry of Foreign Affairs of Israel . (1995, September 28). Retrieved from The Israeli-Palestinian Interim
Agreement-Annex III:
http://www.mfa.gov.il/mfa/foreignpolicy/peace/guide/pages/the%20israeli-
palestinian%20interim%20agreement%20-%20annex%20iii.aspx#app-40
Ministry of Water and Irrigation. (n.d.). Ministry of Water and Irrigation. Retrieved from Ministry of
Water and Irrigation: http://mwi.gov.jo/sites/en-us/default.aspx
Namrouqa, H. (2013, July 17). King inaugurates Disi water project. Retrieved from The Jordan Times:
http://jordantimes.com/king-inaugurates-disi-water-project
Nidal Hadadin, M. Q. (2010). Water Shortage in Jordan - Sustainable Solutions. ELSEVIER, 197-202.
OCHAoPt. (2014, March). Fragmented Lives: Humanitarian Overview 2013. Retrieved from United
Nations Office for the Coordination of Humanitarian Affairs occupied Palestinian territory:
http://www.ochaopt.org/documents/ocha_opt_annual_review_2014.pdf
OCHAoPt. (2015, March). Fragmented Lives: Humanitarian Overview 2014. Retrieved from United
Nations Office for the Coordination of Humanitarian Affairs occupied Palestinian territory:
http://www.ochaopt.org/documents/annual_humanitarian_overview_2014_english_final.pdf
Palestinian Central Bureau of Statistics (PCBS). (2012). PCBS - Population 2012. Retrieved from State of
Palestina - Palestinian Central Bureau of Statistics (PCBS):
http://www.pcbs.gov.ps/Portals/_pcbs/PressRelease/int_Pop_2012e.pdf
PASSIA. (2009). Water and Environment. Retrieved from PASSIA - Palestinian Academic Society for the
Study of International Affairs: http://www.passia.org/palestine_facts/pdf/pdf2009/Water-
Environment.pdf
Peacetreaty, Documents. (1994, October 26). Retrieved from King Hussein :
http://www.kinghussein.gov.jo/peacetreaty.html
Reem, A. R. (2007, March 21). Water Demand Management in Syria. Retrieved from MedWet - The
Mediterranean Wetlands Initiative: http://medwet.org/2007/04/zaragoza19-21-march-2007/

Water Scarcity in the Levant
48
SFG. (2014). The Hydro-Insecure: Crisis of Survival in the Middle East. Mumbai: Strategic Foresight
Group. Retrieved from http://www.strategicforesight.com/publication_pdf/19317hydro-
insecure.pdf
Shamout, N. (2014, June 24). Syria Faces an Imminent Food and Water Crisis. Retrieved from Chatam
House, The Royal Institute of International Affairs:
http://www.chathamhouse.org/expert/comment/14959
SIGMA. (2015). Wadi Ma'in Zara and Mujib Water Treatment and Conveyance System . Retrieved from
SIGMA: http://sigma.jo/portfolio/infrastructure/highway_road_transport/62
Susskind, S. I. (2012, August 22). Water Diplomacy: Creating Value and Building Trust in Transboundary
Water Negotiations. Retrieved from Science & Diplomacy:
http://www.sciencediplomacy.org/perspective/2012/water-diplomacy
Tenne, A. (2010). Sea Water Desalination in Israel: Planning, coping with difficulties, and economic
aspects of long-term risks. Retrieved from Water Authority:
http://www.water.gov.il/hebrew/planning-and-
development/desalination/documents/desalination-in-israel.pdf
The Guardian. (2014). Jordan hopes controversial Red Sea Dead Sea project will stem water crisis.
Retrieved from The Guardian: Cities: http://www.theguardian.com/global-
development/2014/mar/20/jordan-water-red-sea-dead-sea-project
Treaty Of Peace Between The State Of Israel And The Hashemite Kingdom Of Jordan. (1994, October 26).
Retrieved from Israel Ministry of Foreign Affairs:
http://www.israel.org/MFA/ForeignPolicy/Peace/Guide/Pages/Israel-
Jordan%20Peace%20Treaty.aspx
Trondalen, J. M. (2009). Climate Changes, Water Security and Possible Remedies for the Middle East.
Paris: United Nations Educational, Scientific and Cultural Organization.
UN-ESCWA - BGR. (2013c). Inventory of Shared Water Resources in Western Asia: Coastal Aquifer Basin
(On-line Version). Beirut: UN-ESCWA and BGR (United Nations Economic and Social Commission
for Western Asia; Bundesanstalt für Geowissenschaften und Rohstoffe). Retrieved from
http://waterinventory.org/groundwater/coastal-aquifer-basin
UN-ESCWA - BGR. (2013d). Inventory of Shared Water Resources in Wetersn Asia: Western Aquifer Basin
(On-line Version). Beirut: UN-ESCWA and BGR (United Nations Economic and Social Commission
for Western Asia; Bundesanstalt für Geowissenschaften und Rohstoffe). Retrieved from
http://waterinventory.org/sites/waterinventory.org/files/chapters/Chapter-19-Western-
Aquifer-Basin-web.pdf
UNESCWA. (2012). Water in Lebanon: Strategic Management Data National Assessment Matrix. United
Nations Economic and Social Commission for Western Asia. Retrieved from
https://unstats.un.org/unsd/envaccounting/workshops/Beirut2012/Beirut2012-11.PDF
UN-ESCWA- BGR. (2013a). Inventory of Shared Water Resources in Western Asia: Jordan River Basin (On-
line Version). Beirut: UN-ESCWA and BGR (United Nations Economic and Social Commission for

Water Scarcity in the Levant
49
Western Asia; Bundesanstalt für Geowissenschaften und Rohstoffe). Retrieved from
http://waterinventory.org/sites/waterinventory.org/files/chapters/chapter-06-jordan-river-
basin-web.pdf
UN-ESCWA- BGR. (2013b). Inventory of Shared Water Resources in Wetersn Asia: Euphrates River Basin
(On-line Version). Beirut: UN-ESCWA and BGR (United Nations Economic and Social Commission
for Western Asia; Bundesanstalt für Geowissenschaften und Rohstoffe). Retrieved from
Inventory of Shared Water Resources in Western Asia:
http://waterinventory.org/surface_water/euphrates-river-basin
UNHCR. (2015). 2015 UNHCR Country Operations Profile - Jordan. Retrieved from UNHCR - The UN
Refugee Agency: http://www.unhcr.org/cgi-bin/texis/vtx/page?page=49e486566&submit=GO
UNRWA. (n.d.). Where We Work - Jordan. Retrieved from UNRWA - United Nations Relief and Works for
Palestine Refugees in the Near East: http://www.unrwa.org/where-we-work/jordan/camp-
profiles?field=13
WHO/UNICEF. (2014). Country Files. Retrieved from JMP - WHO/UNICEF Joint Monitoring Programme
(JMP) for Water Supply and Sanitation:
http://www.wssinfo.org/documents/?tx_displaycontroller[type]=country_files
WHO/UNICEF. (2014). Data-Estimates. Retrieved from JMP - WHO/UNICEF Joint Monitoring Programme
(JMP) for Water Supply and Sanitation: http://www.wssinfo.org/data-estimates/tables/
William Alkhoury, M. Z.-B. (2010). Water Quality of the King Abdullah Canal/Jordan-impact on
euthrophication and water disinfection. Toxicological & Environmental Chemistry, 855-877.
Retrieved from http://www.tandfonline.com/doi/pdf/10.1080/02772240903143828
World Bank. (2009). Water in the Arab World: Management Perspectives And Innovations. Washington:
The International Bank of Reconstruction and Development.
World Bank. (2009b, Apirl). Assessment of Restrictions on Palestinian Water Sector Development: West
Bank and Gaza. Report No. 47657-6Z. Retrieved from World Bank:
http://siteresources.worldbank.org/INTWESTBANKGAZA/Resources/WaterRestrictionsReport18
Apr2009.pdf
World Bank. (2015). Annual freshwater withdrawals, industry (% of total freshwater withdrawal) .
Retrieved from The World Bank:
http://data.worldbank.org/indicator/ER.H2O.FWIN.ZS/countries