evaluation of earthquake hazard for the city of tiberias
TRANSCRIPT

Evaluation of earthquake hazard for the city of Tiberias
M. Francesca Ferrario1, Rivka Amit2, Oded Katz2
1. University of Insubria, Como, Italy 2. Geological Survey of Israel, Jerusalem, Israel
Prepared for the Steering Committee for Earthquake Readiness in Israel
December, 2014
Ministry of National infrastructures Energy and Water Resources Geological Survey of Israel


1. Introduction
The Dead Sea Transform (DST) is the tectonic boundary between the Arabia and Sinai (Africa) plates,
extending from the Red Sea in the south to the Eurasia Plate in the north. Based on geological observations
and kinematic considerations it is generally accepted that the DST is a continental transform, along which
the principal movement has been a post-Miocene 105 km left-lateral displacement (e.g., Bartov et al, 1980;
Garfunkel, 1981; Joffe & Garfunkel 1987; Smit et al., 2010). The DST is segmented to a few tectonically
active northwards extended major segments, each tens to hundreds kilometres long (Garfunkel, 1981). One
of them is the Jordan Valley Fault (JVF), extending some 110 km between the northern coast of the Dead
Sea and the eastern coast of Sea of Galilee (SOG), with inferred average slip rate of about 5mm/y (Ferry et
al., 2007).
Bounded by the JVF in the east and the Western Marginal Fault in the west (Fig. 1) (Hurwitz et al., 2002),
the SOG is part of a N-S extended pull-apart basin, one of a few located along the Dead Sea Transform
(Garfunkel, 1981; Ben Avraham et al., 1996). Several historical large destructive (M > 6.5) earthquakes are
apparently the result of the JVF rupture (Ben Menahem, 1991; Amiran et al., 1994; Guidoboni et al., 1994;
Guidoboni and Comastri, 2005), attesting for its intense tectonic activity. Likewise, the large destructive
earthquake of 749 AD is attributed to this segment with reported heavy damage to the cities of Tiberias
and Susita (Marco et al., 2003; Yagoda-Biran and Hatzor, 2012) and to the village of Umm El Qanatir
(Wechsler et al., 2009), all situated within the SOG vicinity, at a radial distance of less than 15 km from the
JVF. Moreover, the earthquakes of 343 AD and 1033 AD are also attributed to the JVF segment (Begin,
2005; Ben Menahem, 1991). Recent seismicity along the northern extension of the JVF is instrumentally
recorded (Ven Eck and Hofstetter, 1990), including the 1973, M=4.5 earthquake, that occurred at the
southern shore of SOG (Arieh et al., 1977).
However, the long term prehistorical record of earthquake behavior including determination of
recurrence time intervals of large events is yet missing in this highly populated area of northern Israel.
Driven by this, and by the fact that there is a high number of faults and lineaments displacing Quaternary
sedimentary sequences, and large landslides are evident along the SOG eastern and western margins, we
study the western side of the Sea of Galilee to follow the upper-Pleistocene - Holocene seismic history of
this area. The current study continues previous studies at the western and eastern coasts of the Sea of
Galilee and the vicinity of Tiberias city such as those of Marco et al. (2003), Zion et al. (2004), Salamon et al.
(2009), Katz et al. (2010), Yagoda-Biran et al. (2010). Here we integrate paleoseismic data of Quaternary
fault segment rupturing the surface with slope stability analyses that spatially coincide with the faults. It
includes evaluation of magnitudes and recurrence times of the large earthquakes and determination of
historical peak ground acceleration that is related to the large earthquakes. The results of this study can be
used to enhance seismic hazard estimation, to calibrate, and to update seismic building codes for the SOG
area.
1
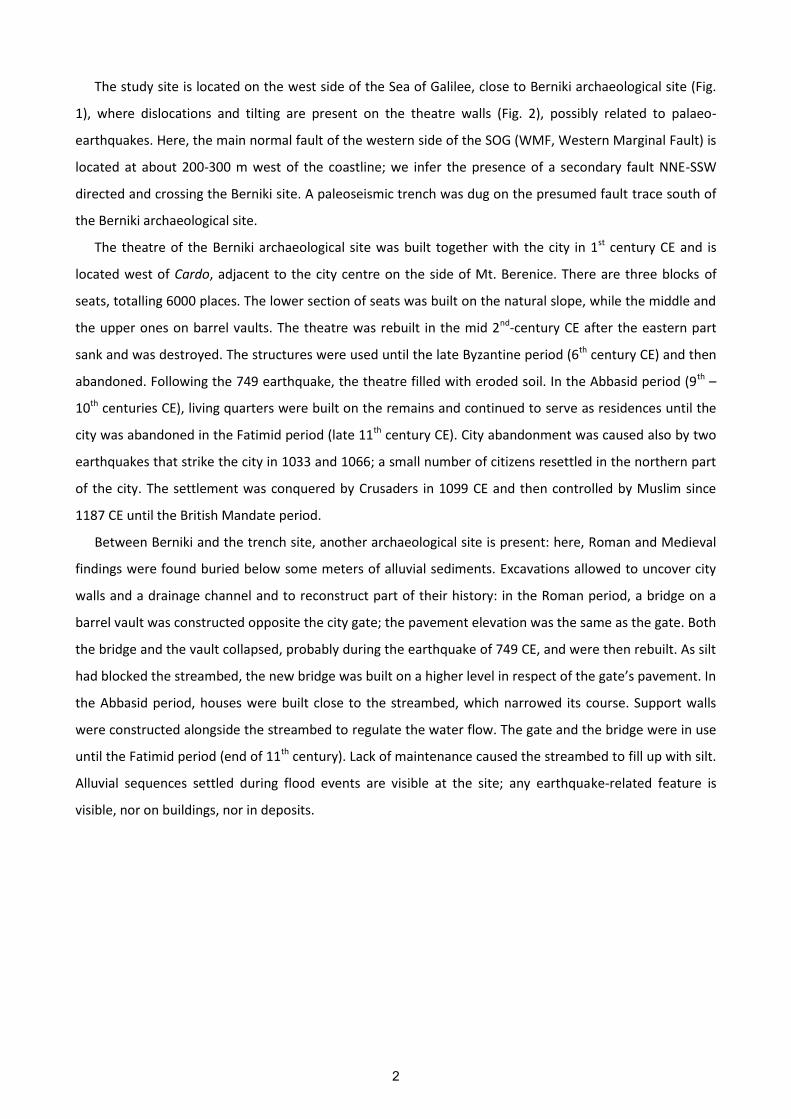
The study site is located on the west side of the Sea of Galilee, close to Berniki archaeological site (Fig.
1), where dislocations and tilting are present on the theatre walls (Fig. 2), possibly related to palaeo-
earthquakes. Here, the main normal fault of the western side of the SOG (WMF, Western Marginal Fault) is
located at about 200-300 m west of the coastline; we infer the presence of a secondary fault NNE-SSW
directed and crossing the Berniki site. A paleoseismic trench was dug on the presumed fault trace south of
the Berniki archaeological site.
The theatre of the Berniki archaeological site was built together with the city in 1st century CE and is
located west of Cardo, adjacent to the city centre on the side of Mt. Berenice. There are three blocks of
seats, totalling 6000 places. The lower section of seats was built on the natural slope, while the middle and
the upper ones on barrel vaults. The theatre was rebuilt in the mid 2nd-century CE after the eastern part
sank and was destroyed. The structures were used until the late Byzantine period (6th century CE) and then
abandoned. Following the 749 earthquake, the theatre filled with eroded soil. In the Abbasid period (9th –
10th centuries CE), living quarters were built on the remains and continued to serve as residences until the
city was abandoned in the Fatimid period (late 11th century CE). City abandonment was caused also by two
earthquakes that strike the city in 1033 and 1066; a small number of citizens resettled in the northern part
of the city. The settlement was conquered by Crusaders in 1099 CE and then controlled by Muslim since
1187 CE until the British Mandate period.
Between Berniki and the trench site, another archaeological site is present: here, Roman and Medieval
findings were found buried below some meters of alluvial sediments. Excavations allowed to uncover city
walls and a drainage channel and to reconstruct part of their history: in the Roman period, a bridge on a
barrel vault was constructed opposite the city gate; the pavement elevation was the same as the gate. Both
the bridge and the vault collapsed, probably during the earthquake of 749 CE, and were then rebuilt. As silt
had blocked the streambed, the new bridge was built on a higher level in respect of the gate’s pavement. In
the Abbasid period, houses were built close to the streambed, which narrowed its course. Support walls
were constructed alongside the streambed to regulate the water flow. The gate and the bridge were in use
until the Fatimid period (end of 11th century). Lack of maintenance caused the streambed to fill up with silt.
Alluvial sequences settled during flood events are visible at the site; any earthquake-related feature is
visible, nor on buildings, nor in deposits.
2
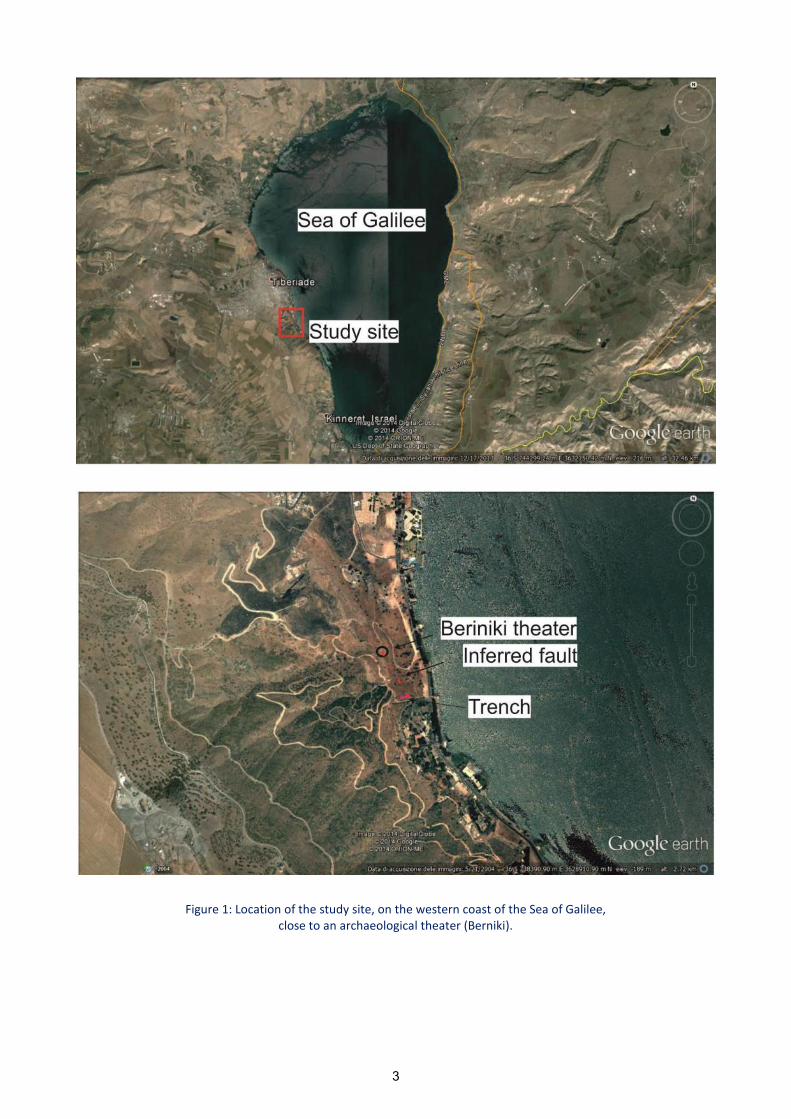
Figure 1: Location of the study site, on the western coast of the Sea of Galilee,
close to an archaeological theater (Berniki).
3

Figure 2: Berniki archaeological site; details on deformations and tilting on the walls, possibly earthquake-induced, are shown.
4

2. Methods
We used plaeoseismological analysis by trenching the faults detected and identified in the field and in
the seismic lines, as well as archeoseismological analysis to study the historical earthquakes occurred in the
studied area.
3. Results
3.1 Paleoseismic Trench
A paleoseismic trench was dug south of the Berniki archaeological site (city gate) based on a high
resolution seismic line (Medvedev, 2008) and a field reconnaissance. It is ca. 2.5 m high, 15 m long and 1 m
wide; the direction is ca. N70°. The trench does not show any significant evidence of faulting; some
deformations are visible, whose trend is similar to the topography. Several archaeological remains were
found (jar fragments, walls). A cavity with human bones was found at the bottom of the trench; however, it
doesn’t seem a primary burial place, but rather a possible drainage structure later used as a burial site.
Findings are dated approximatively at the Islamic period (11th century CE).
Sediments uncovered by the trench are presumably ascribable to a quite recent time interval, on the
order of 1000 years. Therefore, it is not possible to find, if present, surface faulting related to the main
historical earthquakes (749 CE, 1033 CE, 1066 CE); the estimated magnitude for the strongest earthquake
(749 CE) is of ca. 7.0 (Marco et al., 2003), whereas the most recent events were weaker. The threshold
magnitude that can be revealed by means of palaeoseismological investigations is in the order of 6.5,
because these earthquakes are able to cause appreciable effects on the environment, such as ground
ruptures, liquefactions and slope movements (cfr. ESI scale; McCalpin, 2009; Michetti et al., 2005; Michetti
et al., 2007). If the fault trace run below the area investigated by the trench, the observed deformations
can be the most surficial ones and can be seismically-induced; however, obtained results are not
compelling and other trigger mechanism cannot be excluded.
The stratigraphic units were mapped using a datum that was positioned on the southern wall of the
trench and were further described. A photomosaic composition allowed to have a single image covering all
the trench wall (Fig. 3); a manual log in scale 1:50 has been drawn (Fig. 4).
5
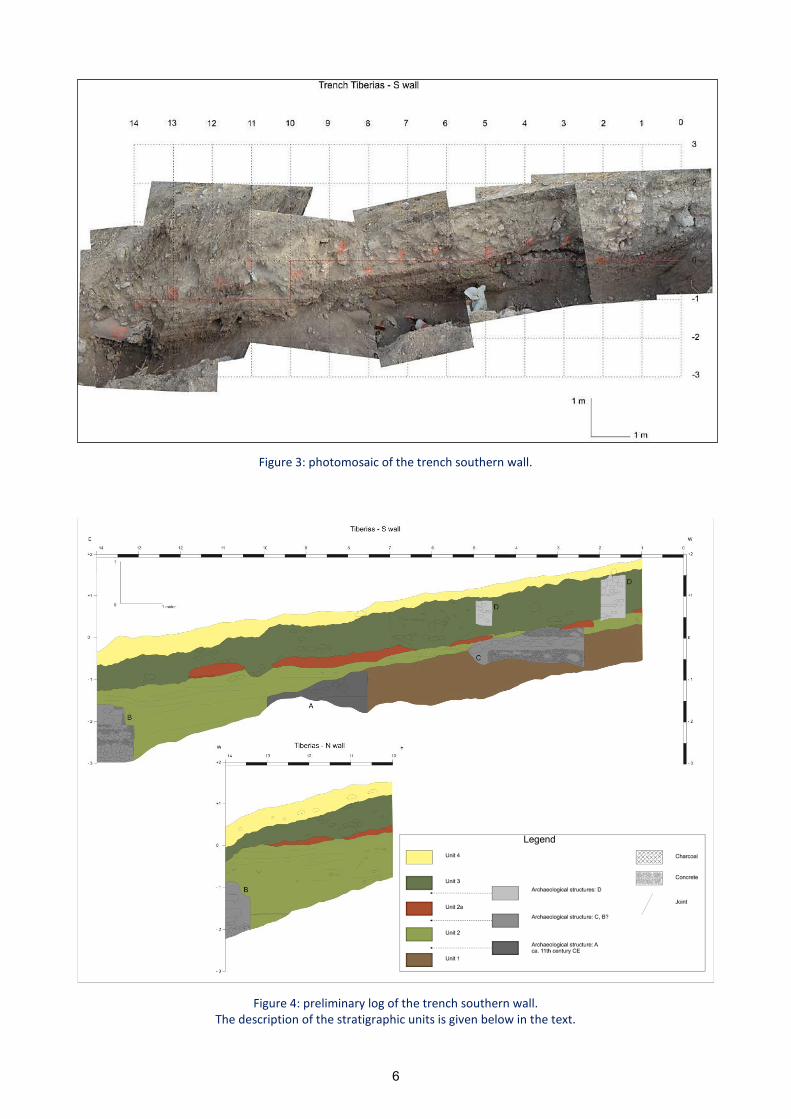
Figure 3: photomosaic of the trench southern wall.
Figure 4: preliminary log of the trench southern wall. The description of the stratigraphic units is given below in the text.
6

Stratigraphic units are described based on the trench southern wall:
UNIT 1
Brownish silt with some clay and small gravels; gravels up to 7 cm, both angular and rounded, consist of
ca. 10-20% of the unit. The unit is relatively soft and no sorting or stratification is evident; locally, few sub-
horizontal strata are present, but cannot be followed throughout the unit, nor in vertical nor in horizontal
direction. Presence of archaeological fragments (mainly pottery), and bones max 3 cm long and always
broken. Few biological shells dispersed into the unit. Presence of decorated glass.
The unit constitutes the base of the trench from 0 to 7.5 m; walls and archaeological structures are
excavated in this unit. The upper part is enriched in pebbles and marks the boundary with overlying unit 1b.
UNIT 1b
Alternation of 2 to 10 cm thick strata of small gravels (generally 0.5 – 1 cm, max 5 cm) and clayey silt
containing also small gravels. Color varies from dark to light brown. Gravels polygenic, mainly rounded and
horizontally deposited. Harder than unit 1; presence of small pottery fragments (max 2 cm), bones and
shells (grouped in small lenses up to 1 cm thick).
At 11 m, the base of unit 1b is marked by big boulders (up to 40 cm), but possibly related to an
underlying archaeological structure. The upper limit is sharp with unit 2.
Layers generally dip towards the lake (to the E), except at 13-14 m, where a counter-tilting is observed.
The unit is clearly deposited by flowing water with a certain degree of energy; alternations of smaller and
bigger material can be attributed to higher-lower amount of energy.
Deposition environment: fluvial (floods), but probably quite distant from the main channel (the one
crossing Berko archaeological park?).
UNIT 2
Dark brown to reddish silty clay, rare gravels up to 5 cm, almost all basalts. Harder than the other units,
max thickness of 25-30 cm. At 11-12 m presence of charcoals. The unit is not continuous along the entire
wall but it’s separated in 4-5 parts, due to the presence of archaeological structures or “ditches” filled with
unit 3 (at 7 and 10 m). After 12 m the unit is not present.
Presence of pedons, low energy deposition environment, columnar setting. Lower limit sharp, upper
limit erosional.
The base of Unit 2 always dips toward the lake (E), with an inclination almost constant around 12-14°, as
reported on the table below; lower values are recorded close to the termination of the Unit.
7
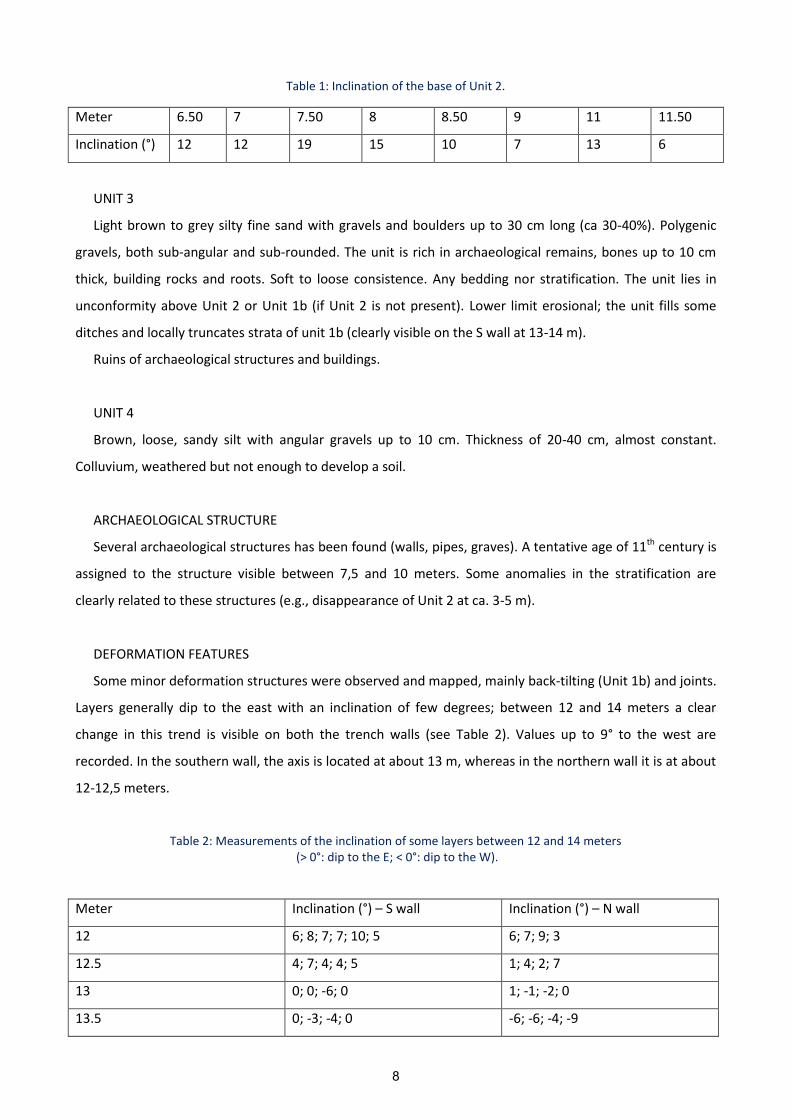
Table 1: Inclination of the base of Unit 2.
Meter 6.50 7 7.50 8 8.50 9 11 11.50
Inclination (°) 12 12 19 15 10 7 13 6
UNIT 3
Light brown to grey silty fine sand with gravels and boulders up to 30 cm long (ca 30-40%). Polygenic
gravels, both sub-angular and sub-rounded. The unit is rich in archaeological remains, bones up to 10 cm
thick, building rocks and roots. Soft to loose consistence. Any bedding nor stratification. The unit lies in
unconformity above Unit 2 or Unit 1b (if Unit 2 is not present). Lower limit erosional; the unit fills some
ditches and locally truncates strata of unit 1b (clearly visible on the S wall at 13-14 m).
Ruins of archaeological structures and buildings.
UNIT 4
Brown, loose, sandy silt with angular gravels up to 10 cm. Thickness of 20-40 cm, almost constant.
Colluvium, weathered but not enough to develop a soil.
ARCHAEOLOGICAL STRUCTURE
Several archaeological structures has been found (walls, pipes, graves). A tentative age of 11th century is
assigned to the structure visible between 7,5 and 10 meters. Some anomalies in the stratification are
clearly related to these structures (e.g., disappearance of Unit 2 at ca. 3-5 m).
DEFORMATION FEATURES
Some minor deformation structures were observed and mapped, mainly back-tilting (Unit 1b) and joints.
Layers generally dip to the east with an inclination of few degrees; between 12 and 14 meters a clear
change in this trend is visible on both the trench walls (see Table 2). Values up to 9° to the west are
recorded. In the southern wall, the axis is located at about 13 m, whereas in the northern wall it is at about
12-12,5 meters.
Table 2: Measurements of the inclination of some layers between 12 and 14 meters (> 0°: dip to the E; < 0°: dip to the W).
Meter Inclination (°) – S wall Inclination (°) – N wall
12 6; 8; 7; 7; 10; 5 6; 7; 9; 3
12.5 4; 7; 4; 4; 5 1; 4; 2; 7
13 0; 0; -6; 0 1; -1; -2; 0
13.5 0; -3; -4; 0 -6; -6; -4; -9
8
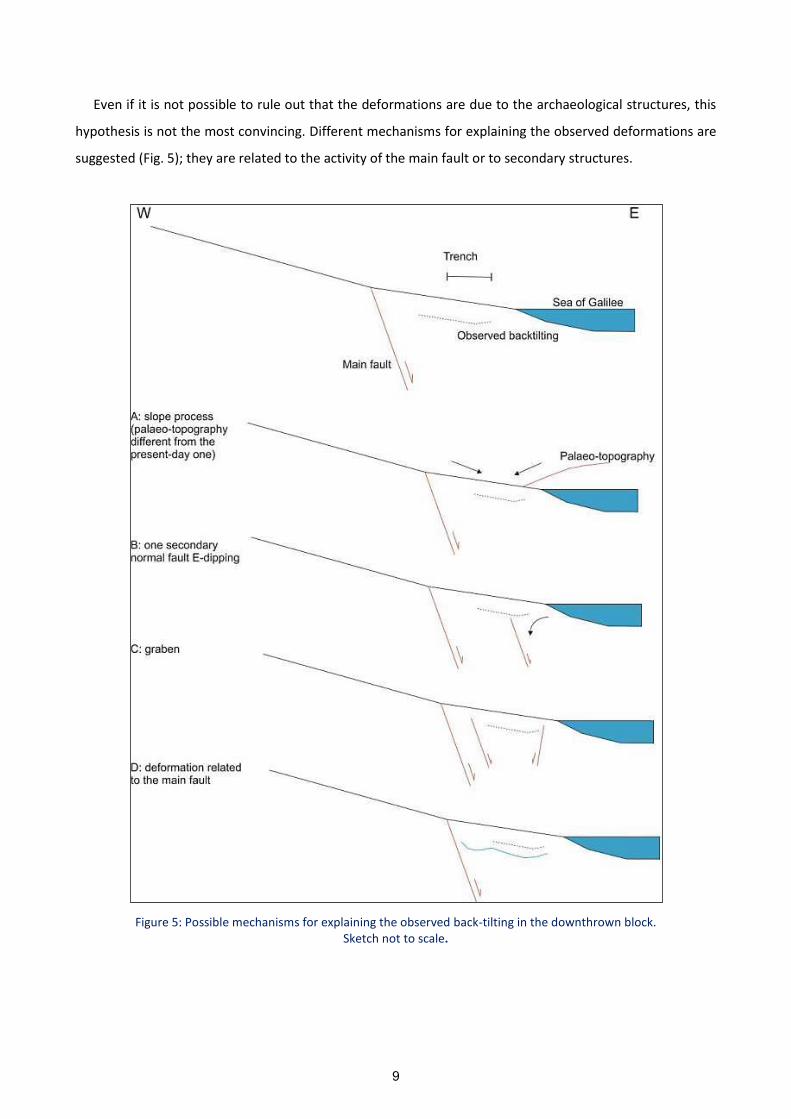
Even if it is not possible to rule out that the deformations are due to the archaeological structures, this
hypothesis is not the most convincing. Different mechanisms for explaining the observed deformations are
suggested (Fig. 5); they are related to the activity of the main fault or to secondary structures.
Figure 5: Possible mechanisms for explaining the observed back-tilting in the downthrown block. Sketch not to scale.
9
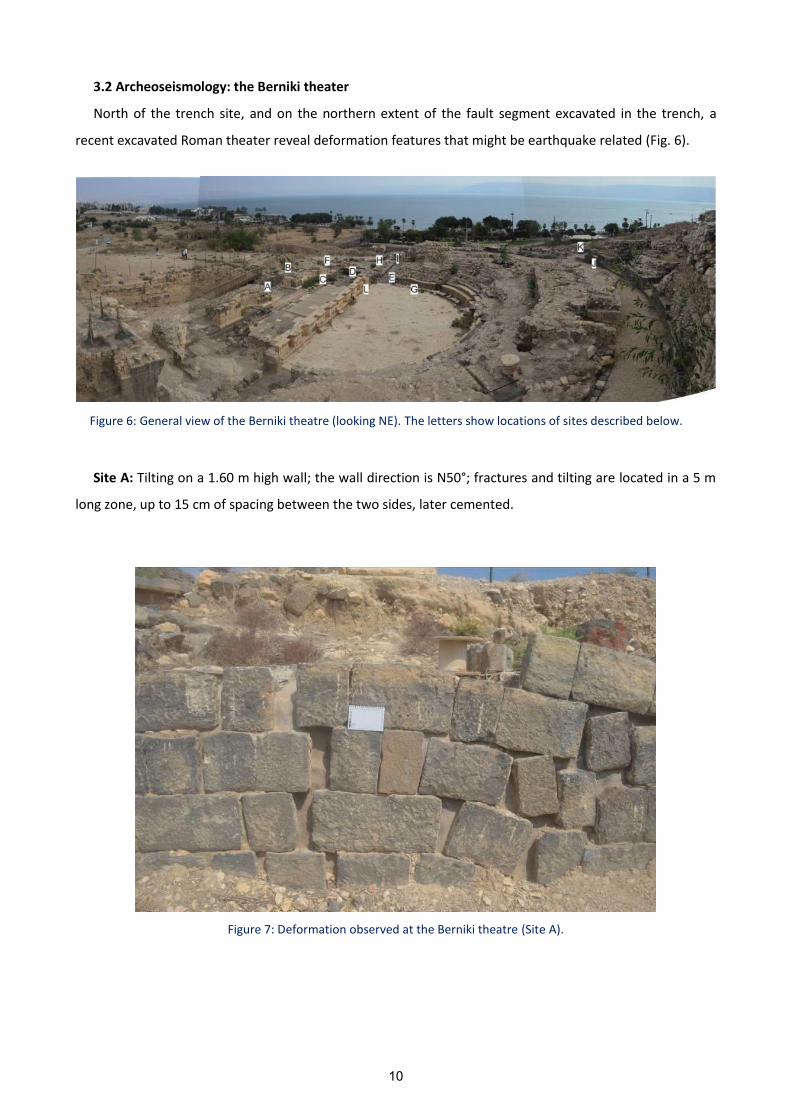
3.2 Archeoseismology: the Berniki theater
North of the trench site, and on the northern extent of the fault segment excavated in the trench, a
recent excavated Roman theater reveal deformation features that might be earthquake related (Fig. 6).
Figure 6: General view of the Berniki theatre (looking NE). The letters show locations of sites described below.
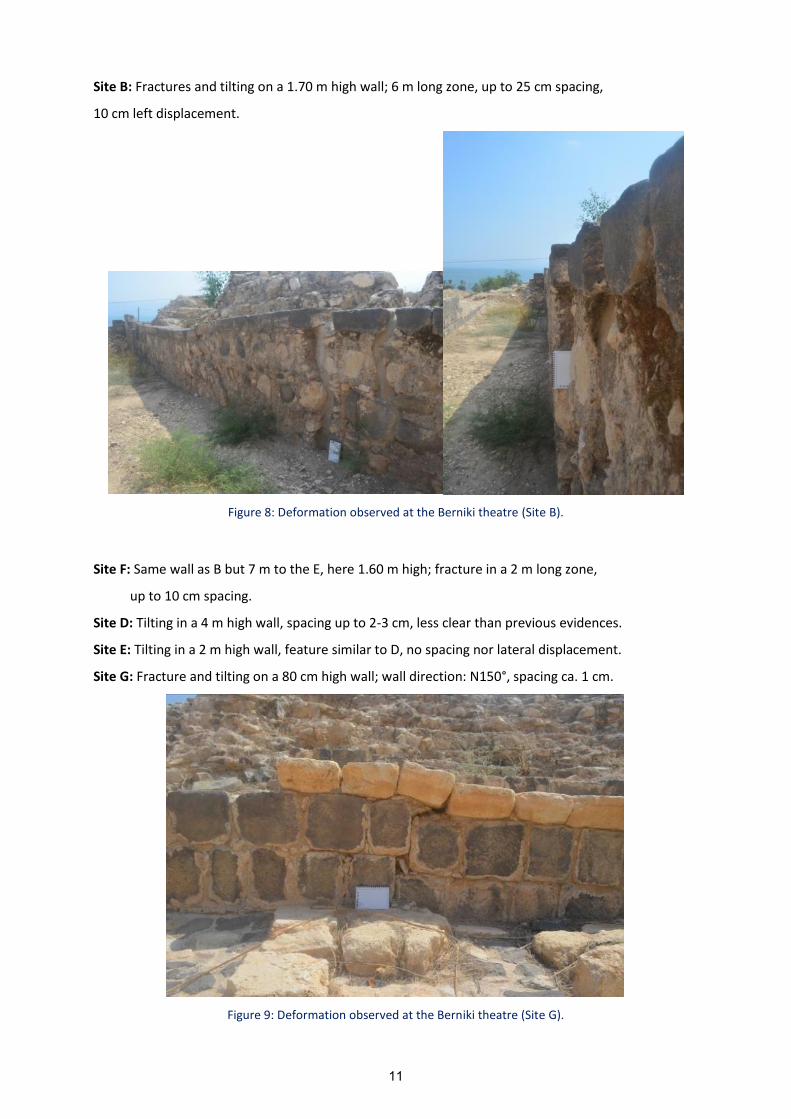
Site A: Tilting on a 1.60 m high wall; the wall direction is N50°; fractures and tilting are located in a 5 m
long zone, up to 15 cm of spacing between the two sides, later cemented.
Figure 7: Deformation observed at the Berniki theatre (Site A).
10
Site B: Fractures and tilting on a 1.70 m high wall; 6 m long zone, up to 25 cm spacing,
10 cm left displacement.
Figure 8: Deformation observed at the Berniki theatre (Site B).
Site F: Same wall as B but 7 m to the E, here 1.60 m high; fracture in a 2 m long zone,
up to 10 cm spacing.
Site D: Tilting in a 4 m high wall, spacing up to 2-3 cm, less clear than previous evidences.
Site E: Tilting in a 2 m high wall, feature similar to D, no spacing nor lateral displacement.
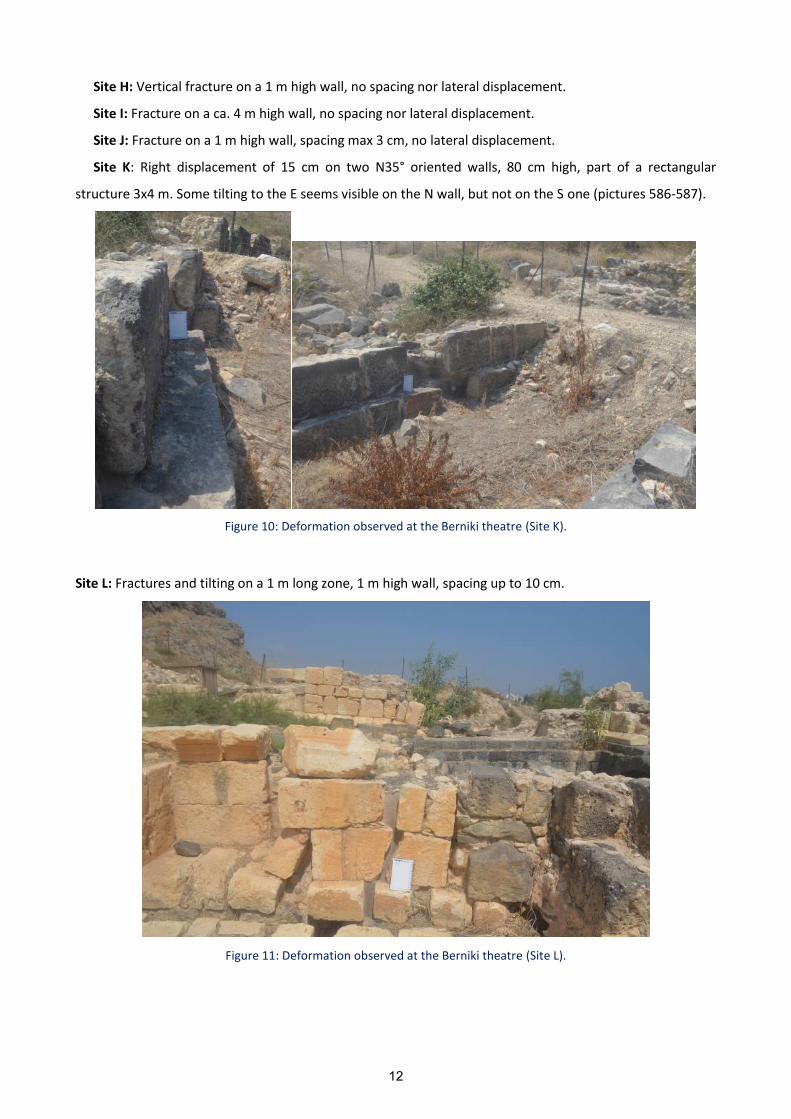
Site G: Fracture and tilting on a 80 cm high wall; wall direction: N150°, spacing ca. 1 cm.
Figure 9: Deformation observed at the Berniki theatre (Site G).
11
Site H: Vertical fracture on a 1 m high wall, no spacing nor lateral displacement.
Site I: Fracture on a ca. 4 m high wall, no spacing nor lateral displacement.
Site J: Fracture on a 1 m high wall, spacing max 3 cm, no lateral displacement.
Site K: Right displacement of 15 cm on two N35° oriented walls, 80 cm high, part of a rectangular
structure 3x4 m. Some tilting to the E seems visible on the N wall, but not on the S one (pictures 586-587).
Figure 10: Deformation observed at the Berniki theatre (Site K).
Site L: Fractures and tilting on a 1 m long zone, 1 m high wall, spacing up to 10 cm.
Figure 11: Deformation observed at the Berniki theatre (Site L).
12

Features A,B,C,D,L,G,K are all aligned along a N140° direction, as shown on the picture below. The dashed
red line represents the alignment of the observed damages.
Figure 12: Alignment of the observed deformation at the Berniki theatre.
13
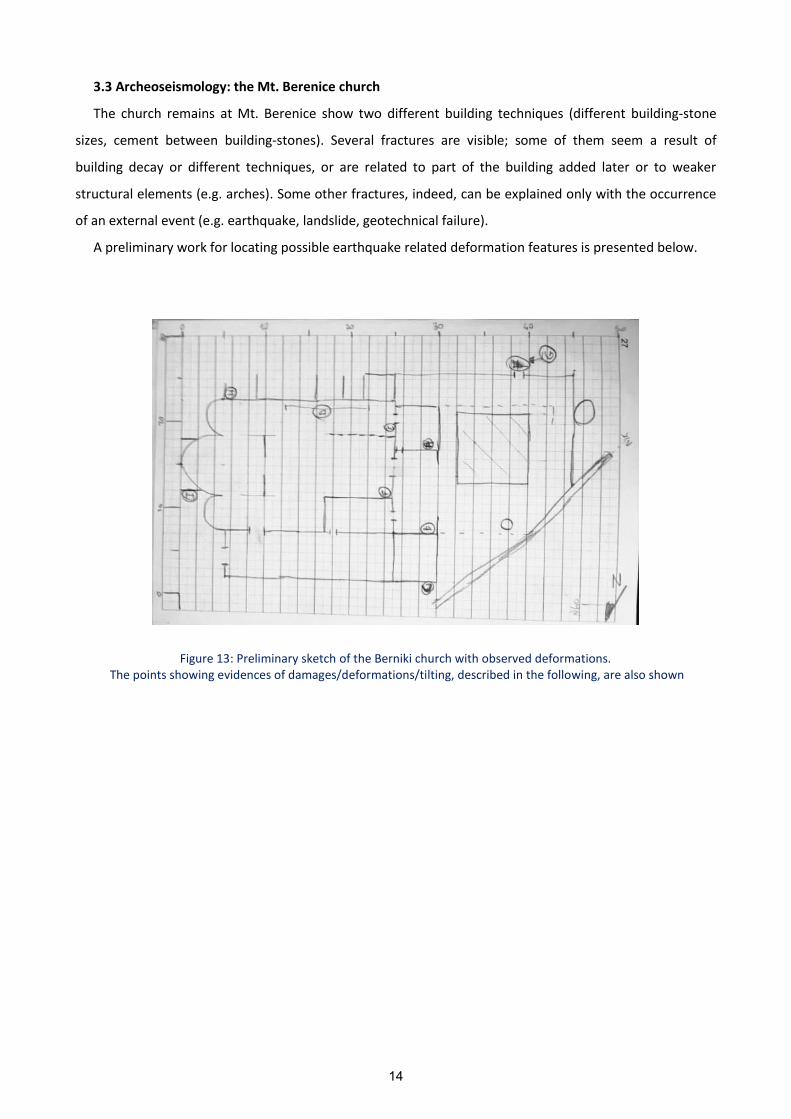
3.3 Archeoseismology: the Mt. Berenice church
The church remains at Mt. Berenice show two different building techniques (different building-stone
sizes, cement between building-stones). Several fractures are visible; some of them seem a result of
building decay or different techniques, or are related to part of the building added later or to weaker
structural elements (e.g. arches). Some other fractures, indeed, can be explained only with the occurrence
of an external event (e.g. earthquake, landslide, geotechnical failure).
A preliminary work for locating possible earthquake related deformation features is presented below.
Figure 13: Preliminary sketch of the Berniki church with observed deformations.
The points showing evidences of damages/deformations/tilting, described in the following, are also shown
14
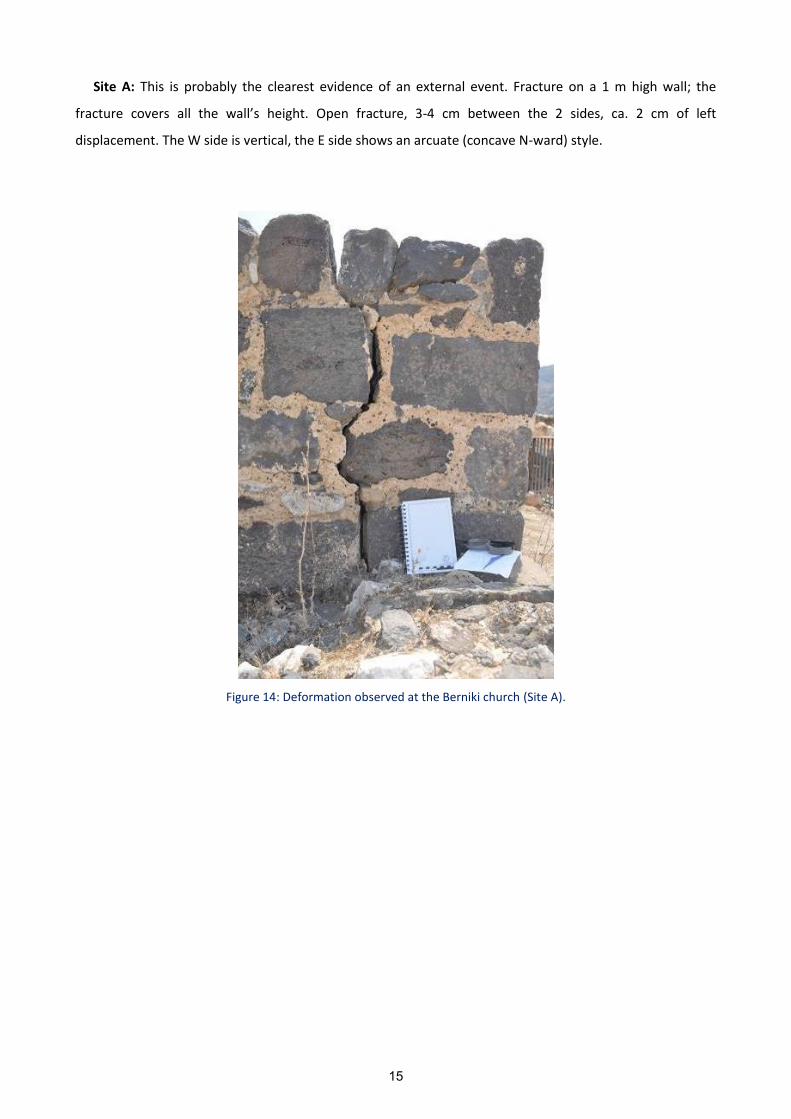
Site A: This is probably the clearest evidence of an external event. Fracture on a 1 m high wall; the
fracture covers all the wall’s height. Open fracture, 3-4 cm between the 2 sides, ca. 2 cm of left
displacement. The W side is vertical, the E side shows an arcuate (concave N-ward) style.
Figure 14: Deformation observed at the Berniki church (Site A).
15

Site B: Fracture on a 70 cm high wall; the prosecution is visible for ca. 50 cm in the superior part of the
wall; no lateral displacement.
Site C: Vertical fracture on a 2.40 m high wall; the fracture is visible only in the lower 1.60 m. Spacing
between the 2 sides ca. 1 cm, no lateral displacement. The wall for its entire length seems built with 2
different techniques: lower part with much more cement and smaller boulders. The fracture ends ca. at the
boundary between the 2. A, B and C are aligned along the N150° direction.
Figure 15: Deformation observed at the Berniki church (Site C).
16

Site D: Here the features (vertical fractures) seems related to different building phases
(presence/absence cement).
Site E and F: Tilting and dislocation of 2 walls (loss of verticality), but related to weaker structural
elements (arches).
Site G: Single stone located at the base of a door, fractured in 2 blocks.
Site H: Series of sub-vertical fractures, in correspondence to a corner in the wall; up to 4-5 cm between
the 2 sides. Possible 1-2 cm of right-lateral displacement. In one point, the fracture broke a 20 cm long
single stone.
Site I: Fractures in a 2.5 m high wall; several stones broken, up to 1 cm between the 2 sides, no lateral
displacement.
17
4. Summary
We found in the study area natural as well as archeological deformation features that might be
earthquake related. The fieldwork allowed mapping several different features on at least 3 sites (trench,
Berniki theater and church on Mt. Berenice); these data constitute a base sufficient for constraining at least
part of the fault trace. The integration between stratigraphy, paleoseismology and archaeology can lead to
a more accurate estimate of the geological features and related risks (e.g., Galadini et al., 2006).
The figure below represents a map of ancient Tiberias (modified after Hirschfeld & Gutfeld, 2008) with
indication of the inferred lineaments and trench position. Red lines were drawn after the field survey of
damages in Berniki church and theater. The western line is less constrained than the eastern one because
damages in the church are less diffuse and evident than in the theater.
Concerning the eastern inferred fault, our data reveal that the line is perfectly aligned with the
mountain front to the NW and with the “House of the Bronzes”, too. At this last site, archaeological
excavations were executed and several remains were analyzed.
The excavations highlight some information useful for assessing the earthquake risk in the area. Quoting
from the archaeological report: “Towards the end of the Fatimid period the residential structures were
destroyed and the area was completely abandoned. From the large piles of rubble covering the courtyards
of the houses and their rooms, we believe that the destruction was caused by an earthquake. Another
indication of this is the fissures in the walls of the water tower and other structures”.
The prosecution of the fault trace towards the south is less constrained and it is possible to infer
different interpretation, shown with the dotted yellow and green lines. For more conclusive results some
further work needs to be done, including for example aerial photo interpretation, analysis of the river
network and of slope instabilities.
18

Figure 16: Map of ancient Tiberias (modified after Hirschfeld & Gutfeld, 2008) with indication of the inferred lineaments and trench position.
19

5. References
Ambraseys, N. N., Barazangi, M., 1989. The 1759 Earthquake in the Bekaa valley: implications for earthquake hazard assessment in Eastern Mediterranean region. J. Geoph. Res. 94, 4007-4013.
Ambraseys, N. N., 1997. The earthquake of 1 January 1837 in Southern Lebanon and Northern Israel. Annali di Geofisika, XL (4), 923-935.
Amiran, D. H. K., Arieh, E. & Turcotte, T., 1994. Earthquakes in Israel and adjacent areas: Macroseismic observations since 100 B.C.E., Israel Exploration Journal, 44 (3-4): 260-305.
Arieh, E., Peled, U., Kafri, U., 1977. The Jordan Valley earthquake of September 2, 1973. Isr. J. Earth Sci. 26: 112–118.
Bartov, Y., Steinitz, G., Eyal, M., Eyal, Y., 1980. Sinistral movement along the Gulf of Aqaba—its age and relation to the opening of the red sea. Nature 285: 22 0–222 .
Begin, Z.B., 2005. Destructive earthquakes in the Jordan Valley and the Dead Sea—their reoccurrence interval and the probability of their occurrence. Geol. Surv. Isr. Rep. GSI/12/2005.
Ben-Avraham, Z., ten-Brink, U., Bell, R., Reznikov, M., 1996. Gravity field over the Sea of Galilee; evidence for a composite basin along a transform fault. J. Geophys. Res. 101 (B1): 533–544.
Ferry, M., Meghraoui, M., Abou Karaki, N., Al-Taj, M., Amoush. H., Al-Dhaisat, S., Barjous, M. 2007. A 48-kyr-long slip rate history for the Jordan Valley segment of the Dead Sea Fault. EPSL 30: 394–406.
Ben-Menahem, A., 1991. Four thousand years of seismicity along the Dead Sea Rift. J. Geophys. Res. 96 (B12): 20195–20216.
Galadini, F., Hinzen, K. G., & Stiros, S., 2006. Archaeoseismology: methodological issues and procedure. Journal of Seismology, 10(4), 395-414.
Garfunkel, Z., 1981. Internal structure of the Dead Sea leaky transform (rift) in relation to plate kinematics. Tectonophysics 80: 81–108.
Guidoboni, E., Comastri, A., 2005. Catalogue of earthquakes and tsunamis in the Mediterranean area from the 11th to the 15th century. INGV-SGA, Rome-Bologna, Italy, 1037 pp.
Guidoboni, E., Comastri, A., Traina, G., 1994. Catalogue of ancient earthquakes in the Mediterranean area up to the 10th Century. ING-SGA, Rome-Bologna, Italy, 504 pp.
Hirschfeld, Y., Gutfeld, O., 2008. Tiberias excavations in the House of the Bronzes. Final Report, vol. I. QEDEM - Monographs of the Institute of Archaeology.
Hurwitz, S., Garfunkel, Z., Ben-Gai, Y., Reznikov, M., Rotstein, Y., Gvirtzman, H., 2002. The tectonic framework of a complex pull-apart basin: seismic reflection observations in the Sea of Galilee, Dead Sea transform. Tectonophysics 359: 289–306.
Joffe, S., Garfunkel, Z., 1987. Plate kinematics of the circum Red Sea—a re-evaluation. Tectonophysics 141: 5–22 .
Katz, O., Amit, R., Yagoda-Biran, G., Hatzor, Y. H., 2010. Quaternary earthquakes and landslides in the Sea of Galilee area, the Dead Sea Transform; paleoseismic analysis and evaluation of current hazard. Isr. J. Earth Sci., 58: 275-294.
Marco, S., Hartal, M., Hazan, N., Lev, L., Stein, M., 2003. Archaeology, history, and geology of the A.D. 749 earthquake, Dead Sea Transform. Geology, 31 (8) 665-668.
McCalpin, J., 2009. Paleoseismology, 2nd edition. Edited by Renata Dmowska, Dennis Hartmann and H. Thomas Rossby, 613 pp.
Medvedev, B., 2008. Fault mapping at Berniki area, west Sea of Galilee. The Geophyiscal Inst. of Isreal, Report 645/319/08, 6 p. (in Hebrew).
Michetti, A. M., Audemard, F. A. M., and Marco, S. (Eds.), 2005. Future trends in paleoseismology: Integrated study of the seismic landscape as a vital tool in seismic hazard analyses. Tectonophys. Spec. Issue. 408(1–4), 3–21.
Michetti, A.M., E. Esposito, L. Guerrieri, S. Porfido, L. Serva, R. Tatevossian, E. Vittori, F. Audemard, T. Azuma, J. Clague, V. Comerci, A. Gürpinar, McCalpin, B. Mohammadioun, J. Mohammadioun, N.A.
20
Mörner, Y. Ota and E. Roghozin, 2007. Environmental Seismic Intensity Scale - ESI 2007. Memorie Descrittive della Carta Geologica d'Italia, 74, 7-54, Servizio Geologico d'Italia – Dipartimento Difesa del Suolo, APAT, Roma, Italy.
Salamon, A., Amit, R., Baer, G., Weinberger, R., Katz, O., Mushkin, A., Baruch, O., 2011. Evaluation of earthquake hazard for education institute in Israel selected with high priority for strengthening (in Hebrew).Geological Survey of Israel, Report: GSI/06/11.
Smit, J., Brun, J. P., Cloetingh, S., Ben-Avraham, Z., 2010. The rift-like structure and asymmetry of the Dead Sea Fault. EPSL 290: 74–82.
van Eck, T., Hofstetter, A., 1990. Fault geometry and spatial clustering of microearthquakes along the Dead Sea-Jordan rift fault zone. Tectonophysics 180: 15–27.
Wechsler, N., Katz, O., Dray, Y., Gonen, I., Marco, S., 2009. Estimating location and size of historical earthquake by combining archaeology and geology in Um-El-Qanatir, Dead Sea Transform. Natural Hazards DOI 10.1007/s11069-008-9315-6s.
Wyllie, D C., Mah, C.W., 2004. Rock slope engineering, civil and mining, Spon Press, London, New York, 4th Ed., 431 pp.
Yagoda-Biran, G., Hatzor, Y.H., 2010. Constraining paleo PGA values by numerical analysis of overturned columns. Earthquake Engineering and Structural Dynamics 39: 463–472. DOI: 10.1002/eqe.950.
Yagoda-Biran, G., Hatzor, Y. H., Amit, R., Katz, O., 2010. Constraining regional paleo peak ground acceleration from back analysis of prehistoric landslides: example from Sea of Galilee, Dead Sea transform. Tectonophysics 490: 81-91.
Zion, C., Katz, O., Ben-Avraham, Z., 2004. Evaluation of earthquake induced landslide hazard in Arbel and Tiberias quadrangles of the topographic map (in Hebrew). Geological Survey of Israel, Report: GSI/26/04
21

תקציר
עיר טבריה. במסגרת העבודה נחפרה תעלת אזור ההעבודה המוצגת עוסקת בהערכת הסיכון הסיסמי ב באזור זה. סיסמיים במספר אתרים-ים ארכאורוכן נערכו סק עירעל העתק מדרום ל בדיקה פלאוסיסמית
, מספר מאות ברניקיבאזור האתר הארכיאולוגי של ,דרום -כללי צפון בכיוון התעלה נחפרה לרוחב העתקבסקר סייסמי בהפרדה גבוהה זוהה להעתק שנבדק יש ביטוי בנוף ובנוסף . מטרים מערבית לחוף הכנרת
יחסית טקטונית עד פני השטח. לפיכך נראה שהייתה פעילות ומגיע נראה שהוא מעתיק יחידות צעירות ושנחפרה )אורך נחשף בתעלההסדימנט שלמרות זאת, . אשר גרמה להעתקת פני השטח צעירה על ההעתק
והסטות במקומותסימני העתקה למעט סידוק אנכי הציגלא מטרים( 5.1מטר ועומקה עד 51 -התעלה כשנה 5111 -כלל ממצאים ארכיאולוגים שקבעו מסגרת זמן של כ שנחשף קטנות של יחידות קרקע. הסדימנט
לסלע באתרו. הלפני ההווה. התעלה לא הגיע
ונה נמצא תיאטרון שנבנה בתקופה הרומית והתגלה בחפירות ארכיאולוגיות בשנים צפההעתק בהמשך הרסו זוהו עדויות לכשלעל גבי קו ההעתק ובנוסף ומשמעותית אטרון עבר דפורמציה ברורהיהאחרונות. הת
שיכול להיות קשור ברעידת אדמה. מבני
שלו העכשווי סטוריה ארוכה של רעידות אדמה חזקות שיצרו את הביטוי ילסיכום, להעתק שנבדק יש כנראה ההתצפיות החדשות שנאספו במסגרת העבודה לא מאפשרות עדיין לקבוע מתי הייתה הרעידה עם זאת בנוף.
מקובל לחשוב שרק האחרונה על ההעתק, וכן מה המגניטודה ומה זמני החזרה של רעידות על העתק זה.משום שאין עדויות להסטת פני השטח ולפיכך ,מסיטות את פני השטח( 6מגניטודה )מעלרעידות חזקות
באתר הנחקר בפרק זמן זה.( < 6)אדמה כזו רעידת ארעה השנה האחרונות לא סביר להניח ש ףבאל


משרד התשתיות הלאומיות האנרגיה והמים
המכון הגיאולוגי
הערכת סכנה מרעידות אדמה בעיר טבריה
2, עודד כץ2, רבקה אמית1פרנצ'סקה פראריומ.
. אוניברסיטת אינסובריה, קומו, איטליה 1
המכון הגיאולוגי, ירושלים. 2
משרדית להערכות לרעידות אדמה-מוגש לועדת ההיגוי הבין
2112דצמבר,