water quality impacts of - virginia tech
TRANSCRIPT

WATER QUALITY IMPACTS OF
PURE CHLORINE DIOXIDE PRETREATMENT
AT
THE ROANOKE COUNTY (VIRGINIA) WATER TREATMENT PLANT
by
Christine Spada Ellenberger
Thesis submitted to the Faculty of the
Virginia Polytechnic Institute and State University
in partial fulfillment of the requirements for the degree of
MASTER OF SCIENCE
in
ENVIRONMENTAL ENGINEERING
Dr. Robert C. Hoehn, Chairman
Dr. Andrea M. Dietrich
Dr. Daniel L. Gallagher
December 7, 1999
Blacksburg, Virginia
Keywords: Chlorine Dioxide, Chlorite, Chlorate

WATER QUALITY IMPACTS OFPURE CHLORINE DIOXIDE PRETREATMENT AT
THE ROANOKE COUNTY (VIRGINIA) WATER TREATMENT PLANT
by Christine S. EllenbergerDr. Robert C. Hoehn, Chairman
(ABSTRACT)
Chlorine dioxide (ClO2) was included in the Spring Hollow Water Treatment Plant
(Roanoke County, Virginia) to oxidize manganese and iron, prevent tastes and odors, and
avoid the formation of excessive halogenated disinfection by-products. A state-of-the-art,
gas:solid ClO2 generation system manufactured by CDG Technology, Inc. was installed at
the plant and is the first full-scale use of this technology in the world. The ClO2 generator
produces a feed stream free of chlorine, chlorite ion (ClO2-), and chlorate ion (ClO3
-),
resulting in lower by-product concentrations in the treatment system
The objectives of this project were to study ClO2 persistence and by-product
concentrations throughout the treatment plant and distribution system and to evaluate
granular activated carbon (GAC) columns for removing ClO2- from the finished water.
The ClO2 dosages applied during this study were relatively low (<0.75 mg/L), and, as
a result, ClO2- concentrations never approached the maximum contaminant level (MCL) (1.0
mg/L). Likewise, the plant effluent ClO2 concentration never approached the maximum
residual disinfectant level (MRDL) (0.80 mg/L), but concentrations as high as 0.15 mg/L
reformed in the distribution system by ClO2- reaction with chlorine.
Chlorate ion was monitored despite the fact that no ClO3- MCL has been proposed,
and concentrations were quite low (never greater than 0.10 mg/L) throughout the treatment
plant and in the distribution system. The reasons for the low concentrations are that ClO3- is

iii
not produced by the gas-solid generator used at the facility and ClO2- concentrations in the
clearwell prior to chlorination were uniformly low.
The average ClO2- reduction upon passage of treated water through the GAC
contactor was approximately 64 percent, but the GAC effectiveness was declining over the
six-month study period. Apparently, GAC effectiveness, as shown by others, is short-lived,
and if higher ClO2 dosages are ever applied at the Roanoke County facility, the ClO2-
concentrations will have to be reduced by either ferrous coagulants or reduced-sulfur
compounds.
Regenerated ClO2 concentrations in the distribution system were below 0.2 mg/L, but
concentrations as low as 0.03 mg/L were found at homes of customers who complained of
odors. During this study, twelve complaints were received from eight customers, and each
complainant had recently installed new carpeting, which has been shown to contribute
volatile organics that react with ClO2 to produce odors similar to kerosene and cat urine.
While meeting the ClO2- MCL likely will be no problem if the ClO2 dose at the plant remains
below 1.0 mg/L, the problem of offensive odors in the distribution system will likely
continue as long as any ClO2- is in the finished water when chlorine is present.

iv
ACKNOWLEDGEMENTS
The author would like to express her appreciation to Dr. Robert Hoehn for his
guidance, support, and expertise during the course of her research. The assistance and advice
of Dr. Andrea Dietrich and Dr. Daniel Gallagher was greatly appreciated. The author would
also like to thank the Edna Bailey Sussman Foundation, the Waste Policy Institute, and
Aaron Rosenblatt (CDG Technology, Inc.) for providing financial assistance. Special thanks
are extended to Marilyn Grender for assistance with ion chromatography and to Novatek and
Dr. Bernard Bubnis for technical support. For their cooperation and assistance with the
research project the author would like to thank Robert Benninger, Assistant Director
Roanoke County Utility Department, and Jeff Booth, Water Production Supervisor, and E.V.
(Toby) Wiseman, Laboratory Director Spring Hollow Water Treatment Plant.
The author wishes to express her deepest gratitude to her husband, Justin, for his
constant support and encouragement. This thesis is dedicated to her parents, Anthony and
Beverly, who provided her the motivation and support necessary for project completion.

v
TABLE OF CONTENTS
ABSTRACT .............................................................................................................................. ii
ACKNOWLEDGEMENTS ..................................................................................................... iv
CHAPTER I INTRODUCTION ............................................................................................ 1
CHAPTER II LITERATURE REVIEW .............................................................................. 4
Chlorine Dioxide and By-product Chemistry ................................................................ 4
Chlorine Dioxide Applications in Water Treatment ....................................................... 7
Trihalomethane Control ..................................................................................... 8Taste and Odor Control ...................................................................................... 10Disinfection ........................................................................................................ 11Manganese Oxidation ......................................................................................... 12Iron Oxidation .................................................................................................... 13
Analytical Techniques .................................................................................................... 14
The Amperometric Method ................................................................................ 14Lissamine Green B Method ................................................................................ 15Ion Chromatography .......................................................................................... 17
Chlorite Ion Concentrations in Distribution Systems .................................................... 19
Chlorine Dioxide Concentrations in Distribution Systems and Associated Odors ........ 20
Regulation of Chlorine Dioxide and Its By-products ..................................................... 21
Chlorite Ion Control ....................................................................................................... 22
Reduction by Ferrous Iron .................................................................................. 23Reduction by Reduced-Sulfur Compounds ........................................................ 25Reduction by Granular Activated Carbon .......................................................... 26Reduction by Powdered Activated Carbon ........................................................ 28
CHAPTER III MATERIALS AND METHODS ................................................................. 32
Reagents ......................................................................................................................... 32Glassware ....................................................................................................................... 32Collection of Samples for Ion Chromatography Analysis ............................................. 33Ion Chromatography Method ......................................................................................... 33Limits of Detection and Quantitation ............................................................................. 34

vi
Analytical Comparison with Independent Laboratory ................................................... 35Chlorine Dioxide Generation ......................................................................................... 36Lissamine Green B Method ............................................................................................ 37
CHAPTER IV PAPER“WATER QUALITY IMPACTS OF PURE CHLORINE DIOXIDE PRETREATMENTAT THE ROANOKE COUNTY (VIRGINIA) WATER TREATMENT PLANT” ................. 39
Introduction .................................................................................................................... 39Roanoke County Treatment Plant and Spring Hollow Reservoir ...................... 41Chlorine Dioxide Generation ............................................................................. 44
Experimental Methods ................................................................................................... 46Sample Collection and Preservation Methods ................................................... 46Chlorite and Chlorate Ion Analyses ................................................................... 46Laboratory-Scale Chlorine Dioxide Generation and Solution Standardization ... 47Chlorine Dioxide Analysis by the Lissamine Green B SpectrophotometricMethod ............................................................................................................... 48
Results ............................................................................................................................ 49Treatment Plant ClO2, ClO2
-, and ClO3- Profiles ............................................... 49
Chlorite Ion Removal by GAC Filtration ........................................................... 56Distribution System Levels of ClO2 and Its By-Products .................................. 56
Discussion ...................................................................................................................... 67ClO2, ClO2
-, ClO3- Distributions Through the Treatment Plant ......................... 67
Chlorite Removal by GAC Filtration ................................................................. 69Chlorine Dioxide, Chlorite Ion, and Chlorate Ion Occurrences in theDistribution System ............................................................................................. 69Chlorine Dioxide-Related Odor Complaints ...................................................... 71
Summary and Conclusions ............................................................................................. 72
References ...................................................................................................................... 73
CHAPTER V REFERENCES ................................................................................................ 75
VITA .......................................................................................................................................... 82
APPENDIX A ........................................................................................................................... 83
APPENDIX B ............................................................................................................................ 94

vii
LIST OF FIGURES
Figure 1: Roanoke County Spring Hollow Water Treatment Plant ................................... 42
Figure 2: Schematic: Full-Scale gas:solid chlorine dioxide generator ............................. 45
Figure 3: Chlorine dioxide concentrations throughout the treatment plant,November 24, 1997, through February 5, 1998 ................................................. 50
Figure 4: Variations in chlorite ion concentrations thought the treatment plant,September 9, 1997, through February 10, 1998: Chlorine dioxide dosage overthe period varied from 0 to 0.96 mg/L ............................................................... 52
Figure 5: Variations in chlorate ion concentrations thought the treatment plant,September 9, 1997, through February 10, 1998: Chlorine dioxide dosage overthe period varied from 0 to 0.96 mg/L ............................................................... 53
Figure 6: Chlorine dioxide dosages throughout the study period ...................................... 54
Figure 7: Chlorite ion removal by GAC contactors as a function of the appliedconcentration ...................................................................................................... 57
Figure 8: Comparison of GAC influent and effluent chlorite ion concentrations duringthe period of study .............................................................................................. 58
Figure 9: GAC usage rate over period of study (September 9, 1997–February 10, 1998).. 59
Figure 10: Cumulative chlorite removal over period of the study (September 9, 1997 –February 10, 1998) ............................................................................................. 60
Figure 11: Roanoke County Water Distribution System ..................................................... 61
Figure 12: Comparison of chlorite concentrations in the Roanoke County clearwell anddistribution system (n=9). Sites are arranged (left to right) in order ofincreasing distance from the water treatment plant ............................................ 62
Figure 13: Comparison of chlorate concentrations in the Roanoke County clearwell anddistribution system (n=9). Sites are arranged (left to right) in order ofincreasing distance from the water treatment plant ............................................ 64
Figure 14: Comparison of chlorine dioxide concentrations in the Roanoke Countyclearwell and distribution system. Sites are arranged (left to right) in order ofincreasing distance from the water treatment plant ............................................ 65
Figure A1: Comparison of chlorite ion concentrations determined at Virginia Tech andNovatek (see Table A8) ...................................................................................... 92
viii
Figure A2: Comparison of chlorate ion concentrations determined at Virginia Tech andNovatek (see Table A8) ...................................................................................... 93
Figure B1: LGB standard curve in finished water 11/25/97 ................................................ 97
Figure B2: LGB standard curve in finished water, 12/2/97 .................................................. 98
Figure B3: LGB standard curve in distribution system water, Vauxhall Road, 12/5/97 ....... 99
Figure B4: LGB standard curve in distribution system water, Vauxhall Road, 12/9/97 ..... 100
Figure B5: LGB standard curve in distribution system water, Cordell Drive, 12/10/97 ..... 101
Figure B6: LGB standard curve in distribution system water, Cordell Drive, 12/11/97 ..... 102
Figure B7: LGB standard curve in distribution system water, Buckskin Lane, 12/12/97 ... 103
Figure B8: LGB standard curve in distribution system water, Buckskin Lane, 12/17/97 ... 104
Figure B9: LGB standard curve in distribution system water, Cordell Drive, 1/8/98 ......... 105
Figure B10: LGB standard curve in distribution system water,Fairway Estates Drive, 1/16/98 ......................................................................... 106
Figure B11: LGB standard curve in distribution system water, 1/23/98 ............................... 107
Figure B12: LGB standard curve in distribution system water,Perigrine Crest Circle, 2/13/98 .......................................................................... 108

ix
LIST OF TABLES
CHAPTER 2 - Table 1: Chlorite Ion and Chlorate Ion Limits of Detection andQuantitation by Ion Chromatography ........................................ 35
CHAPTER 4 - Table 1: Spring Hollow Reservoir Raw Water Characteristics ................ 43
APPENDIX – Table A1: Chlorite ion concentration measured throughout the RoanokeCounty Spring Hollow Water Treatment Plant, September 9,1997 through February 10, 1998 ................................................ 84
APPENDIX – Table A2: Chlorate ion concentration measured throughout the RoanokeCounty Spring Hollow Water Treatment Plant, September 9,1997 through February 10, 1998 ................................................ 87
APPENDIX – Table A3: Chlorite ion concentrations in the Roanoke County DistributionSystem, November 25, 1997 through February 13, 1998 ......... 90
APPENDIX – Table A4: Chlorate ion concentrations in the Roanoke CountyDistribution System, November 25, 1997 throughFebruary 13, 1998 ...................................................................... 90
APPENDIX – Table A5: Data for the calculation of chlorite ion and chlorate ion limitsof detection by ion chromatography .......................................... 91
APPENDIX – Table A6: Comparison of chlorite ion and chlorate ion concentrations insplit samples analyzed at Virginia Tech and Novatek, anindependent laboratory ............................................................... 91
APPENDIX – Table B1: Chlorine dioxide concentration measured throughout theRoanoke County Spring Hollow Water Treatment Plant,November 25, 1997 through February 5, 1998 .......................... 95
APPENDIX – Table B2: Chlorine dioxide concentrations in the Roanoke CountyDistribution System, November 25, 1997 throughFebruary 13, 1998 ...................................................................... 96
1
CHAPTER IINTRODUCTION
Roanoke County, Virginia’s Utility Department began using chlorine dioxide (ClO2)
as a preoxidant at its Spring Hollow Water Treatment Plant (WTP) in August, 1997,
approximately nineteen months after the plant became operational. The plant’s raw water
source is the Spring Hollow Reservoir, which is a pump-storage reservoir that impounds
water from the Roanoke River. The plant is a Trident process plant comprised of upflow
adsorption clarifiers followed by trimedia filters and deep bed, post-filter granular activated
carbon (GAC) filters. Chlorine dioxide is generated at the WTP by passing humidified
chlorine gas through solid sodium chlorite (NaClO2), a method that is unique in the water
treatment industry. Other commercial generators produce ClO2 from 25 percent NaClO2
solutions with either aqueous or gaseous chlorine. Production of ClO2 by the gas/solid system
is easily regulated, even at low levels, and the generator effluent contains no chlorite (ClO2-),
chlorate (ClO3-), or chlorine. The Spring Hollow WTP installation of this system was the first
full-scale installation in the United States and provided a unique opportunity for a study of
ClO2 persistence and by-product concentrations throughout the treatment plant and
distribution system, and evaluation of the GAC columns for removing ClO2- from the
finished water.
Chlorine dioxide was included in the Spring Hollow WTP to oxidize manganese and
iron, prevent tastes and odors, and avoid the formation of excessive halogenated disinfection
by-products (DPBs). Chlorine dioxide is the favored oxidant for plants that desire
preoxidation and DBP control. Unlike chlorine, ClO2 oxidizes but does not chlorinate natural
organic matter except under special circumstances not commonly found in drinking water

2
treatment plants. Inorganic disinfection by-products, however, are formed, and one of these,
the chlorite ion (ClO2-), is currently regulated by a maximum contaminant level (MCL) of 1.0
mg/L. The other inorganic by-product, chlorate ion (ClO3-), is not currently regulated, but an
MCL will be promulgated some time in the future.
The ClO2- MCL is not the only concern associated with ClO2 use. Utilities that apply
ClO2 as a preoxidant and add free chlorine to finished water prior to distribution often
receive complaints of offensive odors in homes and businesses. Past studies have shown that
these odors are caused by unidentified chemicals produced during air-phase reactions
between ClO2 released from water when the customer opens a tap and volatile organic
compounds originating from a variety of sources, primarily new carpeting. Often, the
problems have been sufficient cause for utilities to abandon ClO2 addition at their treatment
facilities. The problem does not occur in systems that convert free chlorine to
monochloramine prior to distribution or remove ClO2- prior to chlorine addition. The ClO2
MCL (0.80 mg/L), which is measured at the entrance to the distribution system, is relatively
high compared to concentrations that reform in the distribution system and cause customer
complaints. A relatively new ClO2 analysis method can be used to quantify low ClO2
concentrations (0.01 mg/L), and the availability of this method provided an opportunity for
the author to study the association between odor complaints and ClO2 levels in the
distribution system.
Specific objectives of the study were to: (1) document changes in ClO2, ClO2- and
ClO3- concentrations throughout the Spring Hollow WTP and the distribution system
following ClO2 pretreatment of raw water, (2) evaluate the effectiveness of GAC in post-

3
filter contactors for ClO2- removal, and (3) determine the extent of ClO2 reformation in the
distribution system and the concentrations associated with customer complaints of odors.
The research presented in this thesis was the basis of a technical presentation at the
1998 Annual American Water Works Association Conference and Exposition in Dallas,
Texas. It appears in the proceedings of that conference (Ellenberger et al., 1998).

4
CHAPTER IILITERATURE REVIEW
Chlorine Dioxide and By-product Chemistry
Chlorine dioxide (ClO2) exists as a volatile, energetic free radical and is quite
reactive. It is explosive at 5.8 psi (40 kPa), or above atmospheric pressure at 6 psig (41 kPa).
As a result, ClO2 cannot be compressed or stored and must be generated on-site and solutions
with concentrations greater than 10 g/L may present an explosive hazard (Aieta and Berg,
1986). Chlorine dioxide concentrations are generally in the range of 0.1 mg/L to 5.0 mg/L
for water treatment.
Chlorine dioxide does not hydrolyze in water but remains a highly soluble gas above
11°C over a broad range of pH (2 to 10). Solutions are greenish-yellow and smell strongly
chlorinous (Gordon and Rosenblatt, 1996). Aqueous solutions must be protected from light,
as chlorine dioxide is subject to photolysis by ultraviolet light (Zika, 1985), and even
fluorescent lights (Griese et al., 1992).
The most common methods for the generation of ClO2 for drinking water treatment
involve sodium chlorite (NaClO2), either as a solid or in solution (Aieta and Berg, 1986).
Sodium chlorite is reacted with either chlorine gas (Cl2), hypochlorous acid (HOCl), or
hydrochloric acid (HCl) in the following reactions (Aieta and Berg, 1986; Gordon et al.,
1972):
NaClClOClNaClO gg 222 )(2)(22 +→+ [1]
22 22 ClONaOHNaClHOClNaClO ++→+ [2]
NaClOHClOHClNaClO g 52445 2)(22 ++→+ [3]

5
During the first two reactions, an unstable intermediate, Cl2O2, is formed if the reactants are
in high concentrations. When chlorite ion (ClO2-) concentrations are low, the intermediate
decays to chlorate ion (ClO3-). Chlorate ion production can also occur when initial reactant
concentrations are low or when chlorine (or hypochlorous acid) is in excess. When initial
reactant concentrations are high or when ClO2- concentrations are in excess, the intermediate
decays to ClO2 (Gordon and Rosenblatt, 1996).
During the generation of ClO2, it is desirable to minimize or eliminate unwanted by-
products such as ClO2- and ClO3
- as well as excess chlorine. The production of unwanted by-
products can occur when there is feedstock contamination, improper generator control, or
excess chlorine (Long et al., 1996; Gates, 1998). In Reaction 3, only an 80 percent
conversion of NaClO2 to ClO2 is possible (Aieta and Berg, 1986), and, therefore, this method
is not popular.
Recently, a method for generating high-purity ClO2 by reaction of solid NaClO2 with
chlorine gas has become available (Gordon and Rosenblatt, 1996). The chlorine gas is first
mixed with humidified air and then passed through a series of drums containing solid
NaClO2. No unreacted NaClO2 enters the system because the generated ClO2 is in the gas
phase, and ClO3- is not produced.
The main reaction product of ClO2 in water is the chlorite ion. Its reduction occurs
by an one electron transfer, forming ClO2- as shown in this half-reaction (White, 1972;
Gordon et al., 1972):
−− →+ 22 ClOeClO [4]
Masschelein (1979) reported, “In aqueous solution, chlorination by chlorine dioxide is not a
direct reaction. However, indirect chlorination by dioxide having undergone a previous

6
reaction may not necessary be excluded.” He attributed reports of chlorinated organic by-
products produced to the presence of chlorine in the ClO2 solution that was used. Chlorine,
on the other hand, reacts with organic compounds to form chlorinated organic by-products
(Rook, 1974; Bellar et al., 1974).
Chlorite ion, which also is an oxidant, reacts at a much slower rate than ClO2 under
conditions generally encountered in water treatment. Chlorite ion is reduced to chloride ion
(Cl-) by the following reaction (Aieta and Berg, 1986; Gordon et al., 1972; Masschelein,
1979):
O2HCl4e4HClO 22 +→++ −−+− [5]
This reaction does not occur, however, unless reduced compounds such as ferrous iron
(Fe2+), phenol, or humic materials are present. Typically, from 50 to 70 percent of the
reacted ClO2 appears as ClO2- with the balance forming either Cl- or ClO3
- (Aieta and Berg,
1986; Limoni et al., 1984; Rav-Acha et al., 1984; Werdehoff and Singer, 1987; Singer and
O’Neil, 1987).
In basic solutions, ClO2 disproportionates to form ClO2- and ClO3
- (Aieta and Berg,
1986):
OHClOClOOHClO 2322 22 ++→+ −−− [6]
Under certain conditions chlorine and ClO2 can react to form ClO3- (Aieta and Berg, 1986):
HClHClOOHHOClClO ++→++ +− 222 322 [7]
Chlorine dioxide is subject to photochemical decomposition through a series of
reactions to Cl- and ClO3- (Zika, 1985). Griese et al. (1992) reported significant formation of
ClO3- (0.36 to 0.97 mg/L) when water containing from 3.56 mg/L to 3.99 mg/L ClO2 was

7
exposed to fluorescent light. In control experiments, water treated with ClO2 and kept in the
dark did not contain ClO3-.
Chlorite ion reacts with chlorine in treated water to reform ClO2, in the same manner
that ClO2 is generated (Reaction 2 presented previously). This reaction, however, depends
heavily on pH and relative reactant concentrations. In basic solutions when the hypochlorite
ion (OCl-) is present, greater amounts of ClO3- are formed by the following reaction (Gordon
et al., 1990; Werdehoff and Singer, 1987):
−−−− ++→++ 322 ClOClOHOHHOClClO [8]
In acidic solutions when ClO2- is in excess, more ClO2 than ClO3
- is formed (Gordon et al.,
1972; Gordon et al., 1990; Werdehoff and Singer, 1987):
−−− ++→+ OHClClOHOClClO 22 22 [9]
In neutral solutions chlorine and ClO2 react to form ClO3- and Cl- (Gordon et al., 1972):
+−− ++→++ 3HCl2ClOOHHOCl2ClO 322 [10]
Chlorine Dioxide Applications in Water Treatment
Chlorine dioxide is commonly used as a preoxidant and primary disinfectant during
drinking water treatment. As a preoxidant, it is used mainly as an alternative to chlorine, for
trihalomethane (THM) control (Dietrich et al., 1992b). It is also used for taste-and-odor
control, manganese and iron oxidation, and color removal. In the United States, over 500
water treatment plants use ClO2 full time and as many as 900 use it either part time or
seasonally (Hoehn, 1993). In some European countries, ClO2 is also used to maintain a
distribution system residual. In the United States, ClO2 application is generally followed by

8
free chlorine or chloramines to maintain the distribution system residual (Aieta and Berg,
1986).
Trihalomethane Control
In the early 1970s, two separate investigators found that chlorination of natural waters
containing humic substances caused THM formation (Rook, 1974; Bellar et al., 1974). Since
then, additional substances have been identified as precursors to THMs, including fulvic
acids, algal materials, and various aromatic substances (Cooper et al., 1985). In 1976,
chloroform was reported to cause an increased incidence of tumor formation (Gallagher et
al., 1994 citing National Cancer Institute, 1976). Under the newly promulgated Stage 1
Disinfectant/Disinfection By-Product (D/DBP) Rule, total trihalomethanes (TTHMs) and
haloacetic acids (HAAs) are regulated at 0.080 mg/L and 0.060 mg/L, respectively (Federal
Register, 1998). The search for alternatives to chlorine for disinfection and oxidation has
been one of the primary research objectives in water treatment. Chlorine dioxide has been
recommended both as an alternative preoxidant and supplemental disinfectant with chlorine
(AWWA, 1982).
Chow and Roberts (1981) compared the application of chlorine and ClO2 to two
wastewater effluents. They reported no significant amounts of THMs were produced in
either wastewater when ClO2 was used. Only marginally significant amounts of total organic
halogens (TOX) were produced with ClO2. When chlorine was used, significant amounts of
both THMs and TOX were formed. Approximately one percent of the applied chlorine dose
was converted to organic halogens.

9
A study was undertaken in Evansville, Indiana, to evaluate ClO2 as an alternative to
chlorine for pretreatment in order to reduce THMs (Lykins and Griese, 1986). The authors
reported annual average total trihalomethane (TTHM) concentrations between 50 µg/L to 80
µg/L when using ClO2 for predisinfection. During the year-long pilot study, the authors
reported a reduction in finished water THMs of almost 60 percent when ClO2 was used for
predisinfection. The authors noted that the ClO2 generator effluent contributed
approximately 0.2 mg Cl2/L when the ClO2 dose was 1.6 mg/L. The investigation also
included an evaluation of total organic carbon (TOC) removal when both chlorine or ClO2
were used for predisinfection, but no differences in average TOC concentrations were
observed following treatment with both predisinfectants. The authors also noted that ClO2
increased disinfection costs and cited another study (USEPA, 1983) in which the increased
cost to customers of a utility in South Carolina was $1.77 per residence per year.
Werdehoff and Singer (1987) conducted experiments with waters from various
sources in Virginia to determine whether ClO2 pretreatment reduced THM and TOX
formation. The authors reported that ClO2 treatment reduced THM and TOX precursor
concentrations, but the extent to which they were reduced was dependent on the ratio of
ClO2:TOC. A ratio of 0.4 or greater was necessary to obtain a reduction of greater than 10
percent. The authors also observed ClO2- was the major end product of the reaction between
ClO2 and fulvic acid, indicating that ClO2 reacts primarily by a one-electron transfer.
In a study conducted by the Indianapolis Water Company (Long et al., 1996), raw
water was dosed with high-purity ClO2 (1 mg/L to 6 mg/L) and alum. The authors reported
ClO2 residuals ranging from 0 mg/L to 3.85 mg/L and TTHM levels from 1.4 µg/L to 10.4
µg/L compared to 69 µg/L and 69.9 µg/L in the chlorine-treated controls. The authors also

10
noted that the TTHM levels in the treated samples were due almost entirely to the TTHM
content of the finished tap water used in preparing the ClO2 solutions, and about 1.5 µg/L to
2.0 µg/L of TTHM were contributed per mg/L ClO2 dose.
Taste and Odor Control
Chlorine dioxide was first employed in potable water treatment in 1944 at the Niagara
River Plant in Niagara, New York (Synan et al., 1944). It was used successfully to control
phenolic/chlorophenolic tastes and odors and seasonal algal tastes and odors at considerable
cost savings over those associated with previously employed control methods, chlorine and
activated carbon.
A water utility in Alberta, Canada, removed chlorophenolic and other tastes and odors
from its water supply with ClO2 treatment for tastes and odors, primarily caused by
chlorophenols (Walker et al., 1986). The results indicated ClO2 effectively removed the
chlorophenolic tastes and odors. The investigators also found that algal and bacterial
metabolites, presumed to be the cause of musty and fishy tastes and odors, were effectively
eliminated with ClO2 treatment. Chlorine dioxide treatment also eliminated algal and aquatic
weed growths in outdoor basins.
Although ClO2 can effectively oxidize some taste-and-odor compounds, certain ones
are resistant. Lalezary et al. (1986) reported that ClO2 reduced geosmin and 2-
methylisoborneol (MIB) concentrations by only 30 percent at dosages and contact times
considerably greater than those usually used for water treatment. Glaze et al. (1990),
reported similar results for geosmin and MIB oxidation by ClO2 with removal levels of 17

11
percent and 2 percent, respectively, but found that ozone reduced geosmin and MIB levels by
73 percent and 86 percent, respectively, at a dose of 4.0 mg/L.
Disinfection
The disinfection capabilities of ClO2 were recognized in the 1940s not long after its
introduction in water treatment (McCarthy, 1944). White (1972) mentioned several early
studies in which ClO2 was an effective bactericide over a broad range of pH values
(Ridenour and Ingols, 1947) and an effective virucide (Hettche and Ehlbeck, 1953). White
(1972) also reported on the work of Bernarde et al. (1965), who found that the disinfection
efficiency of ClO2 increases as a function of pH. Lykins et al. (1991) summarized CT
(concentration times contact time) data from several more recent disinfection studies (Hoff,
1986; Federal Register, 1989; Korich et al., 1990) that show ClO2 to be a superior
disinfectant to free chlorine and chloramines against Giardia lamblia, Giardia muris, and
Cryptosporidium parvum. The CT value for Cryptosporidium inactivation by ClO2 is three
orders of magnitude less than the CT values for inactivation by free chlorine and chloramines
at pH 7 and 25°C (CT of 78 for 90 percent inactivation for ClO2, 7200 for 90 percent
inactivation for chloramines, and 7200 for 99.9 percent inactivation for free chlorine).
Finch et al. (1995) reported the CT value for 99.9 percent Cryptosporidium
inactivation with ClO2 was 140 (pH 7 and 25°C) using animal infectivity data. Liyanage et
al. (1997) reported a synergistic effect on Cryptosporidium parvum inactivation when ClO2
pretreatment was followed by application of free chlorine or monochloramine. They found
that ClO2 (1.3 mg/L for 120 minutes) followed by free chlorine (1.6 mg/L for 120 minutes)
resulted in a 3 log-unit (99.9 percent) reduction in infectivity. Similarly, they found that

12
ClO2 (1.5 mg/L for 120 minutes) followed by monochloramine (2.8 mg/L for 180 minutes)
resulted in a 2.8 log-unit (99.84 percent) reduction in infectivity. The expected inactivations
by ClO2, free chlorine or monochloramine alone were 1.7 (98 percent), 0.0, and 0.0 log-units,
respectively. The researchers hypothesized that the synergistic effect demonstrated by
sequential disinfection is because “the stronger oxidant conditions the outer membrane of the
oocysts so that the secondary oxidant can penetrate the oocyst wall more readily.”
Manganese Oxidation
Soluble manganese (Mn2+), which is commonly found in groundwater sources and
reservoirs, can cause staining of laundry and plumbing fixtures, and black water (White,
1972). A secondary maximum contaminant level (MCL) of 0.05 mg Mn/L has been set for
manganese to avoid these problems (Federal Register, 1979). During water treatment, Mn2+
is typically removed by oxidation and the resulting precipitate, manganese dioxide (MnO2),
is then removed by sedimentation and/or filtration (Knocke et al., 1987). Chlorine dioxide
has been shown to be an effective manganese oxidant and reacts more rapidly than chlorine
(White, 1972).
The oxidation-reduction reaction between Mn2+ and ClO2 yields ClO2-, which
involves a one-electron transfer between ClO2 and ClO2-. Experiments conducted by
Knocke et al. (1990) demonstrated that ClO2- cannot oxidize Mn(II). The reaction between
ClO2 and Mn2+ at a neutral pH occurs as follow (Knocke et al., 1990):
+−+ ++→++ HClOsMnOOHClOMn 42)(22 22222 [11]
From the stoichiometry, 2.45 mg of chlorine dioxide are required to oxidize 1 mg of
soluble manganese (White, 1972). Knocke et al. (1987) reported that a ClO2 dose at least

13
twice the stoichiometric quantity was required to reduce manganese levels below the
secondary MCL (0.05 mg Mn/L). In that study, ClO2 was effective over a pH range of 5 to 8
and at temperatures as low as 50°F (10°C). Chlorine dioxide dosages greater than 3 mg/L
were required to reduce manganese concentrations to less than 0.05 mg Mn/L, when the total
organic carbon (TOC) concentration was 8 mg/L. In water treatment applications, ClO2
dosages of this magnitude would not be practical unless the resulting ClO2- concentration
was reduced to below the MCL by the addition of ferrous iron or reduced-sulfur compounds.
Knocke et al. (1990) showed that manganese forms a weak complex with organic acids and is
capable of being oxidized by ClO2.
Iron Oxidation
Iron can also cause staining of laundry and plumbing fixtures and promote the growth
of iron bacteria in the distribution system (White, 1972). A secondary MCL of 0.3 mg/L has
been set for iron to avoid these problems (Federal Register, 1979). Chlorine dioxide can
rapidly oxidize iron to an insoluble, iron hydroxide (Fe(OH)3), which can be removed by
sedimentation and filtration. Iron oxidation by ClO2 under water treatment conditions,
occurs as follows (Knocke et al., 1990):
+−+ ++→++ HClOsOHFeOHClOFe 3)()(3 23222 [12]
From the stoichiometry, 1.2 mg of chlorine dioxide was required to oxidize 1 mg of soluble
iron (White, 1972). Chlorite ion also can oxidize Fe(II); the reaction is summarized as
follows (Ondrus and Gordon, 1972):
+−−+ ++→++ HClsOHFeOHClOFe 8)()(4104 3222 [13]

14
Chlorine dioxide also can oxidize iron when it is complexed with organic compounds
(Masschelein, 1979). Knocke et al. (1990), however, found that Fe(II) complexed with
organics was stable in the presence of ClO2, even when the ClO2 dosage was well in excess
of the stoichiometric amount.
Analytical Techniques
Several methods for quantifying ClO2, ClO2-, and ClO3
- are available. These include
amperometric titration, N, N-diethyl-p-phenylenediamine titration (DPD), iodometric
titration, chlorophenol red, and ion chromatography. The amperometric method is approved
for compliance monitoring of ClO2, and ion chromatography is approved for ClO2- analyses
(Federal Register, 1998). The lissamine green B Method for detection of ClO2 at low levels
in the presence of chlorine, has been developed, but it is not currently an EPA-approved
method. These methods are discussed in the following sections.
The Amperometric Method
The amperometric method can be used to determine ClO2, Cl2, ClO2-, and ClO3
-. It
involves titrimetric determination of iodine that is formed when iodide is oxidized by the
species of interest by titration. The titrant may be either phenylarsine oxide (PAO) or sodium
thiosulfate (Aieta et al., 1984; APHA, 1995). During the procedure, several titration steps
are required following various pretreatment and pH adjustments that allow differentiation
between the various species. According to Aieta et al. (1984), “calculations are based on the
equivalents of reducing titrant required to react with the equivalents of oxidants present.” No
differentiation is made between free and combined chlorine by this procedure.

15
The method can be used for measuring ClO2 concentrations in product streams of
ClO2 generators (10 mg/L to 1000 mg/L for individual species) and treated drinking water
(0.1 to 1 mg/L) (Aieta et al., 1984). The method detection limit for ClO2 was reported to be
0.05 mg/L. Analytical precision during the titration steps is imperative, as errors in one
titration step will affect subsequent calculations. This method relies on calculations of the
difference between two large numbers, and small differences in titrant volumes could
potentially result in large cumulative errors. The method is subject to several interferences
(e.g. dissolved oxygen, manganese, copper, and nitrate) at the low pH conditions required for
the ClO2- and ClO3
- analyses (Aieta et al., 1984). Chloramines are also potential
interferences in ClO2 measurements since they interfere with the amperometric method for
free available chlorine (Jensen and Johnson, 1990).
During the study reported in this thesis, the amperometric method was used only to
verify ClO2 stock solution concentrations on a few occasions. It was not used for monitoring
ClO2 in either the treatment plant or distribution system.
Lissamine Green B Method
The lissamine green B (LGB) method for ClO2 determination was recently developed
by Chiswell and O’Halloran (1991). This colorimetric method is not subject to interferences
common to other methods such as DPD, chlorophenol red, and amperometric titration.
Lissamine green B has a greater redox potential (+1.0V) than combined chlorine, ClO2-, and
ClO3-, and therefore, is not subject to interferences from those species. The authors raised
the solution pH to ensure free chlorine would exist almost entirely as hypochlorite, thereby
reducing the interference by free chlorine, as hypochlorous acid, which has a greater redox

16
potential than LGB. However, ClO2 has been documented to disproportionate in basic
solutions. The researchers determined that a solution of LGB in the presence of an ammonia-
ammonium chloride buffer at pH 9.0 resulted in optimal conditions. The basis of the test is
the oxidation of the lissamine green B dye, which results in reductions in absorbance.
The method involves the addition of a pH 9.0 ammonia buffer and LGB reagent
solution to a sample, and the sample absorbance is analyzed by spectrophotometry at 614
nanometers (nm) typically in a 1 centimeter (cm) quartz cuvette. The pH 9.0 buffer ensures
that any free chlorine is in the form of hypochlorite, a weaker oxidant than hypochlorous
acid, that is less likely to react with the LGB reagent solution. At higher pH levels, the
disproportionation of ClO2 would become significant.
Research conducted recently by Hofmann et al. (1998) confirmed that the LGB
method is not subject to interference by free chlorine, ClO2-, ClO3
-, and permanganate at
concentrations up to 5 mg/L. The authors reported the method detection limit to be 0.017
mg/L when the path length was 1 cm. The upper limit of the linear range was reported to be
1.8 mg/L. The authors investigated the effects of temperature and measured higher
concentrations as the temperature decreased. A 30 percent positive error occurred when
analyzed samples were at 4°C and compared to a calibration curve developed at 20°C. The
error was less than 10 percent when the sample temperature was 12°C. The researchers
recommended no more than 10°C difference between samples and standards. They also
investigated potential interferences by color and noted that if the blank absorbance was
attributed to both the LGB reagent and natural color, the change in absorbance following
17
ClO2 addition would be due not only to oxidation of the LGB but also to color-causing
compounds as well. They suggested the following equation:
[ ] MATRIXWATERREAGENTMEASURED ColorColorClO ∆+∆∝2 [14]
Five different waters with varying degrees of color were tested and the estimated maximum
error was 0.05 mg/L. They found that after 10 minutes, ClO2 did not oxidize the color and
reacted only with the LGB reagent. The authors suggested using purged matrix water for
preparing the calibration curves and blanks.
Ion Chromatography
Ion chromatography (IC) is used for the determination of ion concentrations in
drinking water. It is also particularly useful for the determination of certain inorganic
disinfection by-products, such as oxyhalides of chlorine and bromate, as it is not subject to
interferences common in other methods (Pfaff and Brockhoff, 1990).
The USEPA developed Method 300.0B specifically for analyses of ClO2- and ClO3
-
which involves the use of an ion exchange column (Dionex AS9) that is specifically designed
to enhance the separation of ClO3- and ClO2
- from other closely eluting anions (NO3- and Cl-)
(Pfaff et al., 1989). The sample is injected into the mobile phase (eluant), which carries the
sample through the stationary phase (column). A guard column, which is a shorter version of
the analytical column, is usually placed in front of the analytical column to protect the
analytical column from contamination. The anions separate based on their affinity for the
stationary phase.
After moving through the column, the separated anions flow through an anion
micromembrane suppressor, which suppresses the background conductivity of the eluant.
18
After each anion passes through the suppressor, a conductimetric detector measures the
conductivity. Each anion retention time is characteristic for the particular system
configuration. The conductivity of column effluent is plotted over time by an integrator,
which determines the area or height for each peak.
The unknown concentrations of each anion can be determined by comparison of peak
height or peak area to a calibration curve developed from the analyses of a series of standard
solutions. The concentrations are then plotted against either the peak height or peak area, and
the regression is determined. The regression formula is then used to calculate the
concentrations of the unknowns. Novatek (1993) recommends a correlation coefficient of at
least 0.999. The reported detection limits for Method 300.0B are 0.01 mg/L and 0.003 mg/L
for ClO2- and ClO3
-, respectively (Pfaff et al., 1989).
According to Method 300.0B, ClO2- samples must be analyzed immediately because
ClO2- is not stable in the presence of chlorine. Research by Pfaff and Brockhoff (1990)
showed that ClO2- becomes unstable after one hour when chlorine is present. They reported
that ClO3- should be stable for at least 30 days. Method 300.0B allows a holding time for
ClO3- samples up to 28 days. Two studies (Dietrich et al., 1992a; Hautman and Bolyard,
1992) have shown that a preservative, ethylenediamine, can be added to the sample to
increase the stability of ClO2- to 18 days. These studies also confirmed ClO3
- is stable for at
least 18 days without a preservative.

19
Chlorite Ion Concentrations in Distribution Systems
Chlorite ion is the most abundant ClO2 byproduct in the distribution system of
utilities that add the oxidant during water treatment. Thompson et al. (1989) reported the use
at their utility of 0.75 mg/L ClO2 as a preoxidant and as a chlorine co-disinfectant at a dose
of 0.75 mg/L. Residual ClO2- concentrations in the distribution system decreased from 0.76
mg/L to 0.67 mg/L with increasing distance from the treatment plant, while the ClO3-
concentration remained constant throughout the system at an average concentration of 0.21
mg/L.
Other investigations of ClO2- concentrations in the distribution system have been
reported by Gallagher et al. (1994), Bolyard et al. (1993), Hoehn et al. (1990), USEPA
(1997) and Bubnis (1997). Gallagher et al. (1994) found ClO2- concentrations ranging from
nondetectable to 2.41 mg/L in the distribution systems (including clear wells) of five utilities.
Bolyard et al. (1993) found concentrations ranging from 0.052 mg/L to 0.74 mg/L at four
sites where ClO2 was being used. The USEPA (1997) summarized occurrence data collected
from 65 utilities (885 samples). The mean ClO2- concentration was 0.58 mg/L while the
range was from 0.01 mg/L to 2.60 mg/L. Bubnis (personal communication) reported a ClO2-
concentration range of 0.21 mg/L to 0.86 mg/L in the distribution systems of 18 Texas
utilities during 1997. A vast majority of the utilities would have met the current ClO2- MCL
of 1.0 mg/L.
McGuire et al. (1999) presented evidence that residual ClO2- in the distribution
system suppresses nitrification by killing ammonia-oxidizing bacteria, thus preventing
nitrifier biofilm production. Coliforms and heterotrophic plate count bacteria were
unaffected.

20
Chlorine Dioxide Concentrations in Distribution Systems and Associated Odors
In the United States, ClO2 is seldom added directly to water entering the distribution
system. An exception is the Gulf Coast Water Authority in Galveston, Texas. At that
utility, ClO2 has been applied both as a preoxidant (dose 0.75 mg/L) and again following
filtration (dose 0.75 mg/L) as water entered the clearwell. Chlorine was also applied at the
same time, and ammonia was added to form chloramine as the water entered the distribution
system. Residual ClO2 concentrations in the distribution system decreased from 0.31 mg/L
as water exited the clearwell to 0.12 mg/L in the distribution system.
Direct addition to finished water is not the only way ClO2 can appear in the
distribution system, however. It can be regenerated in small amounts by the same reaction
between residual ClO2- and free chlorine (Reaction 2) as occurs during ClO2 generation at the
treatment plant. Chlorate ion can also form by chlorine reactions with both ClO2 (Reaction
7) and ClO2- (Reaction 2). Chlorine dioxide can also react with free chlorine to form both
ClO3- and ClO2
-. The concentrations of ClO2 and its by-products one observes at any
particular point in the distribution system are the results of a complex cyclic series of
reactions involving ClO2 formation, reduction to ClO2- and/or formation of ClO3
-, and then
ClO2 reforms once again when free chlorine oxidizes ClO2- (Gallagher et al., 1994).
Chlorine dioxide in the distribution system can react to produce odors variously
described as “cat urine,” “chlorine,” “petroleum” and “kerosene” in customers’ homes
(Hoehn et al., 1990). Reports of tastes and odors in the distribution system that are related to
ClO2 use at the treatment plant date back to the 1940s when McCarthy (1944) reported a
kerosene taste in the distribution system of a Massachusetts utility. He attributed the tastes,
however, to ClO2 oxidation and subsequent detachment of pipe slimes in the distribution
21
system, which, he believed, exposed airplane fuel that had entered the treatment plant several
years earlier following a crash in the reservoir. Some of the fuel escaped treatment and
entered the distribution system where he believed it coated the pipes. In time, according to
McCarthy, the deposited airplane fuel must have been coated by a layer of biofilm that
prevented further odor problems until he began applying ClO2 at the treatment plant.
Hoehn et al. (1990) discovered the actual cause of the kerosene-like odors during an
AWWA Research Foundation research project, namely that they result from reactions
between volatile organics in the household air and ClO2 volatilized at the tap. The specific
organic compounds that produce the odor have not been determined at this time. New
carpeting is the most common source of volatile organic compounds that may be precursors
to the odors, but other sources (e.g. paints and hand soaps containing hydrocarbons) are
possible. Hoehn et al. (1990) cited many reports linking ClO2-related odor complaints to
new carpeting. These odors can be avoided either by substituting monochloramine for
chlorine in the distributed water or by removing ClO2- at the treatment plant prior to
distribution system chlorination.
Regulation of Chlorine Dioxide and Its By-products
Regulation of ClO2 and its by-products has been one of the foremost concerns with its
use. As more research studies are undertaken to address the need for health effects data on
ClO2 and its by-products, regulations may be set at scientifically based levels.
In July, 1994, the USEPA proposed a maximum residual disinfectant level (MRDL)
of 0.8 mg/L for ClO2, and a maximum contaminant level (MCL) of 1.0 mg/L for ClO2- in the
Disinfection/Disinfectant By-product (D/DBP) Rule (Federal Register, 1994). The proposed

22
rule also specified a maximum residual disinfectant level goal (MRDLG) of 0.3 mg/L for
ClO2 and a maximum contaminant level goal (MCLG) of 0.08 mg/L for ClO2-. The Final
D/DBP Rule (Federal Register, 1998) retained the proposed ClO2- MCL and the ClO2 MRDL
but increased both the MCLG for ClO2- and the MRDLG for ClO2 to 0.8 mg/L on the basis of
“a weight-of-evidence evaluation of all health data on ClO2- including a two-generation
reproductive rat study sponsored by the Chemical Manufacturers Association (CMA, 1996).”
In explaining the reason for increasing the ClO2 MRDLG to 0.8 mg/L, the USEPA stated
“that data on chlorite are relevant to assessing the risks of chlorine dioxide because chlorine
dioxide is rapidly reduced to chlorite” (Federal Register, 1998). The promulgated limits
were based on the “no observable adverse effect levels (NOAEL)” for hemolytic effects. No
MCL for ClO3- was proposed in the D/DBP Rule because health effects data were not
available at the time it was published.
Chlorite Ion Control
Meeting the MCL for ClO2- ion most likely will require control at the treatment plant
if ClO2 is applied at concentrations high enough for disinfection, especially if
Cryptosporidium rather than Giardia becomes the target organism. Several removal
strategies exist for ClO2- that vary in effectiveness and end products. While no MCL yet
exists for ClO3-, once it is introduced into or formed in the distribution system, it cannot be
removed.

23
Reduction by Ferrous Iron
Ondrus and Gordon (1972) reported ClO2- reduction by ferrous iron, Fe(II), under low
pH (< 2.0) and high ionic strength (2.00 M) conditions. The overall reaction was:
+−− ++→++ HClOHFeOHClOIIFe s 8)(410)(4 )(322 [15]
Investigations of ClO2- reduction by ferrous iron were also undertaken by Griese et al.
(1991). In this study, they found that ClO2- (ClO2 dose 1.5 mg/L to 4.0 mg/L) could be
completely removed in less than 30 minutes at pH 6.0 to 7.0. These studies were conducted
with ferrous iron dosages well in excess of the stoichiometric requirement. The initial and
final oxychlorine compound concentrations (e.g. the sum of ClO2, ClO2-, and ClO3
-) were
compared. The final oxychlorine compound concentration was comprised almost entirely of
ClO3-, with no significant differences in the initial and final ClO3
- concentrations. This
indicated that the ClO3- originated as a contaminant in the ClO2 generator effluent and not as
a result of the ferrous iron treatment.
Further research conducted by Griese et al (1992), combined ClO2- reduction by
ferrous iron with alternative ClO2 generation methods. In the study, oxychlorine residuals
remaining after water was treated with both liquid-phase and gas-phase ClO2 generation
systems were compared. The application of gas-phase ClO2 resulted in minimal ClO3-
concentrations, and the application of ferrous iron resulted in complete removal of ClO2-
(ClO2 dose 2.0 mg/L to 5.0 mg/L). Chlorate ion concentrations increased dramatically when
water treated with ClO2, but not ferrous iron, was chlorinated, indicating the importance of
removing ClO2 and ClO2- prior to post chlorination. The researchers also verified that ClO2
photochemically degrades to ClO3- when exposed to light, as described earlier.

24
Iatrou and Knocke (1992) reported that ferrous iron added to water at a ratio of 3.1
mg Fe(II)/mg ClO2- effectively eliminated ClO2
- from finished water. They reported also that
ClO2- reduction by Fe(II) was complete within 1 to 2 minutes at typical water treatment
conditions. No ClO3- formation occurred when solutions of ClO2
- (initial concentration up to
4.0 mg/L) were treated with Fe(II) over a pH range of 5.5 to 8.0.
The possible interference of dissolved oxygen in the Fe(II)-ClO2- reaction was also
investigated by Iatrou and Knocke (1992). They found that the Fe(II)-ClO2- reaction at
neutral pH was not significantly affected by dissolved oxygen. Residual Fe(II) remaining
when the dosages were in excess of the stoichiometric amount was eliminated by reaction
with dissolved oxygen at pH 7.0. At pH 6.3 and below, excess Fe(II) was not removed by
reaction with dissolved oxygen. In studies with alum coagulation, addition of Fe(II) did not
interfere with dissolved organic carbon (DOC) removal or increase the settled-water
turbidity.
Hurst and Knocke (1997) investigated ClO2- reduction by Fe(II) under alkaline pH
conditions (pH 7 to 10) and found that a dosage slightly in excess of the stoichiometric
amount was required to remove ClO2- effectively. The excess Fe(II) was necessary to
account for some DO interference in the Fe(II)-ClO2- reaction. Again, no ClO3
- formation
was detected. A mass balance of the oxychlorine species for the Fe(II)-ClO2- reaction
revealed that Cl- was the major product (> 95 percent).
25
Reduction by Reduced-Sulfur Compounds
Gordon et al. (1990) reported ClO2- reduction by sulfur dioxide-sulfite ion
(SO2-SO32-), which they said occurred by the following reaction over a pH range of 4.0 to
7.5:
−−−− +↔+ ClSOClOSO 242
24 22 [16]
Their research indicated that ClO2- removal was more rapid when the pH was acidic. The
authors reported complete ClO2- reduction in less than one minute when a tenfold weight
excess of sulfur dioxide/sulfite (SO2-SO32-) was reacted with 0.5 to 7.0 mg/L ClO2
- at pH 5
and below and complete ClO2- reduction in less than 15 minutes at pH 6.5. The authors
noted that dissolved oxygen may interfere with SO2-SO32-/ClO2
- reaction by competing for
SO2-SO32-.
Griese et al. (1991) achieved complete ClO2- reduction following the addition of
SO2-SO32-, but significant amounts of ClO3
- were formed when the pH ranged from 4.0 to
8.5. The authors noted an increase in ClO3- concentration when the SO2-SO3
2-/ClO2- reaction
occurred in the presence of dissolved oxygen. These results concur with those of Dixon and
Lee (1991), who also noted significant ClO3- formation. Griese et al. (1991) concluded that
the application of sulfur-based reducing agents was not a viable strategy for ClO2- removal
during drinking water treatment. Griese et al. (1991) also evaluated sodium thiosulfate for
ClO2- removal and found that it effectively reduced ClO2
- over a pH range of 4.5 to 6.5. but
the reaction was heavily dependent on pH and contact time. No significant ClO3- was
formed.
26
Reduction by Granular Activated Carbon
Voudrias et al. (1983) determined that chloride ion (Cl-) was the predominant end
product in a study in which a ClO2- solution of 11 mg/L at pH 7 was passed through a
granular activated carbon (GAC) column. During this study, the ClO2- removal rate declined
significantly after 80 to 90 mg ClO2- per gram of carbon had been removed. They found that
only 4 percent of the total Cl was not accounted for by Cl-. In another experiment, the
authors found that the GAC capacity for removing ClO2- was reduced when a solution of
ClO2- and vanillic acid was passed through a GAC column. They hypothesized that GAC
surface functional groups that otherwise would be available for reducing ClO2- become
unavailable when organic compounds are adsorbed, thus reducing the ClO2- removal
efficiency.
As part of a potable-water reuse study conducted by the Denver Water Department
(Lohman and Rogers, 1987) ClO2- removal by GAC was evaluated. Results from a column
experiment indicated that complete ClO2- reduction was achieved only when the GAC
column loading rate was below 15 mL/min of up to 10 mg/L ClO2-. The authors concluded
that at higher loading rates, the reaction time for complete ClO2- removal was exceeded.
They reported that 80 percent ClO2- reduction was still achieved after 7,440 bed volumes had
passed through the column (equivalent to six months full-scale operation). During plant-
scale tests, complete ClO2- reduction was achieved (ClO2
applied dose 1.5 mg/L) with an
empty bed contact time (EBCT) of 30 to 40 minutes (equivalent hydraulic loading rate of 4.7
gpm/sf). No apparent differences in the performance of virgin and reactivated carbon were
noted. Lohman and Rogers (1987) cited a study by Lykins and DeMarco (1983) who
reported a ClO2- reduction of 67 percent with an EBCT of 7.7 (hydraulic loading rate 5.1

27
gpm/sf). Steinbergs (1986) reported ClO2- reduction of approximately 85 percent with an
EBCT of 6.4 minutes (hydraulic loading rate of 4.3 gpm/sf).
Dixon and Lee (1991) reported that EBCT significantly influenced ClO2- removal by
GAC. Longer EBCTs resulted in greater ClO2- removal efficiency. The authors suggested
that the increased contact time allows greater opportunity for ClO2- to be reduced to Cl- at the
GAC surface. The researchers also reported that the ClO2- reacts with GAC by a dual
mechanism, which appears to be an initial adsorption of ClO2- onto active sites followed by
reduction of ClO2- to Cl- as those sites become unavailable. This theory was also proposed
by Lohman and Rogers (1987). In their study ClO2- was oxidized to ClO3
- by GAC when
free chlorine was present in the applied water. They indicated that widely varying results
regarding ClO2- removal efficiency have been reported, and they attributed the variations in
part to widely differing analytical techniques and differences in EBCT and loading rates in
the various studies. Gallagher et al. (1994) also reported production of ClO3- when water
containing both ClO2- and chlorine passed through a 55-inch GAC column; no ClO2
-
remained in the treated water.
Vel Leitner et al. (1992) found that ClO2- removal by GAC decreases as pH increases.
They also reported that GAC type and dosage affected ClO2- removal efficiency. The
production of ClO3- as an end-product was affected by influent ClO2
- concentrations,
activated carbon concentrations and type, and pH. When low influent ClO2- concentrations
(< 50 mg/L) at pH 7, which are similar to water treatment plant conditions, were reacted with
a large amount of GAC in a batch reactor, the major end product was Cl- (> 90 percent).
Chlorate ion concentrations were below the detection limit.

28
The Gulf Coast Water Authority reported that a pilot GAC filter for ClO2- removal
was effective for only a short time, approximately 20,000 bed volumes. No chlorine was
applied prior to the GAC filter, and ,therefore, the ClO3- concentration remained unchanged
through the filter (Thompson, 1993).
In summary, GAC appears to be only marginally effective for ClO2- removal, and,
therefore, prohibitively expensive if used only for that purpose. While some have found that
ClO2- removal by GAC was complete when the GAC influent contained chlorine, ClO3
- was
formed, which is not desirable.
Reduction by Powdered Activated Carbon
Orr (1990) demonstrated that powdered activated carbon (PAC) was only marginally
effective for ClO2- removal. Only 35 to 50 percent of the ClO2
- in water containing 20 mg/L
ClO2- was removed during 30-minutes contact with 50 mg/L PAC, which is an extremely
high dose for routine use during water treatment. Chlorate ion was present in the water at
the end of the contact period, and the final pH was 5.5 to 6.0. The author attributed the ClO3-
formation to a sequence of reactions in which ClO2- under acidic conditions (pH 5.5 to 6.0)
forms ClO2 and the ClO2 subsequently oxidizes ClO2- to ClO3
- (Masschelein, 1979). For
reasons that could not be explained, ClO2- reduction by PAC was slightly more effective
when the PAC was enmeshed in alum floc. In a similar experiment, 1 mg/L ClO2– was
reduced by 78 percent in a solution contacted for four hours with 50 mg/L PAC enmeshed in
alum floc. After further studies, the author determined that that ClO2- removal by PAC
occurred by second-order reaction kinetics.

29
In another experiment, Orr (1990) devised a bench-scale simulation of a floc-blanket
clarifier in which high concentrations of PAC were enmeshed in floc and kept suspended in a
constantly flowing stream of water containing 9.5 mg/L. Greater than 90 percent ClO2-
removal was achieved in this system over a period of 10 to 12 hours.
Grabeel (1992) evaluated the effects of pH on ClO2- removal by Ceca 20B PAC.
After a four-hour contact period, 20 mg/L PAC removed 67.1 percent of ClO2- from a pH 5.5
solution of 5.56 mg/L ClO2-, while only 13.0 percent ClO2
- removal occurred in a pH 7.5
solution of 4.81 mg/L ClO2-. While ClO2
- removal was greater in the pH 5.5 solution, more
ClO3- was formed. Chlorate ion concentrations near 1.0 mg/L were observed when the initial
ClO2- dose was 5.0 mg/L. At pH 6.5 to 7.5, ClO3
- concentrations were below 0.05 mg/L.
The carbon usage rate at pH 5.5 (187 mg ClO2- removed/g PAC/4 hours) was much higher
than that at pH 7.5 (31 mg ClO2- removal/g PAC/4 hours). The author noted that the initial
ClO2- removal rate was rapid and then decreased significantly after two to four hours contact
with PAC. The author believed that oxidation-reduction reactions were responsible for ClO2-
removal by PAC because in all but one experiment, Cl- accounted for 86 to 117 percent of
the chlorine species at the end of the experiments.
Grabeel (1992) also compared ClO2- removal by two types of PAC, one a wood-based
carbon (Westvaco Nuchar SA PAC) and the other a bituminous coal based carbon (Ceca 20B
PAC). After a four-hour contact period at pH 5.5, the wood-based carbon removed 28.3
percent of the ClO2- and the bituminous coal carbon removed 67.1 percent. No ClO3
- was
detected in the water treated with the wood-based carbon, but, as summarized above, it was
present in water treated with the bituminous coal carbon. The carbon usage rate for the

30
wood-based carbon was much lower than that of the bituminous coal carbon (77 mg ClO2-
removed/g PAC/4 hours and 187 mg ClO2- removal/g PAC/4 hours, respectively).
Grabeel (1992) also evaluated ClO2- removal by PAC in a pilot-scale Superpulsator®
(Infilco Degrémont, Richmond, Virginia) floc blanket clarifier that was treating water
pretreated with ClO2. Removals were lower than expected, ranging from approximately 27
percent when the PAC dose was 10 mg/L to 59 percent when the dose was 20 mg/L. She
attributed the low removals to inconsistent PAC feed rates caused by periodic feed-pump
failures that caused PAC concentrations in the floc blanket to vary widely.
Mitchell (1993) further investigated the ClO2- -removal efficiency of 12 different
PACs both in the presence and absence of chlorine. After a 15-minute reaction period four
of the PACs reduced the ClO2- concentration by more than 40 percent when chlorine was
absent while five others reduced it by more than 40 percent in solutions containing chlorine.
After a 60-minute reaction period with no chlorine present, all but one PAC reduced the
ClO2- concentration by 50 percent, and three PACs reduced it by 70 percent or more.
Chlorine influence on ClO2- removal was inconclusive in that several PACs removed more
ClO2-when it was present, and several removed more when it was absent. The author found
that little additional ClO2- removal occurred after four hours contact with PAC. The author
reported that “the extent of ClO2- removal was not related to:
(a) The acid-extracted metal content (aluminum, boron, iron, magnesium,
manganese, or zinc) or the total metal content,
(b) The percentage of PAC passing through a 325 mesh screen,
(c) The raw material from which the PAC was manufactured,

31
(d) The iodine index of the carbon; which is an indicator of the total surface area of
the PAC, including the smallest passages,
(e) The BET surface area, a less accurate surface area measurement,
(f) The density of the powdered activated carbon.”
The tests also showed that ClO3- was not present at levels detectable by ion chromatography
when chlorine was absent but always was present when the test medium contained chlorine.
The author commented on the importance of pilot testing PACs for use in water treatment
under the actual plant conditions, as various factors can contribute to PAC performance.
32
CHAPTER IIIMATERIALS AND METHODS
Reagents
The following ACS certified reagents were purchased from Fisher Scientific
(Pittsburgh, PA): sodium carbonate anhydrous (CAS 497-19-8), potassium iodide (CAS
7681-11-0), phosphorus pentoxide (CAS 1314-56-3), and potassium persulfate (CAS 7727-
21-1). Sodium chlorite (80 percent) (CAS 7758-19-2), sodium chlorate (99+ percent) (CAS
7775-09-9), lissamine green B (CAS 3087-16-9), and ethylenediamine (99.5+ percent) (CAS
107-15-3) were purchased from Aldrich (Milwaukee, WI). Ultrapure (99.7 percent) sodium
chlorite purchased from Novatek (Oxford, OH) was used in chlorite standards for ion
chromatography analysis.
All standard solutions were prepared in distilled, deionized water from either a Milli-
Q ion exchange system (Millipore Corp., Milford, MA) or a Nanopure Ultrapure water
system (Barnstead/Thermolyne, Dubuque, IA).
Glassware
All glassware was soaked prior to use in 1:1 nitric acid overnight, then rinsed five
times in deionized, distilled water and allowed to air dry. Pipettes were soaked in laboratory
detergent, rinsed with nitric acid, then rinsed three times with distilled, deionized water and
dried in a laboratory oven at 105°C.
All standard ClO2- and ClO3
- solutions were prepared in volumetric flasks and
covered with aluminum foil to prevent light catalyzed reactions.

33
Collection of Samples for Ion Chromatography Analysis
Water samples collected for analysis at the Spring Hollow Water Treatment Plant in
Roanoke County, Virginia, included raw water, clarifier effluent, filter effluent, effluent from
the GAC contactors, and clearwell effluent. The samples were collected in clean, dark
amber, 125-mL, Nalgene bottles after the plant was on-line for several hours. Sample lines
were flushed for ten minutes, and the bottles were rinsed several times before the samples
were collected. Samples were then purged of ClO2 with nitrogen gas for at least ten minutes,
then preserved with approximately 50 mg/L ethylenediamine to prevent reactions between
chlorine and chlorite. Samples were then refrigerated until they were analyzed by ion
chromatography within 18 days (Dietrich et al., 1992a).
Ion Chromatography Method
Chlorite and chlorate were analyzed by ion chromatography (IC). The IC method
was a modification of USEPA Method 300B (Pfaff et al., 1989), which requires ClO2-
samples to be analyzed immediately with no preservative. Research by Dietrich et al.
(1992a) has shown that ethylenediamine can be added to the samples to increase the stability
of ClO2- to 18 days. A Dionex (Sunnyvale, CA) Ion Chromatograph 2010i module with a
CDM3 conductivity detector and analytical gradient pump was used for all analyses. The ion
chromatograph was equipped with an Ionpac AS9-HC analytical column and an Ionpac AG9-
HC guard column. The operational parameters included:
Eluant - 9.0 mM sodium carbonate
Eluant Flow Rate - 1.0 mL/min
Sample Loop Volume - 100 µL

34
Suppression - Anion Self-Regenerating Suppressor II in the recycle mode
Detector Output Range - 3 microsiemans (µS)
The eluant was prepared fresh each time the analysis was performed and purged with helium
for up to three hours prior to analysis to remove gases that might have obscured peaks of
interest. The background conductivity was approximately 27 µS.
The samples were warmed to room temperature and all samples and standards were
filtered through an in-line 0.45 µm filter before injection into the column. The retention
times for ClO2- and ClO3
- were approximately 5.2 minutes and 12.7 minutes, respectively.
The retention times for fluoride, chloride, nitrite, nitrate, and sulfate ions were approximately
3.8, 6.9, 11.7, 13.9, and 20.4 minutes, respectively. The ion concentrations were quantified
on the basis of either peak area calculated by an integrator (Hewlett Packard 3395 or 3396
Integrator) or manual peak height measurement.
Four standard solutions containing both ClO2- and ClO3
- and two standard solutions
containing only ClO2- were analyzed, and a peak area or peak height versus concentration
calibration curve was determined by linear regression. A small chloride ion peak occurred
because this ion was a contaminant in the sodium chlorite used to prepare the standard. A
standard curve was prepared each time an analysis was performed.
Limits of Detection and Quantitation
The limits of detection (LOD) and quantitation (LOQ) for ClO2- and ClO3
- by ion
chromatography (IC) were determined. The LOD is the lowest concentration that can be
confidently measured as different from zero, and the LOQ is the lowest concentration that
can be measured accurately with confidence. The LODs were determined by EPA Method

35
600 (USEPA, 1982). Detection limits determined by the EPA method based on the
variability of the measured concentrations of replicates of a low level standard.
A standard containing 0.02 mg/L of both ClO2- and ClO3
- was analyzed 10 times, and
the standard deviations of the mean ion concentrations were calculated. These standard
deviations of the mean associated with each set of ion analyses were then multiplied by the
Student’s t-value that corresponded to the 99 percent confidence level. The LOQs were
calculated by multiplying the LODs by five. The LODs and LOQs are shown below (Table
1) and the individual analyses are presented in Appendix Table A7.
Table 1
Chlorite Ion and Chlorate Ion Limits of Detection and Quantitation by Ion Chromatography
Analyte AnalyticalMethod
Limit of Detectionmg/L
Limit of Quantitationmg/L
Chlorite Ion IC 0.004 0.02
Chlorate Ion IC 0.01 0.05
Analytical Comparison with Independent Laboratory
One quality assurance (QA) evaluation of the ClO2- and ClO3
- IC analytical methods
used at Virginia Tech laboratories was accomplished by splitting samples with an
independent laboratory. Several field samples preserved with ethylenediamine were split
into two aliquots. One was analyzed at Virginia Tech and the other at Novatek in Oxford,
Ohio. Each lab used EPA method 300B, with the Dionex Ionpac AS9-HC analytical column
and a Dionex Ionpac AG9-HC guard column. The two sets of analytical data were compared
by a paired comparison t-test, and no significant differences were indicated at the 99 percent

36
confidence level. The individual data are presented in Appendix Table A8 and are shown
graphically in Appendix Figures A1 and A2.
Chlorine Dioxide Generation
Chlorine dioxide was generated by a method developed by Granstrom and Lee
(1958). Novatek provided specific directions (Novatek, 1993). Chlorine dioxide generated
by this method is highly concentrated and contains no chlorine, ClO2-, or ClO3
-. The method
involves reacting potassium persulfate (2 g dissolved in 50 mL distilled, deionized water)
with sodium chlorite (4 g dissolved in 25 mL distilled, deionized water) in a gas train similar
to the one shown in Standard Methods for the Examination of Water and Wastewater,
(1995). The overall equation for the reaction is as follows (Granstrom and Lee, 1958):
−+− ++→+ 24)g(28222 SO2K2ClO2OSKClO2
The reaction vessel and two ClO2 traps were 250-mL glass gas-washing bottles. Each
vessel was wrapped with aluminum foil to avoid photolytic decomposition of the generated
oxidant. The two ClO2 traps contained distilled water and were immersed in an ice bath to
improve the trapping efficiency. The generated gas was purged from the reaction vessel with
nitrogen gas for approximately 45 minutes and forced through the gas train into the cold
traps. The final vessel in the gas train was a 1500-mL Erlenmeyer flask containing aqueous
potassium iodide to reduce any ClO2 that escaped the chilled traps. The generated ClO2
solution was a bright yellow-green color and the concentration varied from 300 mg/L to 1000
mg/L.

37
A working ClO2 solution containing approximately 50 mg/L was prepared from the
concentrated stock solution by diluting it with distilled, deionized water. The ClO2
concentration of the working solution was determined by UV spectrophotometry at 360
nanometers (nm). The spectrophotometer was zeroed with deionized water. The
concentration was then calculated from Beer-Lambert’s Law, as follows:
[1] bc a ∈=
Where:
a = absorbance
∈ = ClO2 extinction coefficient, 1225 M-1cm-1
b = cuvette path length
c = ClO2 concentration, M.
The ClO2 concentration was then expressed in mg/L by multiplying the molar concentration
by 67,450 mg/L/mole.
Lissamine Green B Method
Chlorine dioxide concentrations in water samples collected from within the treatment
plant and distribution system were determined by the lissamine green B method, which was
developed by Chiswell and O’Halloran (1991). Separate standard curves were developed for
each water type (raw, clarified, and distribution system) because the background absorbances
differed markedly. Approximately 1 L of each water was collected and purged for 25
minutes to remove any ClO2 that may have been present. Lissamine green B (LGB) solution
(5 mL) and pH 9 buffer (10 mL) were added to each of seven, 100-mL volumetric flasks.
Each flask was filled nearly to the mark with purged sample water, then appropriate amounts
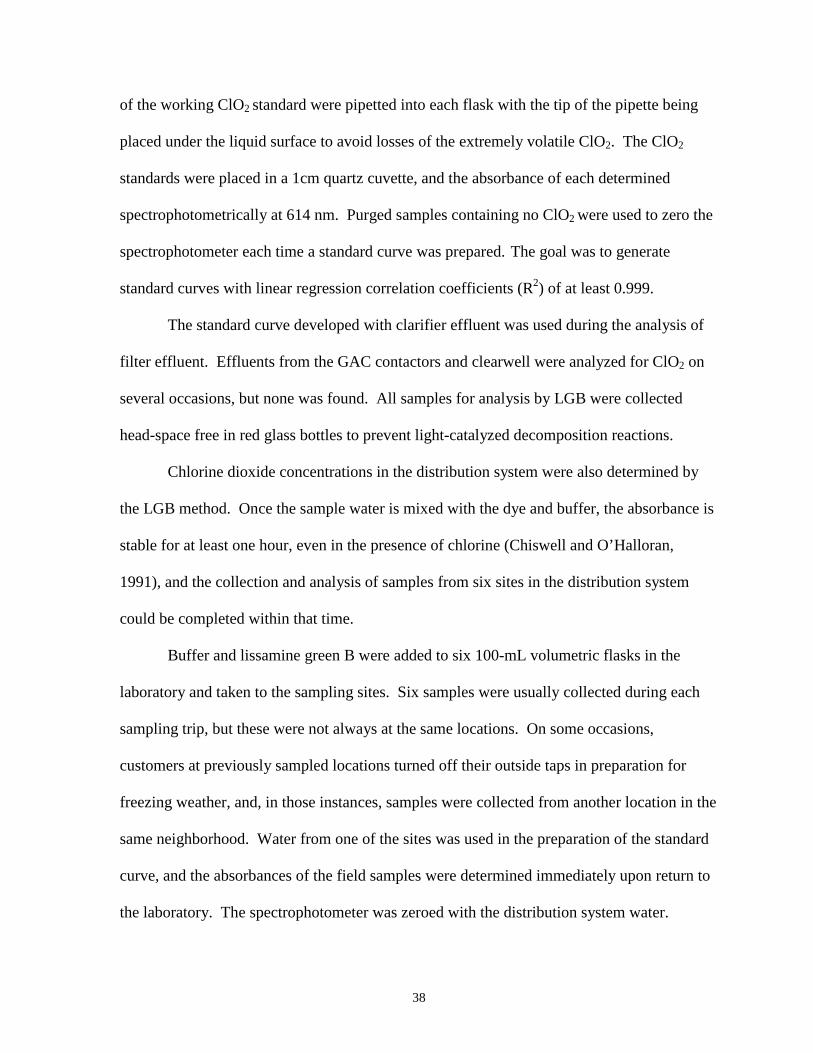
38
of the working ClO2 standard were pipetted into each flask with the tip of the pipette being
placed under the liquid surface to avoid losses of the extremely volatile ClO2. The ClO2
standards were placed in a 1cm quartz cuvette, and the absorbance of each determined
spectrophotometrically at 614 nm. Purged samples containing no ClO2 were used to zero the
spectrophotometer each time a standard curve was prepared. The goal was to generate
standard curves with linear regression correlation coefficients (R2) of at least 0.999.
The standard curve developed with clarifier effluent was used during the analysis of
filter effluent. Effluents from the GAC contactors and clearwell were analyzed for ClO2 on
several occasions, but none was found. All samples for analysis by LGB were collected
head-space free in red glass bottles to prevent light-catalyzed decomposition reactions.
Chlorine dioxide concentrations in the distribution system were also determined by
the LGB method. Once the sample water is mixed with the dye and buffer, the absorbance is
stable for at least one hour, even in the presence of chlorine (Chiswell and O’Halloran,
1991), and the collection and analysis of samples from six sites in the distribution system
could be completed within that time.
Buffer and lissamine green B were added to six 100-mL volumetric flasks in the
laboratory and taken to the sampling sites. Six samples were usually collected during each
sampling trip, but these were not always at the same locations. On some occasions,
customers at previously sampled locations turned off their outside taps in preparation for
freezing weather, and, in those instances, samples were collected from another location in the
same neighborhood. Water from one of the sites was used in the preparation of the standard
curve, and the absorbances of the field samples were determined immediately upon return to
the laboratory. The spectrophotometer was zeroed with the distribution system water.

39
Water Quality Impacts of Pure Chlorine Dioxide Pretreatment atthe Roanoke County (Virginia) Water Treatment Plant
C.S. Ellenberger, Engineer
Black & VeatchGreenville, SC 29607
R.C. Hoehn, Emeritus Professor
D.L. Gallagher, Associate Professor
W.R. Knocke, Professor and Head
Charles E. Via, Jr. Department of Civil EngineeringVirginia Polytechnic Institute and State University
Blacksburg, Virginia 24061
E.V. Wiseman, Laboratory Director
R.W. Benninger, Assistant Director
Roanoke County Utility DepartmentSalem, Virginia 24153
and
A. Rosenblatt
CDG Technology, Inc.Allentown, PA 18103
Introduction
Interest in chlorine dioxide (ClO2) as an alternative to chlorine for oxidation and
disinfection during water treatment has increased in recent years as utilities are required to
meet increasingly stringent halogenated disinfection by-product (DBPs) regulations. It was
first used in the 1940s by the City of Niagara Falls, New York, to control phenolic and
chlorophenolic tastes and odors (Synan et al., 1944; McCarthy, 1944; Aston, 1947), though
its value as a disinfectant was also recognized. Since 1970, most utilities apply ClO2 as a

40
chlorine substitute at some point in their treatment process as part of their overall DBP
control strategy (Dietrich et al., 1992b; Bissonette and Allegier, 1997).
Chlorine dioxide does not form halogenated organic by-products under typical water
treatment conditions, but two important inorganic by-products, chlorite ion (ClO2-) and
chlorate ion (ClO3-), are formed when ClO2 is chemically reduced. Both of these by-products
pose potential health risks.
Chlorate ion, once formed, cannot be removed by conventional water treatment
techniques, but ClO2- concentrations can be either reduced or eliminated by treatment with
reduced-sulfur compounds, ferrous iron compounds, granular activated carbon (GAC), and
powdered activated carbon (PAC).
In July, 1994, the United States Environmental Protection Agency (USEPA) proposed
a maximum residual disinfectant level (MRDL) of 0.8 mg/L for ClO2 and a maximum
contaminant level (MCL) of 1.0 mg/L for ClO2- in the Disinfectant/Disinfection By-Products
(D/DBP) Rule (Federal Register, 1994). The Final D/DBP Rule, promulgated in December
1998, retained the proposed ClO2 MRDL and ClO2- MCL (Federal Register, 1998). No MCL
for ClO3- was proposed in the D/DBP Rule because health-effects data were not available at
the time it was published.
The project described in this paper was designed to provide much-needed information
regarding the fate of ClO2 following its addition at a water treatment plant (WTP) and the
development of by-products in the WTP and distribution system. Specific objectives were
to: (1) document changes in ClO2, ClO2- and ClO3
- concentrations throughout the Roanoke
County WTP and distribution system following ClO2 pretreatment of raw water, (2) evaluate
the effectiveness of GAC in post-filter contactors for ClO2- removal, and (3) determine the

41
extent to which ClO2 reforms in the distribution system following post chlorination of the
treated water and the levels associated with customer complaints of odors.
Roanoke County Treatment Plant and Spring Hollow Reservoir
The Roanoke County, Virginia, Spring Hollow Water Treatment Plant, which was the
site for this research, went on-line in January, 1996. The plant is a Trident® process plant,
which consists of upflow adsorption clarifiers followed by trimedia filters (Figure 1). The
coagulant is hydroxylated ferric sulfate, and the dosage requirements typically are quite low
(5-10 mg/L) because the water quality is excellent throughout the year. The coagulant is
added at a static mixer ahead of the clarifiers, and the dose is controlled by a streaming
current monitor.
Following filtration, the water passes through two GAC contactors arranged in series,
each containing approximately 70,000 pounds (31,818 kg) of 8 X 30 mesh GAC (Cetco-
Aquatec) to an individual depth of 42 inches. The approximate empty bed contact times
(EBCTs) were 26 and 13 minutes at treatment rates of 5 and 10 million gallons per day
(mgd), respectively. Chlorine and fluoride are added to the GAC-treated water prior to its
storage in a 2 million gallon clearwell.
The plant serves approximately 36,000 customers with 8,850 connections. The daily
demand during the period of this study was 2 to 3 mgd. The plant capacity is 15 mgd at the
present filtration rate. The plant only operates 8 hours each day in order to fill storage tanks
in the distribution system and the clearwell. The operators typically run one unit for the
entire eight-hour period and bring a second unit on-line for part of the day. The plant is shut
down at the end of the single, eight-hour shift.

42
GAC CONTACTORS
SOLIDSHOLDING
TANK
SOLIDS TOFUTURE
DEWATERING
BACKWASH & CLARIFIER FLUSH
WATER
FILTERDECANT
FHIGH SERVICE
PUMPS 1-4
IN-LINESTATICMIXERSTRAINER
PUMPSTATION
ROANOKERIVER RESERVOIR
DISTRIBUTION SYSTEM
CHEMICALADDITION
CHLORINEDIOXIDE
FILTER FILTER
TREATMENT UNITS 1-3
UPFLOWCLARIFIER
Cl2
2 MG CLEARWELL(BAFFLED PRESTRESSED
CONCRETE GROUND STORAGE TANK)
Figure 1. Roanoke County Spring Hollow Water Treatment Plant
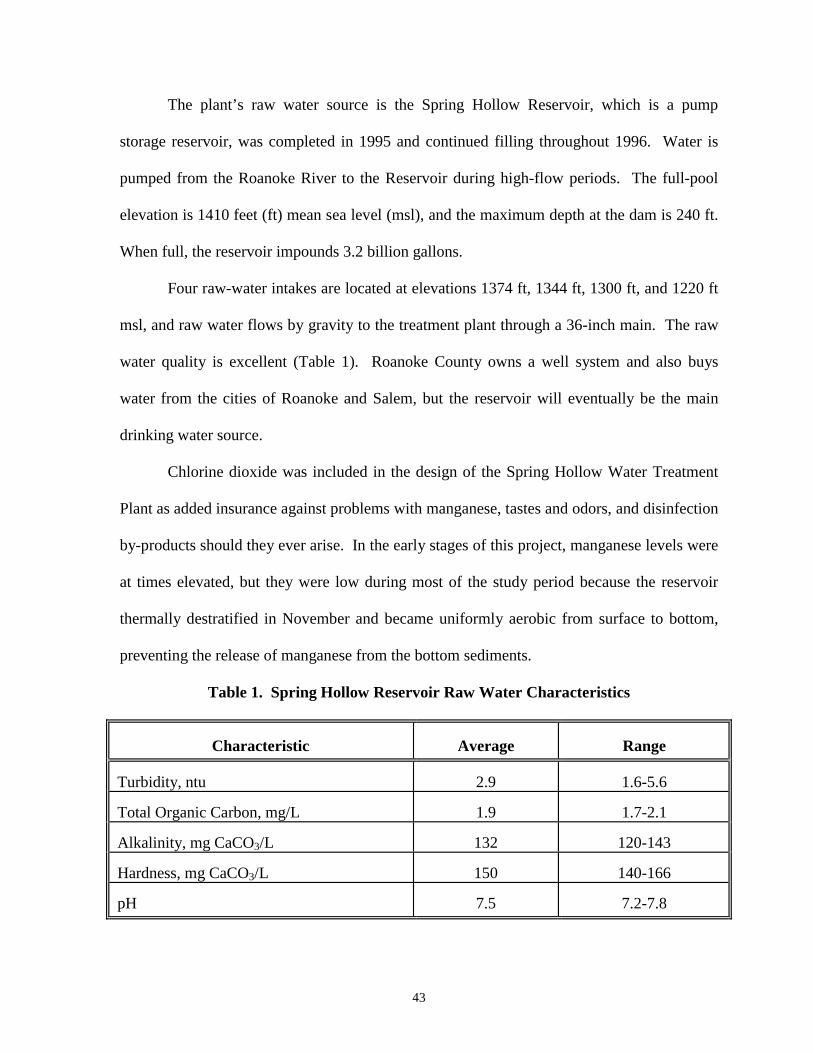
43
The plant’s raw water source is the Spring Hollow Reservoir, which is a pump
storage reservoir, was completed in 1995 and continued filling throughout 1996. Water is
pumped from the Roanoke River to the Reservoir during high-flow periods. The full-pool
elevation is 1410 feet (ft) mean sea level (msl), and the maximum depth at the dam is 240 ft.
When full, the reservoir impounds 3.2 billion gallons.
Four raw-water intakes are located at elevations 1374 ft, 1344 ft, 1300 ft, and 1220 ft
msl, and raw water flows by gravity to the treatment plant through a 36-inch main. The raw
water quality is excellent (Table 1). Roanoke County owns a well system and also buys
water from the cities of Roanoke and Salem, but the reservoir will eventually be the main
drinking water source.
Chlorine dioxide was included in the design of the Spring Hollow Water Treatment
Plant as added insurance against problems with manganese, tastes and odors, and disinfection
by-products should they ever arise. In the early stages of this project, manganese levels were
at times elevated, but they were low during most of the study period because the reservoir
thermally destratified in November and became uniformly aerobic from surface to bottom,
preventing the release of manganese from the bottom sediments.
Table 1. Spring Hollow Reservoir Raw Water Characteristics
Characteristic Average Range
Turbidity, ntu 2.9 1.6-5.6
Total Organic Carbon, mg/L 1.9 1.7-2.1
Alkalinity, mg CaCO3/L 132 120-143
Hardness, mg CaCO3/L 150 140-166
pH 7.5 7.2-7.8

44
Chlorine Dioxide Generation
The ClO2 generator (Figure 2) generates ClO2 by reaction of solid sodium chlorite
(NaClO2) with chlorine gas according to equation [1]:
Chlorine gas is first mixed with humidified air and then passed through two drums containing
solid NaClO2 in series. The ClO2 production rate is a function solely of the chlorine gas feed
rate. Infinite turndown without recalibration is possible, thus making possible the delivery of
ClO2 dosages over a wide range. No unreacted NaClO2 enters the system because the
generated ClO2 is in the gas phase, and ClO3- is not produced. This project was the first full-
scale application of the CDG Technology, Inc. process, and the County chose the equipment
because it was simple to operate and could reliably provide ClO2 dosages over a wide range.
The generated ClO2 is injected into a raw-water side stream off the 36-inch raw-water
main through an ejector, which is a Venturi tube that creates a vacuum in the generator. The
side stream then passes through a contactor, which consists of a network of pipes, to ensure
thorough mixing, then through an air break to release any air that accumulates in the pipe,
and, finally, back to the entrance to the 36-inch main near the Roanoke River approximately
400 ft below the treatment plant.
.[1]........................................2NaCl..... + ClO2 Cl + NaClO2 2(g)2(g)2 →
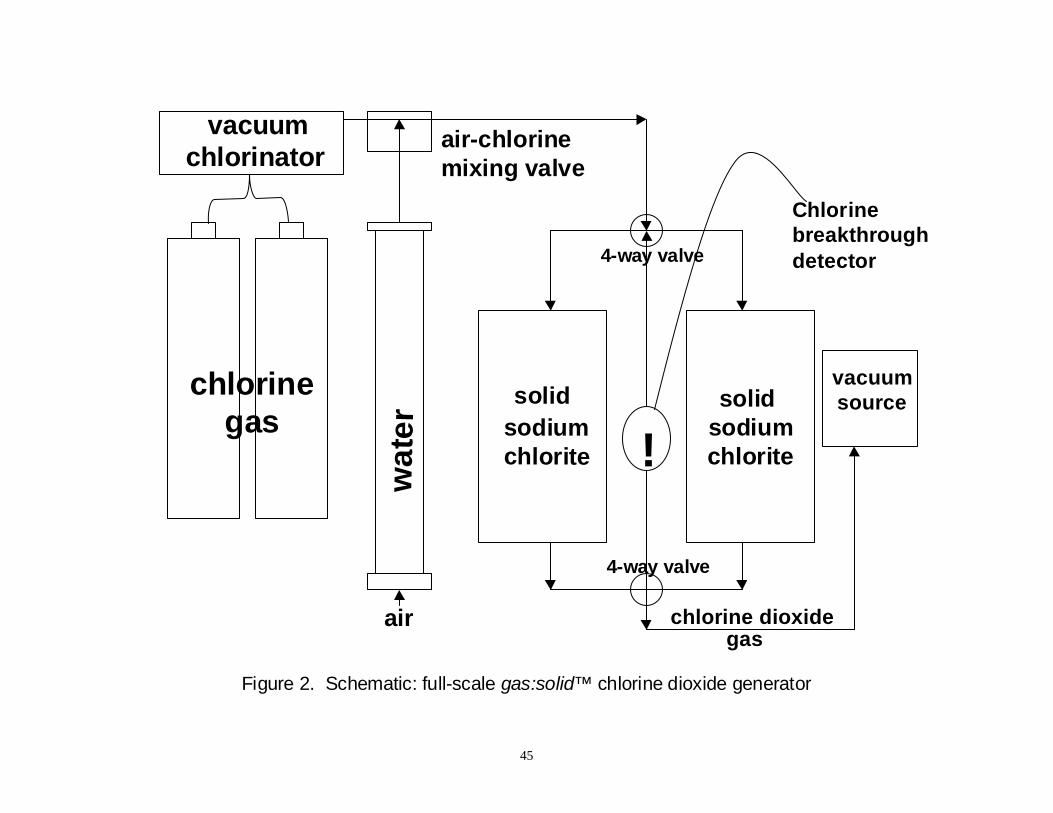
45
solid sodium chlorite
air
chlorinegas
vacuumchlorinator
air-chlorinemixing valve
wat
er solidsodiumchlorite
vacuumsource
!
4-way valve
4-way valve
Chlorinebreakthroughdetector
chlorine dioxide
Figure 2. Schematic: full-scale gas:solid™ chlorine dioxide generator
gas

46
Experimental Methods
Sample Collection and Preservation Methods
During the study, water samples were collected in acid-washed Nalgene bottles from
a variety of locations within the treatment plant and distribution system for analyses of ClO2
and its by-products. Samples were collected within the treatment plant two to four hours
after plant startup to ensure that equilibrium had been reached.
Sampling locations included: (1) raw water following ClO2 addition but before
coagulant addition, (2) clarifier effluent (filter-applied), (3) filter effluent, (4) post-filter GAC
contactor effluent, and (5) clearwell effluent. Sample lines were flushed for approximately
ten minutes, and sample bottles were rinsed several times before the samples were collected.
The samples were immediately purged with nitrogen gas for at least ten minutes to remove
ClO2, then preserved with ethylenediamine (approximately 50 mg/L) to prevent reactions
between chlorine and ClO2- (Dietrich et al., 1992a). Samples were then refrigerated until
they could be analyzed.
Chlorite and Chlorate Ion Analyses
Chlorite and chlorate were analyzed by ion chromatography (IC). The IC method
was a modification of USEPA Method 300B (Pfaff et al., 1989), which requires ClO2-
samples to be analyzed immediately with no preservative. Research by Dietrich et al.
(1992a) has shown that a ethylenediamine can be added to the samples to increase the
stability of ClO2- to 18 days. A Dionex (Sunnyvale, CA) Ion Chromatograph 2010i module
equipped with a CDM3 conductivity detector, analytical gradient pump, Ionpac AS9-HC
analytical column, and an Ionpac AG9-HC guard column. The eluant was 9.0 mM sodium
carbonate dispensed at a flow rate of 1.0 mL/min and the sample loop volume was 100 mL.

47
Suppression was achieved with an Anion Self-regenerating Suppressor II in the recycle
mode, and the detector output range was 3 microsiemans (µS). Fresh eluant was prepared
each day the analyses were performed and purged with helium for up to three hours before
use to remove gases that might obscure peaks of interest. The background conductivity was
approximately 27 µS.
Samples were warmed to room temperature before analysis and all samples and
standards were filtered through an in-line 0.45 µm filter before they were injected into the
column. The retention times for ClO2- and ClO3
- were approximately 5.2 minutes and 12.7
minutes, respectively. Concentrations were quantified either by integrated peak areas
(Hewlett Packard 3395 or 3396 Integrator) or by manual peak-height measurement. Four
standard solutions containing both ClO2- and ClO3
- and two standard solutions containing
only ClO2- were analyzed. Calibration curves relating either peak area or peak height to
analyte concentration by linear regression were developed after each analytical session. The
ClO2- and ClO3
- limits of detection (LOD), which were 0.004 mg/L and 0.01 mg/L,
respectively; were determined according to EPA Method 600 (USEPA, 1982).
Laboratory-Scale Chlorine Dioxide Generation and Solution Standardization
High-purity ClO2 solutions (i.e., no chlorine, ClO2-, or ClO3
-) for use in developing
standard curves were prepared by reacting 50 mL of two percent potassium persulfate with
25 mL of 16 percent NaClO2 (Granstrom and Lee, 1958; Novatek, 1997). The generator
consisted of three gas-washing bottles connected in series. The reactant solutions were
mixed in the first bottle, and the generated ClO2 was purged from the reaction mixture for
approximately 45 minutes by a gentle flow of nitrogen gas through the second vessel, which
was empty, and into the third vessel, which contained distilled water immersed in an ice bath.

48
Undissolved ClO2 from the collection vessel was trapped in a flask containing a strong
potassium iodide solution. Generated ClO2 solutions contained from 300 mg/L to 1000 mg/L
ClO2, the lower concentrations resulting when the system was purged for too long a period.
These solutions were stored in the refrigerator at 4°C when not in use.
Working solutions containing approximately 50 mg/L ClO2 were prepared each day
from the concentrated stock solutions and standardized by ultraviolet absorbance at 360
nanometers (nm) in a quartz cuvette. The instrument was zeroed with distilled, deionized
water, and the working-standard concentration was determined by the Beer-Lambert Law as
follows:
a = ∈ b c
Where:
a = absorbance
∈ = ClO2 extinction coefficient, 1225 M-1cm-1;
b = cuvette path length
c = ClO2 concentration, M
Chlorine Dioxide Analysis by the Lissamine Green B Spectrophotometric Method
Chlorine dioxide concentrations were determined by the lissamine green B method
(Chiswell and O’Halloran, 1991). The value of this test lies in its sensitivity at low ClO2
concentrations and the lack of interference by both chlorine and chloramines. Separate
standard curves were prepared for analyses of raw water, clarifier effluent, and distribution-
system samples collected in red glass containers (to prevent light catalysis of ClO2) at several
points. The distribution-system sampling sites were selected to provide a variety of hydraulic
residence times.

49
The standard curves were prepared daily by adding varying amounts of standardized
ClO2 solution to approximately 25-30 mL of nitrogen-purged sample (to remove any ClO2
that might be present) in 100-mL volumetric flasks. Lissamine green B solution (5 mL) and
pH 9 buffer (10 mL) were then added to each flask and diluted with the purged sample to a
final volume of 100 mL. Reagents were added at the same time to an unpurged sample for
determination of the sample ClO2 concentration. The absorbances of samples and standards
were determined spectrophotometrically at 614 nm, and the purged sample was used as the
instrument zero.
Chlorine dioxide concentrations at multiple points in the distribution system were
determined on several occasions. Because the buffered lissamine green solution is stable in
samples for at least an hour (Chiswell and O’Halloran, 1991), six samples could be collected,
returned to the laboratory, and analyzed within the time limit. To facilitate the analysis,
samples collected at the various sites were placed directly in volumetric flasks that already
contained LGB and buffer. Samples were left at ambient temperature to avoid having to
warm them prior to analysis. Each time system ClO2 concentrations were determined, the
standard curve was prepared anew in nitrogen-purged water from one of the sites, and the
sample was used as the instrument zero.
Results
Treatment Plant ClO2, ClO2- and ClO3
- Profiles
Figure 3 shows the ClO2 concentrations at various points within the treatment plant
from November 24, 1997, through February 5, 1998 (total residence time through the filters:
approximately 35 minutes at design flow). During this period, dosages were low, ranging
from none when the generator was inoperative to 0.42 mg/L, and quite variable. Raw-water

50
Figure 3. Chlorine dioxide concentrations throughout the treatment plant, November 24, 1997, through February 5, 1998
0.000
0.050
0.100
0.150
0.200
0.250
0.300
0.350
0.400
0.450
0.50011
/24/
1997
12/2
/199
7
12/4
/199
7
12/8
/199
7
12/1
0/19
97
12/1
2/19
97
12/1
7/19
97
12/1
9/19
97
1/5/
1998
1/7/
1998
1/9/
1998
1/13
/199
8
1/16
/199
8
1/22
/199
8
1/27
/199
8
1/29
/199
8
2/2/
1998
2/5/
1998
ClO
2, m
g/L
Dosed Raw
Filter Applied
Filtered

51
concentrations were determined less than five minutes after ClO2 was added. In general, the
reservoir water ClO2 demand was slowly exerted, and ClO2 persisted through the clarifiers
and, on a few occasions, through the filters.
Figures 4 and 5 are box plots that show, respectively, the distributions of ClO2- and
ClO3- concentrations throughout the treatment plant and in the clearwell from September 9,
1997, through February 10, 1998. Figure 6 shows the ClO2 dosages, which ranged from
none when the generator was not operating, to 0.96 mg/L (average 0.39 mg/L), throughout
the same period.
Box plots were chosen for displaying the data because they provide information
regarding the range and variability of the data. The interpretation of these plots, according to
Gallagher et al. (1994), is as follows:
“Eighty percent of the concentrations fall in the range between the upper and
lower tails that appear outside the boxes. Thus, 10 percent of the data fall
below the lower tail (Q10) and 90 percent fall below the upper tail (Q90). The
circles below or above each of the tails correspond to individual data points
called outliers. The lower and upper lines composing the box are,
respectively, the upper limits of the first and third quartiles of the data (Q25
and Q75,
respectively), and the line inside the box shows the upper limit of the second
quartile (Q50) and denotes the median value.”
Bonferoni corrected paired comparison t-tests (α = 0 .0125) were used to evaluate
whether or not the day-to-day ClO2- and ClO3
- concentrations at successive points in the
treatment train differed significantly. For the paired comparison t-tests, data was used only
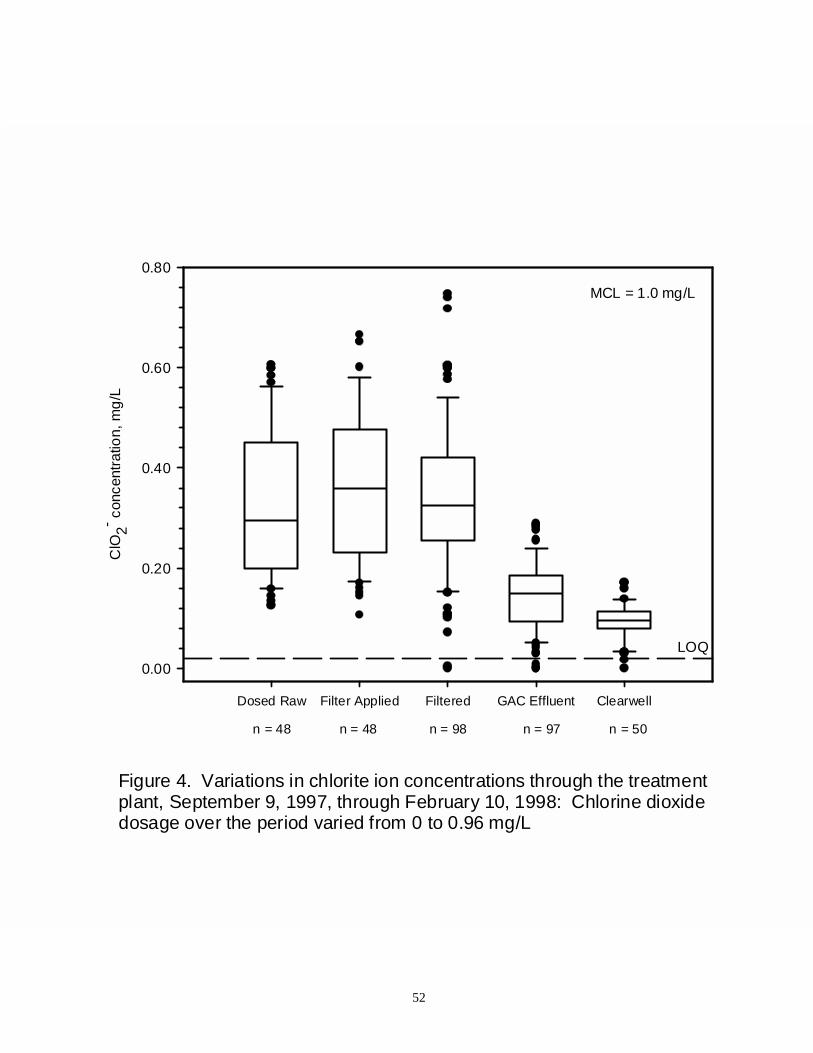
52
Dosed Raw Filter Applied Filtered GAC Effluent Clearwell
ClO
2- con
cent
ratio
n, m
g/L
0.00
0.20
0.40
0.60
0.80
Figure 4. Variations in chlorite ion concentrations through the treatmentplant, September 9, 1997, through February 10, 1998: Chlorine dioxide dosage over the period varied from 0 to 0.96 mg/L
MCL = 1.0 mg/L
LOQ
n = 48 n = 48 n = 98 n = 97 n = 50
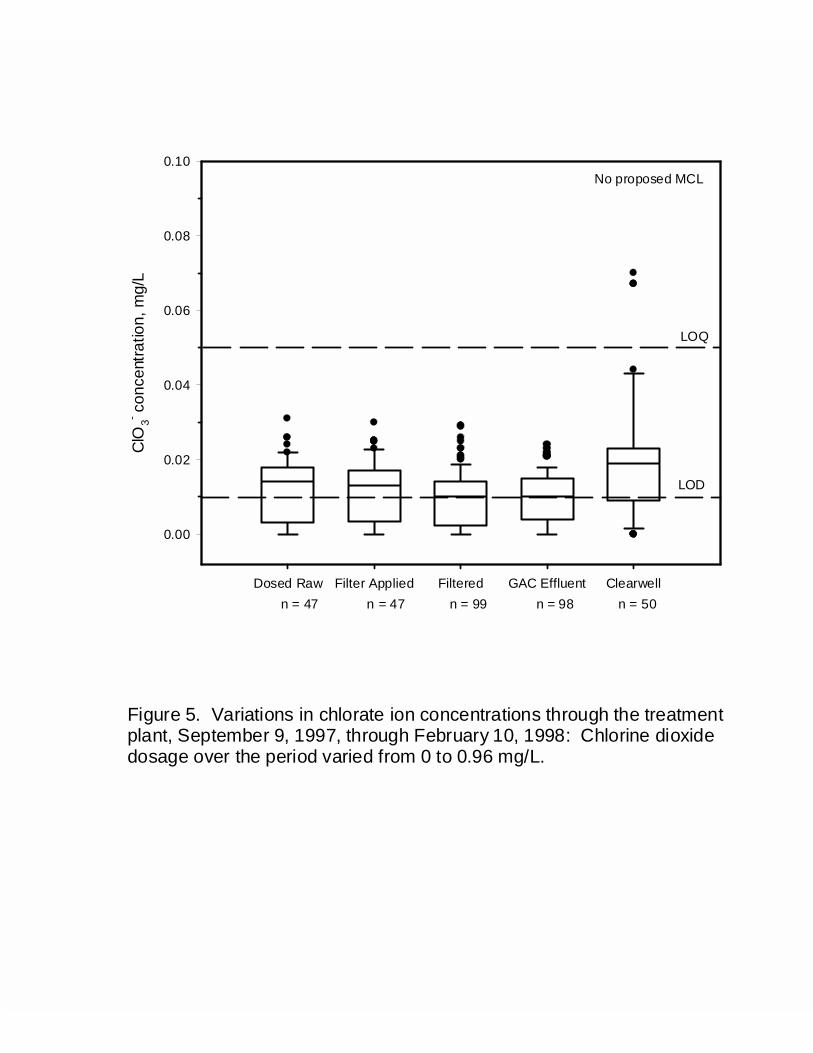
53
Dosed Raw Filter Applied Filtered GAC Effluent Clearwell
ClO
3- con
cent
ratio
n, m
g/L
0.00
0.02
0.04
0.06
0.08
0.10
n = 47 n = 47 n = 99 n = 98 n = 50
Figure 5. Variations in chlorate ion concentrations through the treatment plant, September 9, 1997, through February 10, 1998: Chlorine dioxide dosage over the period varied from 0 to 0.96 mg/L.
LOQ
LOD
No proposed MCL

54
Figure 6. Chlorine dioxide dosages throughout the study period
0
0.2
0.4
0.6
0.8
1
1.2
9/9/
1997
9/14
/199
7
9/19
/199
7
9/24
/199
7
9/29
/199
7
10/4
/199
7
10/9
/199
7
10/1
4/19
97
10/1
9/19
97
10/2
4/19
97
10/2
9/19
97
11/3
/199
7
11/8
/199
7
11/1
3/19
97
11/1
8/19
97
11/2
3/19
97
11/2
8/19
97
12/3
/199
7
12/8
/199
7
12/1
3/19
97
12/1
8/19
97
12/2
3/19
97
12/2
8/19
97
1/2/
1998
1/7/
1998
1/12
/199
8
1/17
/199
8
1/22
/199
8
1/27
/199
8
2/1/
1998
2/6/
1998
ClO
2 Dos
e, m
g/L
(Note: 0 mg/L dose indicates that ClO2 generator was off)

55
from days when there were samples collected at each of the two locations being compared.
The box plots present a summary of all the data collected at each successive location in the
treatment train. The results showed that ClO2- concentrations in ClO2 - treated raw water
were significantly less than those in clarifier effluent (filter-applied water)but not
significantly less than those in filtered water. Mean concentrations in raw water and clarifier
effluent were 0.328 mg/L and 0.367 mg/L, respectively.
Figure 4 also shows a marked ClO2- reduction when filtered water passed through the
GAC contactors. Concentrations in water exiting the contactors (GAC effluent) were
significantly lower than those entering the contactors (shown as “filtered” in Figure 4).
Mean concentrations entering and leaving the contactors were 0.337 and 0.146 mg/L,
respectively, over the course of the study.
The paired comparison t-test also showed that the GAC effluent ClO2- concentrations
were significantly greater than the ClO2- concentrations in chlorinated water leaving the
treatment plant (“clearwell” in Figure 4). The mean ClO2- concentration in water leaving the
clearwell was 0.092 mg/L, and concentrations ranged from less than the detection limit to
0.172 mg/L.
Chlorate ion concentrations remained quite low throughout the treatment process and
were almost always less than quantitation limit (Figure 5). The ClO3- concentrations
following post chlorination were statistically greater than those in the GAC effluent, even
though the mean concentrations (0.02 mg/L and 0.01 mg/L, respectively) were quite low.
The ClO3- concentrations in the clearwell ranged from less than the detection limit (0.01
mg/L) to 0.07 mg/L.

56
Chlorite Ion Removal by GAC Filtration
Figure 7 shows the relationship between the GAC influent ClO2- concentrations and ClO2
-
removal by the GAC contactor over the entire study period. The slope of the regression line
(0.63) represents the overall average ClO2- removal achieved by the contactor expressed as a
fraction of the influent concentration. Removals during the period ranged from 10 percent to
100 percent.
Figure 8 shows in bar-graph form the ClO2- concentrations in GAC influent and
effluent during the entire study period. The effluent concentrations ranged from less than
detection (0.004 mg/L) to 0.300 mg/L (average 0.146 mg/L and median 0.150 mg/L). The
applied ClO2 dosages during the study are indicated along the top of the figure, and the
individual bar heights correspond to the individual concentrations in the GAC influent and
effluent. The bars are not stacked.
The carbon usage rate (g ClO2- removed per kg GAC in the two contactors) is shown
in Figure 9 as a function of the total water volume treated at various times during the study
period. Figure 10 shows the cumulative usage rates over the study period. Both figures
indicate that the usage rate was declining steadily.
Distribution System Levels of ClO2 and Its By-products
Figure 11 shows locations in the distribution system where samples were collected for
analyses of ClO2, ClO2-, and ClO3
-. The average ClO2 concentrations are listed next to each
point. Use of the lissamine green B test made detection of small concentrations possible,
even when the samples contained chlorine.
Figure 12 shows the distribution system ClO2- concentrations, which ranged from less
than the detection limit (0.004 mg/L) to 0.125 mg/L (average and median concentrations:

57
y = 0.6371x - 0.0252R2 = 0.8297
-0.1
0
0.1
0.2
0.3
0.4
0.5
0.6
0 0.1 0.2 0.3 0.4 0.5 0.6 0.7 0.8 0.9
ClO2- applied, mg/L
ClO
2- rem
oval
, mg/
L
Figure 7. Chlorite ion removal by GAC contactors as a function of the applied concentration.

58
0.00
0.10
0.20
0.30
0.40
0.50
0.60
0.70
0.80
0.90
1.00
9/9/
1997
9/15
/199
7
9/19
/199
7
9/25
/199
7
10/2
/199
7
10/8
/199
7
10/1
5/19
97
10/2
2/19
97
10/2
8/19
97
11/3
/199
7
11/7
/199
7
11/1
3/19
97
11/1
9/19
97
11/2
5/19
97
12/1
/199
7
12/5
/199
7
12/1
2/19
97
12/1
8/19
97
12/2
4/19
97
12/3
1/19
97
1/6/
1998
1/12
/199
8
1/16
/199
8
1/23
/199
8
1/29
/199
8
2/5/
1998
ClO
2- , mg/
L
FilteredGAC effluent
0.75
0.50.5
chan
ge c
artri
dge
chan
ge c
artri
dge
Figure 8. Comparison of GAC influent and effluent chlorite ion concentrationsduring the period of study.
0.4 0.30.4
No
ClO
2 gen
erat
ed No
ClO
2 gen
erat
ed (p
art d
ay)
No
ClO
2 gen
erat
ed
No
ClO
2 gen
erat
ed
Applied ClO2 dose in mg/L

59
y = -9E-05x + 0.048R2 = 0.4162
0
0.01
0.02
0.03
0.04
0.05
0.06
0.07
0.08
0.09
0.1
0 50 100 150 200 250 300 350 400 450
Cumulative volume treated, MG
Spec
ific
Chl
orite
Rem
oval
, g/k
g G
AC
Figure 9. GAC usage rate over period of study (September 9, 1997 - February 10, 1998)

60
0.01
0.1
1
10
0 50 100 150 200 250 300 350 400
Cumulative water volume treated, MG
Figure 10. Cumulative chlorite removal over period of the study (September 9, 1997 - February 10, 1998)
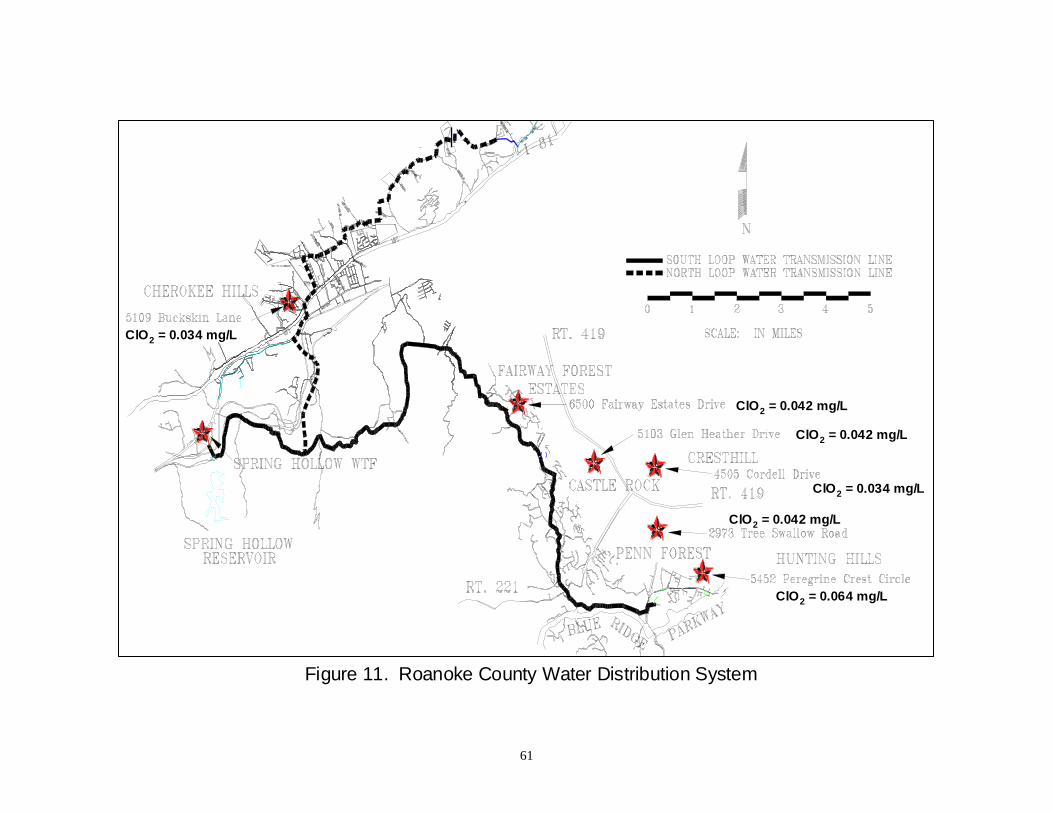
61
ClO2 = 0.034 mg/L
ClO2 = 0.034 mg/L
ClO2 = 0.064 mg/L
ClO2 = 0.042 mg/L
ClO2 = 0.042 mg/L
ClO2 = 0.042 mg/L
Figure 11. Roanoke County Water Distribution System

62
Clearwell Cherokee Hills Hidden Valley Castle Rock Cresthill Penn Forest Hunting Hills
ClO
2- con
cent
ratio
n, m
g/L
0.00
0.02
0.04
0.06
0.08
0.10
0.12
0.14
Figure 12. Comparison of chlorite concentrations in the Roanoke County clearwell and distribution system (n = 9). Sites are arranged (left to right) in order of increasing distance from the water treatment plant.
LOQ
MCL = 1.0 mg/L

63
0.060 and 0.066 mg/L, respectively). Clearwell concentrations were compared one-by-one
with concentrations at each of the distribution system sites with the paired comparison t-test.
While the concentrations at the distribution system sites were significantly lower than the
clearwell concentrations at all sites except the one nearest the treatment plant (Cherokee
Hills), one cannot conclude that ClO2- decreased with increasing distance from the plant
because the concentrations at the nearest site (Cherokee Hills) were not significantly greater
than those at the farthest site (Hunting Hills). The reason they are not statistically different is
probably because the distributions of data collected at the two sites differ markedly, and the
median ClO2- concentration at the farthest site was well below the medians at the other sites.
As can be seen in Figure 12, the data distributions at the other sites were more symmetrically
distributed around the median.
Figure 13 shows the distribution system ClO3- concentrations, which ranged from
0.01 mg/L to 0.09 mg/L, and averaged 0.03 mg/L (median 0.03 mg/L). The concentrations
were uniformly low throughout the distribution system and usually below the quantitation
limit (0.05 mg/L). While it is difficult to say with certainty that they increased with
increasing distance from the plant, the concentrations at Castle Rock, Cresthill, and Penn
Forest were significantly greater than those in the clearwell effluent when tested by the
paired comparison t-test, but concentrations at the other three locations were not statistically
different than those in the clearwell effluent.
Figure 14 shows the ClO2 concentrations at several distribution system locations on
nine occasions. Concentrations at the farthest site (Hunting Hills) were significantly greater
than those at the nearest site (Cherokee Hills) when tested by the paired comparison t-test but
not at any other site. Concentrations during the nine sampling events ranged from less than

64
Clearwell Cherokee Hills Hidden Valley Castle Rock Cresthill Penn Forest Hunting Hills
ClO
3- con
cent
ratio
n, m
g/L
0.00
0.02
0.04
0.06
0.08
0.10
0.12
0.14
Figure 13. Comparison of chlorate concentrations in the Roanoke County clearwell and distribution system (n = 9). Sites are arranged (left to right) in order of increasing distance from the water treatment plant.
LOQ
LOD
No proposed MCL

65
Figure 14. Comparison of chlorine dioxide concentrations in the Roanoke County distribution system. Sites are arranged (left to right) in order of increasing distance from the water treatment plant.
Cherokee Hills Hidden Valley Castle Rock Cresthill Penn Forest Hunting Hills
ClO
2 con
cent
ratio
n, m
g/L
0.00
0.02
0.04
0.06
0.08
0.10
0.12
0.14
0.16
0.18
n = 9 n = 9 n = 8 n = 9 n = 9 n = 9
LOD
MRDL = 0.8 mg/L

66
the detection limit (0.017 mg/L) to 0.15 mg/L, and averaged 0.043 mg/L (median 0.03
mg/L). Comparisons between the distribution-system ClO2 concentrations with clearwell
concentrations were not possible because concentrations in the clearwell were not routinely
determined. On several occasions, no ClO2 was detected in the clearwell.
During the study period, the County received twelve odor complaints that apparently
were related to ClO2 use at the treatment plant. Two complaints were received from
customers at each of two locations and three complaints were received from another
customer. New carpets had been installed at all eight locations within the previous six
months. At six locations, new carpet had been installed within the previous week. One
customer reported noticing an odor when the carpet was first installed but did not file a
complaint for approximately one month after the installation date. Chlorine dioxide
concentrations were determined at only two locations at the same time the complaints were
being investigated, and they were quite low (0.07 mg/L and 0.03 mg/L).
The first customer to complain stated that the odor had persisted for two weeks after
new carpeting was installed. Shortly thereafter, the ClO2 generator was out of service for
several days, and she no longer noticed any odors. Complainants described the odors with
terms such as “petroleum smell,” “strange pungent odor,” “strong chemical smell,” and
“sulfur smell.” At several locations, County employees who investigated the complaints
described odors they detected as “kerosene-like,” “cat urine,” “chemical,” and “ClO2.”
Near the end of December, 1997, the treatment plant operators responded to the
increasing frequency of complaints (despite the fact that only eight complaints had been
received) by reducing the ClO2 dose to approximately 0.3 mg/L, and this action seemed to
solve the problem. On March 28, 1998, however, a valve at the treatment plant

67
malfunctioned and the GAC contactor had to be removed from service so it could be
repaired. Shortly after the contactor was taken off line, the County received two additional
odor complaints, and in response, the operators reduced the ClO2 dose still further to 0.25
mg/L. Thereafter, odor complaints ceased.
Chlorite ion concentrations in the distribution system following the final ClO2-dose
reduction ranged from 0.165 mg/L near the plant to less than the detection limit (0.004 mg/L)
at the most distant site. Chlorate ion concentrations ranged from 0.05 mg/L near the plant to
less than the detection limit (0.01 mg/L) at the farthest point. Shortly after the final ClO2-
dose reduction, ClO2 was not detected in the distribution system.
Discussion
ClO2, ClO2- and ClO3
- Distributions Through the Treatment Plant
Chlorine dioxide persistence and the ClO2- and ClO3
- concentrations that one can
detect in any particular treatment facility will be dictated by several conditions, including
raw-water quality, the ClO2 dose, and the residence time within the treatment plant. The
residence time through the Spring Hollow Water Treatment Plant is quite short
(approximately 20 minutes to the filters), and the ClO2 demand of the raw water is quite low
because the total organic carbon concentrations rarely exceed 2.5 mg/L. These facts explain
why ClO2 was detected on most occasions throughout the treatment plant, even when the
dosages were low. On many occasions, small but detectable ClO2 concentrations persisted
through the filters (Figure 3), which indicates that the filter media were relatively free of
organic matter and did not exert a significant oxidant demand.

68
The ClO2 dose during this study was reduced on several occasions as odor complaints
from customers began to be received, and by the end of January, dosages were below 0.4
mg/L. Throughout the study period, therefore, ClO2 residuals in the plant never exceeded the
proposed MRDL (0.80 mg/L) because the dosages were well below that level on all but one
occasion.
The presence of residual ClO2 in the dosed raw water on most occasions (Figure 3)
accounts for the higher ClO2- concentrations in the clarifier effluent (Figures 4) because
ClO2- was formed when the unreacted ClO2 in the raw water continued to react with organic
matter. Gordon and Rosenblatt (1996) describe this reaction as:
Chlorite ion concentrations leaving the plant (clearwell sampling site) never exceeded the
proposed MCL (1.0 mg/L) because ClO2 dosages were less than 0.80 mg/L during most of
the study (Figure 6), and they actually were even lower following chlorination in the
clearwell (Figure 4). Chlorine oxidation of ClO2- to ClO2 and ClO3
- is the only plausible
explanation for the observed ClO2- reductions.
Chlorate ion concentrations were routinely low throughout the treatment plant (Figure
5) and typically were only slightly greater than the limit of detection (0.01 mg/L), even in the
clearwell following chlorination of the GAC effluent. Chlorate ion can be formed by
photolytic disproportionation of ClO2 (Zika et al., 1985) and by chlorine oxidation of ClO2-,
but the latter reaction no doubt was the major mechanism because the treatment units are not
exposed to sunlight.
[2]ProductsClOMatter OrganicClO 2-
2 ........................................... + + →

69
The low ClO3 - concentrations in the treatment plant and distribution system reflect
one benefit of the gas-solid generator, namely that ClO3 - is not formed during the generation
process. Gallagher et al. (1994) showed that the generators and feedstock solutions
accounted for up to 40 percent of the observed distribution system ClO3 - concentrations.
Most of the ClO3- in their study was formed by chlorine reaction with ClO2
- in the clearwell.
Chlorite Removal by GAC Filtration
Chlorite-ion removals by the virgin GAC contactors during this study averaged
approximately 64 percent (Figure 7) but were declining rapidly as the study progressed
(Figure 9). The GAC appeared to be approaching exhaustion for ClO2- removal by the end of
this project (Figure 10). Activated carbon reduces ClO2- to chloride ion, but, in the process,
adsorption sites are oxidized. Other studies have also shown that GAC is relatively
ineffective for long-term ClO2- removal (Dixon and Lee, 1991).
The data from this study clearly show that the GAC contactor at the Spring Hollow
Water Treatment Plant may not adequately reduce ClO2- concentrations to below the MCL if
ClO2 dosages are increased to levels much greater than 1.0 mg/L, and some other technology,
such as reduction by reduced iron or sulfur compounds would be required.
Chlorine Dioxide, Chlorite Ion and Chlorate Ion Occurrences in the Distribution
System
Chlorine dioxide reformed in the distribution system following chlorination of the
GAC-filtered water and could be detected throughout the distribution system at levels
ranging from less than the detection limit (0.017 mg/L) to 0.15 mg/L. None was detected in
the clearwell effluent on several occasions, which may indicate that most, if not all, of the
reformation occurred in the distribution system. Gallagher et al. (1994) reported that ClO2

70
reformed in the clearwell at two locations and was found in the distribution systems as well.
At both locations, ClO2 was added as a preoxidant to raw water. No ClO2 was present prior
to the clearwell, but the mean concentration was 0.22 mg/L at one distribution system
location and 0.03 mg/L at the other. The analyses were by amperometric titration rather than
by the LGB method, however.
The reaction accounting for ClO2 reformation is the same as the one that produces
ClO2 in the generator (equation 1 shown previously) except that the chlorine is dissolved in
water as hypochlorous acid (HOCl) and the ClO2- is much less concentrated. The reaction
continues throughout the distribution system as long as chlorine and ClO2 - are present. The
concentration at any particular point is the result of a complex cyclic series of reactions
involving formation, reduction to ClO2- by reaction with organic matter and other chemically
reduced substances, and then reformation once again by ClO2- oxidation. Chloride ion can be
formed as well when ClO2 reacts with organic matter, and one would expect both ClO2 and
ClO2- concentrations to diminish with increasing residence time in the distribution system.
Chlorine dioxide concentrations in the Roanoke County distribution system followed no
particular pattern, however, even though ClO2- concentrations at distribution system locations
nearest and farthest from the treatment plant decreased significantly.
One would expect ClO3- concentrations to increase with increasing chlorine contact
time in the distribution system, and concentrations at three of the distribution system sites
(Castle Rock, Cresthill, and Penn Forest) were statistically greater than clearwell
concentrations. Concentrations at all locations, however, were uniformly quite low, and
while no ClO3- MCL has yet been proposed, the levels detected during this study most likely
are not high enough to cause any concern.

71
Chlorine Dioxide-Related Odor Complaints
Only a small number of customers complained about odors in their homes, some
repeatedly, and the complaints appeared to coincide with the installation of new carpeting.
Previous research (Hoehn et al., 1990; Dietrich et al., 1992b) indicated a similar connection
between new carpeting and odors associated with ClO2, and terms such as cat urine and
kerosene-like have been used to describe them. Descriptors used by customers in the earlier
studies were similar to those used by customers and operators during this study.
Odors could be detected when ClO2 concentrations were quite low, as is evident from
the low concentrations (0.03 mg/L and 0.07 mg/L) detected on two occasions at customers’
homes on days the complaints were made. Odor complaints did not cease until the ClO2
dosage at the treatment plant was reduced to less than 0.4 mg/L. Even at that low dose,
complaints were received during a brief period when the GAC contactor was inoperative,
which demonstrates the value of the GAC even though it was not 100 percent effective in
eliminating ClO2-. The lissamine green B method made reliable analysis of low ClO2 levels
possible, and this study is the first to document that kerosene and cat-urine odors could be
caused by ClO2 concentrations as low as 0.03 mg/L.
Elimination of the odors can be accomplished by only two methods: one, the addition
of reduced-iron coagulants or reduced sulfur compounds to remove ClO2- at the treatment
plant or, two, substitution of chloramines for chlorine in the distribution system. The
reducing agents reduce ClO2- ultimately to chloride ion (Masschelein, 1979), in which case
chlorine can continue to be used. Chloramines do not oxidize ClO2- to form ClO2.

72
Summary and Conclusions
The chlorine dioxide demand of Spring Hollow Reservoir water was low throughout
the study period, and, as a result, only low dosages were applied. As a result, ClO2-
concentrations never exceeded the MCL (1.0 mg/L). Likewise, the plant effluent ClO2
concentration never approached the MRDL (0.80 mg/L), but concentrations as high as 0.15
mg/L were detected in the distribution system.
Although no ClO3- MCL has been proposed, concentrations were quite low (never
greater than 0.10 mg/L) throughout the treatment plant and in the distribution system. The
reasons for the low concentrations are that ClO3- is not produced by the gas-solid generator
used at the facility and that ClO2- concentrations in the clearwell were uniformly low.
The 7-ft deep GAC contactor reduced ClO2- concentrations, on average, by
approximately 64 percent, but its effectiveness was declining over the six-month study
period. Apparently, GAC effectiveness, as shown by others, is short-lived, and if higher ClO2
dosages are ever applied at the Roanoke County facility, the ClO2- concentrations will have
to be reduced by either ferrous coagulants or reduce-sulfur compounds.
While meeting the ClO2- MCL likely will be no problem if the ClO2 dose at the plant
remains below 1.0 mg/L, the problem of offensive odors in the distribution system will likely
continue as long as any ClO2- is in the finished water when chlorine is present.
Concentrations of reformed ClO2 as low as 0.03 mg/L were detected at homes of customers
who complained of offensive odors. During this study, twelve complaints were received from
eight customers, and each of the customers had recently installed new carpeting.

73
References
Aston, R.N. “Chlorine Dioxide Use in Plants on the Niagara Border.” Jour. AWWA39:7:687-690 (July 1947).
Bissonette, E. and Allgeier, S. Summary of Disinfection Application Practices, EvaluatedThrough the Analysis of ICR Plant Schematics and Small Systems CPRE Data. Presented bythe authors at the Disinfectant/Disinfection By-Products Rule meeting of FACA, Office ofGround Water and Drinking Water, Technical Support Center, Cincinnati, Ohio, February,1997.
Dietrich, A.M., Ledder, T.D., Gallagher, D.L., Grabeel, M.N., and Hoehn, R.C.“Determination of Chlorite and Chlorate in Chlorinated and Chloraminated Drinking Waterby Flow Injection Analysis and Ion Chromatography.” Anal. Chem., 64:5:496-502 (March1, 1992a).
Dietrich, A.M., Orr, M.P., Gallagher, D.L., and Hoehn, R.C. “Tastes and Odors Associatedwith Chlorine Dioxide.” Jour. AWWA, 84:6:82-88 (June 1992b).
Dixon, K.L., and Lee, R.G. “The Effect of Sulfur-Based Reducing Agents and GACFiltration on Chlorine Dioxide By-products.” Jour. AWWA, 83:5:48-55 (May 1991).
Federal Register, National Primary Drinking Water Regulations: Disinfectants andDisinfection Byproducts; Proposed Rule. Vol. 59 (No. 145): 38668-38829. 40 CFR Parts141 and 142, July 29, 1994.
Federal Register, National Primary Drinking Water Regulations: Disinfectants andDisinfection Byproducts; Final Rule. Vol. 63 (No. 241): 69389-69476. 40 CFR Parts 9, 141and 142, December 16, 1998.
Gallagher, D.L., Hoehn, R.C., and Dietrich, A.M. Sources, Occurrence, and Control ofChlorine Dioxide By-Product Residuals in Drinking Water. Denver, CO: AWWARF, 1994.
Gordon, G., and Rosenblatt, A.A. Gaseous Chlorine-Free Chlorine Dioxide for DrinkingWater. Proceedings of the 1995 Water Quality Technology Conference. Denver, CO:AWWA, 1996.
Granstrom, M.L., and Lee, G.F. “Generation and Use of Chlorine Dioxide in WaterTreatment.” Jour. AWWA, 50:11:1453-1466 (November 1958).
Hoehn, R.C., Dietrich, A.M., Farmer, W.S., Orr, M.P., Lee, R.G., Aieta, E.M., Wood, D.M.III, and Gordon, G. “Household Odors Associated With the Use of Chlorine Dioxide.” Jour.AWWA, 82:4:166-172 (April 1990).
Masschelein, W.J. Chlorine Dioxide: Chemistry and Environmental Impact of OxychlorineCompounds. Ann Arbor, MI: Ann Arbor Science Publishers, 1979.
74
McCarthy, J.A. “Chlorine Dioxide for the Treatment of Water Supplies.” Jour. NewEngland Water Works Assoc., 58:252-264 (1944).
Novatek Application Note. Chlorine Dioxide Measurement Using Lissamine Green B.Miami, OH: Novatek, 1997.
Pfaff, J.D., C.A. Brockhoff, and J.W. O’Dell. 1989. Test Method: The Determination ofInorganic Anions in Water by Ion Chromatography, Methods 300.0 A&B. USEPAEnvironmental Monitoring and Systems Laboratory, Cincinnati, Ohio.
Synan, J.F., MacMahon, J.D., and Vincent, G.P. “Chlorine Dioxide - Development in theTreatment of Potable Water.” Water Works and Sewer, 91:12:423-426 (December 1944).
United States Environmental Protection Agency (USEPA). Appendix A. In Methods forOrganic Chemical Analyses of Municipal and Industrial Wastewater. Edited by J.E.Longbottom and J.J. Lichtenberg. Environmental Monitoring and Support Laboratory.EPA-600/4-82-057. Cincinnati, Ohio: USEPA, 1982.
Zika, R.G., Moore, C.A., Gidel, L.T., and Cooper, W.J. Sunlight-InducedPhotodecomposition of Chlorine Dioxide. In Water Chlorination: Environmental Impactand Health Effects. Vol. 5. Edited by R.L. Jolley, R.J. Bull, W.P. Davis, S. Katz, M.H.Roberts, Jr., and V.A. Jacobs. Chelsea, MI: Lewis Publishers, 1985.

75
CHAPTER VREFERENCES
Aieta, E.M., and Berg, J.D. “A Review of Chlorine Dioxide in Drinking Water Treatment.”Jour. AWWA, 78:6:62-72 (June 1986).
Aieta, E.M., Roberts, P.V., and Hernandez, M. “Determination of Chlorine Dioxide,Chlorine, Chlorite, and Chlorate in Water.” Jour. AWWA, 76:1:64-70 (January 1984).
American Water Works Association. Treatment Techniques for ControllingTrihalomethanes in Drinking Water. Denver, CO: AWWA, 1982.
APHA, AWWA, and WEF (American Public Health Association, American Water WorksAssociation, and Water Environment Federation). 1995. Standard Methods for theExamination of Water and Wastewater. 19th ed. Washington, D.C.: APHA.
Aston, R.N. “Chlorine Dioxide Use in Plants on the Niagara Border.” Jour. AWWA39:7:687-690 (July 1947).
Bellar, T.A., Lichtenberg, J.J., and Kroner, R.C. “The occurrence of Organohalides inChlorinated Drinking Waters.” Jour. AWWA, 66:11:703-706 (November 1974).
Bernade, M.A., Israel, B.M., Olivieri, V.P., and Granstrom, M.L. “Efficiency of ChlorineDioxide as a Bactericide.” Appl. Microbiol., 13:776 (September 1965).
Bissonette, E. and Allgeier, S. Summary of Disinfection Application Practices, EvaluatedThrough the Analysis of ICR Plant Schematics and Small Systems CPRE Data. Presented bythe authors at the Disinfectant/Disinfection By-Products Rule meeting of FACA, Office ofGround Water and Drinking Water, Technical Support Center, Cincinnati, Ohio, February,1997.
Bolyard, M., Fair, P.S., and Hautman, D.P. “Sources of chlorate ion in U.S. DrinkingWater.” Jour. AWWA, 85:9: 81-88 (September 1993).
Bubnis, B. 1997. Personal Communication.
Chemical Manufacturers Association (CMA). 1996. Sodium Chlorite: Drinking Water RatTwo-Generation Reproductive Toxicity Study. Quintiles Report Ref. CMA/17/96.
Chiswell, B., and O’Halloran, K.R. “Use of Lissamine Green B as a SpectrophotometricReagent for the Determination of Low Levels of Chlorine Dioxide.” Analyst, 116:6:657-661(June 1991).

76
Chow, B.M., and Roberts, P.V. “Halogenated Byproduct Formation by ClO2 and Cl2.” Jour.Environ. Eng. Div., Proceedings of the ASCE, 107:EE4:609-618 (August 1981).
Cooper, W.J., Zika, R.G., and Steinhauer, M.S. “Bromide-Oxidant Interaction and THMFormation: A Literature Review.” Jour. AWWA, 77:4:116-121 (April 1985).
Dietrich, A.M., Ledder, T.D., Gallagher, D.L., Grabeel, M.N., and Hoehn, R.C.“Determination of Chlorite and Chlorate in Chlorinated and Chloraminated Drinking Waterby Flow Injection Analysis and Ion Chromatography.” Anal. Chem., 64:5:496-502 (March1, 1992a).
Dietrich, A.M., Orr, M.P., Gallagher, D.L., and Hoehn, R.C. “Tastes and Odors Associatedwith Chlorine Dioxide.” Jour. AWWA, 84:6:82-88 (June 1992b).
Dixon, K.L., and Lee, R.G. “The Effect of Sulfur-Based Reducing Agents and GACFiltration on Chlorine Dioxide By-products.” Jour. AWWA, 83:5:48-55 (May 1991).
Ellenberger, C.S., Hoehn, R.C., Gallagher, D.L., Knocke, W.R., Wiseman, E.V., Benninger,R.W., and Rosenblatt, A. Water Quality Impacts of Pure Chlorine Dioxide Pretreatment atthe Roanoke County (Virginia) Water Treatment Plant. In Proceedings of the 1998 AnnualAWWA Conference and Exposition. Denver, CO: AWWA, 1998.
Federal Register, National Secondary Drinking Water Regulations. Vol. 44:42195. 40 CFRPart 140, July 19, 1979.
Federal Register, National Primary Drinking Water Regulations; Final Rule. Vol. 54 (No.124). 40 CFR Parts 141 and 142, June 29, 1989.
Federal Register, National Primary Drinking Water Regulations: Disinfectants andDisinfection Byproducts; Proposed Rule. Vol. 59 (No. 145): 38668-38829. 40 CFR Parts141 and 142, July 29, 1994.
Federal Register, National Primary Drinking Water Regulations: Disinfectants andDisinfection Byproducts; Final Rule. Vol. 63 (No. 241): 69389-69476. 40 CFR Parts 9, 141and 142, December 16, 1998.
Finch, G.R., Liyanage, L.R.J., and Belosevic, M. Effects of Chlorine Dioxide onCryptosporidium and Giardia. Proceedings of Third International Symposium on ChlorineDioxide: Drinking Water, Process Water and Wastewater Issues. Denver, CO: AWWA andAWWARF, 1995.
Gallagher, D.L., Hoehn, R.C., and Dietrich, A.M. Sources, Occurrence, and Control ofChlorine Dioxide By-Product Residuals in Drinking Water. Denver, CO: AWWARF, 1994.
Gates, D.J. The Chlorine Dioxide Handbook. Denver, CO: AWWA, 1998.

77
Glaze, W.H., Schep, R., Chauncey, W., Ruth, E.C., Zarnoch, J.J., Aieta, E.M., Tate, C.H.,and McGuire, M.J. “Evaluating Oxidants for the Removal of Model Taste and OdorCompounds From a Municipal Water Supply.” Jour. AWWA, 82:5:79-84 (May 1990).
Gordon, G., Kieffer, R.G., and Rosenblatt, D.H. “The Chemistry of Chlorine Dioxide.” InProgress in Inorganic Chemistry. Vol.15. New York, NY: Wiley-Interscience Publishers,1972.
Gordon, G., and Rosenblatt, A.A. Gaseous Chlorine-Free Chlorine Dioxide for DrinkingWater. Proceedings of the 1995 Water Quality Technology Conference. Denver, CO:AWWA, 1996.
Gordon, G., Slootmaekers, B., Tachiyashiki, S., and Wood, D. W. III. “Minimizing chloriteion and chlorate ion in water treated with chlorine dioxide.” Jour. AWWA, 82:4:160-165(April 1990).
Grabeel, M.N. “Chlorine Dioxide By-Products in Drinking Water and Their Control byPowdered Activated Carbon.” M.S. Thesis. Virginia Polytechnic Institute and StateUniversity; Blacksburg, VA (1992).
Granstrom, M.L., and Lee, G.F. “Generation and Use of Chlorine Dioxide in WaterTreatment.” Jour. AWWA, 50:11:1453-1466 (November 1958).
Griese, M.H., Hauser, K., Berkemeier, M., and Gordon, G. “Using Reducing Agents toEliminate Chlorine Dioxide and Chlorite Ion Residuals in Drinking Water.” Jour. AWWA,83:5:56-61 (May 1991).
Griese, M.H., Kaczur, J.J., and Gordon, G. “Combining Methods for the Reduction ofOxychlorine Residuals in Drinking Water.” Jour. AWWA, 84:11:69-77 (November 1992).
Hautman, D.P., and Bolyard, M. “Using Ion Chromatography to Analyze InorganicDisinfection By-products.” Jour. AWWA, 84:11:88-93 (November 1992).
Hettche, O., and Ehlbeck, H.W.S. “Epidemiology and Prophylaxes of Poliomyelitis inRespect of the Role of Water in Transfer.” Arch. Hyg. Berlin, 137:440 (1953).
Hoehn, R.C. 1993. “Chlorine Dioxide Use in Water Treatment: Key Issues.” In ConferenceProceedings: Chlorine Dioxide Drinking Water Issues. Denver, CO: AWWA ResearchFoundation, American Water Works Association, May 7-8, 1992, pp. 1-14.
Hoehn, R.C., Dietrich, A.M., Farmer, W.S., Orr, M.P., Lee, R.G., Aieta, E.M., Wood, D.M.III, and Gordon, G. “Household Odors Associated With the Use of Chlorine Dioxide.” Jour.AWWA, 82:4:166-172 (April 1990).

78
Hoff, J.C. “Inactivation of Microbial Agents by Chemical Disinfectants.” USEPA,EPA/600/2-86/067, 1986.
Hofmann, R., Andrews, R.C., and Ye, Q. “Comparison of Spectrophotometric Methods forMeasuring Chlorine Dioxide in Drinking Water.” Environ. Technol., 19:761-773 (1998).
Hurst, G.H., and Knocke, W.R. “Evaluating Ferrous Iron for Chlorite Ion Removal.” Jour.AWWA, 89:8:98-105 (August 1997).
Iatrou, A., and Knocke, W.R. “Removing Chlorite by the Addition of Ferrous Iron.” Jour.AWWA, 84:11:63-68 (November 1992).
Jensen, J.N. and Johnson, J.D. “Interferences by Monochloramine and Organic Chloraminesin Free Available Chlorine Methods. 1. Amperometric Titration.” Environ. Sci. Technol.,24:7:981-985 (1990).
Knocke, W.R., Hoehn, R.C., and Sinsabaugh, R.L. “Using Alternative Oxidants to RemoveDissolved Manganese From Waters Laden With Organics.” Jour. AWWA, 79:3:75-79(March 1987).
Knocke, W.R., Van Benschoten, J.E., Kearney, M., Soborski, A., and Reckhow, D.A.Alternative Oxidants for the Removal of Soluble Iron and Manganese. Denver, CO:AWWARF, 1990.
Korich, D.G., Mead, J.R., Madore, M.S., Sinclair, N.A., and Sterling, C.R. “Effects ofOzone, Chlorine Dioxide, Chlorine, and Monochloramine on Cryptosporidium parvumOocyst Viability.” Appl. Environ. Microbiol., 56:5:1423-1429 (1990).
Lalezary, S., Pirbazari, M., and McGuire, M.J. “Oxidation of Five Earthy-Musty Taste andOdor Compounds.” Jour. AWWA, 78:3:62-69 (March 1986).
Limoni, B., Goldstein, E.C., and Rav-Acha, C. “Determination of Oxidants Formed Uponthe Disinfection of Drinking Water with Chlorine Dioxide.” Jour. Environ. Sci. Health,A19:8:943-957 (1984).
Liyanage, L.R.J., Gyurek, L.L., Belosevic, M., and Finch, G.R. “Effect of Chlorine DioxidePreconditioning on Inactivation of Cryptosporidium by Free Chlorine and Monochloramine:Process Design Requirements.” Proceedings of the 1996 Water Quality TechnologyConference. Denver, CO: AWWA, 1997.
Lohman, S.R., and Rogers, S.E. “Chlorine Dioxide By-Products Reduction by GranularActivated Carbon.” Proceedings of the Water Reuse Symposium IV. Denver, CO: AWWA,1987.

79
Long, B.W., Miller, R.F., and Rosenblatt, A.A. “Pilot Study: The Use of High-PurityChlorine-Free Chlorine Dioxide to Minimize Trihalomethane Formation.” Proceedings ofthe 6th International Symposium on Chemical Oxidation: Technology for the Nineties.Vanderbilt University, Nashville, TN, April 15-17, 1996.
Lykins, B.W. Jr, and DeMarco, J. “Pilot Study on the Use of Chlorine Dioxide.” InTreatment of Water by Granular Activated Carbon. M.J. McGuire and I.H. Suffet (editors),American Chemical Society Advances in Chemistry Series 202, Washington, D.C. (1983).
Lykins, B.W. Jr, Goodrich, J.A., Koffskey, W.E., and Griese, M.H. “ControllingDisinfection By-Products with Alternative Disinfectants.” In Proceedings of the 1991Annual Conference of the AWWA. Denver, CO: AWWA, 1991.
Lykins, B.W. Jr, and Griese, M.H. “Using Chlorine Dioxide for Trihalomethane Control.”Jour. AWWA, 78:6:88-93 (June 1986).
Masschelein, W.J. Chlorine Dioxide: Chemistry and Environmental Impact of OxychlorineCompounds. Ann Arbor, MI: Ann Arbor Science Publishers, 1979.
McCarthy, J.A. “Chlorine Dioxide for the Treatment of Water Supplies.” Jour. NewEngland Water Works Assoc., 58:252-264 (1944).
McGuire, M.J., Lieu, N.I., and Pearthree, M.S. “Using Chlorite Ion to Control Nitrification.”Jour. AWWA, 91:10:52-61 (October 1999).
Mitchell, R.M. “Evaluation of Different Powdered Activated Carbons in The Control ofChlorite Ion.” M.S. Thesis. Virginia Polytechnic Institute and State University; Blacksburg,VA (1993).
National Cancer Institute. Report on the Carcinogenesis Bioassay of Chloroform. NTISPB264018/AS. Washington, D.C.: NCI, 1976.
Novatek Application Note. The Measurement of Inorganic Species by Ion Chromatography(USEPA Method 300.0 – Revised). Method C9-02001. Miami, OH: Novatek, January 1993.
Novatek Application Note. Chlorine Dioxide Measurement Using Lissamine Green B.Miami, OH: Novatek, January 1997.
Ondrus, M.G., and Gordon, G. “The Oxidation of Hexaquoiron (II) by Chlorine (III) inAqueous Solution.” Inorganic Chem., 11:5:985-989 (May 1972).
Orr, M.P. “Reduction of Odors Associated with Chlorine Dioxide Applications to DrinkingWater.” M.S. Thesis. Virginia Polytechnic Institute and State University; Blacksburg, VA(1990).

80
Pfaff, J.D., and Brockhoff, C.A. “Determining Inorganic Disinfection By-products by IonChromatography.” Jour. AWWA, 82:4:192-195 (April 1990).
Pfaff, J.D., C.A. Brockhoff, and J.W. O’Dell. 1989. Test Method: The Determination ofInorganic Anions in Water by Ion Chromatography, Methods 300.0 A&B. USEPAEnvironmental Monitoring and Systems Laboratory, Cincinnati, Ohio.
Rav-Acha, C. “The Reactions of Chlorine Dioxide with Aquatic Organic Materials andTheir Health Effects.” Water Res., 18:11:1329-1341 (November 1984).
Ridenour, G.M., and Ingols, R.S. “Bactericidal Properties of Chlorine Dioxide.” Jour.AWWA, 39:561 (1947).
Rook, J.J. “Formation of Haloforms during Chlorination of Natural Waters.” Journ. Societyfor Water Treatment Exam., 23:2:234-243 (1974).
Singer, P.C. and W.K. O'Neil. “Technical Note: The Formation of Chlorate from theReaction of Chlorine and Chlorite in Dilute Aqueous Solution.” Jour. AWWA, 79:11:75-76(November 1987).
Steinbergs, C.Z. “Removal of By-products of Chlorine and Chlorine Dioxide at aHemodialysis Center.” Jour. AWWA, 78:6:94 (June 1986).
Synan, J.F., MacMahon, J.D., and Vincent, G.P. “Chlorine Dioxide - Development in theTreatment of Potable Water.” Water Works and Sewer, 91:12:423-426 (December 1944).
Thompson, A.L. “Chlorine Dioxide Process Treatment Data and Cost.” In Chlorine DioxideUse in Water Treatment, Second International Symposium. Denver, CO: AWWA andAWWARF, 1993.
Thompson, A.L., Matthews, N.O., Mittl, A.J., and Owen, D.M. “Chlorite and ChlorateResiduals in the Distribution System.” AWWA Water Quality Technology ConferenceProceedings. Denver, CO: AWWA, 1989.
United States Environmental Protection Agency (USEPA). Appendix A. In Methods forOrganic Chemical Analyses of Municipal and Industrial Wastewater. Edited by J.E.Longbottom and J.J. Lichtenberg. Environmental Monitoring and Support Laboratory.EPA-600/4-82-057. Cincinnati, Ohio: USEPA, 1982.
United States Environmental Protection Agency (USEPA). An Evaluation of AlternativeOxidant and Disinfectant Treatment Strategies for Controlling Trihalomethane Formation inDrinking Water. USEPA Coop. Agreement CR811108 (September 1983).

81
United States Environmental Protection Agency (USEPA). Final: Occurrence Assessmentfor Disinfectants and Disinfection Byproducts in Public Drinking Water Supplies. Preparedby Science Applications International Corporation (McLean, Va.) for Office of Groundwaterand Drinking Water, USEPA, Washington, D.C., November 13, 1997.
Vel Leitner, N.K., De Laat, J., Dore, M., Suty, H., and Pouillot, M. “Chlorite and ChlorineDioxide Removal by Activated Carbon.” Water Res., 26:8:1053-1066 (August 1992).
Voudrias, E.A., Dielmann, L.M.J., Snoeyink, V.L., Larson, R.A., McCreary, J.J., and Chen,A.S.C. “Reactions of Chlorite with Activated Carbon and with Vanillic Acid and IndanAdsorbed on Activated Carbon.” Water Res., 17:9:11071114 (September 1983).
Walker, G.S., Lee, F.P., and Aieta, E.M. “Chlorine Dioxide for Taste and Odor Control.”Jour. AWWA, 78:3:84-93 (March 1986).
Werdehoff, K.S., and Singer, P.C. “Chlorine Dioxide Effects on THMFP, TOXFP, and theFormation of Inorganic By-products.” Jour. AWWA, 79:9:107-113 (September 1987).
White, G.C. Handbook of Chlorination. New York, NY: Van Nostrand Reinhold Company,1972.
Zika, R.G., Moore, C.A., Gidel, L.T., and Cooper, W.J. Sunlight-InducedPhotodecomposition of Chlorine Dioxide. In Water Chlorination: Environmental Impactand Health Effects. Vol. 5. Edited by R.L. Jolley, R.J. Bull, W.P. Davis, S. Katz, M.H.Roberts, Jr., and V.A. Jacobs. Chelsea, MI: Lewis Publishers, 1985.

83
APPENDIX A
CHLORITE ION AND CHLORATE ION
ANALYTICAL DATA
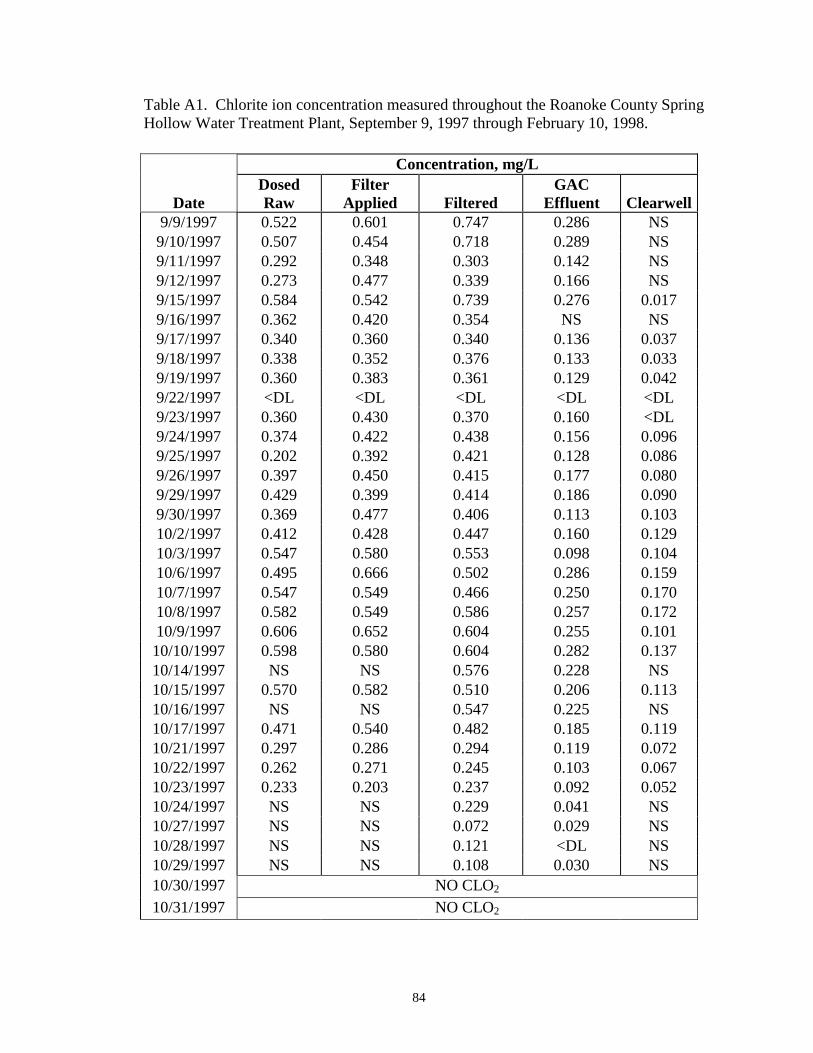
84
Table A1. Chlorite ion concentration measured throughout the Roanoke County SpringHollow Water Treatment Plant, September 9, 1997 through February 10, 1998.
Concentration, mg/L
DateDosedRaw
FilterApplied Filtered
GACEffluent Clearwell
9/9/1997 0.522 0.601 0.747 0.286 NS9/10/1997 0.507 0.454 0.718 0.289 NS9/11/1997 0.292 0.348 0.303 0.142 NS9/12/1997 0.273 0.477 0.339 0.166 NS9/15/1997 0.584 0.542 0.739 0.276 0.0179/16/1997 0.362 0.420 0.354 NS NS9/17/1997 0.340 0.360 0.340 0.136 0.0379/18/1997 0.338 0.352 0.376 0.133 0.0339/19/1997 0.360 0.383 0.361 0.129 0.0429/22/1997 <DL <DL <DL <DL <DL9/23/1997 0.360 0.430 0.370 0.160 <DL9/24/1997 0.374 0.422 0.438 0.156 0.0969/25/1997 0.202 0.392 0.421 0.128 0.0869/26/1997 0.397 0.450 0.415 0.177 0.0809/29/1997 0.429 0.399 0.414 0.186 0.0909/30/1997 0.369 0.477 0.406 0.113 0.10310/2/1997 0.412 0.428 0.447 0.160 0.12910/3/1997 0.547 0.580 0.553 0.098 0.10410/6/1997 0.495 0.666 0.502 0.286 0.15910/7/1997 0.547 0.549 0.466 0.250 0.17010/8/1997 0.582 0.549 0.586 0.257 0.17210/9/1997 0.606 0.652 0.604 0.255 0.10110/10/1997 0.598 0.580 0.604 0.282 0.13710/14/1997 NS NS 0.576 0.228 NS10/15/1997 0.570 0.582 0.510 0.206 0.11310/16/1997 NS NS 0.547 0.225 NS10/17/1997 0.471 0.540 0.482 0.185 0.11910/21/1997 0.297 0.286 0.294 0.119 0.07210/22/1997 0.262 0.271 0.245 0.103 0.06710/23/1997 0.233 0.203 0.237 0.092 0.05210/24/1997 NS NS 0.229 0.041 NS10/27/1997 NS NS 0.072 0.029 NS10/28/1997 NS NS 0.121 <DL NS10/29/1997 NS NS 0.108 0.030 NS10/30/1997 NO CLO2
10/31/1997 NO CLO2

85
Table A1. Chlorite ion concentration measured throughout the Roanoke CountySpring Hollow Water Treatment Plant, September 9, 1997 through February 10, 1998.
Concentration, mg/L
DateDosedRaw
FilterApplied Filtered
GACEffluent Clearwell
11/4/1997 NS NS 0.105 0.008 NS11/5/1997 NS NS NS NS NS11/6/1997 NS NS 0.599 0.227 0.03211/7/1997 NS NS 0.525 0.218 0.12511/10/1997 0.329 0.363 0.495 0.213 0.14011/11/1997 NS NS 0.488 0.216 NS11/12/1997 NS NS 0.486 0.212 NS11/13/1997 0.291 0.357 0.495 0.218 0.13911/14/1997 NS NS 0.482 0.139 NS11/17/1997 NS NS 0.521 0.242 NS11/18/1997 NS NS 0.342 0.167 NS11/19/1997 NS NS 0.338 0.166 NS11/20/1997 NS NS 0.174 0.133 NS11/21/1997 0.228 0.291 0.329 0.156 0.08011/24/1997 0.217 0.519 0.318 0.150 0.08711/25/1997 NS NS 0.433 <DL NS11/26/1997 NS NS 0.342 0.082 NS11/27/1997 NS NS 0.336 0.287 NS11/28/1997 NO CLO2
12/1/1997 NS NS 0.369 0.159 NS12/2/1997 NS NS 0.334 0.227 NS12/3/1997 0.272 0.352 0.304 0.159 0.09212/4/1997 NS NS 0.331 0.071 NS12/5/1997 0.219 0.252 0.325 0.158 0.08112/8/1997 NS NS 0.341 0.170 NS12/9/1997 NS NS 0.320 0.171 NS12/11/1997 NS NS 0.320 0.118 0.07112/12/1997 0.545 0.284 0.355 0.131 0.11012/15/1997 NS NS 0.357 0.193 NS12/16/1997 NS NS 0.343 0.186 NS12/17/1997 NS NS 0.343 0.131 0.11312/18/1997 NS NS 0.343 0.181 0.09612/19/1997 NS NS 0.314 0.185 NS12/22/1997 NS NS 0.285 0.161 NS12/23/1997 0.163 0.185 0.279 0.152 0.09712/24/1997 NS NS 0.100 0.094 NS12/26/1997 NS NS 0.279 0.131 NS

86
Table A1. Chlorite ion concentration measured throughout the Roanoke CountySpring Hollow Water Treatment Plant, September 9, 1997 through February 10, 1998.
Concentration, mg/L
DateDosedRaw
FilterApplied Filtered
GACEffluent Clearwell
12/29/1997 NS NS 0.215 0.066 NS12/30/1997 0.158 0.184 0.150 0.090 0.09512/31/1997 NS NS 0.251 0.149 NS1/1/1998 NS NS 0.253 0.095 NS1/2/1998 NS NS 0.267 0.133 NS1/5/1998 NS NS 0.267 0.154 NS1/6/1998 NS NS 0.259 0.150 NS1/7/1998 0.162 0.219 0.269 0.154 0.0891/8/1998 NS NS 0.259 0.152 0.0991/9/1998 NS NS 0.263 0.145 NS1/12/1998 0.196 0.225 0.267 0.154 0.1071/13/1998 NS NS 0.271 0.150 NS1/14/1998 NS NS 0.271 0.151 NS1/15/1998 NS NS 0.250 0.124 NS1/16/1998 NS NS 0.259 0.147 0.0771/20/1998 NS NS 0.247 0.147 NS1/21/1998 NS NS <DL 0.059 NS1/22/1998 0.186 0.232 0.271 0.161 0.0821/23/1998 NS NS 0.004 <DL NS1/26/1998 0.144 0.256 0.259 0.084 0.0951/27/1998 0.124 0.232 0.234 0.082 0.1131/28/1998 0.134 0.210 0.324 0.070 0.1051/29/1998 0.211 0.151 0.151 0.051 0.1031/30/1998 0.127 0.145 0.207 0.069 0.1152/2/1998 0.161 0.273 0.255 0.143 0.1022/4/1998 0.184 0.170 0.184 0.046 <DL2/5/1998 0.170 0.107 0.109 0.032 0.0292/6/1998 NS NS 0.255 0.092 NS2/9/1998 NS NS 0.216 0.089 NS2/10/1998 0.208 0.160 0.158 0.055 0.126
NS = Not Sampled<DL = less than detection limit (0.004 mg/L)

87
Table A2. Chlorate ion concentration measured throughout the Roanoke CountySpring Hollow Water Treatment Plant, September 9, 1997 through February 10, 1998.
Concentration, mg/L
DateDosedRaw
FilterApplied Filtered
GACEffluent Clearwell
9/10/1997 NS NS 0.029 <DL NS9/11/1997 0.019 0.014 0.014 0.021 NS9/12/1997 0.015 0.011 0.014 <DL NS9/15/1997 0.022 0.014 0.023 0.016 0.0609/16/1997 0.019 0.011 <DL NS NS9/17/1997 0.016 0.021 <DL <DL 0.0679/18/1997 0.018 0.019 0.017 <DL 0.0429/19/1997 0.016 <DL 0.018 <DL 0.0679/22/1997 <DL <DL <DL <DL <DL9/23/1997 0.014 0.019 0.014 <DL <DL9/24/1997 0.016 0.016 <DL 0.021 0.0269/25/1997 0.015 0.015 0.018 0.017 0.0259/26/1997 0.022 <DL 0.017 0.015 0.0189/29/1997 0.015 0.018 0.017 0.014 0.0199/30/1997 <DL <DL <DL 0.017 0.02210/2/1997 <DL <DL <DL 0.016 0.01610/3/1997 0.024 0.011 <DL <DL 0.01210/6/1997 <DL <DL <DL <DL 0.01710/7/1997 0.012 <DL 0.011 0.015 <DL10/8/1997 <DL 0.017 0.017 <DL 0.01410/9/1997 0.015 <DL <DL <DL 0.01110/10/1997 <DL <DL 0.013 <DL 0.07010/14/1997 NS NS <DL <DL NS10/15/1997 <DL <DL <DL <DL <DL10/16/1997 NS NS <DL <DL NS10/17/1997 <DL <DL <DL <DL 0.01610/21/1997 <DL <DL <DL <DL <DL10/22/1997 <DL <DL <DL <DL <DL10/23/1997 <DL 0.030 <DL <DL <DL10/24/1997 NS NS <DL <DL NS10/27/1997 NS NS <DL <DL NS10/28/1997 NS NS <DL <DL NS10/29/1997 NS NS <DL <DL NS10/30/1997 NO CLO2
10/31/1997 NO CLO2
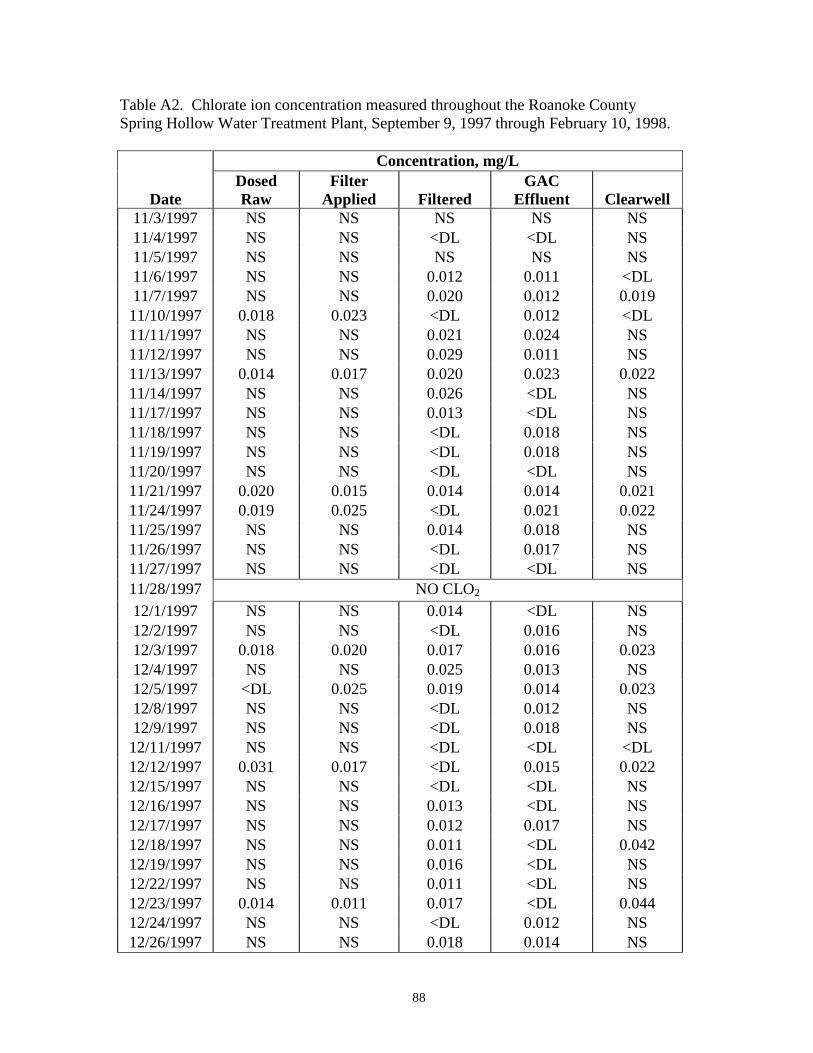
88
Table A2. Chlorate ion concentration measured throughout the Roanoke CountySpring Hollow Water Treatment Plant, September 9, 1997 through February 10, 1998.
Concentration, mg/L
DateDosedRaw
FilterApplied Filtered
GACEffluent Clearwell
11/3/1997 NS NS NS NS NS11/4/1997 NS NS <DL <DL NS11/5/1997 NS NS NS NS NS11/6/1997 NS NS 0.012 0.011 <DL11/7/1997 NS NS 0.020 0.012 0.01911/10/1997 0.018 0.023 <DL 0.012 <DL11/11/1997 NS NS 0.021 0.024 NS11/12/1997 NS NS 0.029 0.011 NS11/13/1997 0.014 0.017 0.020 0.023 0.02211/14/1997 NS NS 0.026 <DL NS11/17/1997 NS NS 0.013 <DL NS11/18/1997 NS NS <DL 0.018 NS11/19/1997 NS NS <DL 0.018 NS11/20/1997 NS NS <DL <DL NS11/21/1997 0.020 0.015 0.014 0.014 0.02111/24/1997 0.019 0.025 <DL 0.021 0.02211/25/1997 NS NS 0.014 0.018 NS11/26/1997 NS NS <DL 0.017 NS11/27/1997 NS NS <DL <DL NS11/28/1997 NO CLO2
12/1/1997 NS NS 0.014 <DL NS12/2/1997 NS NS <DL 0.016 NS12/3/1997 0.018 0.020 0.017 0.016 0.02312/4/1997 NS NS 0.025 0.013 NS12/5/1997 <DL 0.025 0.019 0.014 0.02312/8/1997 NS NS <DL 0.012 NS12/9/1997 NS NS <DL 0.018 NS12/11/1997 NS NS <DL <DL <DL12/12/1997 0.031 0.017 <DL 0.015 0.02212/15/1997 NS NS <DL <DL NS12/16/1997 NS NS 0.013 <DL NS12/17/1997 NS NS 0.012 0.017 NS12/18/1997 NS NS 0.011 <DL 0.04212/19/1997 NS NS 0.016 <DL NS12/22/1997 NS NS 0.011 <DL NS12/23/1997 0.014 0.011 0.017 <DL 0.04412/24/1997 NS NS <DL 0.012 NS12/26/1997 NS NS 0.018 0.014 NS

89
Table A2. Chlorate ion concentration measured throughout the Roanoke CountySpring Hollow Water Treatment Plant, September 9, 1997 through February 10, 1998.
Concentration, mg/L
DateDosedRaw
FilterApplied Filtered
GACEffluent Clearwell
12/29/1997 NS NS <DL 0.011 NS12/30/1997 <DL 0.016 <DL 0.012 <DL12/31/1997 NS NS 0.013 0.013 NS1/1/1998 NS NS 0.014 0.015 NS1/2/1998 NS NS 0.013 0.017 NS1/5/1998 NS NS 0.017 0.014 NS1/6/1998 NS NS 0.016 0.014 NS1/7/1998 0.017 0.016 0.013 0.018 0.0171/8/1998 NS NS 0.013 0.015 0.0211/9/1998 NS NS 0.017 0.016 NS1/12/1998 0.014 0.013 0.012 0.016 0.0231/13/1998 NS NS <DL 0.014 NS1/14/1998 NS NS <DL 0.013 NS1/15/1998 NS NS <DL <DL NS1/16/1998 NS NS 0.013 <DL NS1/20/1998 NS NS <DL <DL NS1/21/1998 NS NS <DL <DL NS1/22/1998 0.017 0.023 <DL <DL 0.0211/23/1998 NS NS <DL <DL 0.0231/26/1998 <DL <DL <DL <DL 0.0141/27/1998 <DL <DL <DL <DL 0.0111/28/1998 <DL <DL 0.014 <DL <DL1/29/1998 NS NS <DL <DL 0.0301/30/1998 <DL <DL <DL <DL 0.0282/2/1998 <DL <DL <DL <DL 0.0212/4/1998 <DL 0.013 0.011 0.022 <DL2/5/1998 <DL <DL <DL <DL 0.0112/6/1998 NS NS 0.014 <DL NS2/9/1998 NS NS 0.013 <DL NS2/10/1998 0.026 0.016 <DL 0.015 0.027
NS = Not Sampled<DL = less than detection limit (0.011 mg/L)

90
Table A3. Chlorite ion concentrations in the Roanoke County Distribution System,November 25, 1997 through February 13, 1998.
Concentration, mg/LDate Hunting
HillsPenn
ForestOak
GroveCastleRock
HiddenValley
CherokeeHills
11/25/1997 0.060 0.074 0.061 0.077 0.064 0.08912/2/1997 0.011 0.026 0.044 0.054 0.077 0.10912/9/1997 <DL 0.070 0.070 0.010 0.050 <DL
12/11-12/12/1997
0.010 0.040 0.030 0.010 0.030 0.030
12/17/1997 0.090 0.070 0.080 0.070 0.090 0.1301/8/1998 0.050 0.090 0.070 0.100 0.080 0.1001/16/1998 <DL 0.080 0.080 0.080 0.080 0.1001/23/1998 0.010 0.090 0.060 0.060 0.080 0.0502/13/1998 0.080 0.080 0.060 0.100 0.090 0.090
<DL = less than detection limit (0.004 mg/L)
Table A4. Chlorate ion concentrations in the Roanoke County Distribution System,November 25, 1997 through February 13, 1998.
Concentration, mg/LDate Hunting
HillsPenn
ForestOak
GroveCastleRock
HiddenValley
CherokeeHills
11/25/1997 0.035 0.046 0.025 0.040 0.040 0.03212/2/1997 0.016 0.050 0.028 0.049 0.036 0.03612/9/1997 0.020 0.040 0.030 0.040 0.030 0.020
12/11-12/12/1997
<DL 0.030 0.040 <DL 0.020 0.020
12/17/1997 0.030 0.060 0.040 0.090 0.030 0.0301/8/1998 0.030 0.030 0.030 0.020 0.030 0.0201/16/1998 0.025 0.015 0.043 0.022 0.012 0.0221/23/1998 0.025 0.040 0.033 <DL 0.023 0.0232/13/1998 0.030 0.040 0.030 0.030 0.030 0.020
<DL = less than detection limit (0.011 mg/L)

91
Table A5. Data for the calculation of chlorite ion and chlorate ion limits of detectionby ion chromatography.
Actual Concentration = 0.02 mg/L
Concentration, mg/LReplicate Chlorite ion Chlorate ion
1 0.0236 0.02032 0.0248 0.01623 0.0236 0.01554 0.0236 0.02295 0.0225 0.01416 0.0248 0.02647 0.0236 0.02068 0.0214 0.01979 0.0214 0.016310 0.0214 0.0153
Std dev 0.0013 0.0039T 2.8214 2.8214MDL, mg/L 0.0037 0.0111LOQ, mg/L 0.0184 0.0555
Std dev = standard deviationT = Student's T-valueMDL = method detection limitLOQ = limit of quantitation
Table A6. Comparison of chlorite ion and chlorate ion concentrations in split samplesanalyzed at Virginia Tech and Novatek, an independent laboratory.
Chlorite ion, µµµµg/L Chlorate ion, µµµµg/LDate Novatek Va Tech Novatek Va Tech
9/17/1997 44 37 68 679/24/1997 103 96 30 2610/2/1997 147 129 22 1610/8/1997 162 172 28 14

92
0
20
40
60
80
100
120
140
160
180
200
0 50 100 150 200
Novatek (chlorite ion, mg/L)
Vir
gini
a Te
ch (c
hlor
ite io
n, m
g/L)
Figure A1. Comparison of chlorite ion concentrations determined at Virginia Tech and Novatek (see Table A8)

93
0
10
20
30
40
50
60
70
80
90
100
0 20 40 60 80 100
Novatek (chlorate ion, mg/L)
Vir
gini
a Te
ch (c
hlor
ate
ion,
mg/
L)
Figure A2. Comparison of chlorate ion concentrations determined at Virginia Tech and Novatek (see Table A8)

94
APPENDIX B
CHLORINE DIOXIDE
ANALYTICAL DATA

95
Table B1. Chlorine dioxide concentration measured throughout the Roanoke County SpringHollow Water Treatment Plant, November 24, 1997 through February 5, 1998.
DateDosedRaw
FilterApplied Filtered
11/24/1997 0.413 0.397 0.26311/25/1997 0.157 0.106 <DL12/2/1997 0.161 0.133 0.02012/3/1997 0.150 0.069 <DL12/4/1997 0.111 0.163 0.02112/5/1997 0.193 0.168 0.07012/8/1997 0.045 <DL <DL12/9/1997 0.236 0.105 0.02812/10/1997 0.381 0.330 <DL12/11/1997 0.195 0.153 0.02412/12/1997 0.440 0.092 <DL12/16/1997 0.191 0.159 <DL12/17/1997 0.207 0.169 0.02512/18/1997 0.220 0.180 <DL12/19/1997 0.175 0.163 0.07812/22/1997 0.155 0.141 0.0301/5/1998 0.137 0.109 0.0411/6/1998 0.164 0.134 0.0731/7/1998 0.157 0.125 0.0531/8/1998 0.107 0.088 0.0521/9/1998 0.076 0.080 0.0361/12/1998 0.057 0.048 0.0171/13/1998 0.121 0.097 <DL1/15/1998 0.117 0.103 0.0321/16/1998 0.154 0.116 0.0731/20/1998 0.099 0.040 <DL1/22/1998 0.099 0.165 0.0621/26/1998 0.054 <DL <DL1/27/1998 0.067 <DL <DL1/28/1998 0.102 0.021 0.0341/29/1998 0.114 0.028 0.0311/30/1998 0.108 0.038 0.0252/2/1998 0.112 <DL <DL2/4/1998 0.102 0.025 0.0282/5/1998 0.079 0.021 0.018
<DL = less than detection limit (0.017 mg/L)

96
Table B2. Chlorine dioxide concentrations in the Roanoke County Distribution SystemNovember 25, 1997 through February 13, 1998.
Concentration, mg/L
DateHunting
HillsPenn
ForestOak
GroveCastleRock
HiddenValley
CherokeeHills
11/25/1997 0.157 0.069 0.063 0.083 0.086 0.09512/02/1997 0.152 0.082 0.051 0.054 0.107 0.11112/05/1997 NS NS 0.026 NS NS NS12/09/1997 <DL <DL <DL <DL <DL <DL12/10/1997 NS NS 0.037 NS NS NS
12/11-12/12/1997
0.077 0.036 0.021 0.095 0.087 0.019
12/17/1997 0.066 0.040 0.040 0.047 0.032 0.04701/08/1998 0.044 0.035 0.023 0.071 0.020 <DL01/16/1998 <DL <DL 0.026 <DL <DL <DL01/23/1998 0.029 0.046 <DL 0.023 0.026 <DL02/13/1998 <DL 0.036 <DL <DL <DL <DL
NS = not sampled<DL = less than detection limit (0.017 mg/L)

97
Figure B1. LGB Standard Curve in Finished Water 11/25/97
0.00 0.05 0.10 0.15 0.20 0.25 0.30 0.35 0.40 0.45 0.50 0.550.70
0.75
0.80
0.85
0.90
0.95
1.00
1.05
Standard CurveRegression (R2 = 0.9820)95% Confidence Interval
Abs
orba
nce
Concentration, mg/L

98
Figure B2. LGB Standard Curve in Finished Water 12/2/97
0.00 0.05 0.10 0.15 0.20 0.25 0.30 0.35 0.40 0.45 0.50 0.550.70
0.75
0.80
0.85
0.90
0.95
1.00
1.05
Standard CurveRegression (R2 = 0.9459)95% Confidence Interval
Concentration, mg/L
Abs
orba
nce

99
Figure B3. LGB Standard Curve in Distribution System Water, Vauxhall Road,12/5/97
Concentration, mg/L
0.00 0.05 0.10 0.15 0.20 0.25 0.30 0.35 0.40 0.45 0.50 0.550.65
0.70
0.75
0.80
0.85
0.90
0.95
1.00
Standard CurveRegression (R2 = 0.9930)95% Confidence Interval
Abs
orba
nce

100
Figure B4. LGB Standard Curve in Distribution System Water, Vauxhall Road, 12/9/97
0.00 0.05 0.10 0.15 0.20 0.25 0.30 0.35 0.40 0.45 0.50 0.550.70
0.75
0.80
0.85
0.90
0.95
1.00
1.05
Standard CurveRegression (R2 = 0.6322)95% Confidence Interval
Abs
orba
nce
Concentration, mg/L

101
0.00 0.05 0.10 0.15 0.20 0.25 0.30 0.35 0.40 0.45 0.50 0.550.65
0.70
0.75
0.80
0.85
0.90
0.95
1.00
Standard CurveRegression (R2 = 0.9775)95% Confidence Interval
Figure B5. LGB Standard Curve in Distribution System Water, Cordell Drive, 12/10/97
Abs
orba
nce
Concentration, mg/L

102
0.00 0.05 0.10 0.15 0.20 0.25 0.30 0.35 0.40 0.45 0.50 0.55 0.600.65
0.70
0.75
0.80
0.85
0.90
0.95
1.00
Standard CurveRegression (R2 = 0.9848)
95% Confidence Interval
Abs
orba
nce
Concentration, mg/L
Figure B6. LGB Standard Curve in Distribution System Water, Cordell Drvie, 12/11/97

103
0.00 0.05 0.10 0.15 0.20 0.25 0.30 0.35 0.40 0.45 0.50 0.55 0.600.65
0.70
0.75
0.80
0.85
0.90
0.95
1.00
Standard CurveRegression (R2 = 0.9874)95% Confidence Intervals
Figure B7. LGB Standard Curve for Analysis of ClO2 in Distribution System Water from Buckskin Lane, 12/12/97
Abs
orba
nce
Concentration, mg/L

104
Figure B8. LGB standard curve in distribution system water, Buckskin Lane, 12/17/97
Concentration, mg/L
0.00 0.05 0.10 0.15 0.20 0.25 0.30 0.35 0.40 0.45 0.50 0.55
Abs
orba
nce
0.65
0.70
0.75
0.80
0.85
0.90
0.95
1.00
Standard CurveRegression (R2 = 0.9968)95% Confidence Interval

105
Figure B9. LGB Standard Curve in Distribution System Water, Cordell Drive, 1/8/98
0.00 0.05 0.10 0.15 0.20 0.25 0.30 0.35 0.40 0.45 0.50 0.550.65
0.70
0.75
0.80
0.85
0.90
0.95
1.00
Standard CurveRegression (R2 = 0.9777)95% Confidence Interval
Concentration, mg/L
Abs
orba
nce

106
Figure B10. LGB Standard Curve in Distribution System Water, Fairway Estates Drive, 1/16/98
0.00 0.05 0.10 0.15 0.20 0.25 0.30 0.35 0.40 0.45 0.50 0.550.65
0.70
0.75
0.80
0.85
0.90
0.95
1.00
Standard CurveRegression (R2 = 0.9644)95% Confidence Interval
Abs
orba
nce
Concentration, mg/L

107
Figure B11. LGB Standard Curve in Distribution System Water, 1/23/98
0.00 0.05 0.10 0.15 0.20 0.25 0.30 0.35 0.40 0.45 0.50 0.550.65
0.70
0.75
0.80
0.85
0.90
0.95
1.00
Standard CurveRegression (R2 = 0.9969)95% Confidence Interval
Abs
orba
nce
Concentration, mg/L

108
Figure B12. LGB Standard Curve in Distribution System Water, Perigrine Crest Circle, 2/13/98
0.00 0.05 0.10 0.15 0.20 0.25 0.30 0.35 0.40 0.45 0.50 0.550.65
0.70
0.75
0.80
0.85
0.90
0.95
1.00
Standard CurveRegression (R2 = 0.9717)95% Confidence Interval
Abs
orba
nce
Concentration, mg/L

VITAChristine Ellenberger was born September 17, 1974, in Falls Church,Virginia. She received a Bachelor of Science in Civil Engineering fromVirginia Polytechnic Institute and State University, Blacksburg, Virginia inthe summer of 1996. During her undergraduate curriculum she interned atMontgomery Watson Consulting Engineers in Herndon, Virginia. Shestayed at Virginia Polytechnic Institute and State University to earn a Masterof Science in Environmental Engineering in the fall of 1999. She worked asboth a teaching assistant and a research assistant while completing herdegree. She accepted a job as a Civil Engineer with Black & Veatch, Inc. inGreenville, South Carolina.