water quality analysis of ecoroof runoff in portland
TRANSCRIPT
Portland State University Portland State University
PDXScholar PDXScholar
Civil and Environmental Engineering Master's Project Reports Civil and Environmental Engineering
Summer 8-18-2019
Water Quality Analysis of Ecoroof Runoff in Portland Water Quality Analysis of Ecoroof Runoff in Portland
Pranoti P. Deshmukh Portland State University
Follow this and additional works at: https://pdxscholar.library.pdx.edu/cengin_gradprojects
Part of the Civil and Environmental Engineering Commons
Let us know how access to this document benefits you.
Recommended Citation Recommended Citation Deshmukh, Pranoti P., "Water Quality Analysis of Ecoroof Runoff in Portland" (2019). Civil and Environmental Engineering Master's Project Reports. 48. https://doi.org/10.15760/CCEMP.47
This Project is brought to you for free and open access. It has been accepted for inclusion in Civil and Environmental Engineering Master's Project Reports by an authorized administrator of PDXScholar. Please contact us if we can make this document more accessible: [email protected].
WATER QUALITY ANALYSIS OF ECOROOF
RUNOFF IN PORTLAND
By
PRANOTI DESHMUKH
A research project report submitted in partial fulfillment of the
requirement for the degree of
MASTER OF SCIENCE
IN
CIVIL AND ENVIRONMENTAL ENGINEERING
Project Advisor:
Dr. William Fish
Portland State University
2019
Water Quality Analysis of Ecoroof Runoff in Portland
2
Abstract
Portland, Oregon is internationally recognized for its implementation of sustainable
stormwater management technologies. Ecoroof is one of the sustainable solutions to reduce
stormwater runoff which also provides multiple environmental benefits. However, very little is
known about the impact of ecoroofs on water quality of roof runoff. Stormwater runoff carries a
significant amount of pollutants, which, if it directly enters a stream or river, degrades water quality
and severely harms aquatic life.
This study evaluates the trends in the long-term water quality data from ecoroofs and
conventional roofs in the Portland area. Mann Kendall trend test was used to detect the trends in
concentrations of parameters. Concentration levels of metals (copper, lead, zinc) and nutrients
(nitrogen and phosphorous) in runoff from ecoroofs were compared with the runoff from
conventional roofs using Mann Whitney U test. Results indicated elevated levels of copper and
phosphorous in ecoroof runoff. Concentrations of lead and zinc were found to be lower in ecoroof
runoff than conventional roof runoff. Monitoring of ecoroof for a longer period is recommended
for future studies to quantify the effect of roof age, thickness and composition of soil media, and
plant types on runoff.
Water Quality Analysis of Ecoroof Runoff in Portland
3
Acknowledgement
This work would not have been possible without the contributions of many. Firstly, I would
like to thank Dr. William Fish for giving me the wonderful opportunity to complete my project
under his supervision.
I would like to express my sincere gratitude towards Stormwater Management Manual Team
(SWMM) at Bureau of Environmental Service (BES), City of Portland. Special thanks to Adrienne
Aiona, Alice Coker, Ivy Dunlap, Henry Stevens, Tim Kurtz for their constant encouragement and
support. I especially express my warm thanks to Amy Simpson for her valuable time and
mentorship. Also, I am grateful to Julia Bond for sharing her knowledge and expertise throughout
this project.
I would like to thank my fellow graduate students who helped me get through two years of
graduate school, Payal Joshi, Linely Mescher, Maysoun Hameed, Corina Overman, Tel Jenson,
Amory Cervarich, Riyadh Muttaleb, and Bashar Al-Daomi. This journey could not have been more
enjoyable without them. I am also thankful to kind staff of the Department of Civil and
Environmental Engineering, Megan Falcone, Kiley Melicker, and Samantha Parsons who were
always supportive and great resource.
I am fully indebted to my loving parents and in-laws for their love, patience, and support
throughout my academic journey. I would like to thank Prachi, Sneha, Pushkarni, and Susmit for
being a great source of happiness and joy to me during challenging times.
And finally, to my husband, Prabhanjan Wagh, who has been by my side throughout my
graduate studies, living every single minute of it, and without whom, I would not have had the
courage to embark on this journey in the first place.
Water Quality Analysis of Ecoroof Runoff in Portland
4
Table of Contents
1. Introduction ................................................................................................................. 9
1.1 Green Infrastructure for Stormwater Management ................................................. 10
1.2 Ecoroof Overview and Pollution Concerns .............................................................11
1.3 Objective ................................................................................................................. 14
2. Methods......................................................................................................................... 15
2.1 Site Descriptions ..................................................................................................... 15
2.1.1 Hamilton West Apartments (HA) ..................................................................... 16
2.1.2 Marine Drive pump station (MD) .................................................................... 17
2.1.3 Portland building (PDX) .................................................................................. 18
2.1.4 The Ramona Apartments (RA) ........................................................................ 18
2.1.5 Sellwood Pump Station (SW) .......................................................................... 19
2.1.6 Walmart store (WA) ......................................................................................... 20
2.2 Data Description ..................................................................................................... 20
2.3 Data Analysis .......................................................................................................... 21
3. Results and Discussion ................................................................................................. 23
3.1 Metals ...................................................................................................................... 23
3.1.1 Copper .............................................................................................................. 24
3.1.2 Lead.................................................................................................................. 25
3.1.3 Zinc…………………………………………………………………………...27
Water Quality Analysis of Ecoroof Runoff in Portland
5
3.2 Nutrients and Solids ................................................................................................ 30
4. Conclusions and Recommendations ............................................................................. 37
References ......................................................................................................................... 39
Appendix ........................................................................................................................... 41
Water Quality Analysis of Ecoroof Runoff in Portland
6
List of Figures
Figure 1: Portland Sewer Systems, (BES, City of Portland) .......................................................... 9
Figure 2: Ecoroof cross section (BES, City of Portland.)..............................................................11
Figure 3: Ecoroof Facilities: Portland (BES, City of Portland) .................................................... 12
Figure 4: Locations of the ecoroofs used in this study ................................................................. 15
Figure 5: Hamilton ecoroof layout (BES, City of Portland) ......................................................... 17
Figure 6: Marine Drive pump station ecoroof .............................................................................. 17
Figure 7: Portland building ecoroof .............................................................................................. 18
Figure 8: Ramona Apartment ecoroof ........................................................................................... 19
Figure 9: Sellwood pump station ecoroof ..................................................................................... 19
Figure 10: Walmart store ecoroof layout ...................................................................................... 20
Figure 11: Boxplots showing total and dissolved Cu concentrations for all the sites. ................. 25
Figure 12: Boxplots showing total and dissolved Pb concentrations for all the sites ................... 27
Figure 13: Boxplots showing total and dissolved Zn concentrations for all the sites................... 29
Figure 14: Boxplots showing ammonia and nitrate concentrations for all the sites ..................... 32
Figure 15: Boxplots showing o-phosphate and total phosphorous concentrations for all the sites
....................................................................................................................................................... 33
Figure 16: Boxplots showing total suspended solids concentrations for all the sites ................... 34
Figure 17: Graphical representation of concentrations of Cu and Cu dissolved in ecoroof runoff
....................................................................................................................................................... 44
Figure 18: Graphical representation of Concentration of Pb and Pb dissolved in ecoroof runoff 45
Figure 19: Graphical representation of Concentration of Zn and Zn dissolved in ecoroof runoff 46
Water Quality Analysis of Ecoroof Runoff in Portland
7
Figure 20:Graphical representation of Concentration of Ammonia and Nitrate in ecoroof runoff
....................................................................................................................................................... 47
Figure 21: Graphical representation of Concentration of o-Phosphate and TP in ecoroof runoff 48
Water Quality Analysis of Ecoroof Runoff in Portland
8
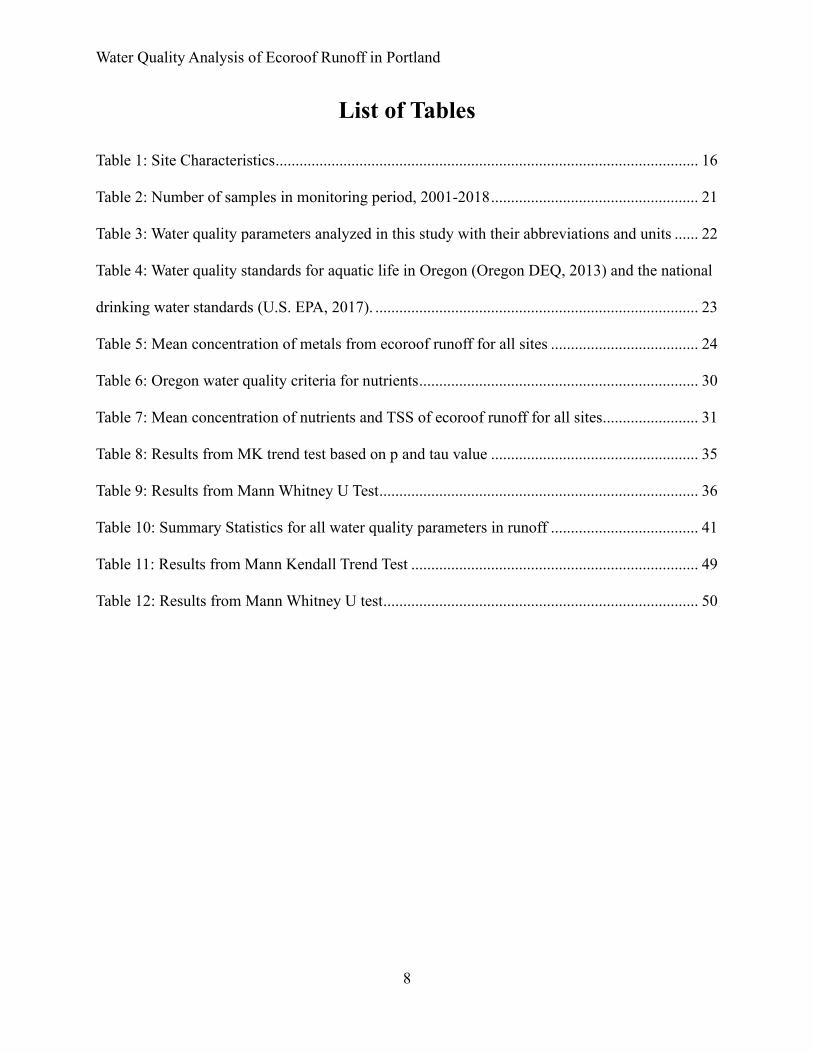
List of Tables
Table 1: Site Characteristics .......................................................................................................... 16
Table 2: Number of samples in monitoring period, 2001-2018 .................................................... 21
Table 3: Water quality parameters analyzed in this study with their abbreviations and units ...... 22
Table 4: Water quality standards for aquatic life in Oregon (Oregon DEQ, 2013) and the national
drinking water standards (U.S. EPA, 2017). ................................................................................. 23
Table 5: Mean concentration of metals from ecoroof runoff for all sites ..................................... 24
Table 6: Oregon water quality criteria for nutrients ...................................................................... 30
Table 7: Mean concentration of nutrients and TSS of ecoroof runoff for all sites........................ 31
Table 8: Results from MK trend test based on p and tau value .................................................... 35
Table 9: Results from Mann Whitney U Test ................................................................................ 36
Table 10: Summary Statistics for all water quality parameters in runoff ..................................... 41
Table 11: Results from Mann Kendall Trend Test ........................................................................ 49
Table 12: Results from Mann Whitney U test ............................................................................... 50
Water Quality Analysis of Ecoroof Runoff in Portland
9
1. Introduction
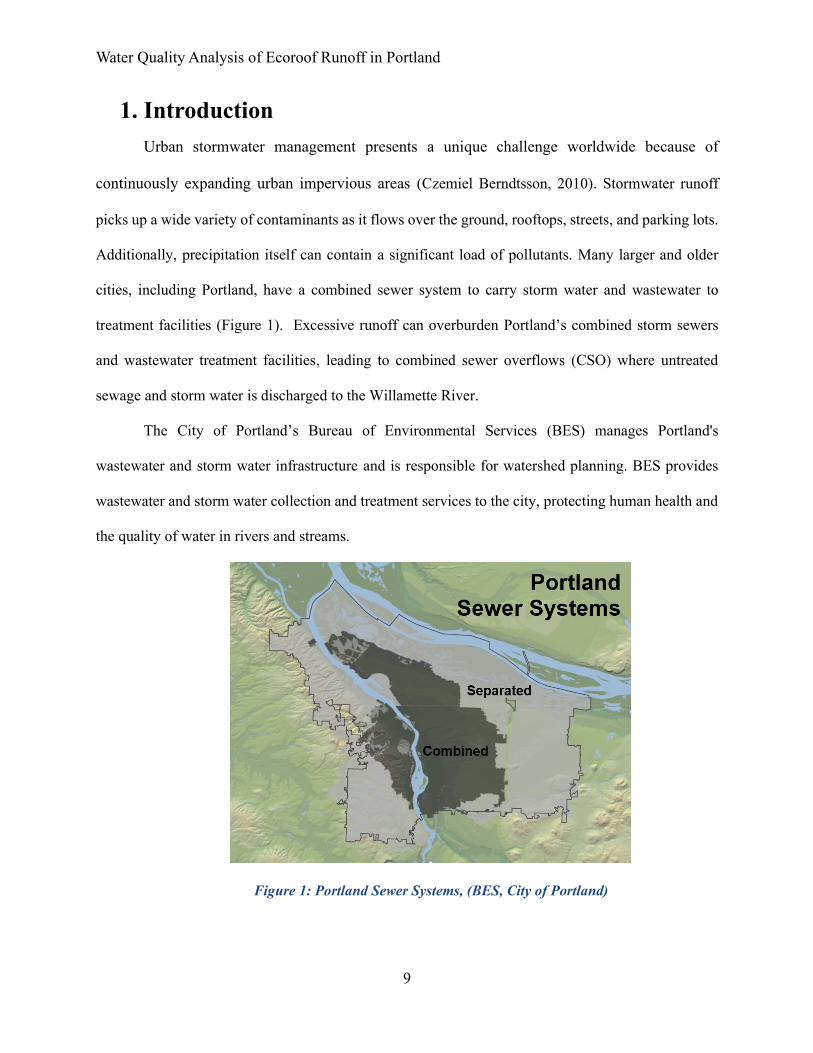
Urban stormwater management presents a unique challenge worldwide because of
continuously expanding urban impervious areas (Czemiel Berndtsson, 2010). Stormwater runoff
picks up a wide variety of contaminants as it flows over the ground, rooftops, streets, and parking lots.
Additionally, precipitation itself can contain a significant load of pollutants. Many larger and older
cities, including Portland, have a combined sewer system to carry storm water and wastewater to
treatment facilities (Figure 1). Excessive runoff can overburden Portland’s combined storm sewers
and wastewater treatment facilities, leading to combined sewer overflows (CSO) where untreated
sewage and storm water is discharged to the Willamette River.
The City of Portland’s Bureau of Environmental Services (BES) manages Portland's
wastewater and storm water infrastructure and is responsible for watershed planning. BES provides
wastewater and storm water collection and treatment services to the city, protecting human health and
the quality of water in rivers and streams.
Figure 1: Portland Sewer Systems, (BES, City of Portland)
Water Quality Analysis of Ecoroof Runoff in Portland
10
The City of Portland adopted a citywide Storm Water Management Manual (SWMM) in
1999 that includes water quality and flow control design standards for onsite storm water
management facilities. Portland’s SWMM gives priority to vegetated storm water management
systems, low-impact development practices, and maintenance and operational best management
practices (BMPs) designed to improve storm water quality.
BES monitors the performance of storm water management facilities around Portland.
Gathering performance data on storm water management facilities and long-term monitoring helps
in improving design, function, and lowering in maintenance cost.
1.1 Green Infrastructure for Stormwater Management
Portland’s average annual rainfall of 37 inches generates approximately 10 billion gallons
of storm water runoff. Green infrastructure comprises interconnected natural areas or engineered
systems that use soil and plants to control, filter, and infiltrate runoff. Green infrastructure
manages storm water runoff closer to the source by mimicking natural hydrology and provides
multiple environmental benefits.
The City of Portland is a recognized leader in green and sustainable storm water
management and promoting green infrastructure through various policies and incentive programs.
Between 2008 and 2013, BES adopted a Grey to Green initiative to boost the city’s green
infrastructure. Portland’s green infrastructure techniques are designed to address region’s small
and frequent storms. The City’s Grey to green initiative includes award-wining BMP project
designs, constructing green streets, ecoroofs, rain gardens, permeable pavements, bio-retention
cells (or bio-swales), infiltration trenches, planter boxes, rooftop (downspout) disconnection, and
urban tree canopies (BES, 2010).
Water Quality Analysis of Ecoroof Runoff in Portland
11
1.2 Ecoroof Overview and Pollution Concerns
With the increase in impervious area associated with urban development, there is a need of
more sustainable urban drainage systems for attenuating runoff. Green roofs are one such a type
of sustainable system to control urban runoff (Ferrans, Rey, Pérez, Rodríguez, & Díaz-Granados,
2018) .
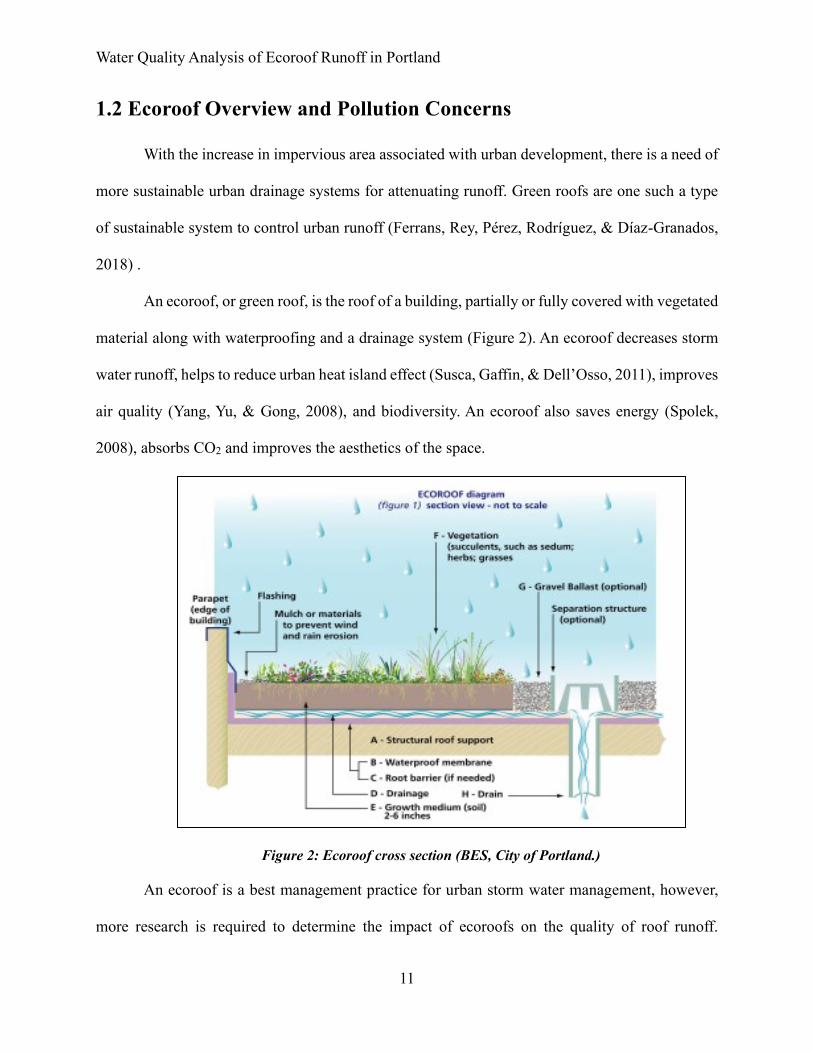
An ecoroof, or green roof, is the roof of a building, partially or fully covered with vegetated
material along with waterproofing and a drainage system (Figure 2). An ecoroof decreases storm
water runoff, helps to reduce urban heat island effect (Susca, Gaffin, & Dell’Osso, 2011), improves
air quality (Yang, Yu, & Gong, 2008), and biodiversity. An ecoroof also saves energy (Spolek,
2008), absorbs CO2 and improves the aesthetics of the space.
Figure 2: Ecoroof cross section (BES, City of Portland.)
An ecoroof is a best management practice for urban storm water management, however,
more research is required to determine the impact of ecoroofs on the quality of roof runoff.
Water Quality Analysis of Ecoroof Runoff in Portland
12
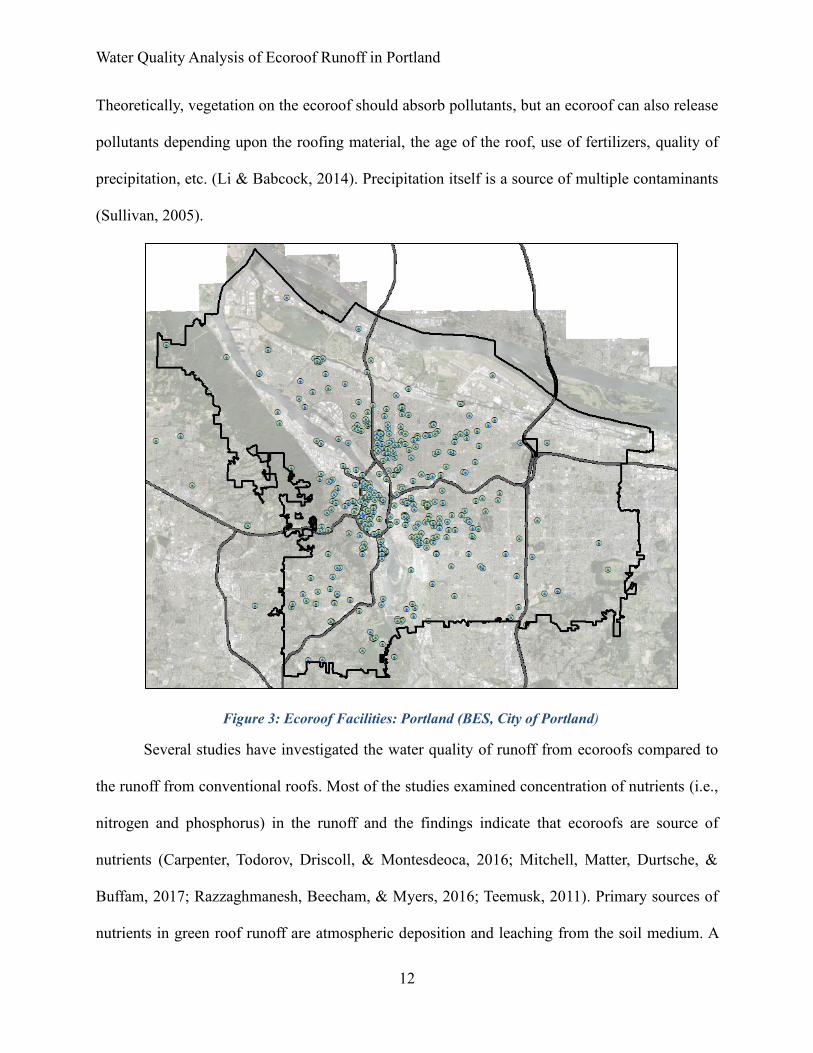
Theoretically, vegetation on the ecoroof should absorb pollutants, but an ecoroof can also release
pollutants depending upon the roofing material, the age of the roof, use of fertilizers, quality of
precipitation, etc. (Li & Babcock, 2014). Precipitation itself is a source of multiple contaminants
(Sullivan, 2005).
Figure 3: Ecoroof Facilities: Portland (BES, City of Portland)
Several studies have investigated the water quality of runoff from ecoroofs compared to
the runoff from conventional roofs. Most of the studies examined concentration of nutrients (i.e.,
nitrogen and phosphorus) in the runoff and the findings indicate that ecoroofs are source of
nutrients (Carpenter, Todorov, Driscoll, & Montesdeoca, 2016; Mitchell, Matter, Durtsche, &
Buffam, 2017; Razzaghmanesh, Beecham, & Myers, 2016; Teemusk, 2011). Primary sources of
nutrients in green roof runoff are atmospheric deposition and leaching from the soil medium. A
Water Quality Analysis of Ecoroof Runoff in Portland
13
few studies investigated metal concentration, however, and some found that runoff metal
concentrations were higher than for conventional roof (Buffam, Mitchell, & Durtsche, 2016;
Gregoire & Clausen, 2011). Elevated concentrations of heavy metals, such as Cu and Zn, in storm
water runoff can be toxic to aquatic life. Cu concentrations as low as 2 μg/L can impact aquatic
life (Sandahl et al. 2007). Elevated concentration of nutrients can lead to production of algal
blooms in the receiving water body.
A study conducted in Lahti, Finland found higher concentrations of nitrate and total
phosphorus in runoff from ecoroofs. However, bio char amendments in the growing media did
decrease total nitrogen (TN) and total phosphorus (TP) load after one year of the experiment
(Jokimaa, 2016). In a Swedish study, runoff from extensive sedum moss roofs and conventional
roofs was measured for metals and nutrients (Berndtsson, Emilsson, & Bengtsson, 2006). The
results indicated that the ecoroofs studied were a source of pollutants, with the exception of
nitrogen. A study carried out in North Carolina found that green roofs with high organic matter
(e.g., compost) served as an additional source of TN and TP (Moran, Hunt, & Jennings, 2004).
Approximately 38 acres of ecoroofs (over 560 roofs) have been installed on Portland
buildings since the 1990s (Figure 3). Monitoring of ecoroofs in Portland by BES has previously
shown that ecoroofs reduce peak flow and total runoff volumes compared to conventional roofs.
However, little is known about ecoroof impact on water quality. Limited data collected from the
City of Portland for one ecoroof has indicated that runoff from ecoroofs can have elevated
concentrations of nutrients, mostly TN and TP ( Hutchinson, et al , 2003). Cu concentrations were
significantly higher than the concentration in conventional roof runoff (City of Portland BES,
2010). The City of Portland’s Central City 2035 plan, which went into effect from July 2018,
includes a requirement that all new structures (>20,000 sq. ft) constructed within the central city
Water Quality Analysis of Ecoroof Runoff in Portland
14
boundary should have 60% ecoroof coverage (Portland, 2018). With the expectation of new
ecoroof installations, it is increasingly important to develop an improved understanding of the
water quality of ecoroof runoff.
1.3 Objective
This study seeks to evaluate the trends in the long-term water quality data from ecoroofs
in Portland area and provide recommendation for future monitoring plans. Six ecoroofs and two
conventional roofs monitored by BES were studied.
Analysis of the results for each ecoroof facility will help to identify possible sources of
contamination and will be used by BES to understand how soil media, age of the roof, and roofing
material contribute to runoff water quality.
Water Quality Analysis of Ecoroof Runoff in Portland
15
2. Methods
2.1 Site Descriptions
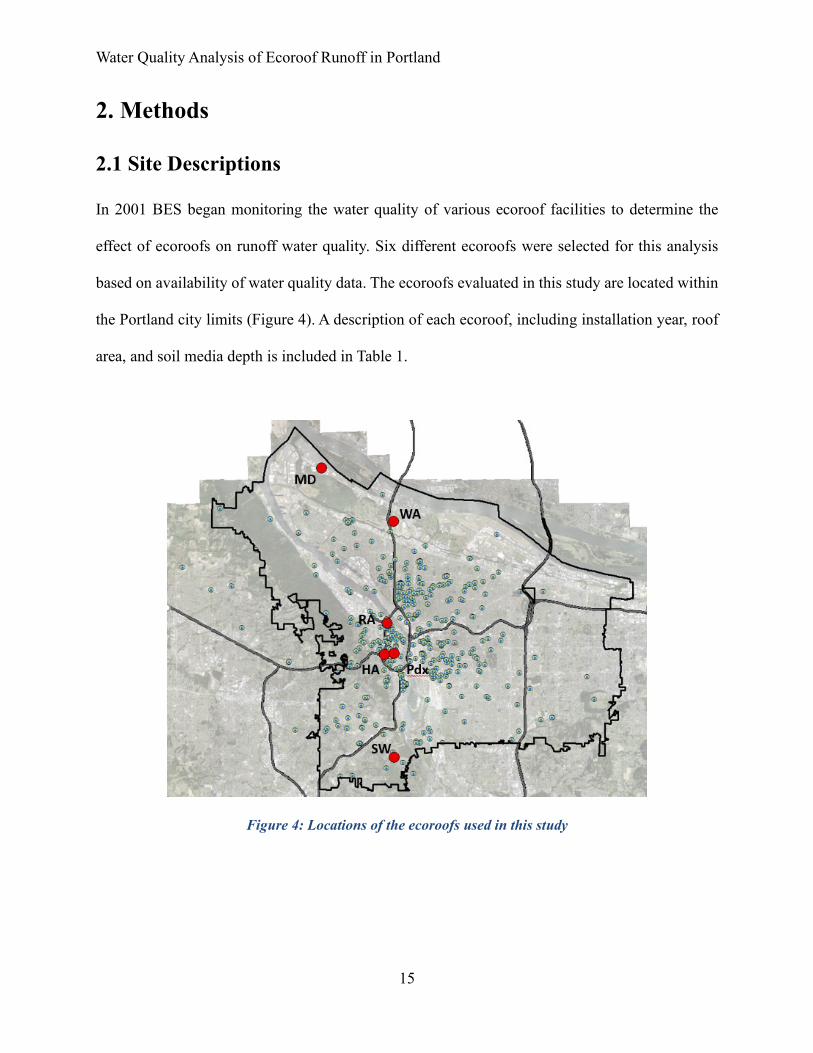
In 2001 BES began monitoring the water quality of various ecoroof facilities to determine the
effect of ecoroofs on runoff water quality. Six different ecoroofs were selected for this analysis
based on availability of water quality data. The ecoroofs evaluated in this study are located within
the Portland city limits (Figure 4). A description of each ecoroof, including installation year, roof
area, and soil media depth is included in Table 1.
Figure 4: Locations of the ecoroofs used in this study
Water Quality Analysis of Ecoroof Runoff in Portland
16
Table 1: Site Characteristics
Site Installation
year
Ecoroof
(sq. ft)
Drainage
area (sq.
ft)
Soil
Depth
(in)
Soil Media
HA
East
1999 2520 3811 3 25% encapsulated
polystyrene,15%
digested fiber,15% coir
fiber,15% perlite,15%
peat moss,15% compost
HA
West
1999 2620 3655 5 28% sandy loam, 22%
perlite, 20% digested
fiber,20% coir fiber,
10% compost
PDX 2006 16000 5250 5 Mixture of sandy loam,
pumice, compost, and
Stockosorb® polymer
MD 2012 288 ** 5 Mixture of sandy loam,
soil life compost, fiber
life compost and pumice
RA 2012 32000 ** 3.5 70% Pumice and 30%
organic materials
SW 2012 2200 ** 5 Mixture of sandy loam,
soil life compost, fiber
life compost and pumice
WA 2013 54000 12915 5 Mixture of sandy loam,
pumice, and compost 12915 3
**Exact areas not available for the blank spaces in tables
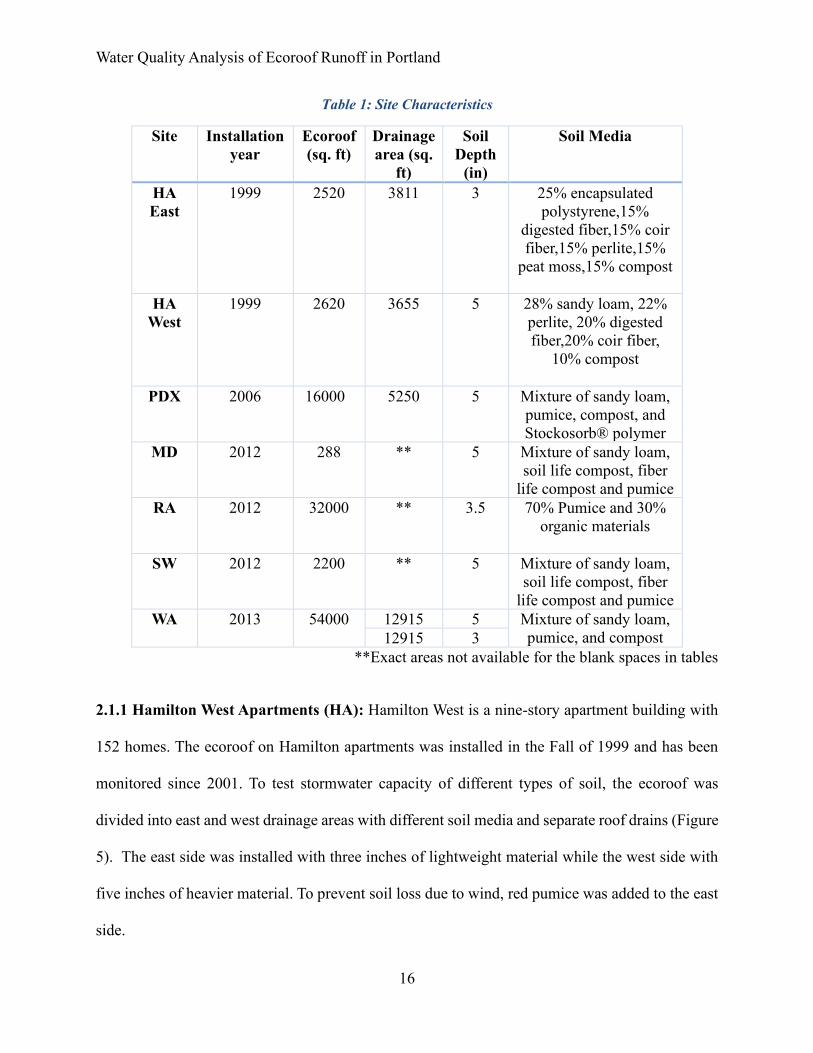
2.1.1 Hamilton West Apartments (HA): Hamilton West is a nine-story apartment building with
152 homes. The ecoroof on Hamilton apartments was installed in the Fall of 1999 and has been
monitored since 2001. To test stormwater capacity of different types of soil, the ecoroof was
divided into east and west drainage areas with different soil media and separate roof drains (Figure
5). The east side was installed with three inches of lightweight material while the west side with
five inches of heavier material. To prevent soil loss due to wind, red pumice was added to the east
side.
Water Quality Analysis of Ecoroof Runoff in Portland
17
Figure 5: Hamilton ecoroof layout (BES, City of Portland)
This ecoroof was planted with 75 species of succulents and grasses. The Hamilton ecoroof receives
precipitation and runoff from stone terrace.
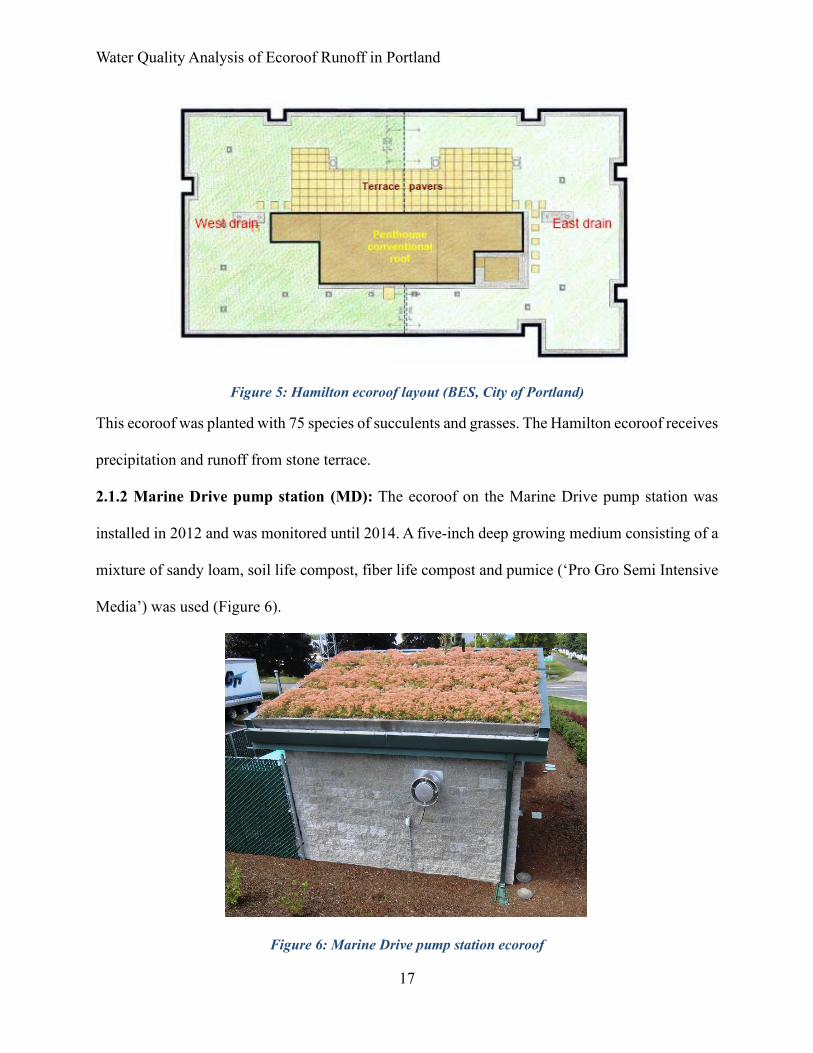
2.1.2 Marine Drive pump station (MD): The ecoroof on the Marine Drive pump station was
installed in 2012 and was monitored until 2014. A five-inch deep growing medium consisting of a
mixture of sandy loam, soil life compost, fiber life compost and pumice (‘Pro Gro Semi Intensive
Media’) was used (Figure 6).
Figure 6: Marine Drive pump station ecoroof
Water Quality Analysis of Ecoroof Runoff in Portland
18
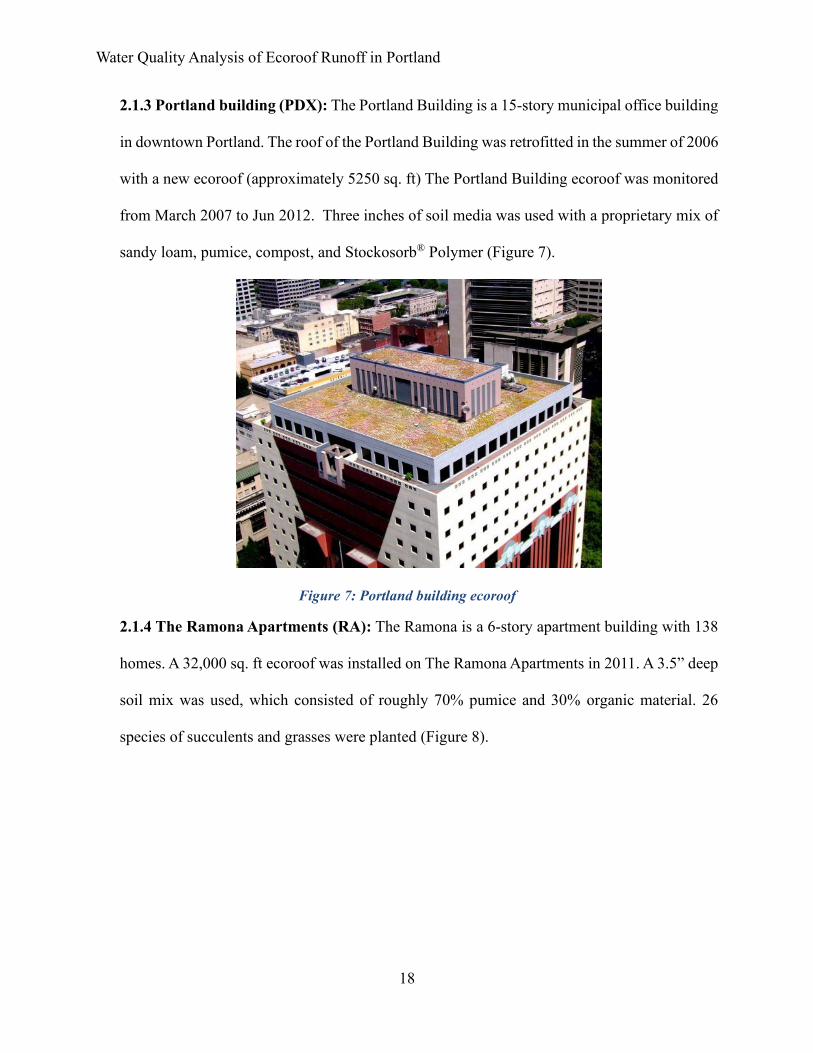
2.1.3 Portland building (PDX): The Portland Building is a 15-story municipal office building
in downtown Portland. The roof of the Portland Building was retrofitted in the summer of 2006
with a new ecoroof (approximately 5250 sq. ft) The Portland Building ecoroof was monitored
from March 2007 to Jun 2012. Three inches of soil media was used with a proprietary mix of
sandy loam, pumice, compost, and Stockosorb® Polymer (Figure 7).
Figure 7: Portland building ecoroof
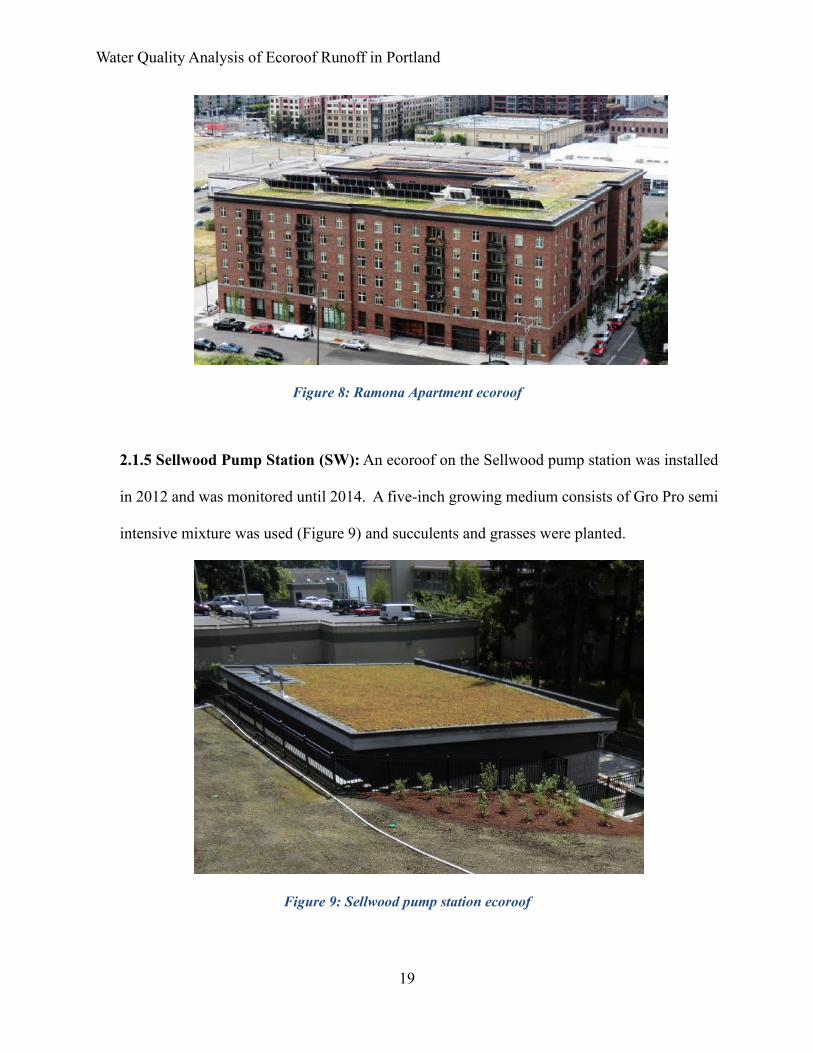
2.1.4 The Ramona Apartments (RA): The Ramona is a 6-story apartment building with 138
homes. A 32,000 sq. ft ecoroof was installed on The Ramona Apartments in 2011. A 3.5” deep
soil mix was used, which consisted of roughly 70% pumice and 30% organic material. 26
species of succulents and grasses were planted (Figure 8).
Water Quality Analysis of Ecoroof Runoff in Portland
19
Figure 8: Ramona Apartment ecoroof
2.1.5 Sellwood Pump Station (SW): An ecoroof on the Sellwood pump station was installed
in 2012 and was monitored until 2014. A five-inch growing medium consists of Gro Pro semi
intensive mixture was used (Figure 9) and succulents and grasses were planted.
Figure 9: Sellwood pump station ecoroof
Water Quality Analysis of Ecoroof Runoff in Portland
20
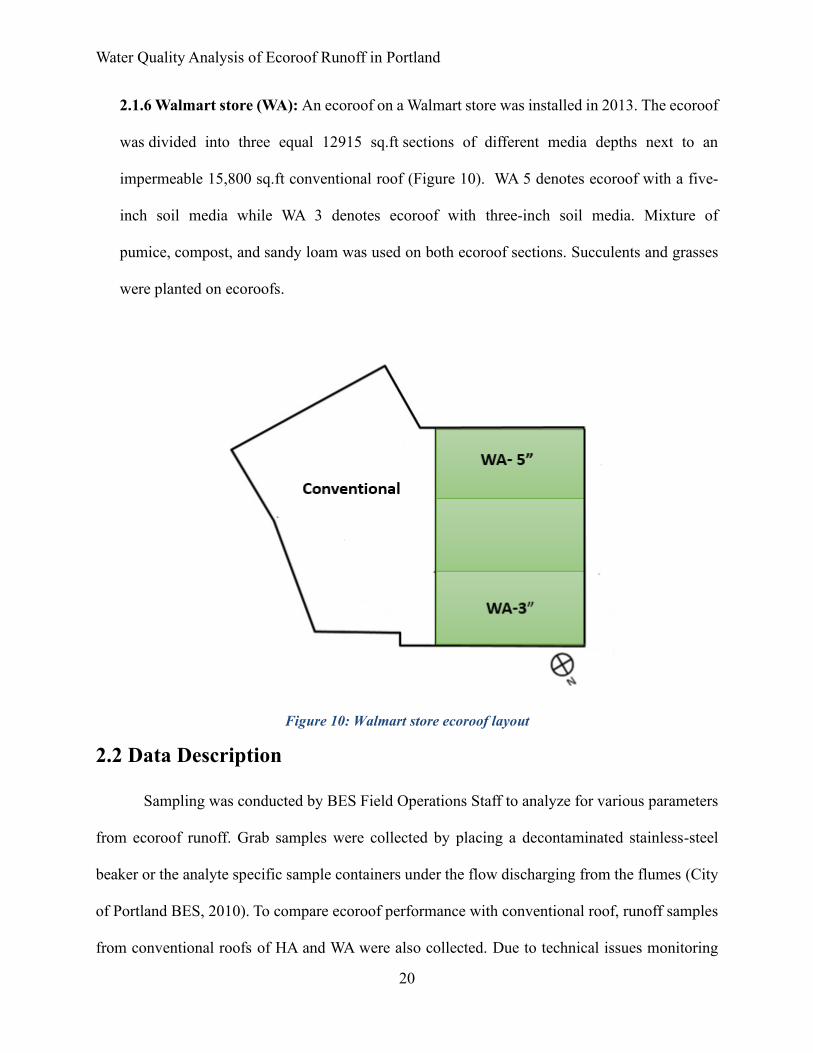
2.1.6 Walmart store (WA): An ecoroof on a Walmart store was installed in 2013. The ecoroof
was divided into three equal 12915 sq.ft sections of different media depths next to an
impermeable 15,800 sq.ft conventional roof (Figure 10). WA 5 denotes ecoroof with a five-
inch soil media while WA 3 denotes ecoroof with three-inch soil media. Mixture of
pumice, compost, and sandy loam was used on both ecoroof sections. Succulents and grasses
were planted on ecoroofs.
Figure 10: Walmart store ecoroof layout
2.2 Data Description
Sampling was conducted by BES Field Operations Staff to analyze for various parameters
from ecoroof runoff. Grab samples were collected by placing a decontaminated stainless-steel
beaker or the analyte specific sample containers under the flow discharging from the flumes (City
of Portland BES, 2010). To compare ecoroof performance with conventional roof, runoff samples
from conventional roofs of HA and WA were also collected. Due to technical issues monitoring
Water Quality Analysis of Ecoroof Runoff in Portland
21
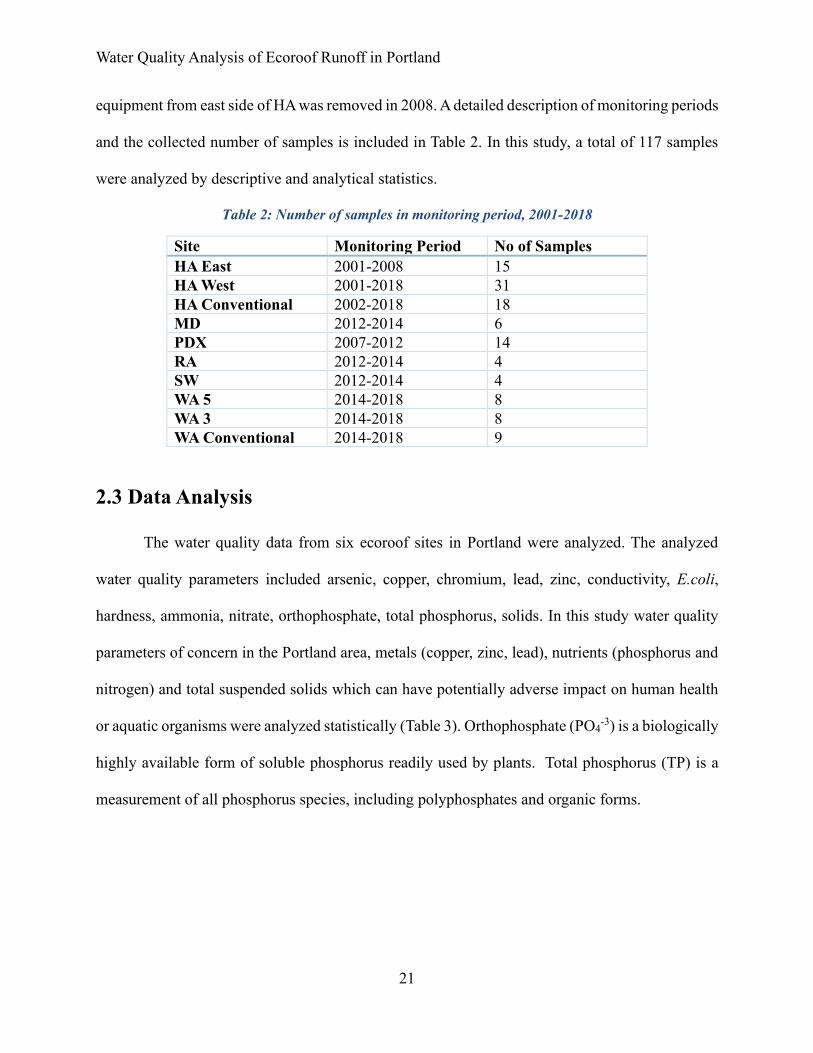
equipment from east side of HA was removed in 2008. A detailed description of monitoring periods
and the collected number of samples is included in Table 2. In this study, a total of 117 samples
were analyzed by descriptive and analytical statistics.
Table 2: Number of samples in monitoring period, 2001-2018
Site Monitoring Period No of Samples
HA East 2001-2008 15
HA West 2001-2018 31
HA Conventional 2002-2018 18
MD 2012-2014 6
PDX 2007-2012 14
RA 2012-2014 4
SW 2012-2014 4
WA 5 2014-2018 8
WA 3 2014-2018 8
WA Conventional 2014-2018 9
2.3 Data Analysis
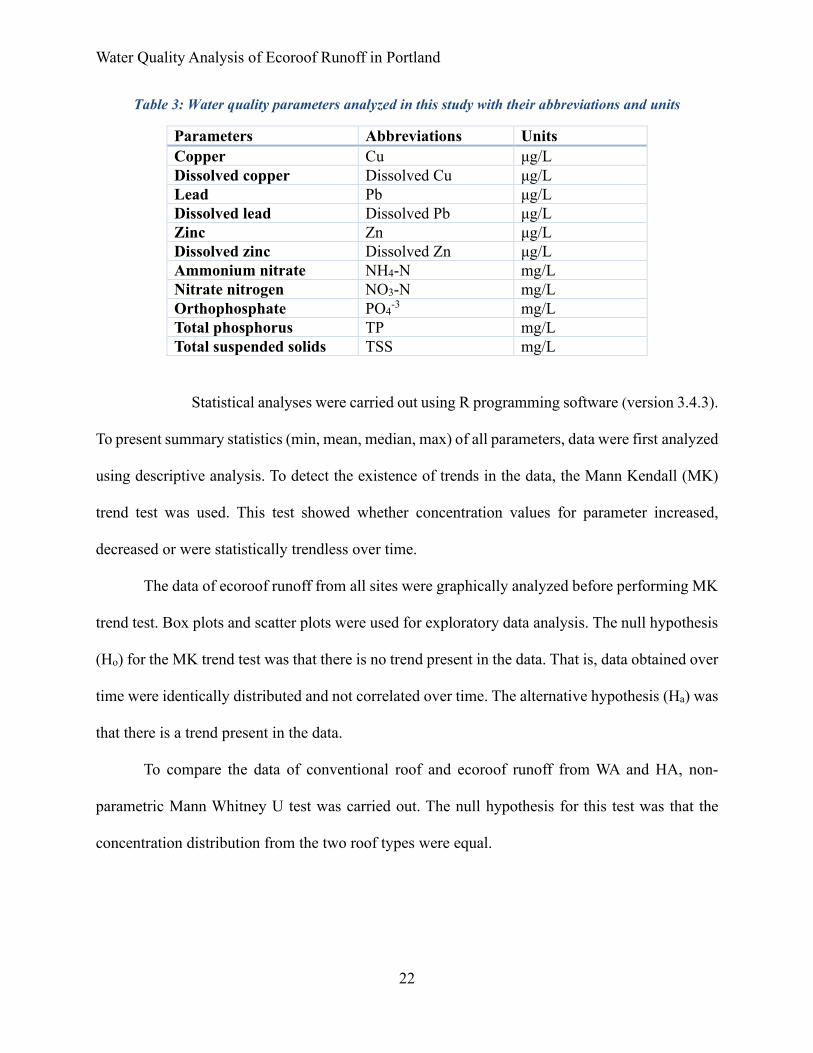
The water quality data from six ecoroof sites in Portland were analyzed. The analyzed
water quality parameters included arsenic, copper, chromium, lead, zinc, conductivity, E.coli,
hardness, ammonia, nitrate, orthophosphate, total phosphorus, solids. In this study water quality
parameters of concern in the Portland area, metals (copper, zinc, lead), nutrients (phosphorus and
nitrogen) and total suspended solids which can have potentially adverse impact on human health
or aquatic organisms were analyzed statistically (Table 3). Orthophosphate (PO4-3) is a biologically
highly available form of soluble phosphorus readily used by plants. Total phosphorus (TP) is a
measurement of all phosphorus species, including polyphosphates and organic forms.
Water Quality Analysis of Ecoroof Runoff in Portland
22
Table 3: Water quality parameters analyzed in this study with their abbreviations and units
Parameters Abbreviations Units
Copper Cu μg/L
Dissolved copper Dissolved Cu μg/L
Lead Pb μg/L
Dissolved lead Dissolved Pb μg/L
Zinc Zn μg/L
Dissolved zinc Dissolved Zn μg/L
Ammonium nitrate NH4-N mg/L
Nitrate nitrogen NO3-N mg/L
Orthophosphate PO4-3 mg/L
Total phosphorus TP mg/L
Total suspended solids TSS mg/L
Statistical analyses were carried out using R programming software (version 3.4.3).
To present summary statistics (min, mean, median, max) of all parameters, data were first analyzed
using descriptive analysis. To detect the existence of trends in the data, the Mann Kendall (MK)
trend test was used. This test showed whether concentration values for parameter increased,
decreased or were statistically trendless over time.
The data of ecoroof runoff from all sites were graphically analyzed before performing MK
trend test. Box plots and scatter plots were used for exploratory data analysis. The null hypothesis
(Ho) for the MK trend test was that there is no trend present in the data. That is, data obtained over
time were identically distributed and not correlated over time. The alternative hypothesis (Ha) was
that there is a trend present in the data.
To compare the data of conventional roof and ecoroof runoff from WA and HA, non-
parametric Mann Whitney U test was carried out. The null hypothesis for this test was that the
concentration distribution from the two roof types were equal.
Water Quality Analysis of Ecoroof Runoff in Portland
23
3. Results and Discussion
A statistical summary of the concentrations of all parameters from ecoroof runoff are
presented in the Appendix (Table 10). Graphical results for the concentrations over time for the
studied parameters are included in the appendix (Figure 17- Figure 20). Results from Mann
Kendall trend test and Mann Whitney U test are included in Table 8 and Table 9 respectively.
3.1 Metals
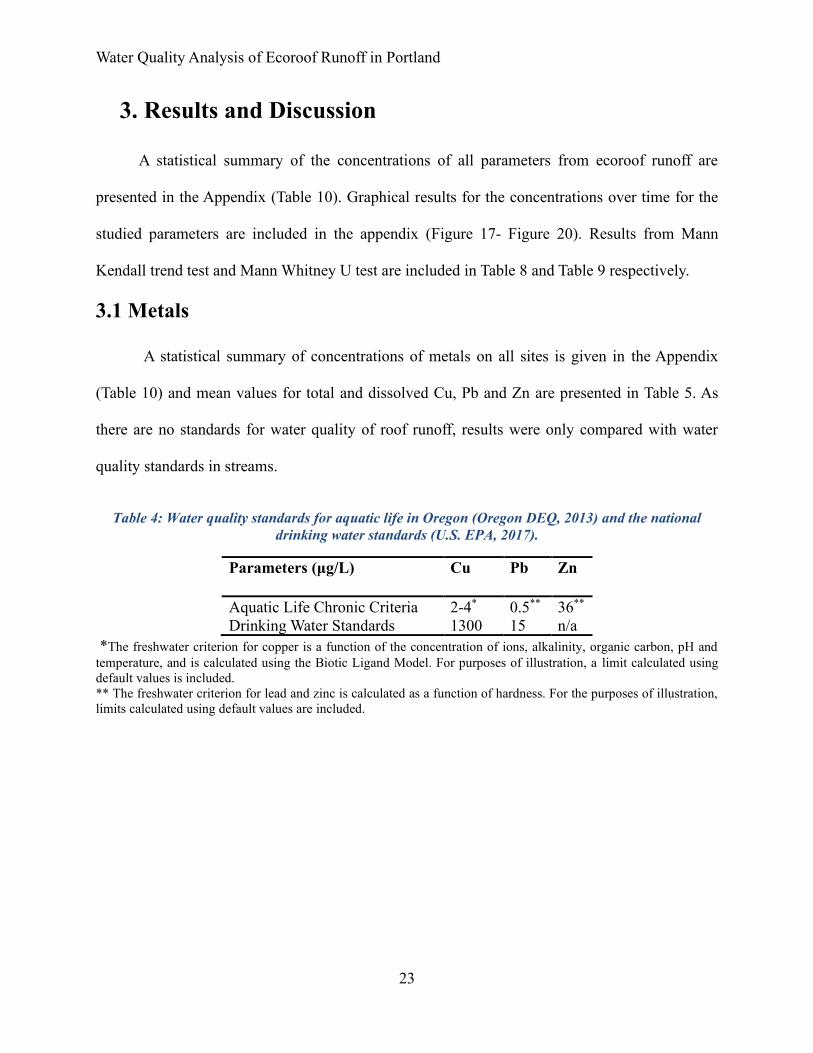
A statistical summary of concentrations of metals on all sites is given in the Appendix
(Table 10) and mean values for total and dissolved Cu, Pb and Zn are presented in Table 5. As
there are no standards for water quality of roof runoff, results were only compared with water
quality standards in streams.
Table 4: Water quality standards for aquatic life in Oregon (Oregon DEQ, 2013) and the national
drinking water standards (U.S. EPA, 2017).
Parameters (μg/L) Cu Pb Zn
Aquatic Life Chronic Criteria 2-4* 0.5** 36**
Drinking Water Standards 1300 15 n/a
*The freshwater criterion for copper is a function of the concentration of ions, alkalinity, organic carbon, pH and
temperature, and is calculated using the Biotic Ligand Model. For purposes of illustration, a limit calculated using
default values is included.
** The freshwater criterion for lead and zinc is calculated as a function of hardness. For the purposes of illustration,
limits calculated using default values are included.
Water Quality Analysis of Ecoroof Runoff in Portland
24
Table 5: Mean concentration of metals from ecoroof runoff for all sites
Parameters
(μg/L)
Sites
HA
East
HA
West
HA
Conv
MD PDX RA SW WA
5
WA
3
WA
Conv
Cu 8.98
11.80
2.6
18.93
11.4
10.31
7.7
5.93 6.02
1.34
Dissolved Cu 7.28
10.35 1.9
16.16
10.07 9.38
7.6
5.55
5.59
0.45
Pb 2.86
0.45
0.35
0.22
2.09
0.16
0.1 0.19
0.16
0.21
Dissolved Pb 1.28
0.44
0.10 0.17 0.65
0.1
0.1 0.10
0.1
0.1
Zn 55.85
20.7
335.2
62.6
17.99
7.24
191 19.5
19.0
40.9
Dissolved Zn 49.8
17.7
305.9
56.32
15.57
5.21
17.1 16.9
15.8
35.1
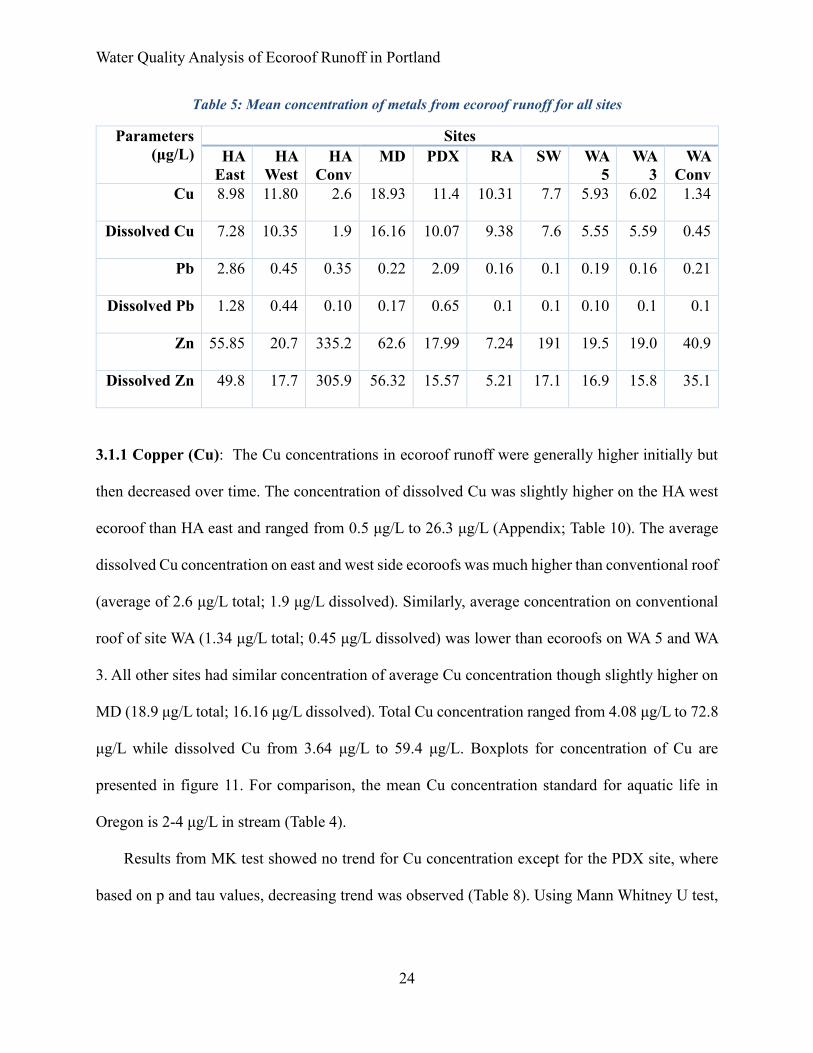
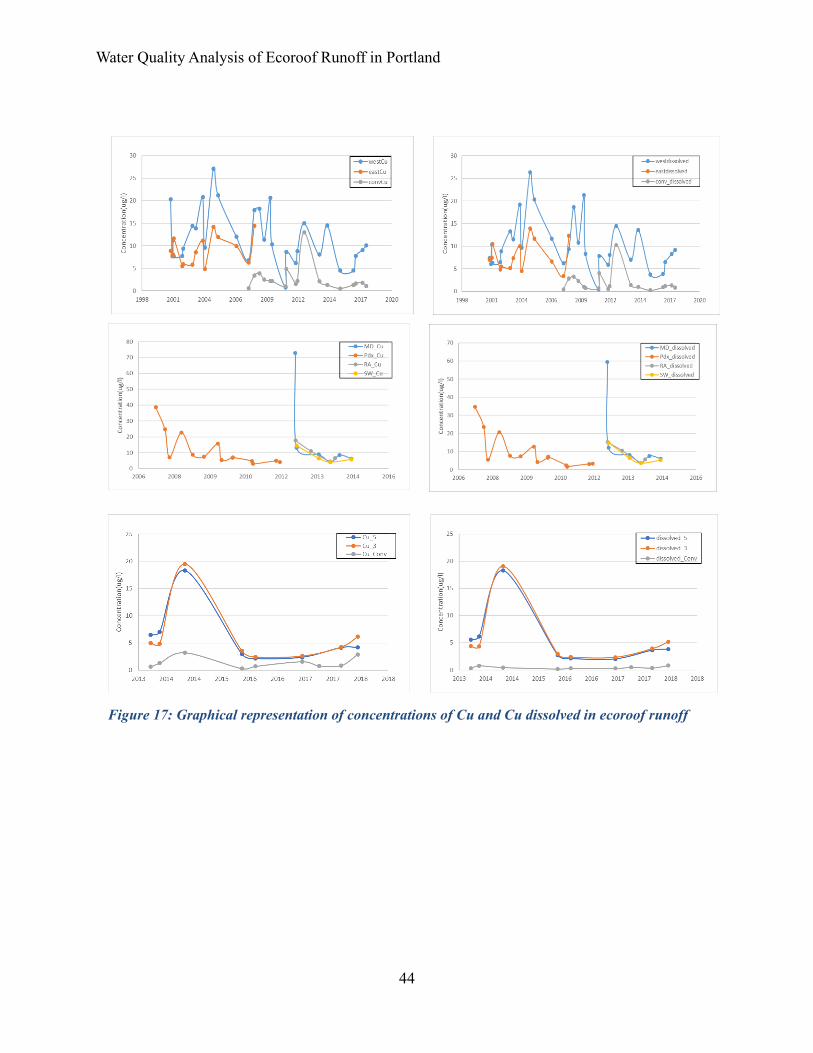
3.1.1 Copper (Cu): The Cu concentrations in ecoroof runoff were generally higher initially but
then decreased over time. The concentration of dissolved Cu was slightly higher on the HA west
ecoroof than HA east and ranged from 0.5 μg/L to 26.3 μg/L (Appendix; Table 10). The average
dissolved Cu concentration on east and west side ecoroofs was much higher than conventional roof
(average of 2.6 μg/L total; 1.9 μg/L dissolved). Similarly, average concentration on conventional
roof of site WA (1.34 μg/L total; 0.45 μg/L dissolved) was lower than ecoroofs on WA 5 and WA
3. All other sites had similar concentration of average Cu concentration though slightly higher on
MD (18.9 μg/L total; 16.16 μg/L dissolved). Total Cu concentration ranged from 4.08 μg/L to 72.8
μg/L while dissolved Cu from 3.64 μg/L to 59.4 μg/L. Boxplots for concentration of Cu are
presented in figure 11. For comparison, the mean Cu concentration standard for aquatic life in
Oregon is 2-4 μg/L in stream (Table 4).
Results from MK test showed no trend for Cu concentration except for the PDX site, where
based on p and tau values, decreasing trend was observed (Table 8). Using Mann Whitney U test,
Water Quality Analysis of Ecoroof Runoff in Portland
25
significant differences were found in Cu concentrations at conventional roof and ecoroofs sites (p
value < 0.05) on both HA and WA site (Table 9).
Graphical representation for HA showed variable concentration of Cu however, all other
sites showed downward trend of concentration over time (Appendix; Figure 17).
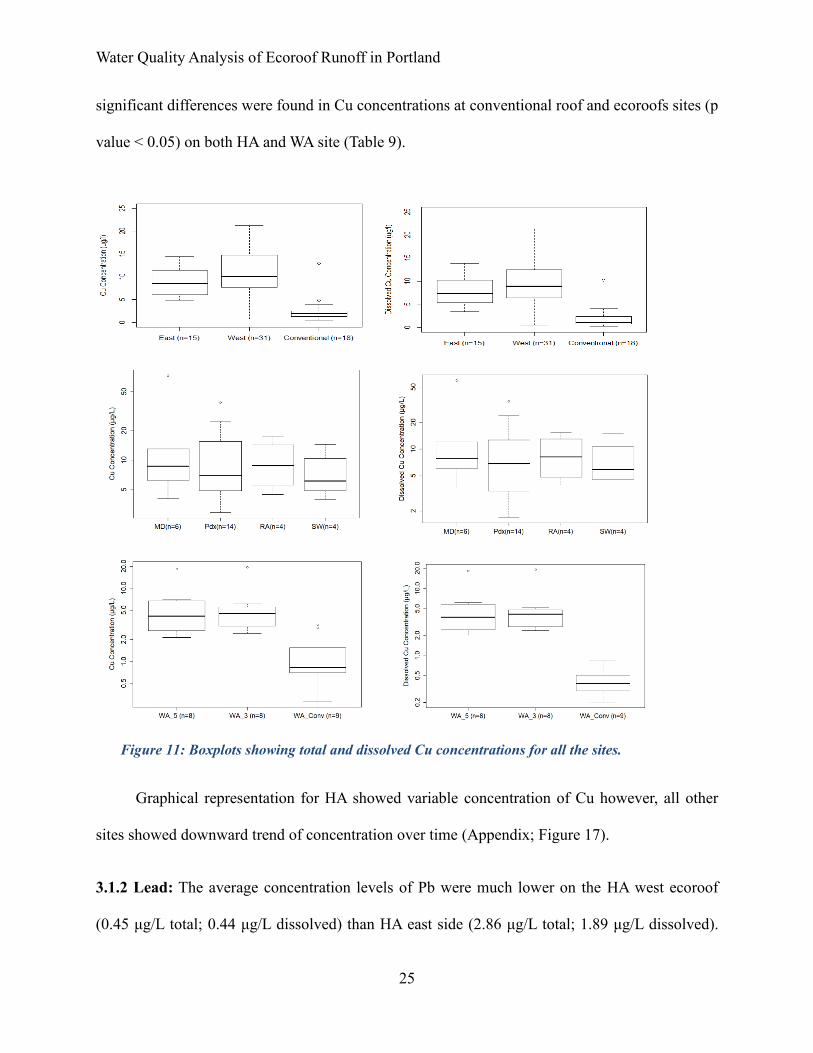
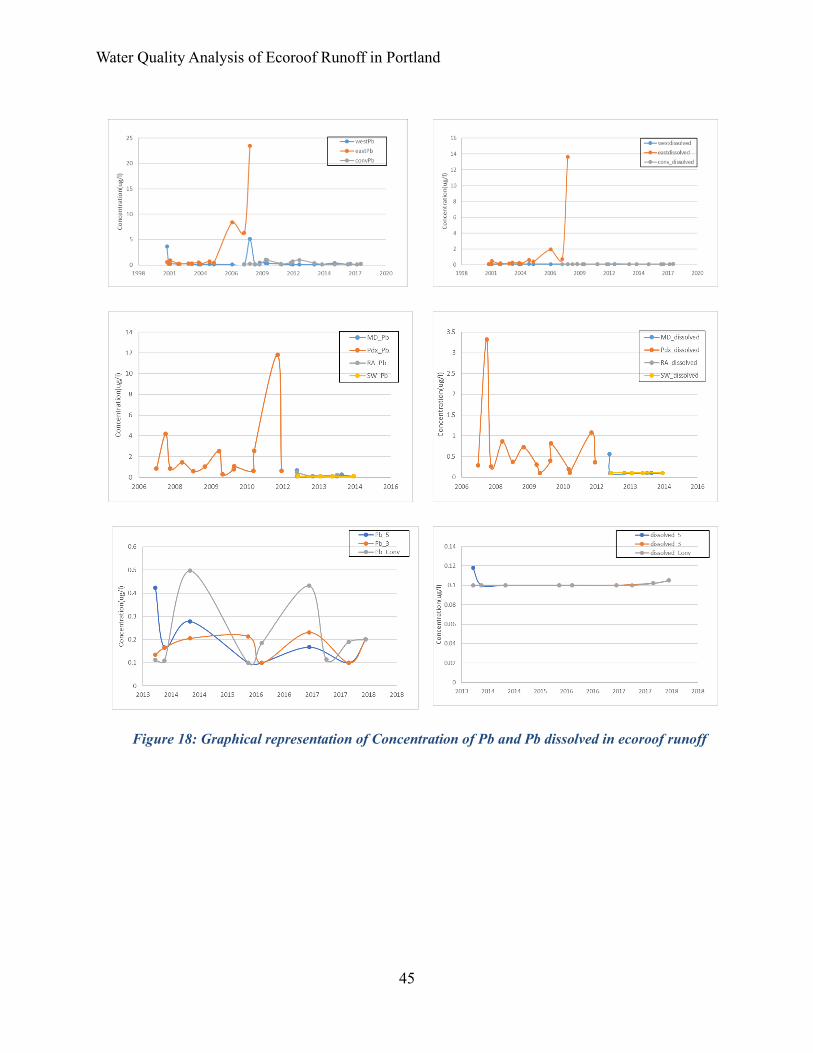
3.1.2 Lead: The average concentration levels of Pb were much lower on the HA west ecoroof
(0.45 μg/L total; 0.44 μg/L dissolved) than HA east side (2.86 μg/L total; 1.89 μg/L dissolved).
Figure 11: Boxplots showing total and dissolved Cu concentrations for all the sites.
Water Quality Analysis of Ecoroof Runoff in Portland
26
Total Pb concentration on HA east ranged from 0.16 μg/L to 23.5 μg/L and that of HA west from
0.1 μg/L to 5.12 μg/L. Maximum dissolved Pb concentration on HA east was 13.6 μg/L versus
1.02 μg/L in HA west. The east side media contains higher amount of Pb than media on west side
which could be the source of higher concentration of Pb on east side. The concentration levels on
both HA west and HA east ecoroof were higher than a conventional roof. All other sites including
WA showed lower concentration of Pb (ranged from 0.1 μg/L to 0.6 μg/L) except on PDX where
average total Pb concentration was slightly higher (2.09 μg/L). Boxplots for the concentration of
Pb are presented in figure 12. Thus, mean Pb concentration was higher than Oregon water quality
standards for aquatic life in stream for HA east and PDX sites (Table 4). Results from all other
sites indicated Pb concentration below that water quality benchmark.
Results from MK test showed a decreasing concentration trend on HA west site but
increasing trend on HA east and WA 3 (Table 8). HA east and WA3 both ecoroofs have soil media
depth of 3 inches. No trend detected on other remaining sites. Results from Mann Whitney U test
showed significant difference in only HA east and HA conventional roof (Table 9).
Water Quality Analysis of Ecoroof Runoff in Portland
27
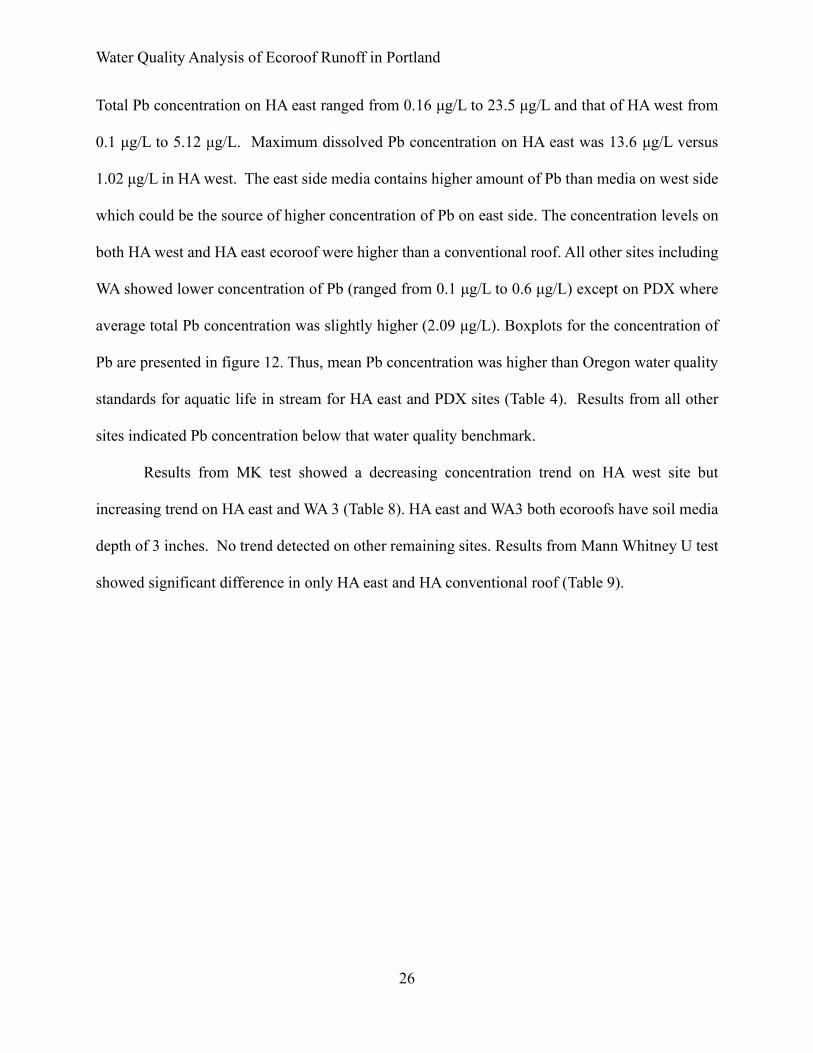
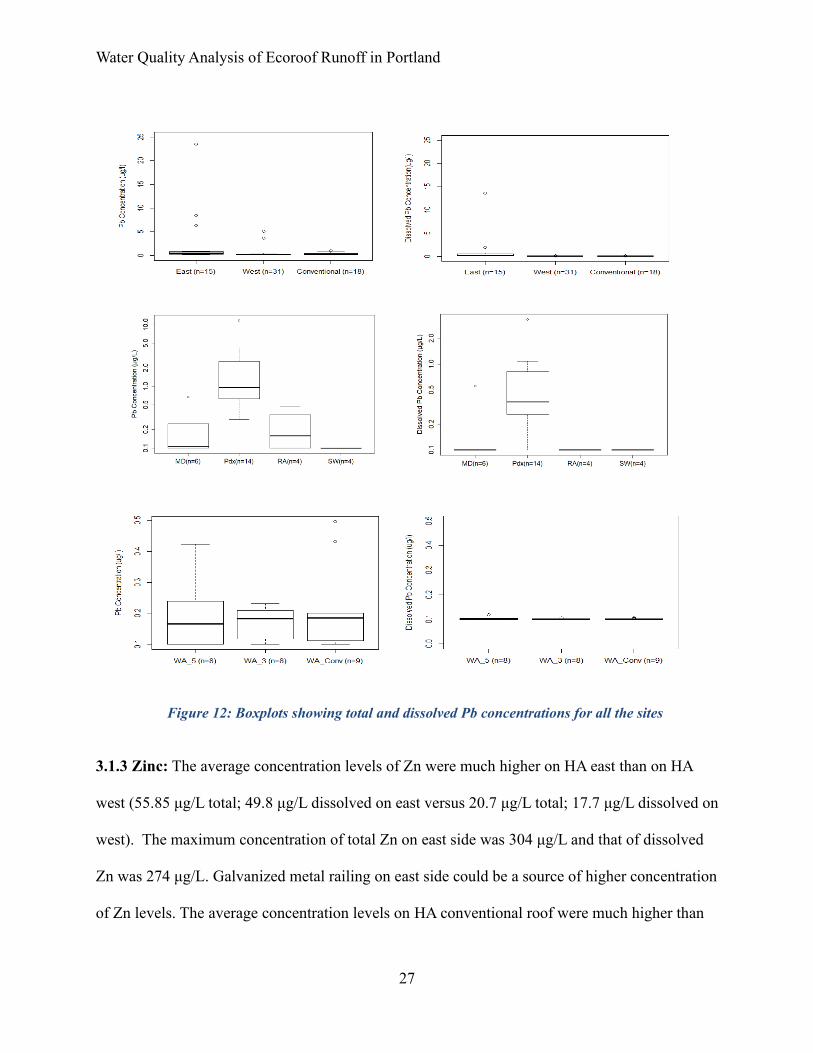
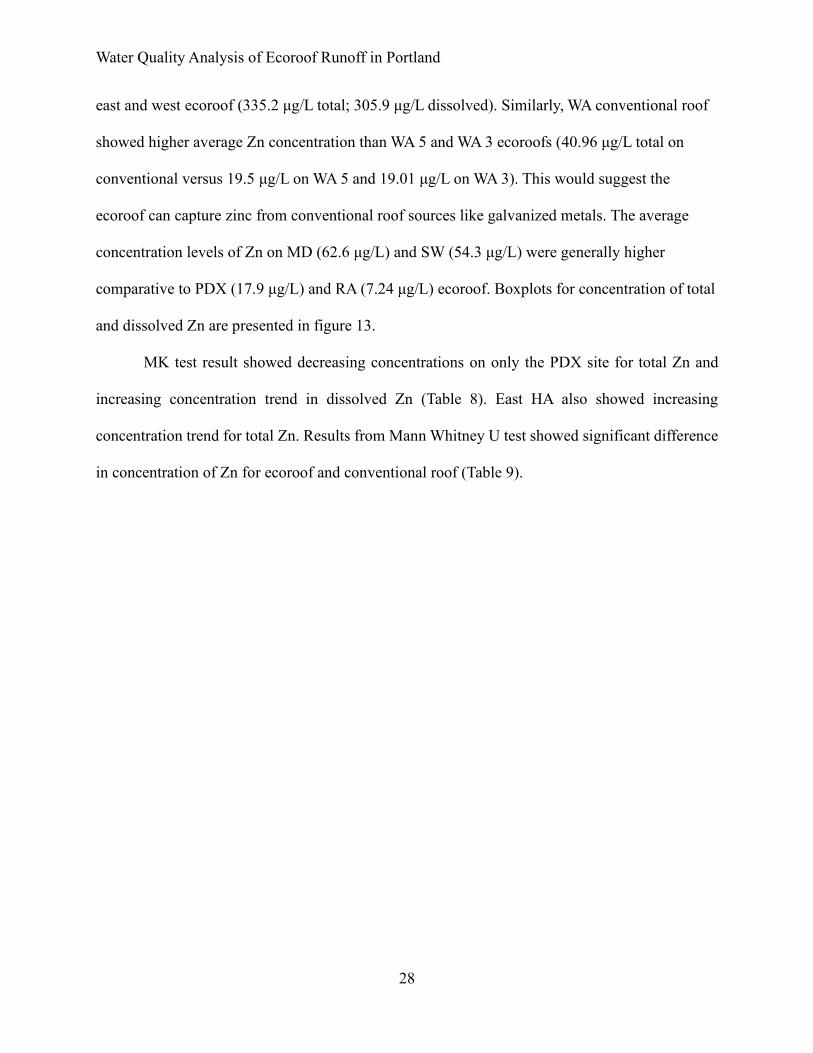
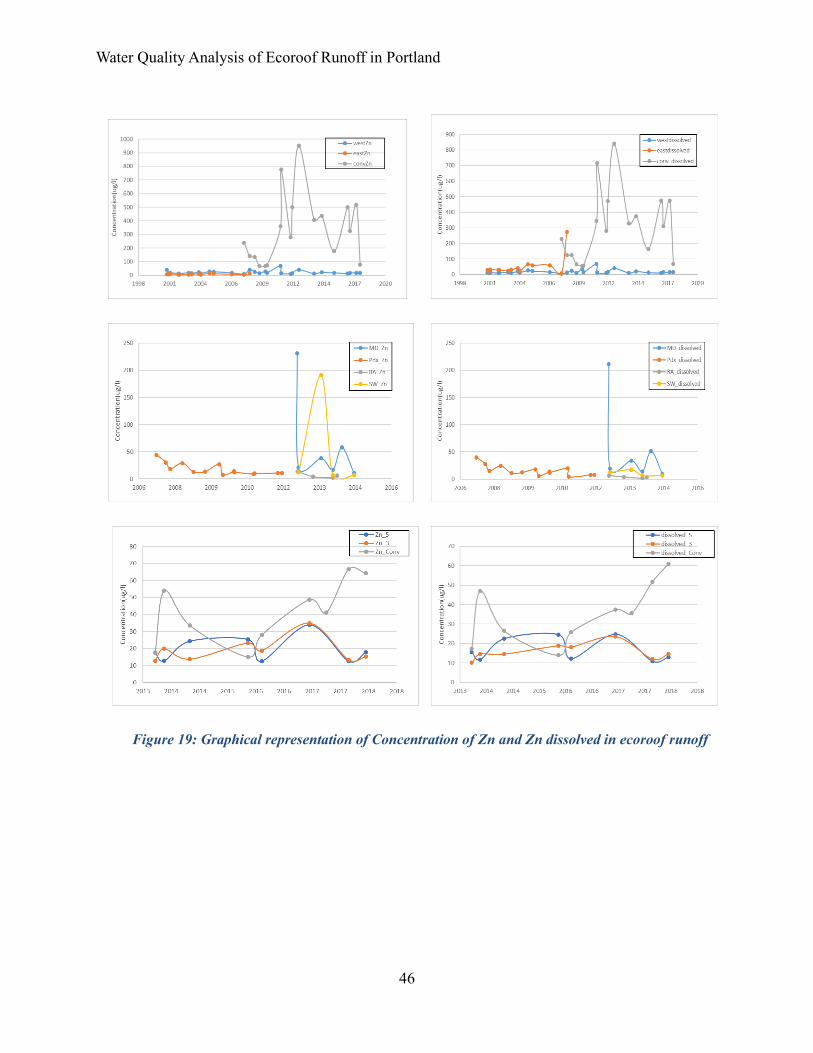
3.1.3 Zinc: The average concentration levels of Zn were much higher on HA east than on HA
west (55.85 μg/L total; 49.8 μg/L dissolved on east versus 20.7 μg/L total; 17.7 μg/L dissolved on
west). The maximum concentration of total Zn on east side was 304 μg/L and that of dissolved
Zn was 274 μg/L. Galvanized metal railing on east side could be a source of higher concentration
of Zn levels. The average concentration levels on HA conventional roof were much higher than
Figure 12: Boxplots showing total and dissolved Pb concentrations for all the sites
Water Quality Analysis of Ecoroof Runoff in Portland
28
east and west ecoroof (335.2 μg/L total; 305.9 μg/L dissolved). Similarly, WA conventional roof
showed higher average Zn concentration than WA 5 and WA 3 ecoroofs (40.96 μg/L total on
conventional versus 19.5 μg/L on WA 5 and 19.01 μg/L on WA 3). This would suggest the
ecoroof can capture zinc from conventional roof sources like galvanized metals. The average
concentration levels of Zn on MD (62.6 μg/L) and SW (54.3 μg/L) were generally higher
comparative to PDX (17.9 μg/L) and RA (7.24 μg/L) ecoroof. Boxplots for concentration of total
and dissolved Zn are presented in figure 13.
MK test result showed decreasing concentrations on only the PDX site for total Zn and
increasing concentration trend in dissolved Zn (Table 8). East HA also showed increasing
concentration trend for total Zn. Results from Mann Whitney U test showed significant difference
in concentration of Zn for ecoroof and conventional roof (Table 9).
Water Quality Analysis of Ecoroof Runoff in Portland
29
However, because of limited number of samples and scatter of data points, statistical trend
tests did not provide satisfactory results, and graphical results showed downward trends in
concentrations of metals over time (Appendix; Table 10).
Figure 13: Boxplots showing total and dissolved Zn concentrations for all the sites
Water Quality Analysis of Ecoroof Runoff in Portland
30
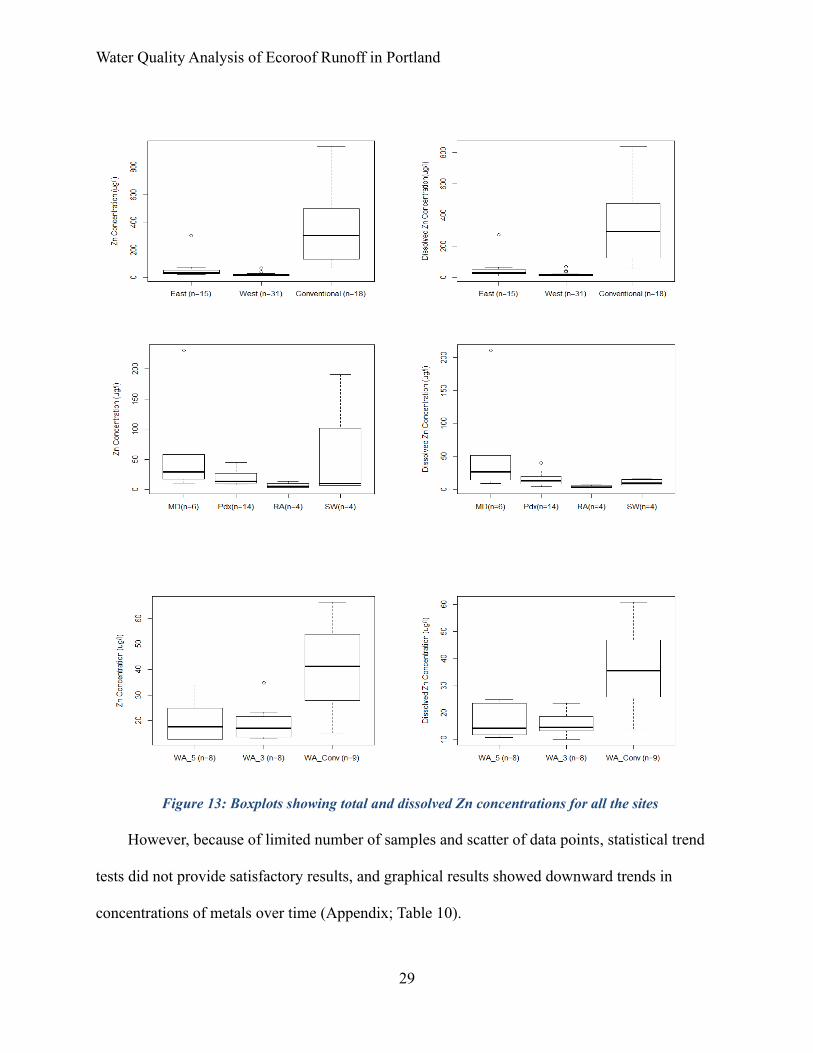
3.2 Nutrients and Solids
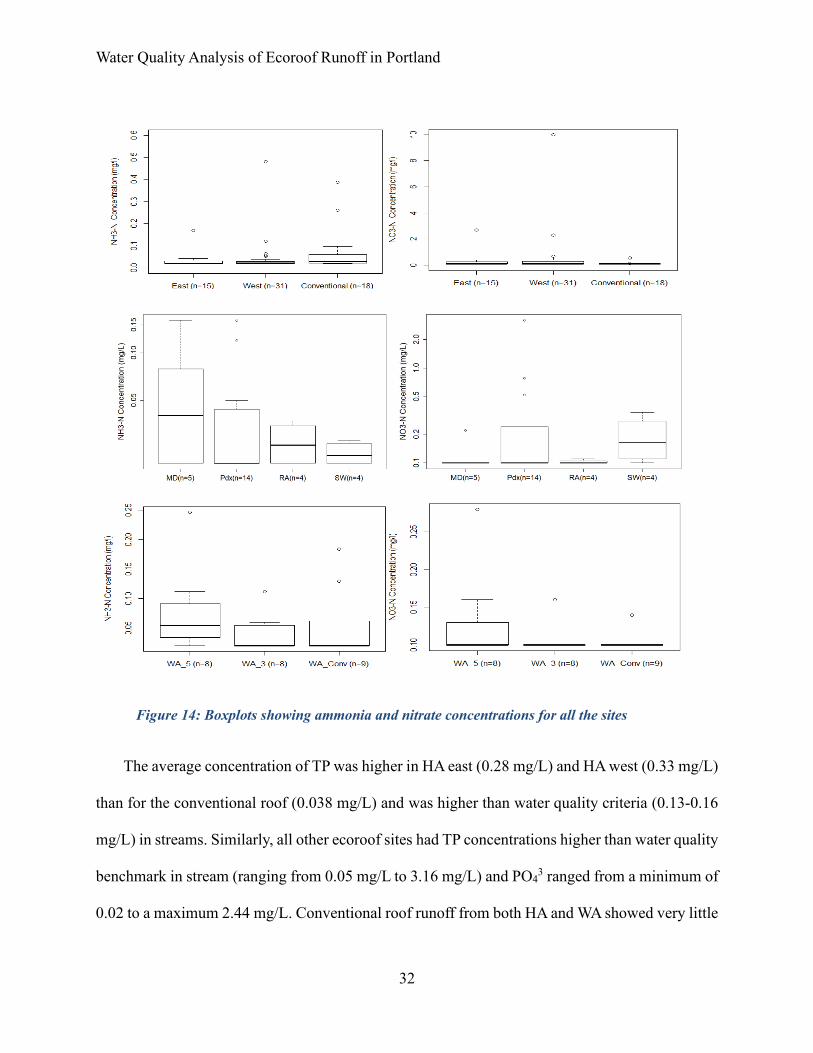
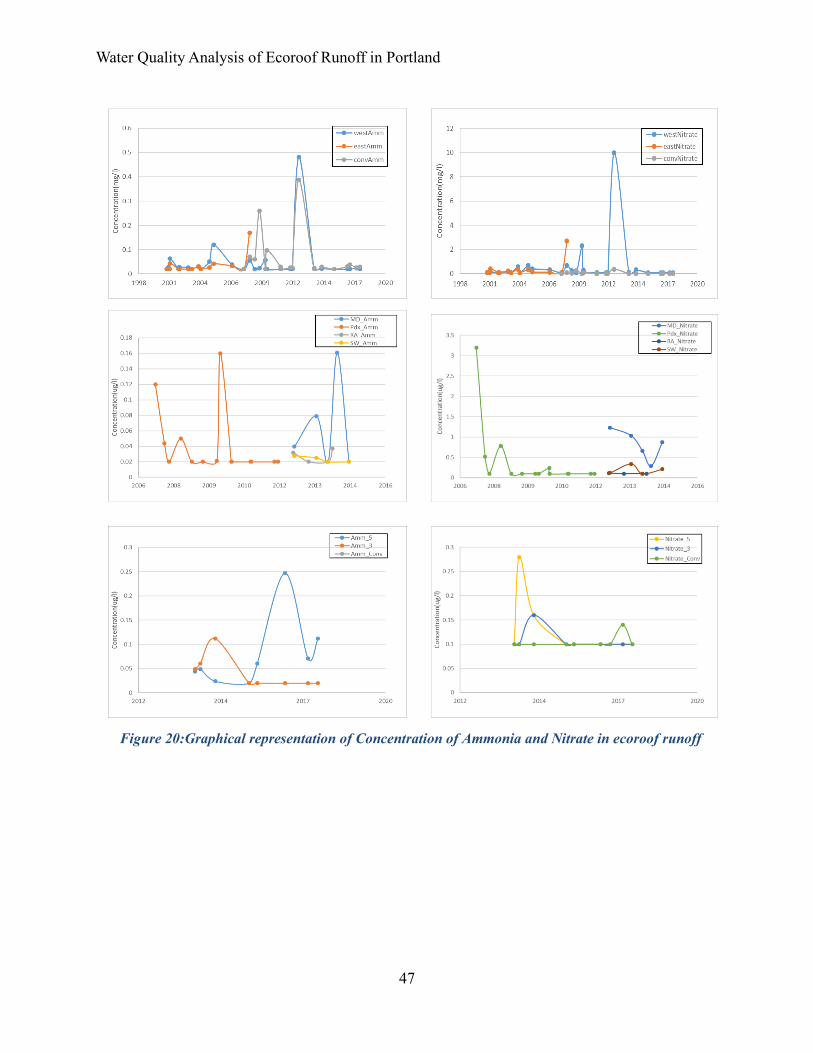
The concentrations of ammonia on all ecoroofs were relatively constant and much lower in
concentration than water quality criteria levels. Boxplots for concentration of ammonia and nitrate
are presented in Figure 14.
The average concentration of nitrate on HA west (0.58 mg/L) was higher than HA east (0.34
mg/L) and the conventional roof (0.131 mg/L). The maximum nitrate concentration on HA west
was 10 mg/L and that of conventional roof was 0.57 mg/L. All sites showed similar levels of nitrate
concentration, ranging from 0.1 mg/L to 0.3 mg/L, except PDX, where the maximum concentration
was 3.2 mg/L. However, average nitrate concentrations on all ecoroof as well as conventional roof
sites were well below the water quality benchmark for streams.
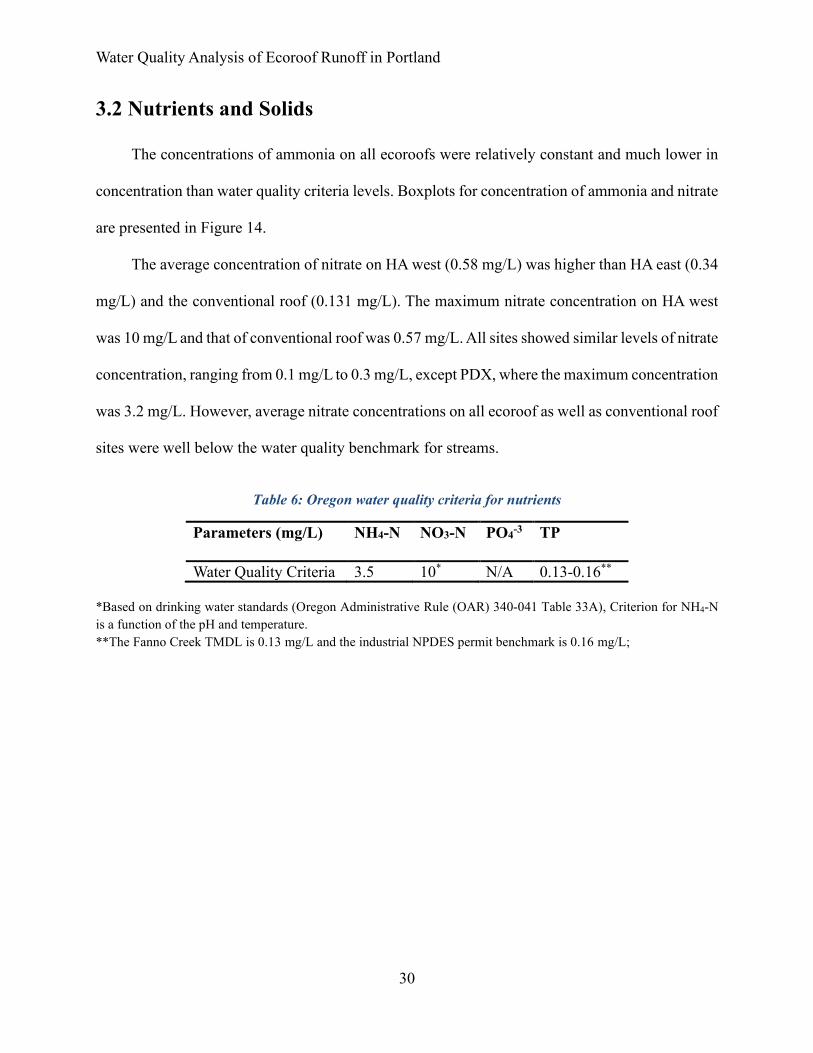
Table 6: Oregon water quality criteria for nutrients
Parameters (mg/L) NH4-N NO3-N PO4-3 TP
Water Quality Criteria 3.5 10* N/A 0.13-0.16**
*Based on drinking water standards (Oregon Administrative Rule (OAR) 340-041 Table 33A), Criterion for NH4-N
is a function of the pH and temperature.
**The Fanno Creek TMDL is 0.13 mg/L and the industrial NPDES permit benchmark is 0.16 mg/L;
Water Quality Analysis of Ecoroof Runoff in Portland
31
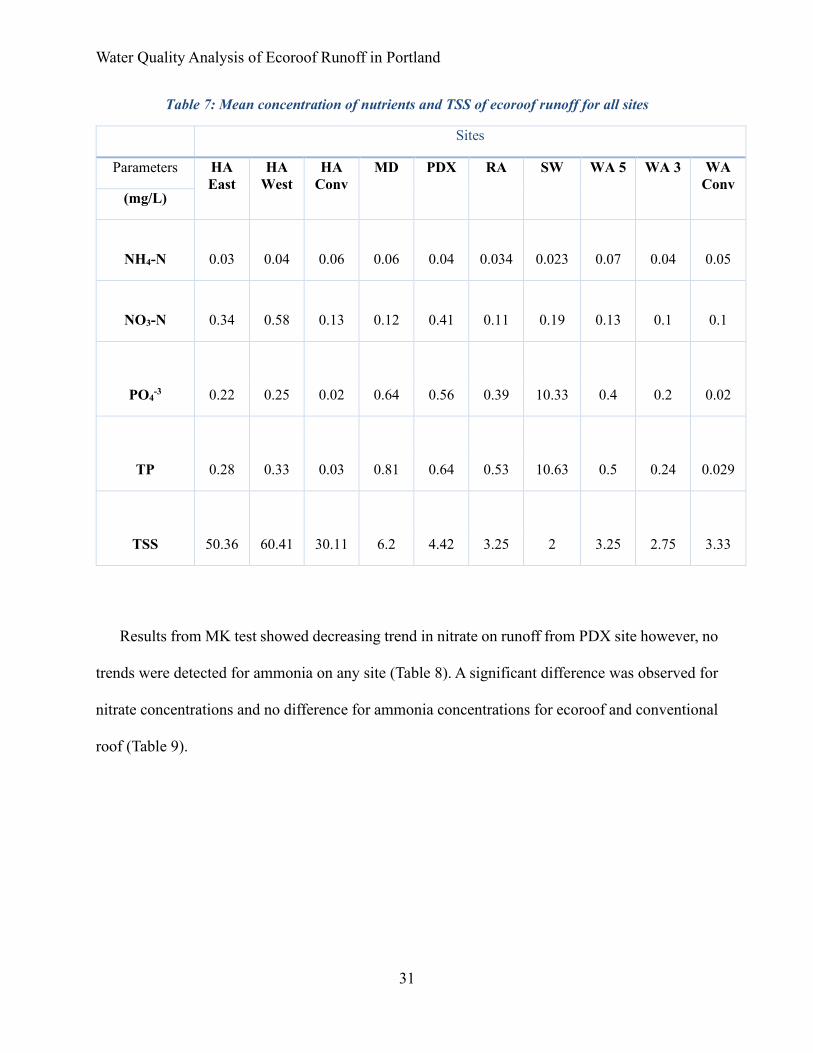
Table 7: Mean concentration of nutrients and TSS of ecoroof runoff for all sites
Sites
Parameters HA
East
HA
West
HA
Conv
MD PDX RA SW WA 5 WA 3 WA
Conv (mg/L)
NH4-N
0.03
0.04
0.06
0.06
0.04
0.034
0.023
0.07 0.04 0.05
NO3-N 0.34 0.58 0.13
0.12
0.41
0.11 0.19 0.13 0.1 0.1
PO4-3 0.22 0.25 0.02 0.64 0.56 0.39 10.33 0.4 0.2 0.02
TP 0.28 0.33 0.03 0.81 0.64 0.53 10.63 0.5 0.24 0.029
TSS 50.36 60.41 30.11 6.2 4.42 3.25 2 3.25 2.75 3.33
Results from MK test showed decreasing trend in nitrate on runoff from PDX site however, no
trends were detected for ammonia on any site (Table 8). A significant difference was observed for
nitrate concentrations and no difference for ammonia concentrations for ecoroof and conventional
roof (Table 9).
Water Quality Analysis of Ecoroof Runoff in Portland
32
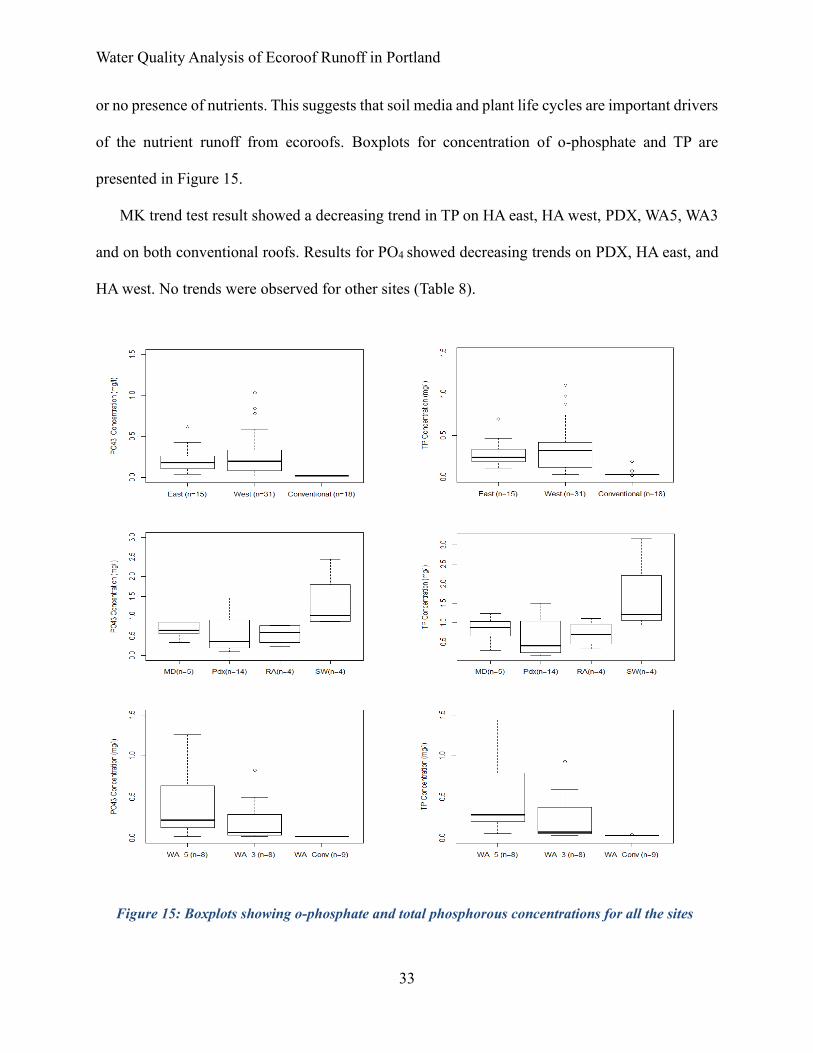
The average concentration of TP was higher in HA east (0.28 mg/L) and HA west (0.33 mg/L)
than for the conventional roof (0.038 mg/L) and was higher than water quality criteria (0.13-0.16
mg/L) in streams. Similarly, all other ecoroof sites had TP concentrations higher than water quality
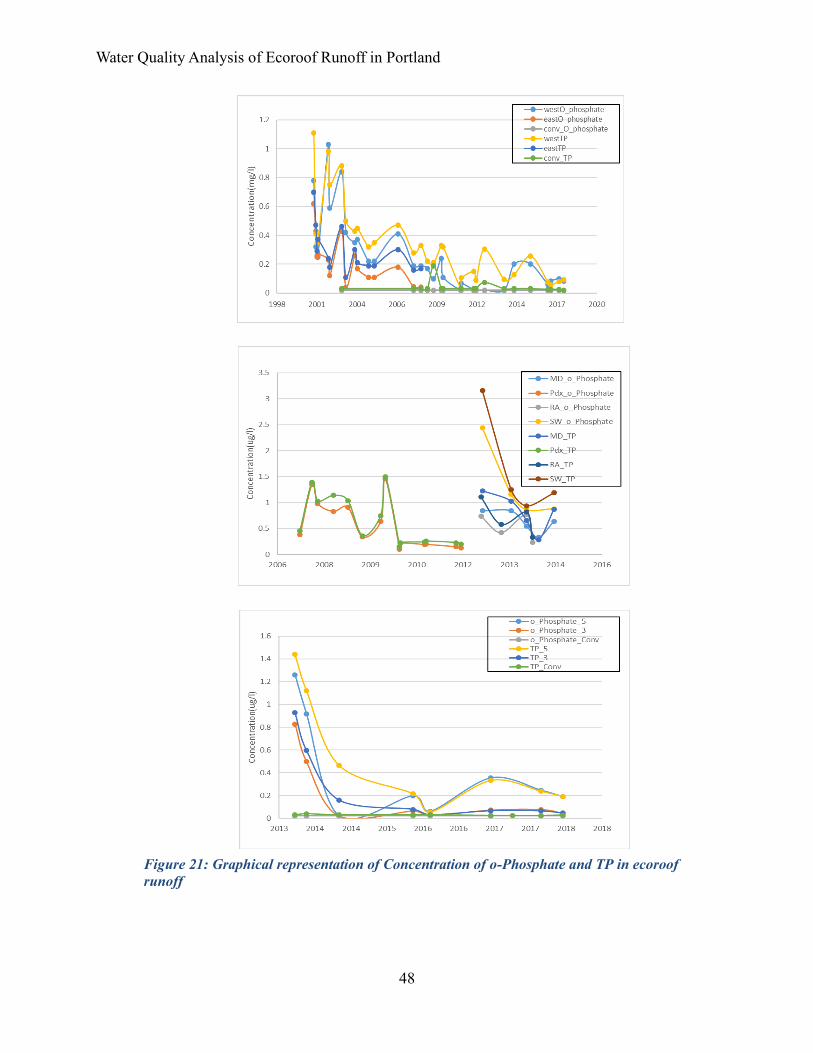
benchmark in stream (ranging from 0.05 mg/L to 3.16 mg/L) and PO43 ranged from a minimum of
0.02 to a maximum 2.44 mg/L. Conventional roof runoff from both HA and WA showed very little
Figure 14: Boxplots showing ammonia and nitrate concentrations for all the sites
Water Quality Analysis of Ecoroof Runoff in Portland
33
or no presence of nutrients. This suggests that soil media and plant life cycles are important drivers
of the nutrient runoff from ecoroofs. Boxplots for concentration of o-phosphate and TP are
presented in Figure 15.
MK trend test result showed a decreasing trend in TP on HA east, HA west, PDX, WA5, WA3
and on both conventional roofs. Results for PO4 showed decreasing trends on PDX, HA east, and
HA west. No trends were observed for other sites (Table 8).
Figure 15: Boxplots showing o-phosphate and total phosphorous concentrations for all the sites
Water Quality Analysis of Ecoroof Runoff in Portland
34
Though descriptive statistical results showed elevated levels of phosphorus in ecoroof runoff,
graphical results showed downward trends over time (Appendix; Figure 20).
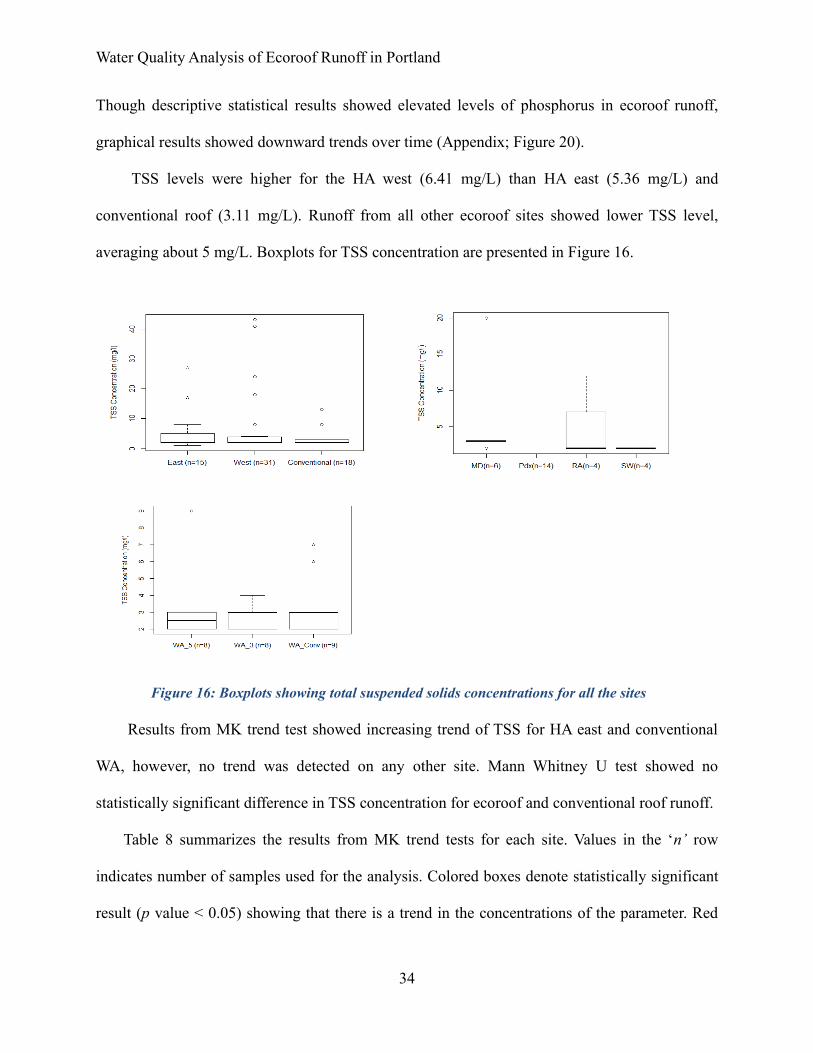
TSS levels were higher for the HA west (6.41 mg/L) than HA east (5.36 mg/L) and
conventional roof (3.11 mg/L). Runoff from all other ecoroof sites showed lower TSS level,
averaging about 5 mg/L. Boxplots for TSS concentration are presented in Figure 16.
Results from MK trend test showed increasing trend of TSS for HA east and conventional
WA, however, no trend was detected on any other site. Mann Whitney U test showed no
statistically significant difference in TSS concentration for ecoroof and conventional roof runoff.
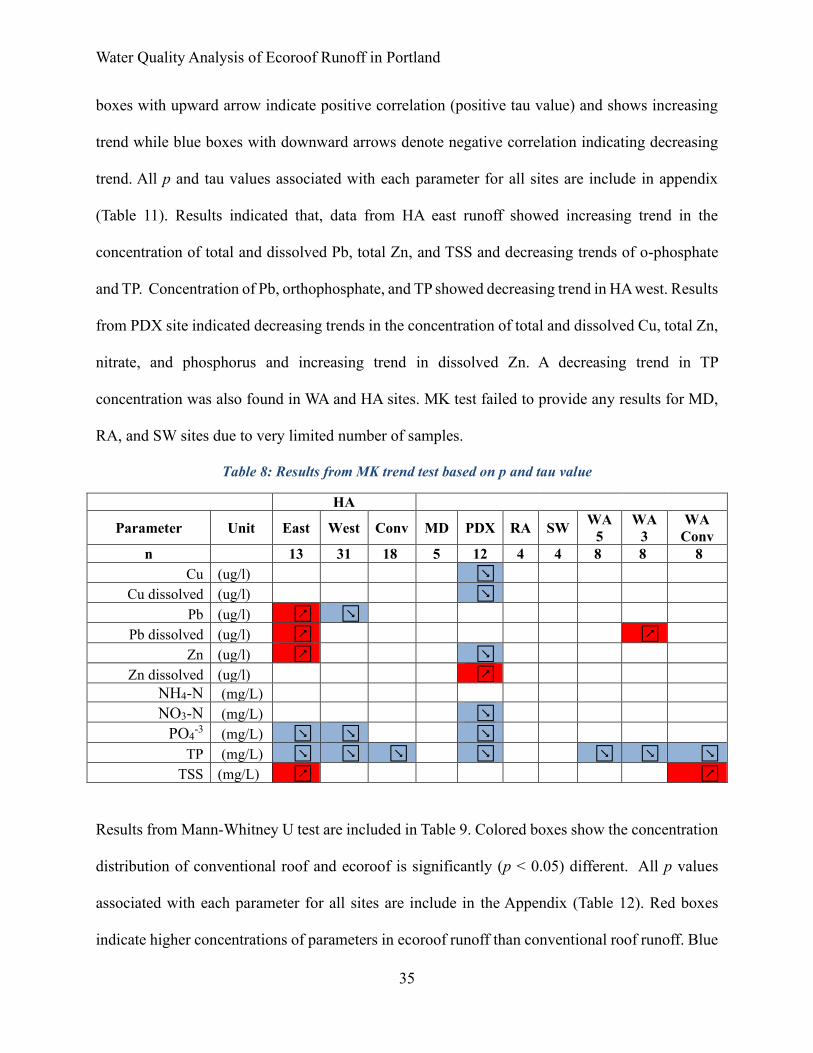
Table 8 summarizes the results from MK trend tests for each site. Values in the ‘n’ row
indicates number of samples used for the analysis. Colored boxes denote statistically significant
result (p value < 0.05) showing that there is a trend in the concentrations of the parameter. Red
Figure 16: Boxplots showing total suspended solids concentrations for all the sites
Water Quality Analysis of Ecoroof Runoff in Portland
35
boxes with upward arrow indicate positive correlation (positive tau value) and shows increasing
trend while blue boxes with downward arrows denote negative correlation indicating decreasing
trend. All p and tau values associated with each parameter for all sites are include in appendix
(Table 11). Results indicated that, data from HA east runoff showed increasing trend in the
concentration of total and dissolved Pb, total Zn, and TSS and decreasing trends of o-phosphate
and TP. Concentration of Pb, orthophosphate, and TP showed decreasing trend in HA west. Results
from PDX site indicated decreasing trends in the concentration of total and dissolved Cu, total Zn,
nitrate, and phosphorus and increasing trend in dissolved Zn. A decreasing trend in TP
concentration was also found in WA and HA sites. MK test failed to provide any results for MD,
RA, and SW sites due to very limited number of samples.
Table 8: Results from MK trend test based on p and tau value
HA
Parameter Unit East West Conv MD PDX RA SW WA
5
WA
3
WA
Conv
n 13 31 18 5 12 4 4 8 8 8
Cu (ug/l) ↘
Cu dissolved (ug/l) ↘
Pb (ug/l) ↗ ↘
Pb dissolved (ug/l) ↗ ↗
Zn (ug/l) ↗ ↘
Zn dissolved (ug/l) ↗
NH4-N (mg/L)
NO3-N (mg/L) ↘
PO4-3 (mg/L) ↘ ↘ ↘
TP (mg/L) ↘ ↘ ↘ ↘ ↘ ↘ ↘
TSS (mg/L) ↗ ↗
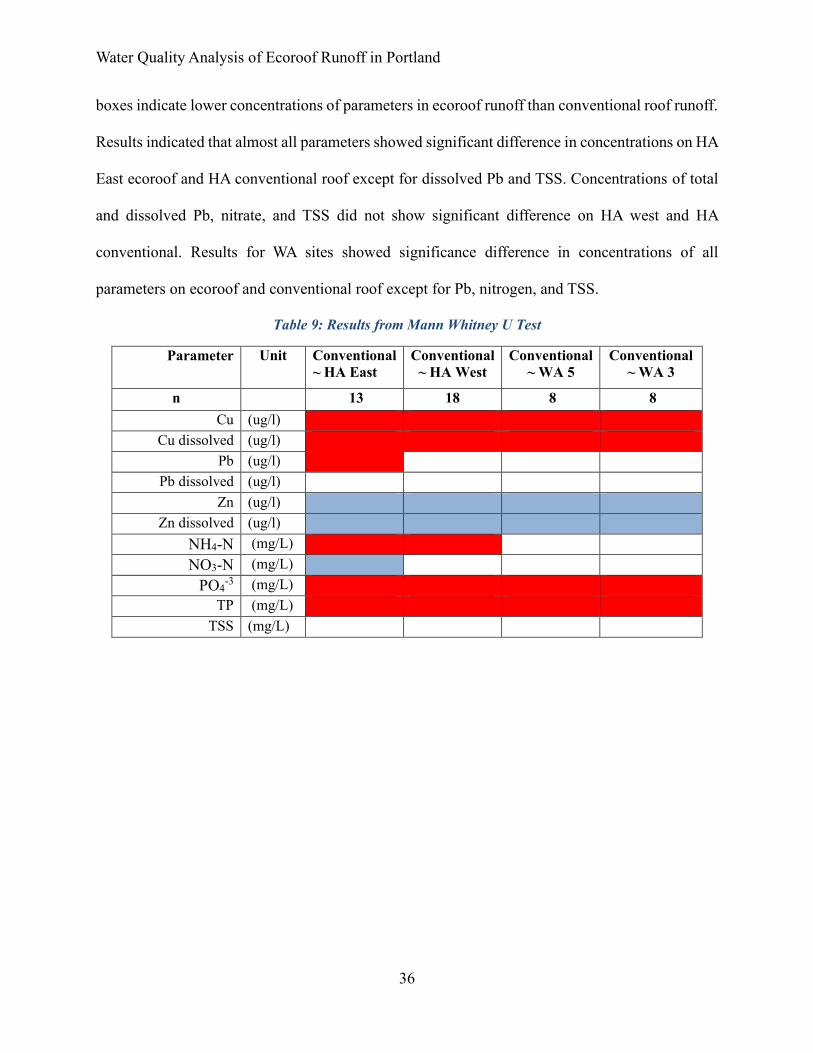
Results from Mann-Whitney U test are included in Table 9. Colored boxes show the concentration
distribution of conventional roof and ecoroof is significantly (p < 0.05) different. All p values
associated with each parameter for all sites are include in the Appendix (Table 12). Red boxes
indicate higher concentrations of parameters in ecoroof runoff than conventional roof runoff. Blue
Water Quality Analysis of Ecoroof Runoff in Portland
36
boxes indicate lower concentrations of parameters in ecoroof runoff than conventional roof runoff.
Results indicated that almost all parameters showed significant difference in concentrations on HA
East ecoroof and HA conventional roof except for dissolved Pb and TSS. Concentrations of total
and dissolved Pb, nitrate, and TSS did not show significant difference on HA west and HA
conventional. Results for WA sites showed significance difference in concentrations of all
parameters on ecoroof and conventional roof except for Pb, nitrogen, and TSS.
Table 9: Results from Mann Whitney U Test
Parameter Unit Conventional
~ HA East
Conventional
~ HA West
Conventional
~ WA 5
Conventional
~ WA 3
n 13 18 8 8
Cu (ug/l)
Cu dissolved (ug/l)
Pb (ug/l)
Pb dissolved (ug/l)
Zn (ug/l)
Zn dissolved (ug/l)
NH4-N (mg/L)
NO3-N (mg/L)
PO4-3 (mg/L)
TP (mg/L)
TSS (mg/L)
Water Quality Analysis of Ecoroof Runoff in Portland
37
4. Conclusions and Recommendations
In this study, the trends in the long-term water quality data of runoff from six ecoroof
sites were evaluated. Due to limited seasonal data, storm patterns, and lack of information about
precipitation quality statistical trend tests did not provide conclusive results for some of the sites.
Copper: Results for Cu indicated higher levels of concentrations in runoff from ecoroof
as compared to conventional roofs. Higher levels of Cu concentrations in the ecoroof runoff may
be the result of Cu export from the soil media. Elevated Cu in runoff is a concern since slightest
increase in levels of Cu can be harmful to aquatic life.
Lead: HA east and PDX showed higher level of Pb concentrations in ecoroof runoff than
all other sites evaluated in this study. Higher Pb in the soil media on both sites might be the reason
for elevated Pb in ecoroof runoff.
Zinc: This study found that Zn concentration in conventional roof runoff was higher than
ecoroof runoff. Similar experimental studies conducted by Mendez et al. (2011) and Long et al.
( n.d.). also found higher concentrations of Zn in runoff from conventional metal roof. This
contamination of runoff is likely due to roofing material in conventional roofs.
Nitrogen and Phosphorus: Ammonia and nitrate levels were significantly lower in
ecoroof runoff for all sites. Phosphorus concentrations do appear to be significantly higher for
ecoroofs. However, graphical results for sites (HA and WA) with long dataset exhibited downward
trend over time. Decreasing trend in net export of phosphorus might be due to stabilization of soil
media over time. A study by Long et. al (n.d.) at the Pennsylvania State University campus found
similar results for the concentration of ammonia, nitrate, and TP.
Water Quality Analysis of Ecoroof Runoff in Portland
38
Recommendations:
• Higher P concentration in the runoff may be reduced by adding biochar amendment to the
soil media. Study conducted by Gerould (2016) at Oregon State University also showed
ability of different types of biochar to remove Cu in stormwater.
• To provide additional treatment, ecoroof runoff can be directed to other stormwater
management facilities such as rain gardens (Barr, 2015). Runoff from ecoroof may also be
reused for urban landscape irrigation or toilet flushing (Razzaghmanesh et al., 2016).
• To further evaluate concentrations of pollutants in ecoroof runoff and to study the effect of
roof age on runoff, these roofs must be investigated for a longer period. For future water
quality studies, it would be also beneficial to conduct more sampling in wet months.
• Also, it is recommended to evaluate first flush pollutant loading in ecoroof runoff as rainfall
after dry period can produce greater pollutant loads than that of succeeding rainfall.
• It would be valuable to expand this water quality study to include precipitation quality.
Having data for rainwater constituent levels would enable better understanding of the
sources of pollutants in roof runoff.
Water Quality Analysis of Ecoroof Runoff in Portland
39
References
Barr, C. M. (2015). WATER QUALITY IMPACTS OF A GREEN ROOF In Comparison to
Other Land Uses, (December).
Berndtsson, J. C., Emilsson, T., & Bengtsson, L. (2006). The influence of extensive vegetated
roofs on runoff water quality. Science of the Total Environment, 355(1–3), 48–63.
https://doi.org/10.1016/j.scitotenv.2005.02.035
BES, C. of P. (n.d.). No Title.
BES, C. of P. (2010a). Portland ’ s Green Infrastructure : Quantifying the Health , Energy , and
Community Livability Benefits.
BES, C. of P. (2010b). Stormwater Management Facility Monitoring Report SUMMARY
Management Program.
Buffam, I., Mitchell, M. E., & Durtsche, R. D. (2016). Environmental drivers of seasonal
variation in green roof runoff water quality. Ecological Engineering, 91, 506–514.
https://doi.org/10.1016/j.ecoleng.2016.02.044
Carpenter, C. M. G., Todorov, D., Driscoll, C. T., & Montesdeoca, M. (2016). Water quantity and
quality response of a green roof to storm events: Experimental and monitoring observations.
Environmental Pollution, 218, 664–672. https://doi.org/10.1016/j.envpol.2016.07.056
Czemiel Berndtsson, J. (2010, April). Green roof performance towards management of runoff
water quantity and quality: A review. Ecological Engineering.
https://doi.org/10.1016/j.ecoleng.2009.12.014
Ferrans, P., Rey, C. V., Pérez, G., Rodríguez, J. P., & Díaz-Granados, M. (2018). Effect of green
roof configuration and hydrological variables on runoffwater quantity and quality. Water
(Switzerland), 10(7). https://doi.org/10.3390/w10070960
Gerould, J. M. D. (2016). Characterization of Biochar for Use in Treating Copper (II) Polluted
Stormwater. Revista Brasileira de Ergonomia, 9(2), 10. https://doi.org/10.5151/cidi2017-
060
Gregoire, B. G., & Clausen, J. C. (2011). Effect of a modular extensive green roof on stormwater
runoff and water quality. Ecological Engineering, 37(6), 963–969.
https://doi.org/10.1016/j.ecoleng.2011.02.004
Hutchinson, Doug. Abrams , peter. Retzalff, Ryan. Lipton, T. (2003). Stormwater monitoring two
ecoroofs in Portland.pdf.
Jokimaa, C. S. (2016). Evaluation on the quality of green roof run off based on nutrients - Case
study.
Water Quality Analysis of Ecoroof Runoff in Portland
40
Li, Y., & Babcock, R. W. (2014). Green roofs against pollution and climate change. A review.
Agronomy for Sustainable Development, 34(4), 695–705. https://doi.org/10.1007/s13593-
014-0230-9
Long, B., Clark, S. E., Baker, K. H., & Berghage, R. (n.d.). Green Roofs: Optimizing the Water
Quality of Rooftop Runoff.
Mitchell, M. E., Matter, S. F., Durtsche, R. D., & Buffam, I. (2017). Elevated phosphorus:
dynamics during four years of green roof development. Urban Ecosystems, 20(5), 1121–
1133. https://doi.org/10.1007/s11252-017-0664-3
Moran, A., Hunt, B., & Jennings, G. (2004). A North Carolina Field Study to Evaluate Greenroof
Runoff Quantity, Runoff Quality, and Plant Growth (pp. 1–10). American Society of Civil
Engineers (ASCE). https://doi.org/10.1061/40685(2003)335
Portland, C. of. (2018). The cc2035 plan vision.
Razzaghmanesh, M., Beecham, S., & Myers, B. (2016). Long-Term Effects of Green Roofs on
Stormwater Quality from Two Sites in Australia. World Environmental And Water
Resources Congress 2016: Water, Wastewater, and Stormwater and Urban Watershed
Symposium - Papers from Sessions of the Proceedings of the 2016 World Environmental and
Water Resources Congress, 371–379. https://doi.org/10.1061/9780784479889.039
Spolek, G. (2008). Performance monitoring of three ecoroofs in Portland, Oregon. Urban
Ecosystems (Vol. 11). https://doi.org/10.1007/s11252-008-0061-z
Sullivan, L. (n.d.). Preliminary Study Comparing Precipitation Quality Between Nominal Land
Uses in Portland, Oregon.
Susca, T., Gaffin, S. R., & Dell’Osso, G. R. (2011). Positive effects of vegetation: Urban heat
island and green roofs. Environmental Pollution, 159(8), 2119–2126.
https://doi.org/https://doi.org/10.1016/j.envpol.2011.03.007
Teemusk, A. (2011). The Influence of Green Roofs on Runoff Water Quality : A Case Study from
The Influence of Green Roofs on Runoff Water Quality : A Case Study from Estonia,
(November). https://doi.org/10.1007/s11269-011-9877-z
Yang, J., Yu, Q., & Gong, P. (2008). Quantifying air pollution removal by green roofs in
Chicago. Atmospheric Environment, 42(31), 7266–7273.
https://doi.org/https://doi.org/10.1016/j.atmosenv.2008.07.003
Water Quality Analysis of Ecoroof Runoff in Portland
41
Appendix
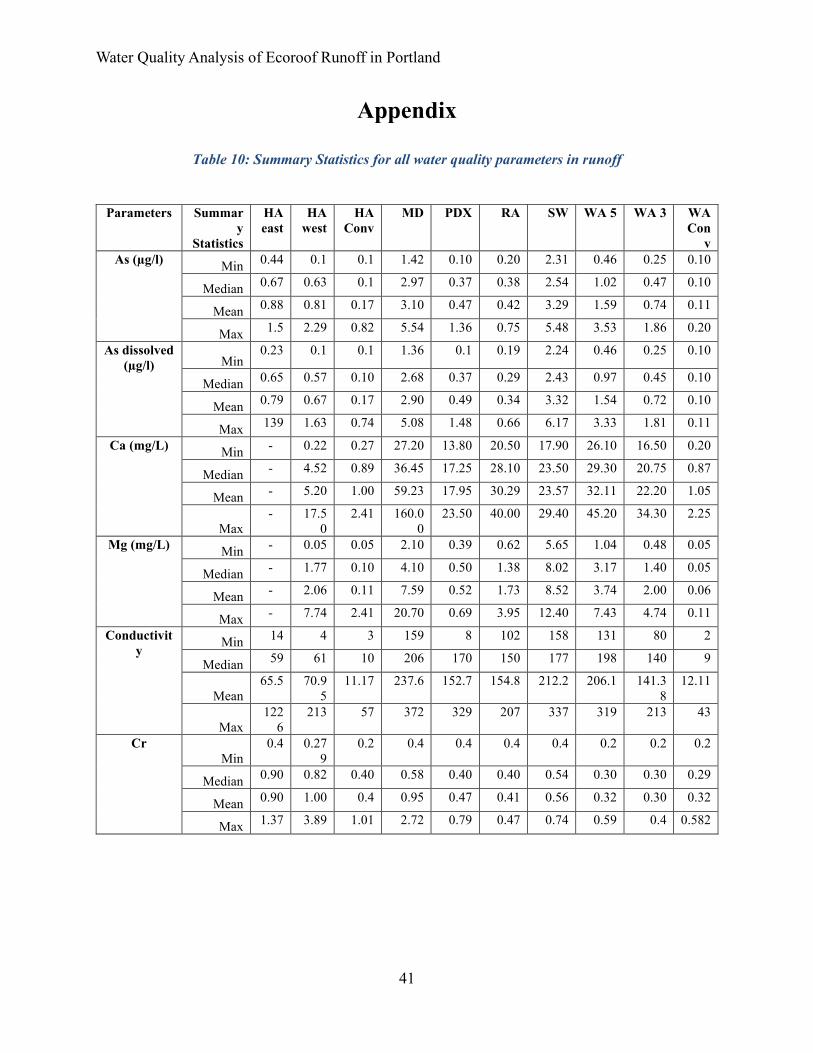
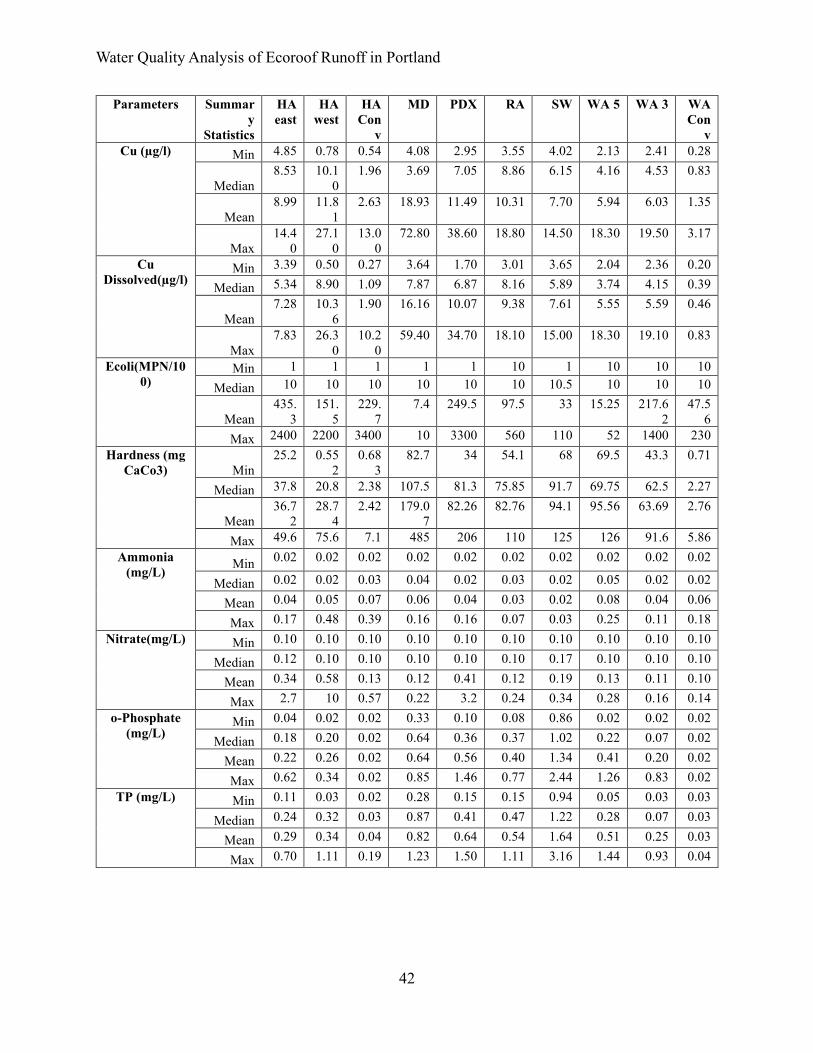
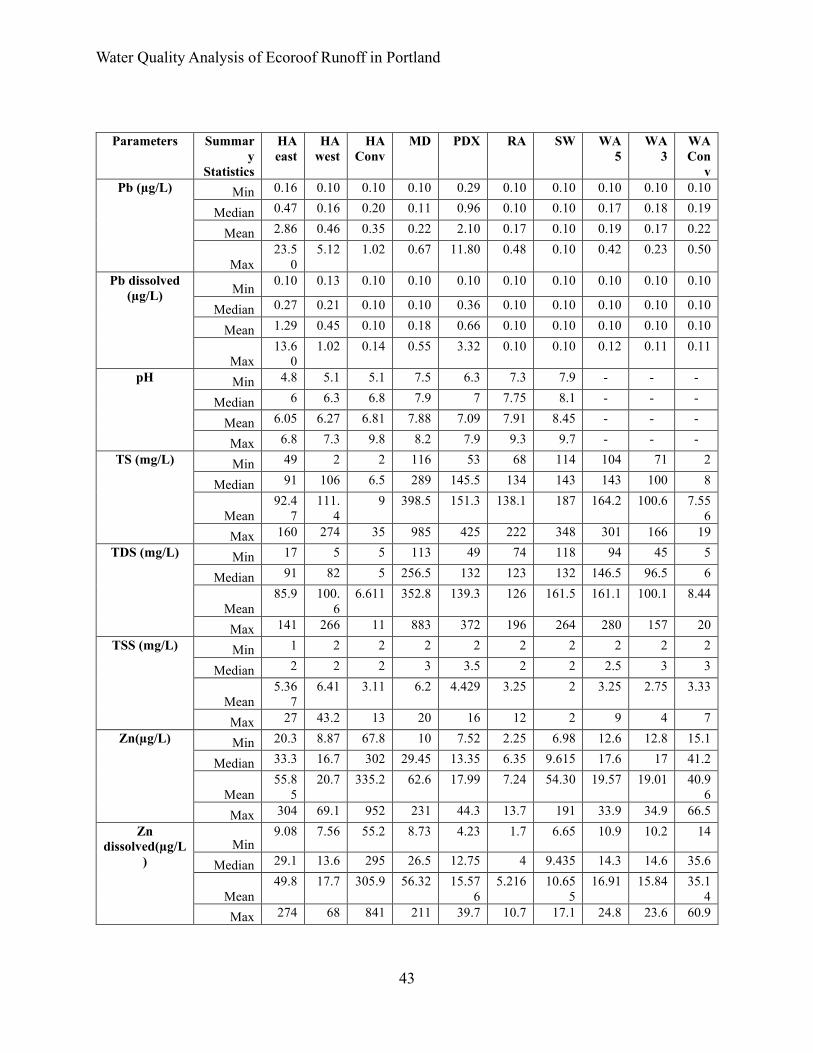
Table 10: Summary Statistics for all water quality parameters in runoff
Parameters Summar
y
Statistics
HA
east
HA
west
HA
Conv
MD PDX RA SW WA 5 WA 3 WA
Con
v
As (µg/l) Min
0.44 0.1 0.1 1.42 0.10 0.20 2.31 0.46 0.25 0.10
Median 0.67 0.63 0.1 2.97 0.37 0.38 2.54 1.02 0.47 0.10
Mean 0.88 0.81 0.17 3.10 0.47 0.42 3.29 1.59 0.74 0.11
Max 1.5 2.29 0.82 5.54 1.36 0.75 5.48 3.53 1.86 0.20
As dissolved
(µg/l) Min 0.23 0.1 0.1 1.36 0.1 0.19 2.24 0.46 0.25 0.10
Median 0.65 0.57 0.10 2.68 0.37 0.29 2.43 0.97 0.45 0.10
Mean 0.79 0.67 0.17 2.90 0.49 0.34 3.32 1.54 0.72 0.10
Max 139 1.63 0.74 5.08 1.48 0.66 6.17 3.33 1.81 0.11
Ca (mg/L) Min
- 0.22 0.27 27.20 13.80 20.50 17.90 26.10 16.50 0.20
Median - 4.52 0.89 36.45 17.25 28.10 23.50 29.30 20.75 0.87
Mean - 5.20 1.00 59.23 17.95 30.29 23.57 32.11 22.20 1.05
Max
- 17.5
0
2.41 160.0
0
23.50 40.00 29.40 45.20 34.30 2.25
Mg (mg/L) Min
- 0.05 0.05 2.10 0.39 0.62 5.65 1.04 0.48 0.05
Median - 1.77 0.10 4.10 0.50 1.38 8.02 3.17 1.40 0.05
Mean - 2.06 0.11 7.59 0.52 1.73 8.52 3.74 2.00 0.06
Max - 7.74 2.41 20.70 0.69 3.95 12.40 7.43 4.74 0.11
Conductivit
y Min
14 4 3 159 8 102 158 131 80 2
Median 59 61 10 206 170 150 177 198 140 9
Mean
65.5 70.9
5
11.17 237.6 152.7 154.8 212.2 206.1 141.3
8
12.11
Max
122
6
213 57 372 329 207 337 319 213 43
Cr
Min
0.4 0.27
9
0.2 0.4 0.4 0.4 0.4 0.2 0.2 0.2
Median 0.90 0.82 0.40 0.58 0.40 0.40 0.54 0.30 0.30 0.29
Mean 0.90 1.00 0.4 0.95 0.47 0.41 0.56 0.32 0.30 0.32
Max 1.37 3.89 1.01 2.72 0.79 0.47 0.74 0.59 0.4 0.582
Water Quality Analysis of Ecoroof Runoff in Portland
42
Parameters Summar
y
Statistics
HA
east
HA
west
HA
Con
v
MD PDX RA SW WA 5 WA 3 WA
Con
v
Cu (µg/l) Min 4.85 0.78 0.54 4.08 2.95 3.55 4.02 2.13 2.41 0.28
Median
8.53 10.1
0
1.96 3.69 7.05 8.86 6.15 4.16 4.53 0.83
Mean
8.99 11.8
1
2.63 18.93 11.49 10.31 7.70 5.94 6.03 1.35
Max
14.4
0
27.1
0
13.0
0
72.80 38.60 18.80 14.50 18.30 19.50 3.17
Cu
Dissolved(µg/l) Min 3.39 0.50 0.27 3.64 1.70 3.01 3.65 2.04 2.36 0.20
Median 5.34 8.90 1.09 7.87 6.87 8.16 5.89 3.74 4.15 0.39
Mean
7.28 10.3
6
1.90 16.16 10.07 9.38 7.61 5.55 5.59 0.46
Max
7.83 26.3
0
10.2
0
59.40 34.70 18.10 15.00 18.30 19.10 0.83
Ecoli(MPN/10
0) Min 1 1 1 1 1 10 1 10 10 10
Median 10 10 10 10 10 10 10.5 10 10 10
Mean
435.
3
151.
5
229.
7
7.4 249.5 97.5 33 15.25 217.6
2
47.5
6
Max 2400 2200 3400 10 3300 560 110 52 1400 230
Hardness (mg
CaCo3) Min
25.2 0.55
2
0.68
3
82.7 34 54.1 68 69.5 43.3 0.71
Median 37.8 20.8 2.38 107.5 81.3 75.85 91.7 69.75 62.5 2.27
Mean
36.7
2
28.7
4
2.42 179.0
7
82.26 82.76 94.1 95.56 63.69 2.76
Max 49.6 75.6 7.1 485 206 110 125 126 91.6 5.86
Ammonia
(mg/L) Min
0.02 0.02 0.02 0.02 0.02 0.02 0.02 0.02 0.02 0.02
Median 0.02 0.02 0.03 0.04 0.02 0.03 0.02 0.05 0.02 0.02
Mean 0.04 0.05 0.07 0.06 0.04 0.03 0.02 0.08 0.04 0.06
Max 0.17 0.48 0.39 0.16 0.16 0.07 0.03 0.25 0.11 0.18
Nitrate(mg/L) Min 0.10 0.10 0.10 0.10 0.10 0.10 0.10 0.10 0.10 0.10
Median 0.12 0.10 0.10 0.10 0.10 0.10 0.17 0.10 0.10 0.10
Mean 0.34 0.58 0.13 0.12 0.41 0.12 0.19 0.13 0.11 0.10
Max 2.7 10 0.57 0.22 3.2 0.24 0.34 0.28 0.16 0.14
o-Phosphate
(mg/L) Min 0.04 0.02 0.02 0.33 0.10 0.08 0.86 0.02 0.02 0.02
Median 0.18 0.20 0.02 0.64 0.36 0.37 1.02 0.22 0.07 0.02
Mean 0.22 0.26 0.02 0.64 0.56 0.40 1.34 0.41 0.20 0.02
Max 0.62 0.34 0.02 0.85 1.46 0.77 2.44 1.26 0.83 0.02
TP (mg/L) Min 0.11 0.03 0.02 0.28 0.15 0.15 0.94 0.05 0.03 0.03
Median 0.24 0.32 0.03 0.87 0.41 0.47 1.22 0.28 0.07 0.03
Mean 0.29 0.34 0.04 0.82 0.64 0.54 1.64 0.51 0.25 0.03
Max 0.70 1.11 0.19 1.23 1.50 1.11 3.16 1.44 0.93 0.04
Water Quality Analysis of Ecoroof Runoff in Portland
43
Parameters Summar
y
Statistics
HA
east
HA
west
HA
Conv
MD PDX RA SW WA
5
WA
3
WA
Con
v
Pb (µg/L) Min 0.16 0.10 0.10 0.10 0.29 0.10 0.10 0.10 0.10 0.10
Median 0.47 0.16 0.20 0.11 0.96 0.10 0.10 0.17 0.18 0.19
Mean 2.86 0.46 0.35 0.22 2.10 0.17 0.10 0.19 0.17 0.22
Max
23.5
0
5.12 1.02 0.67 11.80 0.48 0.10 0.42 0.23 0.50
Pb dissolved
(µg/L) Min
0.10 0.13 0.10 0.10 0.10 0.10 0.10 0.10 0.10 0.10
Median 0.27 0.21 0.10 0.10 0.36 0.10 0.10 0.10 0.10 0.10
Mean 1.29 0.45 0.10 0.18 0.66 0.10 0.10 0.10 0.10 0.10
Max
13.6
0
1.02 0.14 0.55 3.32 0.10 0.10 0.12 0.11 0.11
pH Min 4.8 5.1 5.1 7.5 6.3 7.3 7.9 - - -
Median 6 6.3 6.8 7.9 7 7.75 8.1 - - -
Mean 6.05 6.27 6.81 7.88 7.09 7.91 8.45 - - -
Max 6.8 7.3 9.8 8.2 7.9 9.3 9.7 - - -
TS (mg/L) Min 49 2 2 116 53 68 114 104 71 2
Median 91 106 6.5 289 145.5 134 143 143 100 8
Mean
92.4
7
111.
4
9 398.5 151.3 138.1 187 164.2 100.6 7.55
6
Max 160 274 35 985 425 222 348 301 166 19
TDS (mg/L) Min 17 5 5 113 49 74 118 94 45 5
Median 91 82 5 256.5 132 123 132 146.5 96.5 6
Mean
85.9 100.
6
6.611 352.8 139.3 126 161.5 161.1 100.1 8.44
Max 141 266 11 883 372 196 264 280 157 20
TSS (mg/L) Min 1 2 2 2 2 2 2 2 2 2
Median 2 2 2 3 3.5 2 2 2.5 3 3
Mean
5.36
7
6.41 3.11 6.2 4.429 3.25 2 3.25 2.75 3.33
Max 27 43.2 13 20 16 12 2 9 4 7
Zn(µg/L) Min 20.3 8.87 67.8 10 7.52 2.25 6.98 12.6 12.8 15.1
Median 33.3 16.7 302 29.45 13.35 6.35 9.615 17.6 17 41.2
Mean
55.8
5
20.7 335.2 62.6 17.99 7.24 54.30 19.57 19.01 40.9
6
Max 304 69.1 952 231 44.3 13.7 191 33.9 34.9 66.5
Zn
dissolved(µg/L
)
Min 9.08 7.56 55.2 8.73 4.23 1.7 6.65 10.9 10.2 14
Median 29.1 13.6 295 26.5 12.75 4 9.435 14.3 14.6 35.6
Mean
49.8 17.7 305.9 56.32 15.57
6
5.216 10.65
5
16.91 15.84 35.1
4
Max 274 68 841 211 39.7 10.7 17.1 24.8 23.6 60.9
Water Quality Analysis of Ecoroof Runoff in Portland
44
Figure 17: Graphical representation of concentrations of Cu and Cu dissolved in ecoroof runoff
Water Quality Analysis of Ecoroof Runoff in Portland
45
Figure 18: Graphical representation of Concentration of Pb and Pb dissolved in ecoroof runoff
Water Quality Analysis of Ecoroof Runoff in Portland
46
Figure 19: Graphical representation of Concentration of Zn and Zn dissolved in ecoroof runoff
Water Quality Analysis of Ecoroof Runoff in Portland
47
Figure 20:Graphical representation of Concentration of Ammonia and Nitrate in ecoroof runoff
Water Quality Analysis of Ecoroof Runoff in Portland
48
Figure 21: Graphical representation of Concentration of o-Phosphate and TP in ecoroof
runoff
Water Quality Analysis of Ecoroof Runoff in Portland
49
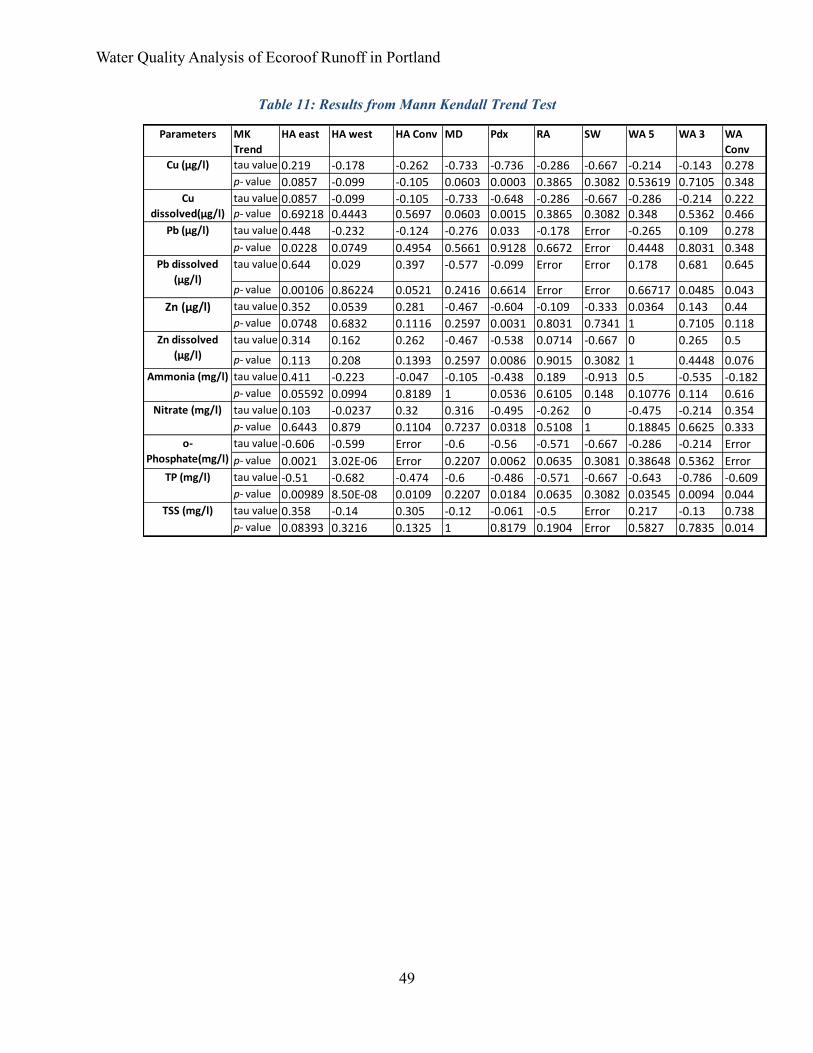
Table 11: Results from Mann Kendall Trend Test
Parameters MK
Trend
HA east HA west HA Conv MD Pdx RA SW WA 5 WA 3 WA
Conv
tau value 0.219 -0.178 -0.262 -0.733 -0.736 -0.286 -0.667 -0.214 -0.143 0.278p- value 0.0857 -0.099 -0.105 0.0603 0.0003 0.3865 0.3082 0.53619 0.7105 0.348tau value 0.0857 -0.099 -0.105 -0.733 -0.648 -0.286 -0.667 -0.286 -0.214 0.222p- value 0.69218 0.4443 0.5697 0.0603 0.0015 0.3865 0.3082 0.348 0.5362 0.466tau value 0.448 -0.232 -0.124 -0.276 0.033 -0.178 Error -0.265 0.109 0.278
p- value 0.0228 0.0749 0.4954 0.5661 0.9128 0.6672 Error 0.4448 0.8031 0.348tau value 0.644 0.029 0.397 -0.577 -0.099 Error Error 0.178 0.681 0.645
p- value 0.00106 0.86224 0.0521 0.2416 0.6614 Error Error 0.66717 0.0485 0.043tau value 0.352 0.0539 0.281 -0.467 -0.604 -0.109 -0.333 0.0364 0.143 0.44p- value 0.0748 0.6832 0.1116 0.2597 0.0031 0.8031 0.7341 1 0.7105 0.118tau value 0.314 0.162 0.262 -0.467 -0.538 0.0714 -0.667 0 0.265 0.5
p- value 0.113 0.208 0.1393 0.2597 0.0086 0.9015 0.3082 1 0.4448 0.076tau value 0.411 -0.223 -0.047 -0.105 -0.438 0.189 -0.913 0.5 -0.535 -0.182p- value 0.05592 0.0994 0.8189 1 0.0536 0.6105 0.148 0.10776 0.114 0.616tau value 0.103 -0.0237 0.32 0.316 -0.495 -0.262 0 -0.475 -0.214 0.354p- value 0.6443 0.879 0.1104 0.7237 0.0318 0.5108 1 0.18845 0.6625 0.333tau value -0.606 -0.599 Error -0.6 -0.56 -0.571 -0.667 -0.286 -0.214 Error
p- value 0.0021 3.02E-06 Error 0.2207 0.0062 0.0635 0.3081 0.38648 0.5362 Errortau value -0.51 -0.682 -0.474 -0.6 -0.486 -0.571 -0.667 -0.643 -0.786 -0.609p- value 0.00989 8.50E-08 0.0109 0.2207 0.0184 0.0635 0.3082 0.03545 0.0094 0.044tau value 0.358 -0.14 0.305 -0.12 -0.061 -0.5 Error 0.217 -0.13 0.738p- value 0.08393 0.3216 0.1325 1 0.8179 0.1904 Error 0.5827 0.7835 0.014
TSS (mg/l)
Zn dissolved
(µg/l)
Ammonia (mg/l)
Nitrate (mg/l)
o-
Phosphate(mg/l)
TP (mg/l)
Cu (µg/l)
Cu
dissolved(µg/l)
Pb (µg/l)
Pb dissolved
(µg/l)
Zn (µg/l)
Water Quality Analysis of Ecoroof Runoff in Portland
50
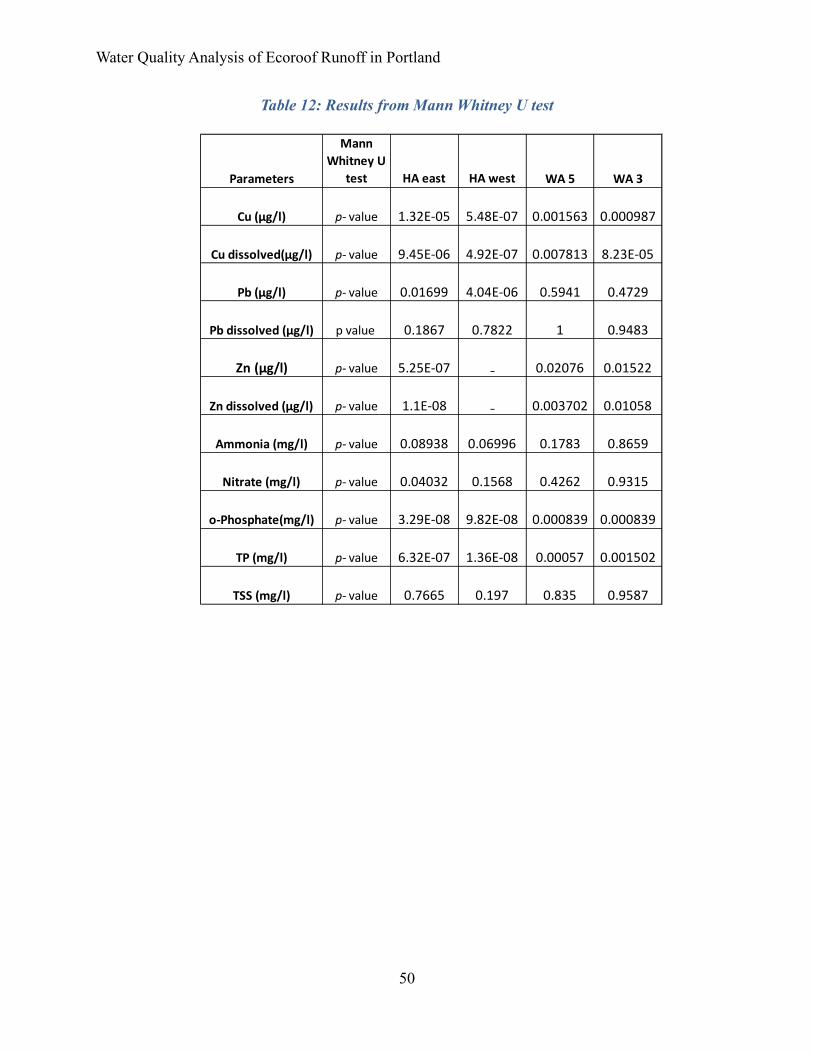
Table 12: Results from Mann Whitney U test
Parameters
Mann
Whitney U
test HA east HA west WA 5 WA 3
0.9587TSS (mg/l) p- value 0.7665 0.197 0.835
0.000839
TP (mg/l) p- value 6.32E-07 1.36E-08 0.00057 0.001502
o-Phosphate(mg/l) p- value 3.29E-08 9.82E-08 0.000839
0.8659
Nitrate (mg/l) p- value 0.04032 0.1568 0.4262 0.9315
Ammonia (mg/l) p- value 0.08938 0.06996 0.1783
0.01522
Zn dissolved (µg/l) p- value 1.1E-08 ₋ 0.003702 0.01058
Zn (µg/l) p- value 5.25E-07 ₋ 0.02076
0.4729
Pb dissolved (µg/l) p value 0.1867 0.7822 1 0.9483
Pb (µg/l) p- value 0.01699 4.04E-06 0.5941
9.45E-06 4.92E-07 0.007813 8.23E-05
Cu (µg/l) p- value 1.32E-05 5.48E-07 0.001563 0.000987
Cu dissolved(µg/l) p- value