runoff final
TRANSCRIPT


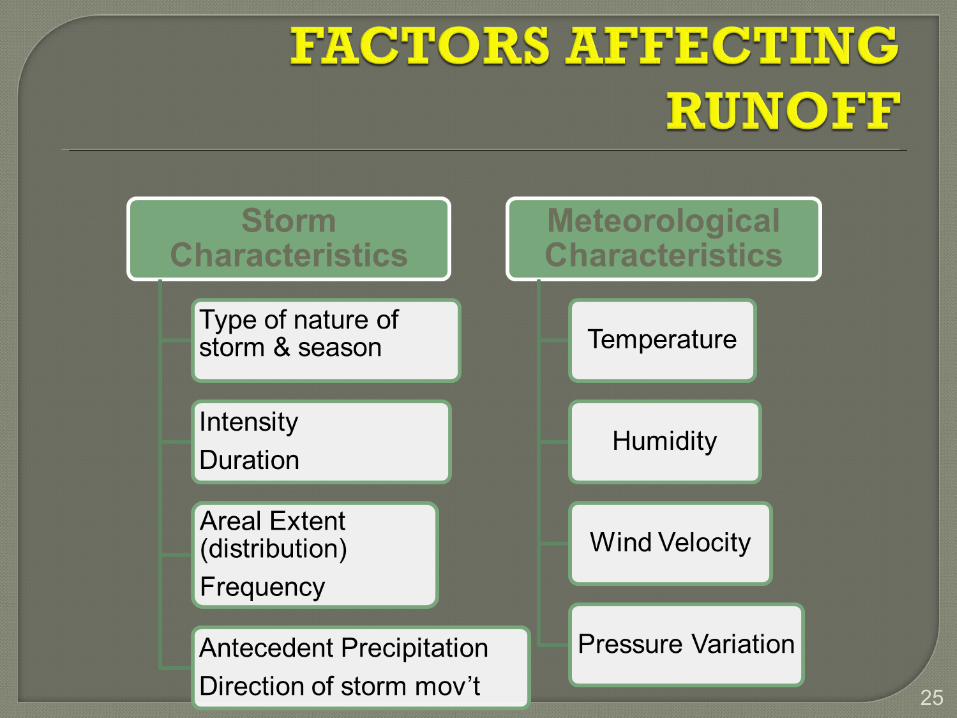
A. COMPONENTS OF STREAM FLOWB. CATCHMENT CHARACTERISTICSC. MEAN AND MEDIAN ELEVATIOND. CLASSIFICATION OF STREAMSE. ISOCHRONESF. FACTORS AFFECTING RUNOFFG. ESTIMATION OF RUNOFF
2

3
Overland Flow- a thin sheet of water which flows over the land surface.
Interflow/Subsurface Flow/Underflow-an infiltrating water which moves laterallyin the surface soil & joins the streamflow.
Baseflow-groundwater contributing to the streamflow.
4

Direct Runoff- general term used to include theoverland flow and interflow and snowmelt, in some case.
Depression Storage- water stored in puddless,pits, and small ponds.
Surface Detention/Detention Storage- value ofwater in transit in overlandflow which has not yet reached the stream channel.
5

Bank Storage- portion of runoff in a rising flood in a stream, which is absorbed by permeable boundaries of the stream above the normal phreatic surface.
6
7

8
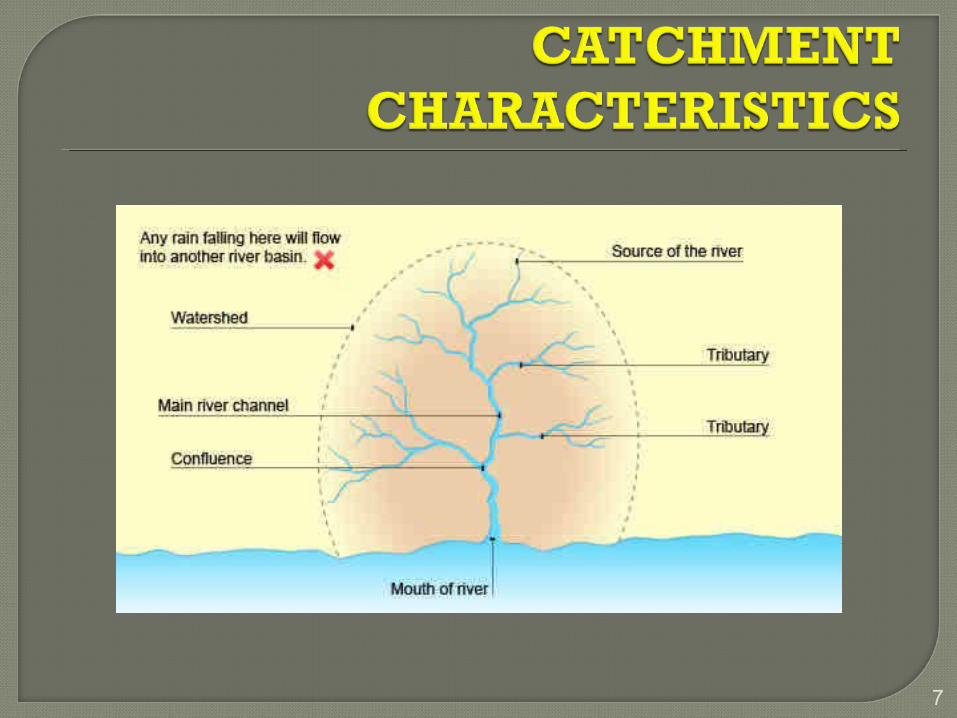
Drainage Basin- area of land drained by a river.Catchment Area- area within the drainage
basin.Watershed/Drainage Divide- edge of highland
surrounding a drainage basin & marks the boundary b/w two drainage basins.
Source- beginning or start of a river.Confluence- the point at w/c two rivers or stream
join.
9
Tributary- stream or small river w/c joins a largerstream or river.
Mouth- the point where the river comes to the end usually when entering a sea.
Concentration Point/Measuring Point- a single point at w/c all surface drainage from a
basin comes together as outflow in the stream channel.
10

11
(Kirpich Equation)

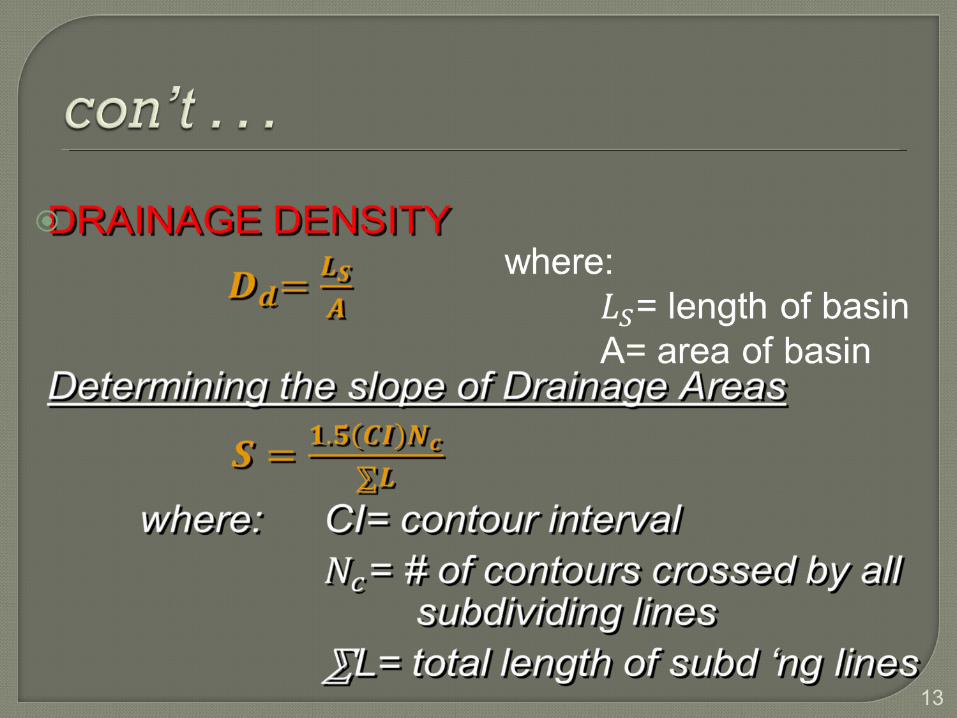
Characteristics of Drainage NetNumber of StreamsLength of StreamsStream DensityDrainage Density
12
13

14

Median Elevation- elevation at 50% area of the catchment & is determined from the area-elevation curve (hypsometric curve).
15
Hypsometric Curve
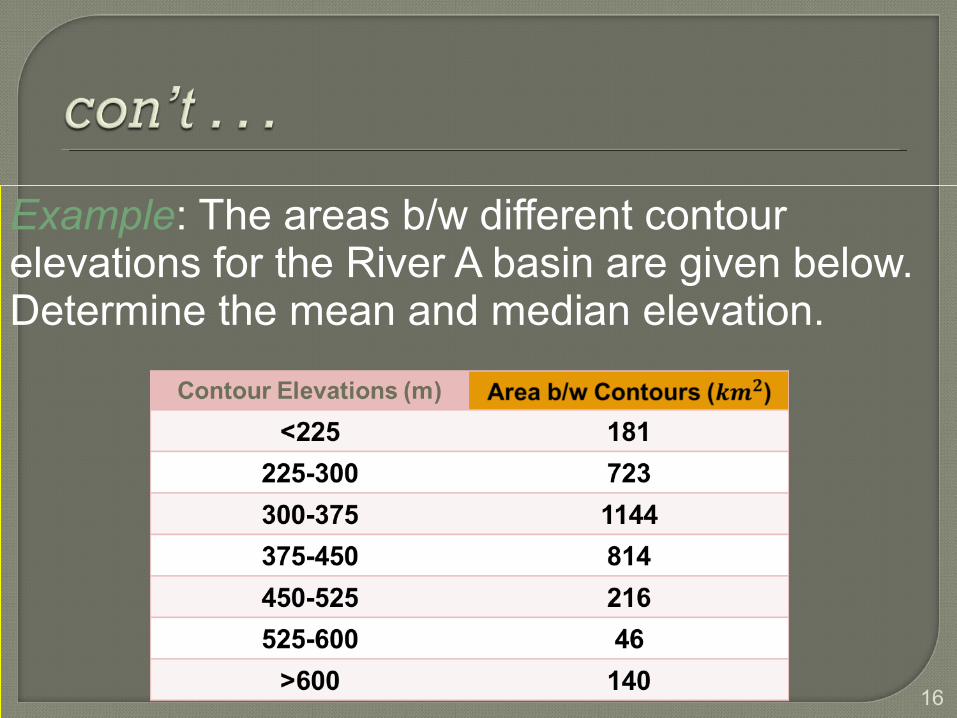
Example: The areas b/w different contour elevations for the River A basin are given below. Determine the mean and median elevation.
16
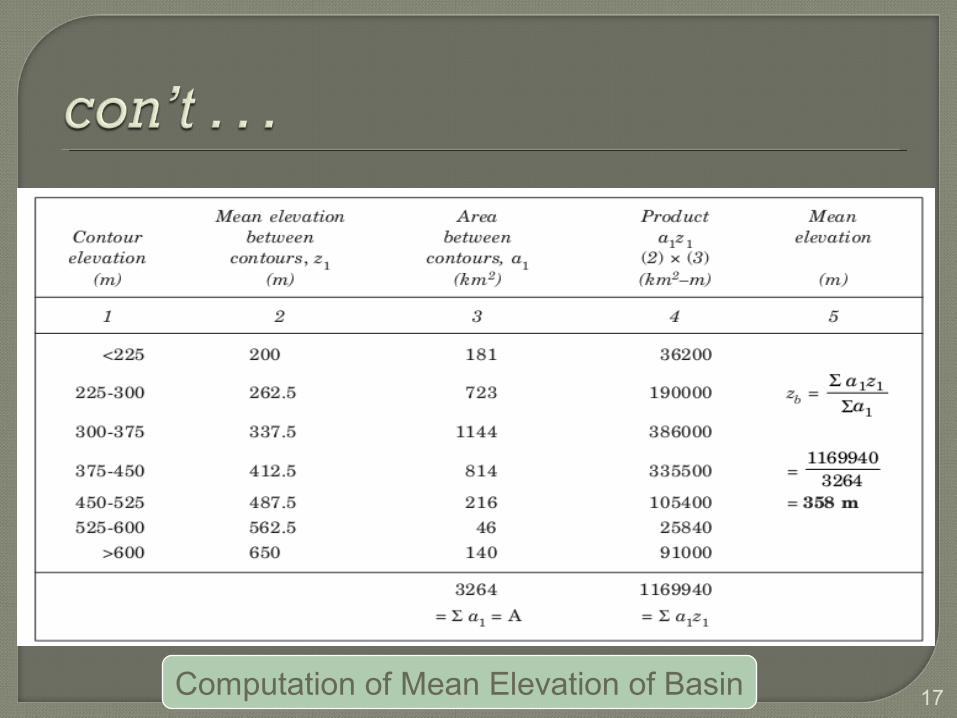
17Computation of Mean Elevation of Basin

18
Computation of Median Elevation of Basin

19
Median Elevation for 50% of total area is read from the curve as 350 m.

Streams may be classified as:1.Influent Streams & Effluent Streams2.Intermittent Streams & Perennial Streams
20

Influent Streams
If the GWT is below the bed of the stream feeds the groundwater resulting in the build up of water mound.
21
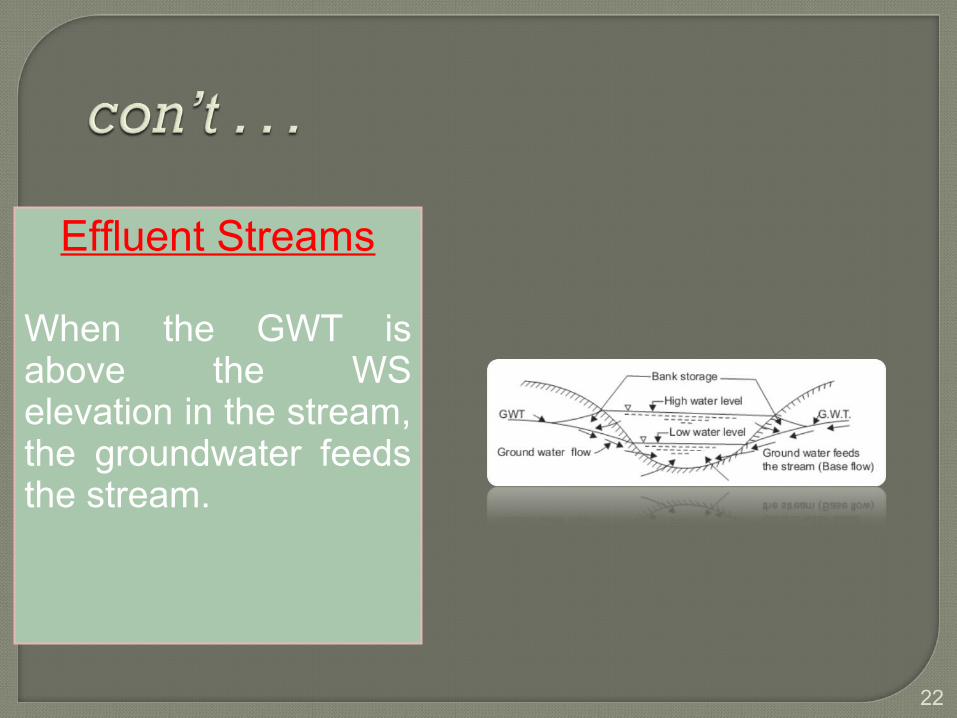
Effluent Streams
When the GWT is above the WS elevation in the stream, the groundwater feeds the stream.
22

Intermittent Streams
If the GWT lies above the bed of the stream during the wet season but drops below the bed during the dry season, the stream flows during wet season but becomes dry during dry season.
23
Perennial Streams
Even in the most severe droughts, the GWT never drops below the bed of the streams & therefore they flow throughout the year.
Perennial Streams
Even in the most severe droughts, the GWT never drops below the bed of the streams & therefore they flow throughout the year.

IsochronesThese are time contours and represent lines of equal travel time that are used to show the time taken for runoff water w/in a drainage basin to reach a lake, reservoir or outlet.
24
25

26

27

28

29

30
Curve

31

32
r=1, correlation is perfect giving a straight line plotr=0, no relationships exist b/w x & yr 1, close linear relationship

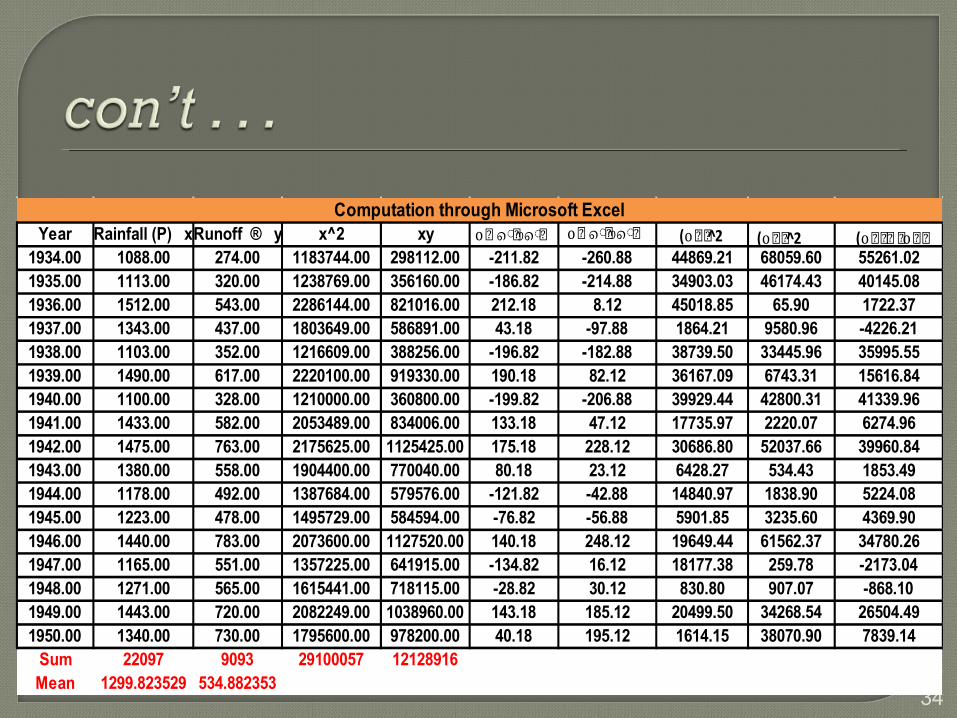
Example: Annual rainfall and runoff data for River M for 17 years (1934-1950) are given below. Determine the expected runoff for an annual rainfall 1050 mm.
33
34
Year Rainfall (P) xRunoff ® y x^2 xy1934.00 1088.00 274.00 1183744.00 298112.00 -211.82 -260.88 44869.21 68059.60 55261.021935.00 1113.00 320.00 1238769.00 356160.00 -186.82 -214.88 34903.03 46174.43 40145.081936.00 1512.00 543.00 2286144.00 821016.00 212.18 8.12 45018.85 65.90 1722.371937.00 1343.00 437.00 1803649.00 586891.00 43.18 -97.88 1864.21 9580.96 -4226.211938.00 1103.00 352.00 1216609.00 388256.00 -196.82 -182.88 38739.50 33445.96 35995.551939.00 1490.00 617.00 2220100.00 919330.00 190.18 82.12 36167.09 6743.31 15616.841940.00 1100.00 328.00 1210000.00 360800.00 -199.82 -206.88 39929.44 42800.31 41339.961941.00 1433.00 582.00 2053489.00 834006.00 133.18 47.12 17735.97 2220.07 6274.961942.00 1475.00 763.00 2175625.00 1125425.00 175.18 228.12 30686.80 52037.66 39960.841943.00 1380.00 558.00 1904400.00 770040.00 80.18 23.12 6428.27 534.43 1853.491944.00 1178.00 492.00 1387684.00 579576.00 -121.82 -42.88 14840.97 1838.90 5224.081945.00 1223.00 478.00 1495729.00 584594.00 -76.82 -56.88 5901.85 3235.60 4369.901946.00 1440.00 783.00 2073600.00 1127520.00 140.18 248.12 19649.44 61562.37 34780.261947.00 1165.00 551.00 1357225.00 641915.00 -134.82 16.12 18177.38 259.78 -2173.041948.00 1271.00 565.00 1615441.00 718115.00 -28.82 30.12 830.80 907.07 -868.101949.00 1443.00 720.00 2082249.00 1038960.00 143.18 185.12 20499.50 34268.54 26504.491950.00 1340.00 730.00 1795600.00 978200.00 40.18 195.12 1614.15 38070.90 7839.14
Sum 22097 9093 29100057 12128916Mean 1299.823529 534.882353
Computation through Microsoft Excelοൌൌൌൌൌ οൌൌൌൌൌ (ο2̂ (ο̂ 2 (οο

35

36

Rational Method
37
General Procedure
Step 1: Determine the drainage area (in acres.)
Step 2: Determine the runoff coefficient (C).
Step 3: Determine the hydraulic length or flow path that will be used to determine the time of concentration.
Step 4: Determine the types of flow (or flow regimes) that occur along the flow path.
Step 5: Determine the time of concentration (Tc) for the drainage area.
Step 6: Use the time of concentration to determine the intensity.
Step 7: Input the drainage area, C value, and intensity into the formula to determine the peak rate of runoff

38

39
Formulas Used
The rational method, used to calculate peak discharge:
Q = C i A
Calculating "C" in heterogeneous terrain:
Estimating travel time of shallow concentrated flow:
Calculating elevation change:
Length of flow × Slope = Elevation change
To calculate total time of concentration:
Tc = Lo + Lsc + Lc

Example:
40
Given Information
A project is to be built in southwest Campbell County, Virginia. The following information was determined from field measurement and/or proposed design data:
Drainage Area: 80 acres 30% - Rooftops (24 acres) 10% - Streets and driveways (8 acres) 20% - Average lawns @ 5% slope on sandy soil (16 acres) 40% - Woodland (32 acres)
LO = 200 ft. (4% slope or 0.04 ft./ft.); average grass lawn. LSC = 1000 ft. (4% slope or 0.04 ft./ft.); paved ditch. LC = 2000 ft. (1% slope or 0.01 ft./ft.); stream channel.

41
1. Drainage area (A) = 80 acres (given).
2. Determine the runoff coefficient (C):
Area × C
Rooftops 24 × 0.9 = 21.6 Streets 8 × 0.9 = 7.2 Lawns 16 × 0.15 = 2.4 Woodland 32 × 0.10 = 3.2 Total 80 34.4
SolutionSolution

42
Determine the hydraulic path: This has already been given.
Determine flow regimes:
a. Overland flow (LO) = 15 minutes (using Seelye chart).
b. Shallow concentrated flow (LSC): 1. Velocity = 4 feet/second (using Diagram 1).
2. LSC = 4.2 minutes (based on the following calculations).
c. Channel flow (LC):
Change in elevation = 20 feet (based on the following calculations). 2000 feet × 0.01 = 20 feet
LC = 13 minutes (using Kirpitch chart).

43

44

45
Time of Concentration = 32.2 minutes (based on the following calculations).
Tc = Lo + Lsc + Lc
Tc = 15 + 4.2 + 13
Tc = 32.2
Intensity = 2.3 in/hr (based on 2-year storm I-D-F curve for Pittsylvania County).
Peak discharge = 79.1 cfs (based on the following calculations).
Q = C i A
Q = (0.43) (2.3) (80)
Q = 79.1

46

Soil Conservation Service(SCS) Curve Number (CN) model estimates precipitation excess as a function of cumulative precipitation, soil cover, land use, and antecedent moisture
SCS developed the method for small basins (< 400 sq. mi.) to "before" and "after" hydrologic response from events.
47
SCS Curve Number Method

Where Q = runoff (in)P = rainfall (in)S = potential maximum retention after runoff begins (in) andIa = initial abstraction (in) S)I(P
)I(PQ
a
2a
+−−=
48

Ia is all losses before runoff begins it includes:
• water retained in surface depressions,
• Water interception by vegetation
• Evaporation and infiltration.
Ia was found to follow: Ia = 0.2*S
S)(P
S)(PQ
2
*8.0
*2.0
+−=
49

S is related to the soil cover conditions of the watershed through the CN.
CN has a range of 0 to 100
50
10CN
1000S −=
con’t . . .

The ultimate total retention, S, and the initial abstraction, Ia, are assumed to be dependent on the following properties of the drainage basin:
Land useSoil Type: A, B, C, DoSoil group A – Well drained sand or gravel, high infiltration rateoSoil group B – Moderately well drained soil, moderate
infiltration rate, with fine to moderately coarse textureoSoil group C – Slow infiltration rate, moderate to fine textureoSoil group D – Very slow infiltration, mainly clay material,
relatively imperviousHydrologic condition – good/fair/poor (rural land use only)Antecedent moisture/runoff condition (AMC) or (ARC)
AMC/ARC I – Dry soilAMC/ARC II – Average soil moistureAMC/ARC III – Wet soil
51

52

53
54

55

56

Example
Solution
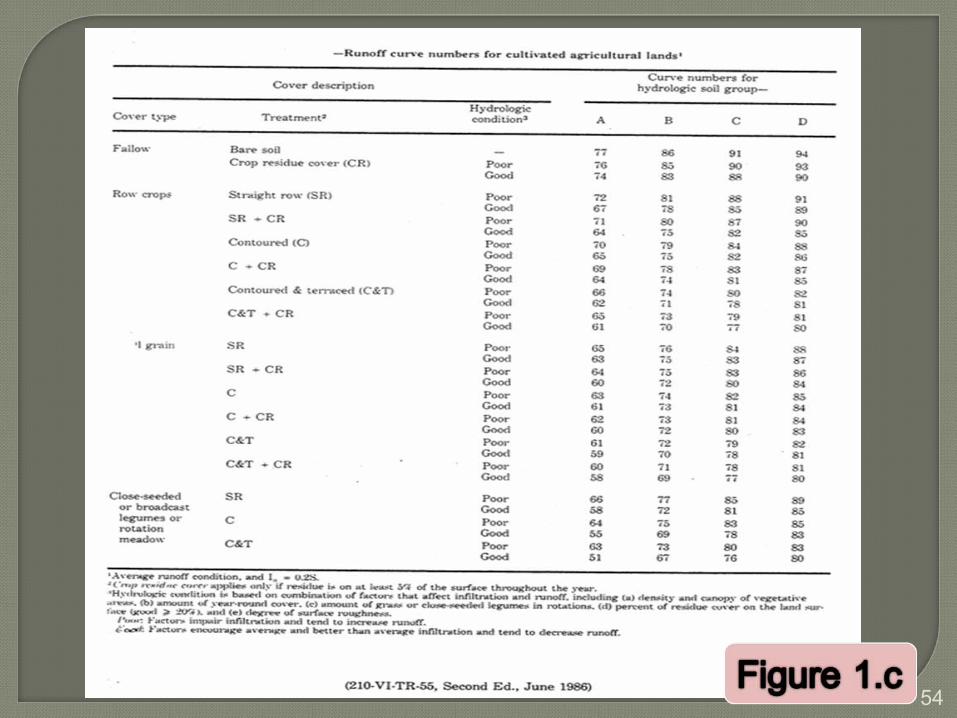
Determine the CN from the Table of Runoff CurveNumbers considering the stated conditions:
57

58

59
The excess rainfall hyetograph may be determined from therainfall hyetograph in one of two ways, depending on whetherstreamflow data are available or not.

60
Example
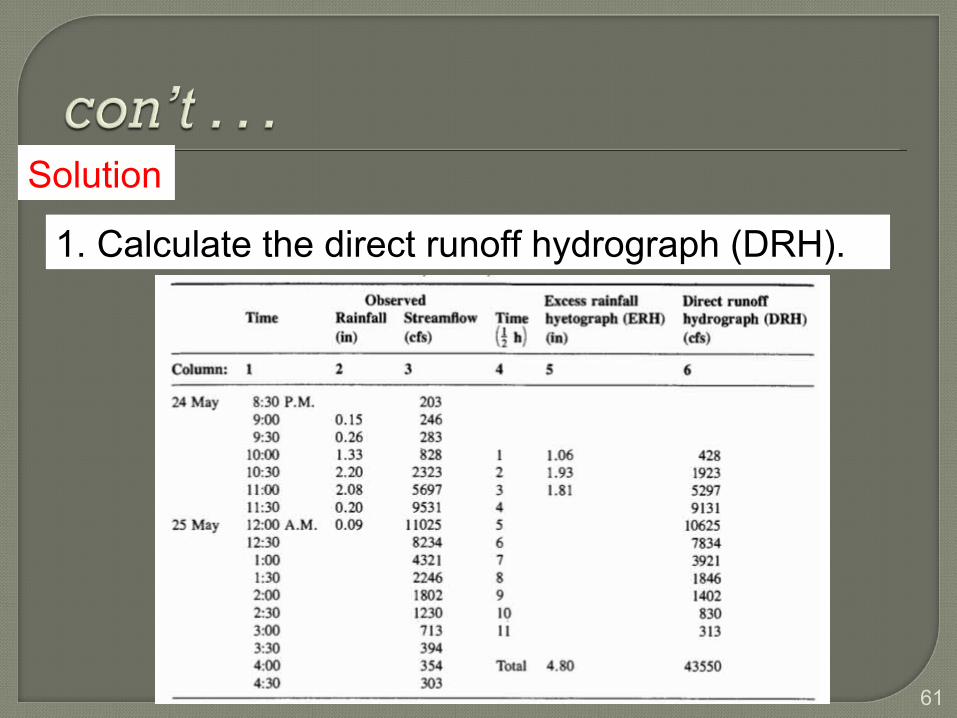
Solution
61
1. Calculate the direct runoff hydrograph (DRH).
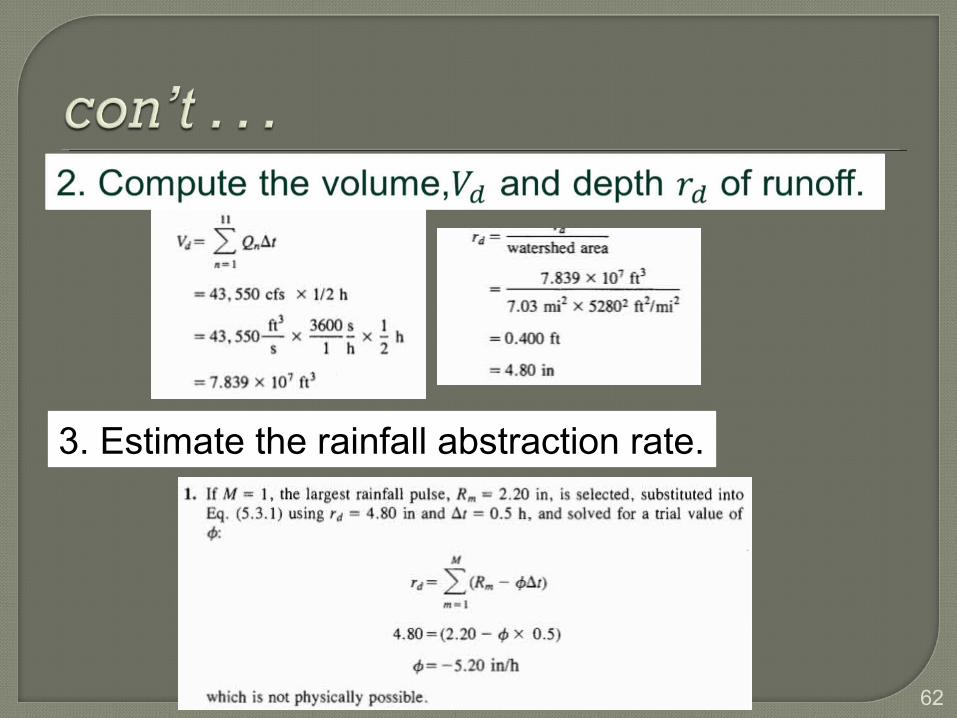
62
3. Estimate the rainfall abstraction rate.

63
4. Calculate the excess rainfall hyetograph.

64

Overland flow Method
65

66
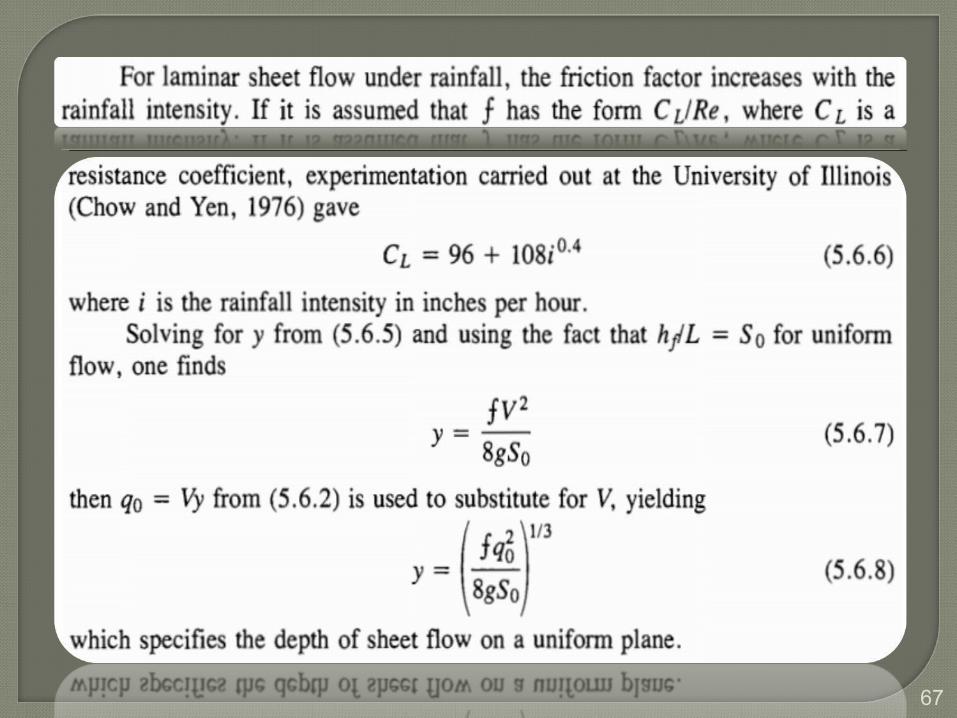
67

Example
Solution
68

69

70

71

72
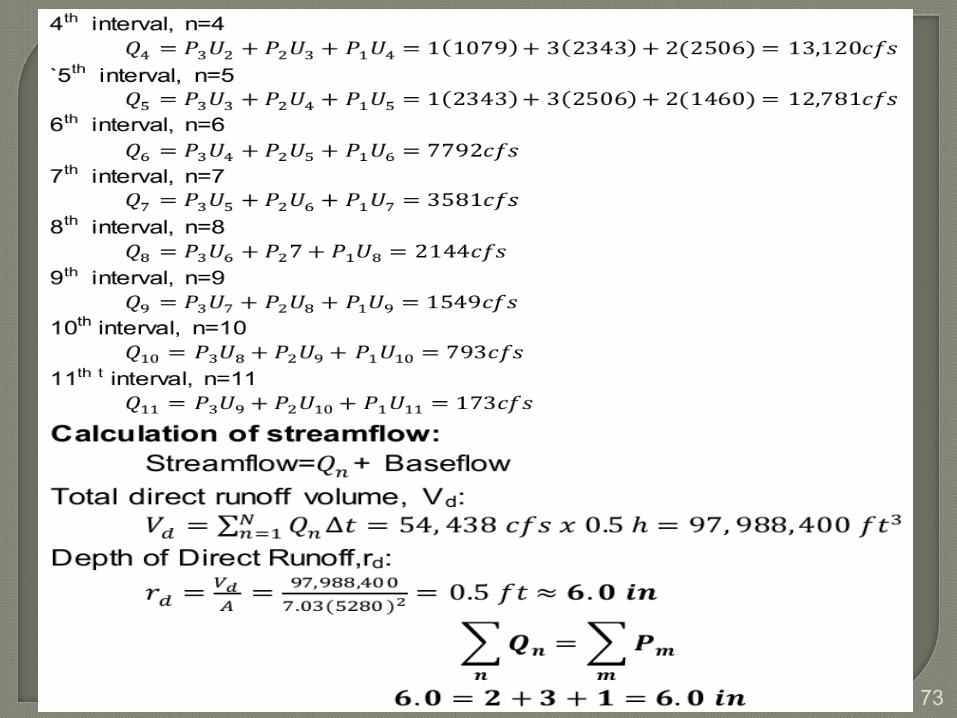
73

74

75

76
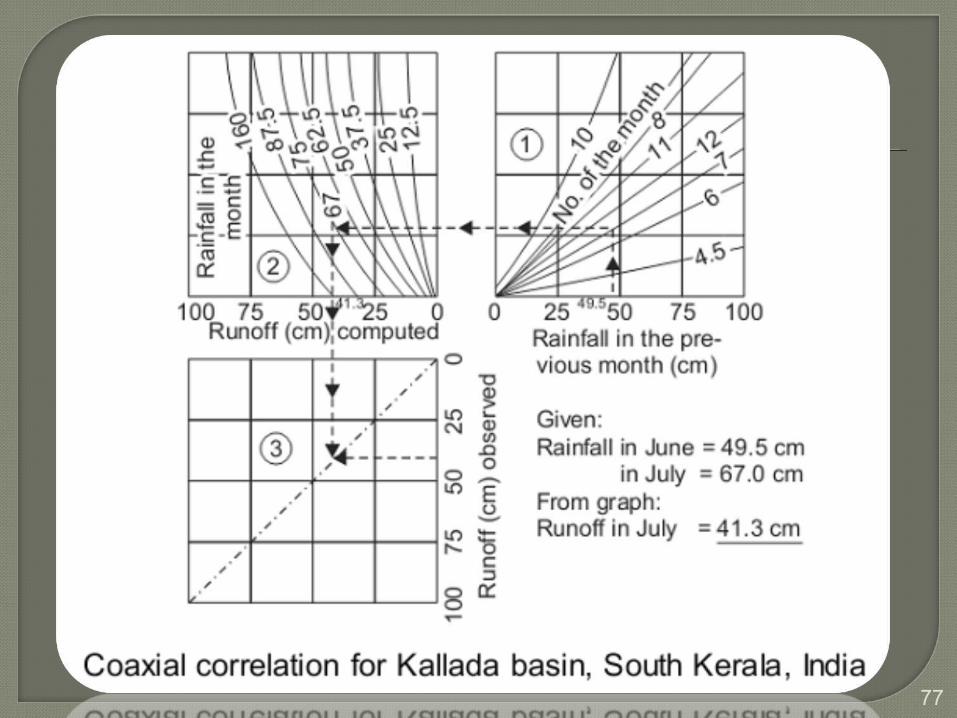
77

Engineering Hydrology by H.M. Raghunath Applied Hydrology by Ven Te Chow, et.al CE 374 K – Hydrology by Daene C. McKinney Rainfall-Runoff Modeling by Prof Ke-Sheng Cheng-
National Taiwan University Runoff Estimation by Dr. Ali Fares-NREM 600, Evaluation
of Natural Resources Management Runoff Estimation by Muhammad Khairudin bin Khalil Part 630 Hydrology Nationall Engineering
Handbook,USDA-NSCS
78

That’s all about RUNOFF.
79