water pollution studies - cpw.state.co.us
TRANSCRIPT

WATER POLLUTION STUDIES Federal Aid Project #F-243R-9 Patrick H. Davies Principal Investigator Stephen Brinkman and Daria Hansen Co-Investigators Russell George, Director Federal Aid in Fish and Wildlife Restoration Job Final Report Colorado Division of Wildlife Fish Research Section Fort Collins, Colorado May, 2002
STATE OF COLORADO Bill Owens, Governor COLORADO DEPARTMENT OF NATURAL RESOURCES Greg Walcher, Executive Director COLORADO DIVISION OF WILDLIFE Russell George, Director Bruce McCloskey, Deputy Director WILDLIFE COMMISSION
Rev. Jesse Langston Boyd, Jr. Mark LeValley Rebecca Frank Arnold Salazar Frank Fuller John Stulp William R. Hegberg Louis Swift
AQUATIC RESEARCH STAFF
Tom Powell, Life Science Researcher V, Coldwater Lakes and Streams Stephen Brinkman, Laboratory Technician Patrick Davies, Physical Science Researcher V, F-243, Water Pollution Studies Mark Jones, Life Science Researcher IV, F-241, Panfish Management Patrick Martinez, Life Science Researcher III, F-242, Coldwater Reservoir
Ecology Mary McAfee, Life Science Researcher IV, F-238, Coldwater Lakes and Reservoirs Barry Nehring, Life Science Researcher IV, F-237, Stream Fisheries
Investigations Rod Van Velson, Life Science Researcher III, F-161, Stream Habitat
Investigations and Assistance Harry Vermillion, Scientific Programmer/Analyst, F-239, Aquatic Data Analysis Rosemary Black, Administrative Assistant
Ted Washington, Federal Aid Coordinator
Jackie Boss, Librarian

Prepared by:______________________________________________
Patrick H. Davies, Physical Science Researcher
______________________________________________ Stephen Brinkman, Laboratory Technician
______________________________________________ Daria Hansen, Research Assistant
Approved by:______________________________________________ Date:____________________________ The results of the research investigations contained in this report represent work of the authors and may or may not have been implemented as Division of Wildlife policy by the Director or Wildlife Commission. JOB PROGRESS REPORT

State: Colorado Study No. F243R-9 Title: Water Pollution Studies Period Covered: July 1, 2001 to June 30, 2002 Principal Investigator: Patrick H. Davies Co-investigators: Stephen F. Brinkman and Daria Hansen Objective: To develop quantitative chemical and toxicological data on the toxicity
of pollutants to aquatic life, investigate water pollution problems in the field, and provide expertise in aquatic chemistry and aquatic toxicology.
STUDY PLAN A: REGULATORY AND LEGAL ACTIVITIES
Objective: To provide technical assistance to regulatory and legal entities toward the development, implementation, and enforcement of water quality standards needed to protect or enhance the aquatic resources of Colorado.
Job A1. Water quality standards for the protection of aquatic life in Colorado
Job Objectives:
A1.1 To apply research results and toxicological information from literature toward the development, enactment, and implementation of water quality standards and appropriate aquatic life use classifications.
A1.2 To provide technical information and/or expert testimony in aquatic
toxicology and aquatic chemistry in agency meetings, regulatory hearings, and/or court litigations as needed to protect aquatic resources of Colorado.
A1.3 To develop or compile toxicological and chemical data on toxicants for which
state or federal governments have not developed a standard.

Job A1.3a. Water quality standards to sustain and protect trout in the Arkansas River below Leadville, CO.
Job Objective: To conduct insitu toxicity tests on rainbow and/or brown trout in the
Arkansas River to assess current conditions and toxic impacts associated with metals entering the Arkansas River from California Gulch and alluvial deposits downstream of Leadville.
ACCOMPLISHMENTS
Pat Davies spent most of his time during this segment working under this study plan. He has continued working with the Attorney General’s Office and the other state and federal Trustee’s on negotiations toward the disposition of Natural Resource Damages (NRD) claims, and the restoration of natural resources in the Arkansas River. Approximately four days a month are spent participating in meetings with the state and federal trustee’s, the Arkansas River Stakeholders group, the Lake Fork Restoration Council, and meetings with EPA and other federal and state trustee’s relating to resource injuries on the NPL Site (Superfund Site) and source control of metals and cleanup. Prepared and published reports on the fisheries of the Upper Arkansas River, and spacial and temporal water quality and metal concentrations along the Arkansas River from the East Fork below Climax and Buena Vista. A report on “Aquatic Habitat Restoration Recommendations for the Upper Arkansas River” was also completed follow several trips with DOW biologists to evaluate habitat restoration needs. I also completed review information and drafted a report on 150 Fluvial Tailing Deposits Sites in the 11-mile reach of the Arkansas River below California Gulch. Deposits were prioritized on the basis of: erosion (entrainment) potential, vegetative cover, and volume of tailings. Monthly sampling continues on the Arkansas River and its tributaries to collect water quality data and total and dissolved metal samples from 18 stations.
Comments were submitted to the Colorado Water Quality Control Commission following as announcement of to the Triennial Review of Water Quality Standards and Classifications on the Arkansas River. I also opposed an increase in the zinc standard requested by Asarco and Resurrection Mining Companies. After reviewing and sending our water quality data to the Heath Department and other parties, I participated in negotiations between the State and Mining Companies to retain the current “temporary modification” standard for zinc until new water quality standards and “point of compliance issues” have resolved through the Natural Resources Damage (NRD) process currently under way. I also reviewed, commented, and attended meetings between the state, EPA, and Resurrection on their site wide sampling plan for superfund site at Leadville. Based on my recommendations and justification, Resurrection has agreed to install continuous flow monitoring equipment on both California Gulch and the Arkansas River below California Gulch.
I became aware that in the year 2000, the Colorado Water Quality Control Commission (CWQCC) had implemented new water quality criteria for cadmium (developed by EPA in 1999) that were more than double its earlier criteria. The chronic criteria for cadmium implemented by the state of Colorado was not adequately

protective of aquatic life. In less than two years, during the fall of 2001, EPA published new cadmium criteria. The chronic criterion were more than 9 times more restrictive than that published in 1999. Through the Dept. of Health, I have petitioned the CWQCC to implement EPA’s new criteria for cadmium. STUDY PLAN B: LABORATORY STUDIES
Objective: To research and develop information on, or analytical tools in, aquatic chemistry and aquatic toxicology to better assess toxic responses of pollutants to aquatic life in laboratory and natural waters, such as the Arkansas River.
Job B1. Chemical Equilibria and Kinetic Effects on the Bioavailability and
Toxicity of Metals to Aquatic Life
Job Objective: To develop analytical methods using Ion Chromatography, ion separation and/or ultrafiltration to measure toxic fractions and effects of chemical kinetics on toxicity of zinc, copper, lead, cadmium and/or silver to Ceriodaphnia dubia, rainbow trout, brown trout and/or fathead minnows in waters of different complexing capacity. Concurrently, investigate effects of chemical kinetics on results obtained from toxicity tests.
Job B2. Use of Biochemical Methods to Measure Disruption of Ion Regulation
and Stress in Aquatic Organisms Exposed to Metals
Job Objective: To develop biochemical methods to measure effects on enzyme systems using electrophoresis or other methods to assess stress in rainbow and brown trout exposed to zinc, copper, lead and/or cadmium.
Job B3. Investigations on the Toxicity of Silver to Aquatic Organisms in Waters of Different Complexing Capacity
Job Objective: To develop acceptable toxicant concentrations of silver for cold-
and warmwater fishes in hard high alkaline, and soft low alkaline waters and assess the toxicity of different silver compounds.
Job B4. Effects of Calcium Hardness, Inorganic and Organic Ligands and
Sediments on Toxicity of Metals to Aquatic Organisms
Job Objective: To determine antagonistic effects of calcium hardness in low

alkaline waters and the effects of specific inorganic and organic ligands and sediments on acute and long-term toxicity of zinc, copper, lead, cadmium, and/or silver to rainbow trout, brown trout and/or fathead minnows.
Job B5. Investigations on Enhanced Toxicity of Unionized Ammonia to Fish at Cold Water Temperatures
Job Objective: To determine effects of temperature on toxicity of unionized
ammonia to rainbow trout and fathead minnows or other warmwater species at optimal and less than 5?C water temperatures.
Job B6. Effects of Episodic Exposure on Toxicity and Sensitivity of Aquatic
Life to Intermittent Exposure to Metals
Job Objective: To determine toxic effects and organism sensitivity to intermittent exposure of zinc, copper, lead, and/or cadmium to rainbow trout, brown trout and/or fathead minnows, and their ability to acquire and/or lose tolerance.
Job B7. Investigations on Enhanced Toxicity of Water-Borne Metals to
Aquatic Life Exposed to Dietary Sources of Metals
Job Objective: To determine effects of water-borne zinc, copper, cadmium, lead and/or manganese on their toxicity to rainbow and brown trout following and/or concurrent with exposure to dietary metals.
Job B8. Investigations on Effects and Interactions of Multiple Metal Exposure
on Toxicity to Aquatic Life
Job Objective: To determine effects of exposure of rainbow trout and/or brown trout to zinc, copper, cadmium, lead, and manganese at different combinations found in Colorado's mining areas. Will require an ability to measure bioavailable forms on metals as outlined in Job B1.
ACCOMPLISHMENTS Acute and chronic toxicity tests evaluating effects of ammonia on brown trout was completed in May Spring 2002. The data are currently being analyzed and will be reported next year. An early life stage test was initiated in May 2002 investigating chronic toxicity of silver

chloride to rainbow trout. The results will be reported next year.
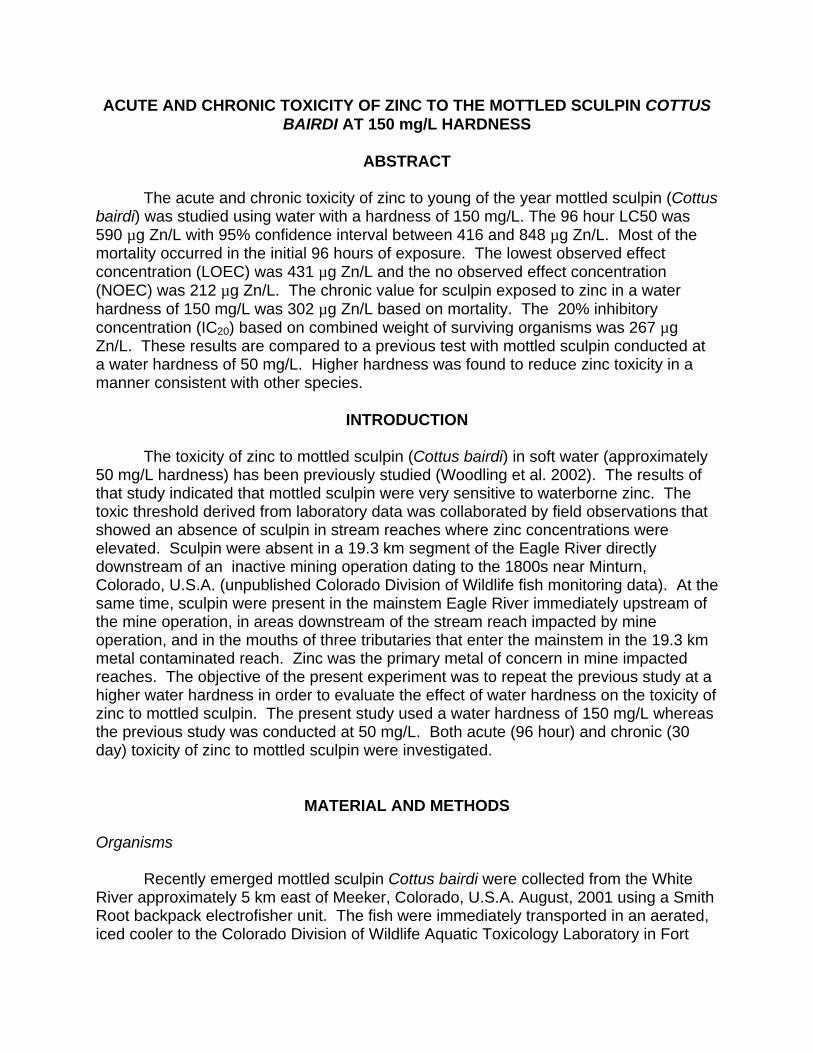
ACUTE AND CHRONIC TOXICITY OF ZINC TO THE MOTTLED SCULPIN COTTUS BAIRDI AT 150 mg/L HARDNESS
ABSTRACT
The acute and chronic toxicity of zinc to young of the year mottled sculpin (Cottus
bairdi) was studied using water with a hardness of 150 mg/L. The 96 hour LC50 was 590 µg Zn/L with 95% confidence interval between 416 and 848 µg Zn/L. Most of the mortality occurred in the initial 96 hours of exposure. The lowest observed effect concentration (LOEC) was 431 µg Zn/L and the no observed effect concentration (NOEC) was 212 µg Zn/L. The chronic value for sculpin exposed to zinc in a water hardness of 150 mg/L was 302 µg Zn/L based on mortality. The 20% inhibitory concentration (IC20) based on combined weight of surviving organisms was 267 µg Zn/L. These results are compared to a previous test with mottled sculpin conducted at a water hardness of 50 mg/L. Higher hardness was found to reduce zinc toxicity in a manner consistent with other species.
INTRODUCTION
The toxicity of zinc to mottled sculpin (Cottus bairdi) in soft water (approximately 50 mg/L hardness) has been previously studied (Woodling et al. 2002). The results of that study indicated that mottled sculpin were very sensitive to waterborne zinc. The toxic threshold derived from laboratory data was collaborated by field observations that showed an absence of sculpin in stream reaches where zinc concentrations were elevated. Sculpin were absent in a 19.3 km segment of the Eagle River directly downstream of an inactive mining operation dating to the 1800s near Minturn, Colorado, U.S.A. (unpublished Colorado Division of Wildlife fish monitoring data). At the same time, sculpin were present in the mainstem Eagle River immediately upstream of the mine operation, in areas downstream of the stream reach impacted by mine operation, and in the mouths of three tributaries that enter the mainstem in the 19.3 km metal contaminated reach. Zinc was the primary metal of concern in mine impacted reaches. The objective of the present experiment was to repeat the previous study at a higher water hardness in order to evaluate the effect of water hardness on the toxicity of zinc to mottled sculpin. The present study used a water hardness of 150 mg/L whereas the previous study was conducted at 50 mg/L. Both acute (96 hour) and chronic (30 day) toxicity of zinc to mottled sculpin were investigated.
MATERIAL AND METHODS Organisms
Recently emerged mottled sculpin Cottus bairdi were collected from the White River approximately 5 km east of Meeker, Colorado, U.S.A. August, 2001 using a Smith Root backpack electrofisher unit. The fish were immediately transported in an aerated, iced cooler to the Colorado Division of Wildlife Aquatic Toxicology Laboratory in Fort

Collins. Upon arrival, fish were immersed in a 3% sodium chloride solution for 3 minutes to remove possible ectoparasites, then placed in a glass aquarium supplied with a mixture of dechlorinated Ft Collins municipal tap water and onsite well water. The mixture approximated that of the White River (hardness 225 mg/L CaCO3, conductivity 450 µS/cm, temperature 18°C). Over the next 36 hours, the amount of well water supplying the aquarium was slowly reduced until the mixture was at a hardness of 150 mg/L CaCO3. Fish were fed a concentrated suspension of brine shrimp nauplii (San Francisco Bay Brand) supplemented with starter trout chow (Silver Cup). Fish were observed feeding on both types of food. Sculpin were acclimated to the water mixture for 25 days prior to initiation of the toxicity test. Four of the original 174 sculpin died during this acclimation period. Toxicant
Zinc was added as reagent grade zinc sulfate heptahydrate (ZnSO4.7H2O)
(Mallincrodt). Chemical stocks for the toxicity test were prepared by dissolving a calculated amount of ZnSO4
.7H2O in deionized water to achieve the nominal stock solution concentration. The resulting stock solution was delivered to the test diluter as described below. New stock solutions were prepared as needed during the tests. Test Methods
A continuous-flow diluter (Benoit et al. 1982) was used to deliver the exposure solutions. The source waters consisted of dechlorinated Fort Collins municipal tap water and an onsite well water mixed to provide a water hardness of 150 mg/L. The conductivity of dilution water was monitored daily to ensure a proper mixture of well and tap water. The diluter was constructed of teflon, polyethylene and polypropylene components with silicone stoppers and Nalgene FDA food grade vinyl tubing. A zinc stock solution was delivered to the diluter via a peristaltic pump (Cole-Palmer model C/L) at a rate of 2.2 mls/minute. The diluter delivered five concentrations of zinc and control. Target zinc concentrations were 800, 400, 200, 100, 50 and 0 µg Zn/L. A flow splitter allocated each concentration equally among four replicate exposure chambers at a rate of 40 mls/minute each. Exposure chambers consisted of polyethylene containers with a capacity of 2.8 liters. Test solutions overflowed from the exposure chambers into a water bath which was maintained at 13 °C using a temperature-controlled recirculator (VWR Scientific Products Recirculator ). A photocell regulated the fluorescent lighting to provide a natural photoperiod for Ft Collins in September.
Five mottled sculpin were randomly placed in each exposure chamber. Mortality was monitored and recorded daily. Sculpin did not receive food during the first 96 hours of exposure but thereafter were fed a concentrated suspension of brine shrimp nauplii supplemented with starter trout chow twice daily on weekdays and once daily on weekends. Exposure continued for a total of 28 days. At the end of the experiment, surviving sculpin were terminally anaesthetized with MS222, patted dry with a paper towel and the length (mm) and weight (g) measured and recorded. During the initial 96 hours, water quality characteristics of exposure water were measured daily in two randomly selected aquaria. Water quality characteristics were
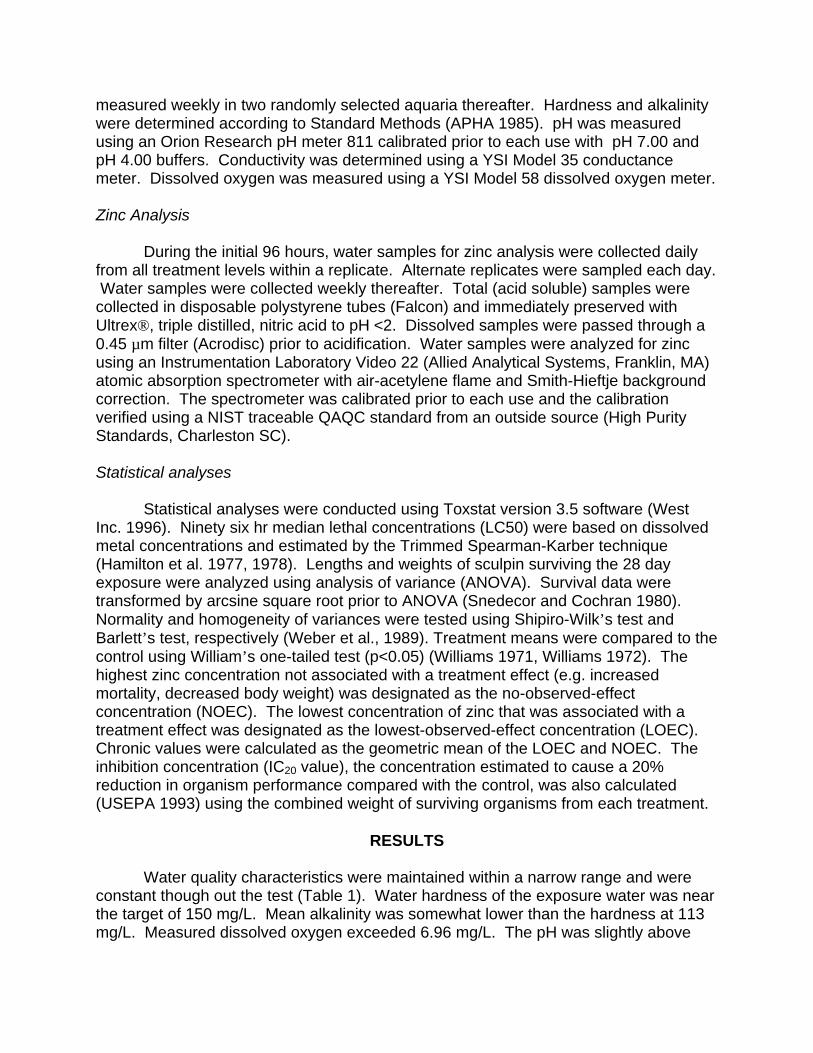
measured weekly in two randomly selected aquaria thereafter. Hardness and alkalinity were determined according to Standard Methods (APHA 1985). pH was measured using an Orion Research pH meter 811 calibrated prior to each use with pH 7.00 and pH 4.00 buffers. Conductivity was determined using a YSI Model 35 conductance meter. Dissolved oxygen was measured using a YSI Model 58 dissolved oxygen meter. Zinc Analysis
During the initial 96 hours, water samples for zinc analysis were collected daily from all treatment levels within a replicate. Alternate replicates were sampled each day. Water samples were collected weekly thereafter. Total (acid soluble) samples were collected in disposable polystyrene tubes (Falcon) and immediately preserved with Ultrex®, triple distilled, nitric acid to pH <2. Dissolved samples were passed through a 0.45 µm filter (Acrodisc) prior to acidification. Water samples were analyzed for zinc using an Instrumentation Laboratory Video 22 (Allied Analytical Systems, Franklin, MA) atomic absorption spectrometer with air-acetylene flame and Smith-Hieftje background correction. The spectrometer was calibrated prior to each use and the calibration verified using a NIST traceable QAQC standard from an outside source (High Purity Standards, Charleston SC). Statistical analyses
Statistical analyses were conducted using Toxstat version 3.5 software (West Inc. 1996). Ninety six hr median lethal concentrations (LC50) were based on dissolved metal concentrations and estimated by the Trimmed Spearman-Karber technique (Hamilton et al. 1977, 1978). Lengths and weights of sculpin surviving the 28 day exposure were analyzed using analysis of variance (ANOVA). Survival data were transformed by arcsine square root prior to ANOVA (Snedecor and Cochran 1980). Normality and homogeneity of variances were tested using Shipiro-Wilk’s test and Barlett’s test, respectively (Weber et al., 1989). Treatment means were compared to the control using William’s one-tailed test (p<0.05) (Williams 1971, Williams 1972). The highest zinc concentration not associated with a treatment effect (e.g. increased mortality, decreased body weight) was designated as the no-observed-effect concentration (NOEC). The lowest concentration of zinc that was associated with a treatment effect was designated as the lowest-observed-effect concentration (LOEC). Chronic values were calculated as the geometric mean of the LOEC and NOEC. The inhibition concentration (IC20 value), the concentration estimated to cause a 20% reduction in organism performance compared with the control, was also calculated (USEPA 1993) using the combined weight of surviving organisms from each treatment.
RESULTS
Water quality characteristics were maintained within a narrow range and were constant though out the test (Table 1). Water hardness of the exposure water was near the target of 150 mg/L. Mean alkalinity was somewhat lower than the hardness at 113 mg/L. Measured dissolved oxygen exceeded 6.96 mg/L. The pH was slightly above

neutral at 7.42. Temperature of exposure water was constant and only varied between 13.1 and 13.8°C. Conductivity ranged between 259 and 300 µS/cm indicating constant water quality conditions. Measured total and dissolved zinc concentrations within a treatment varied little during the acute and chronic phases of the test (Tables 2 and 3, respectively). In both instances, dissolved zinc represented the vast majority of total zinc present in solution. Acute mortality did not occur in concentrations lower than 414 µg Zn/L (Table 2). During the initial 96 hours of the test, sculpin exposed to 414 and 842 µg Zn/L experienced 35% and 65 percent mortality, respectively. Though complete mortality did not occur in any exposures, sufficient mortality occurred in the highest zinc exposure to calculate a median lethal concentration (LC50) using the Trimmed Spearman-Karber technique. The 96 hour LC50 was 590 µg Zn/L with 95% confidence interval between 416 to 848 µg Zn/L. Mortality and associated zinc exposure concentrations at the end of 28 days is shown in Table 3. The 28 day mortality in the two highest zinc exposures (414 and 842 µg Zn/L) increased slightly from the initial 96 hour mortality. These mortalities primarily occurred in the 5 days following the initial 96 hours of the test. Low levels of mortality (20%) occurred in the control and lowest zinc exposures. The mortalities in these two lowest exposures did not occur until the 18th day of the test and continued until test termination. The effect of duration of exposure on mortality for the different zinc exposure concentrations is shown in Figure 1. Mortality of sculpin in the two highest zinc exposure, 431 and 859 µg Zn/L, were significantly greater than control mortality (p<0.05). The lowest observed effect concentration (LOEC) was 431 µg Zn/L and the no observed effect concentration (NOEC) was 212 µg Zn/L. The chronic value for sculpin exposed to zinc in a water hardness of 150 mg/L was 302 µg Zn/L based on mortality. The IC20 based on combined weight of surviving organisms was 267 µg Zn/L which agrees well with the chronic value calculated on the basis of mortality. Significant effects on growth as measured by length and weight were not detected. Upon termination of the test, surviving sculpin were observed to have white spots that were later confirmed by the Colorado Division of Wildlife Fish Health Lab to be ICK.
DISCUSSION
The sculpin used in this test were collected from the same location as the previous study (Woodling et al. 2002) but used a different year class. The test protocol was identical except that well water was added to the source water to produce a target water hardness of 150 mg/L. Alkalinity and conductivity also increased as a result. The mean water temperature of this study was 1.2°C greater than the experiment conducted with a water hardness of 50 mg/L. The 96 hour LC50 from the present study at 150 hardness was 590 µg Zn/L. The 96 hour LC50 for sculpin at a water hardness of 50 mg/L was 156 µg Zn/L (Woodling et al. 2002). The toxicity of many metals is affected by hardness on a log-log basis. The approach used to develop zinc criteria is based on plotting the natural logarithm of the acute value versus the natural logarithm of the hardness (USEPA 1987). Using this approach, the slope for mottled sculpin is 1.210. Calculation of a standard deviation and 95% confidence interval for this slope would require additional testing. This value falls within the range of 0.5603 for bluegill and 1.644 for guppy and is near the pooled mean slope of 0.8473 used in development of

acute zinc criteria (USEPA 1987). The acute-chronic ratio at 50 mg/L hardness was 7.4 (calculated from Woodling et al. 2002) while the ratio at 150 mg/L hardness was 2.0. These values fall within the range of acute-chronic ratios found for freshwater species of 0.7027-41.20 (USEPA 1987). Effects of zinc exposure on growth of mottled sculpin were not detected in either toxicity tests. Growth of salmonids, on the other hand, occur often at lower than lethal levels (Davies and Brinkman 1999, Davies and Brinkman 2002).
Almost all of the mortality in the three highest zinc exposures occurred within the first nine days (Figure 1). Control mortality did not occur until the 22nd day of exposure. The late onset of mortality in the last week of exposure are probably related to ICK infestation and are distinct from the metal related mortality that occurred during the first nine days. The ICK-related mortality only occurred in the lowest two exposures. This suggests that zinc may provide a prophylactic effect against ICK infestation. The presence of ick at the termination of the experiment should cause the results of this experiment to be viewed with caution. Because the ICK did not become a major issue until the latter week of the experiment, the results of the acute phase of the test may be somewhat reliable. However, the possibility of low level ick infection influencing and interacting with the zinc exposure can not be completely discounted. Table 1. Mean, standard deviation and range of water quality characteristics of exposure water during the 28 day zinc toxicity test conducted with mottled sculpin.
pH (S.U.)
Temperatur
e (°C)
Hardness
(ppm CaCO3)
Alkalinity
(ppm CaCO3)
Conductivit
y ( µS/cm)
Dissolve
d Oxygen
(mg O2/L)
Mean
7.42
13.4
156
113.2
276.1
8.41
Std. Dev.
0.07
0.2
6
5.7
11.4
0.56
Rang
e
7.25-7.50
13.1-13.8
147.4-168.6
103.6-121.8
259-300
6.96-9.14
Table 2. Mean zinc concentrations (µg/L) and associated mortality of sculpin following 96 hours of exposure. Standard deviations are in parentheses. Nominal Zn Concentration
(µg/L)
0
50
100
200
400
800
Total Zn Concentration
(µg/L)
<10 (2)
37 (6)
89 (5)
202 (6)
414 (12)
841 (33)
Dissolved Zn Concentration
<10
37
88
201
414
842

(µg/L) (2) (7) (5) (6) (12) (28)
Mortality (%)
0 (0)
0
(0)
0
(0)
0
(0)
35
(34)
65
(19) 96 Hour Median Lethal Concentration (95% confidence interval)= 590 (416-838) µg/L
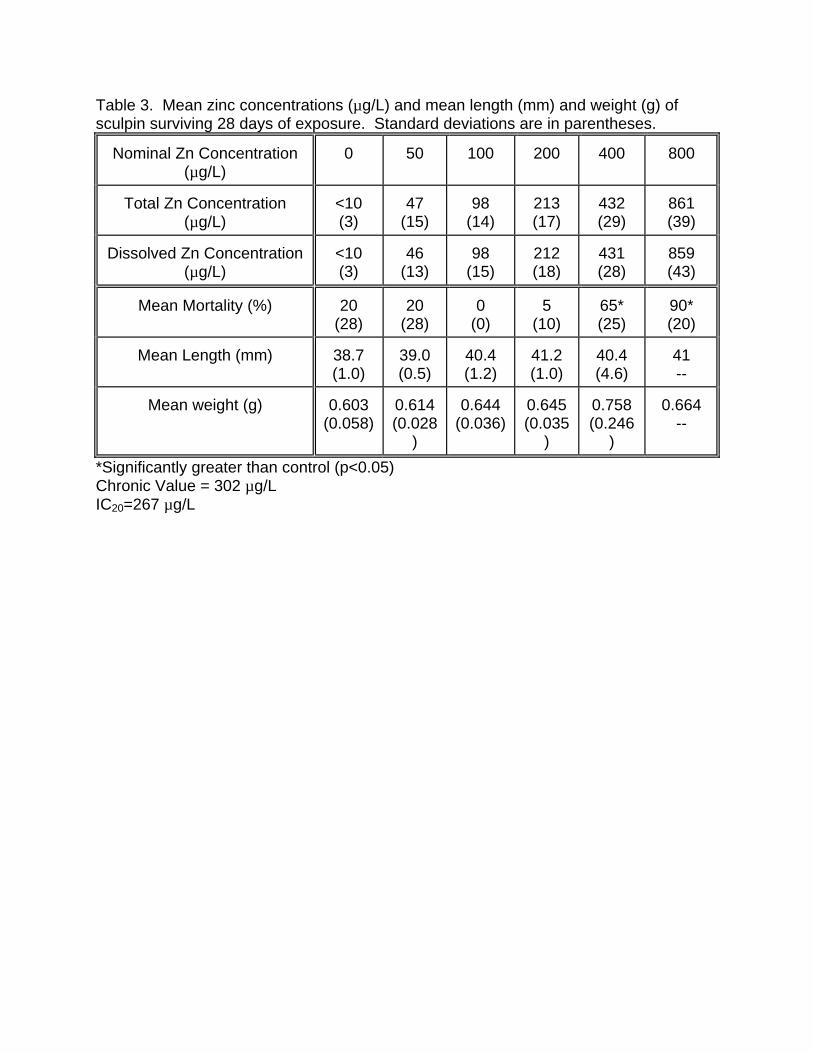
Table 3. Mean zinc concentrations (µg/L) and mean length (mm) and weight (g) of sculpin surviving 28 days of exposure. Standard deviations are in parentheses. Nominal Zn Concentration
(µg/L)
0
50
100
200
400
800
Total Zn Concentration
(µg/L)
<10 (3)
47
(15)
98
(14)
213 (17)
432 (29)
861 (39)
Dissolved Zn Concentration
(µg/L)
<10 (3)
46
(13)
98
(15)
212 (18)
431 (28)
859 (43)
Mean Mortality (%)
20
(28)
20
(28)
0
(0)
5
(10)
65* (25)
90* (20)
Mean Length (mm)
38.7 (1.0)
39.0 (0.5)
40.4 (1.2)
41.2 (1.0)
40.4 (4.6)
41 --
Mean weight (g)
0.603
(0.058)
0.614 (0.028
)
0.644
(0.036)
0.645 (0.035
)
0.758 (0.246
)
0.664
--
*Significantly greater than control (p<0.05) Chronic Value = 302 µg/L IC20=267 µg/L

LITERATURE CITED APHA. 1985. Standard Methods for the Examination of Water and Wastewater, 16th
edn. American Public Health Association, American Water Works Association, and Water Pollution Control Federation. Washington, D.C.
Benoit, D.A., V.R. Mattson, and D.C. Olsen. 1982. A Continuous Flow Mini-diluter
System for Toxicity Testing. Water Research. 16:457-464. Davies, P. H. and S. F. Brinkman. 1999. Federal Aid in Fish and Wildlife Restoration.
Job Progress Report F-243R-6. Colorado Division of Wildlife, Fort Collins, CO, USA.
Hamilton, M.A., R.C. Russo, and R.V. Thurston. 1977. Trimmed Spearman-Karber
method for estimating median lethal concentrations in toxicity bioassays. Env. Sci. Tech. 11(7): 714-719.
Hamilton, M.A., R.C. Russo, and R.V. Thurston. 1978. Correction. Env. Sci. Tech. 12: 417. Snedecor, G. W. and W. G. Cochran. 1980. Statistical Methods. The Iowa State
University Press, Ames Iowa Weber, C. I., et al. 1989. Short-term methods for estimating the chronic toxicity of
effluents and receiving waters to freshwater organisms, second edition. Environmental Monitoring Systems Laboratory, Environmental Protection Agency, Cincinnati, Ohio. EPA/600/4-89/001.
West Inc. 1996. Toxstat Version 3.5. Western EcoSystems Technology, Cheyenne WY. Williams, D. A. 1971. A test for differences between treatment means when several
dose levels are compared with a zero dose control. Biometrics 27:103-117. Williams, D. A. 1972. The comparison of several dose levels with a zero dose control.
Biometrics 27:103-117. Woodling, J. D., S. F. Brinkman, and S. Albeke. 2002. Acute and chronic toxicity of
zinc to the mottled sculpin Cottus bairdi. Environmental Toxicology and Chemistry (Accepted).
U.S. EPA. 1987. Ambient water quality criteria for zinc. EPA-440/5-87-003. National Technical Info USEPA. 1993. A Linear Interpolation Method for Sublethal Toxicity: The Inhibition Concentration
Acute Toxicity of Copper and Zinc Alone and in Combination to Brown Trout (Salmo trutta) in 50 mg/L hardness
ABSTRACT
The acute toxicity of zinc and copper to brown trout in four different ratios was
studied. The toxicity of each metals alone was also measured. Information from the single metal tests were used to estimate the metal concentration lethal to 10, 20, 30, and 40% of test organisms (i.e. LC10, LC20, LC30, and LC40). Additive toxicity was assumed to occur if the LC10 of one metal alone and the LC40 of another metal were combined and result in the mortality of 50% of exposed organisms (LC50). Possible combinations of zinc and copper expected to produce 50% mortality based on additive toxicity were compared to measured LC50s of different combinations of zinc and copper. Results of the experiments indicate that zinc and copper exhibit additive toxicity to brown trout. Low levels of copper may offer some protection against zinc toxicity.
INTRODUCTION Experiments studying the effects of metals to aquatic life are usually conducted
using single metals. Other times, a mixture of metals is studied using a fixed ratio representative of a particular area (e.g. Davies and Brinkman 1997, Davies and Brinkman 2001). Few experiments have systematically investigated the effect of different ratios of two toxicants to study possible interactions such as synergism or antagonism. This may be important contamination of aquatic environments rarely results from a single metal. The experiment that follows evaluated the toxicity of zinc and copper alone and in four different mixtures. The purpose of the experiment is to determine whether combinations of zinc and copper exhibit additive, greater than additive (synergistic), or less than additive (antagonistic) toxicity.
MATERIAL and METHODS
Brown trout were obtained as freshly eyed eggs from the Colorado Division of Wildlife Research Hatchery in Bellevue Colorado. The eggs were spawned from feral brown trout in North Delaney Butte Reservoir in Northern Colorado. The trout eggs and fry were raised in a large fiberglass tank which received flowing dechlorinated Fort Collins municipal tap maintained at about 12°C. Hatching occurred approximately 11 days after receipt of eggs. Brown trout remained as sac fry for about 25 days prior to swimup. Upon swimup, fry were fed appropriately sized Silver Cup trout food four times daily (twice daily on weekends and holidays) at an estimated rate of 2% body weight /day. A concentrated suspension of brine shrimp naupalii (San Francisco brand) was initially added to the trout food diet to help the transition to exogenous feeding. After two weeks, the amount of supplemental brine shrimp was decreased until the diet consisted entirely of dry trout chow. Brown trout were at swimup stage for about 6-9 weeks prior to toxicity tests. Average length and weight of test organisms was 35.4 mm and 0.408 g, respectively.
Three modified continuous-flow diluters (Benoit et al. 1982) were used to deliver

the exposure solutions. The source water consisted of dechlorinated Fort Collins municipal tap water. The diluters were constructed of teflon, polyethylene and polypropylene components with silicone stoppers and Nalgene FDA food grade vinyl tubing. Chemical stock solutions for toxicity tests were prepared by dissolving a calculated amount of reagent grade zinc sulfate heptahydrate (ZnSO4
.7H2O) (Mallinkrodt) and/or copper sulfate pentahydrate (CuSO4
.5H2O) (Mallinkrodt) in deionized water. Chemical stock solutions were delivered to the diluters via peristaltic pumps (Cole-Palmer model C/L) at a rate of 1.6 mls/minute. The diluters delivered five concentrations of exposure solutions with a 50% dilution ratio, and a control. A flow splitter allocated each concentration equally among four replicate exposure chambers at a rate of 40 mls/minute each. Operation of the diluters and toxicant flow were monitored daily to ensure proper operation. Dim fluorescent lighting was on a 12 hour photoperiod. Exposure chambers consisted of polyethylene containers with a capacity of 2.8 liters. Ten randomly selected fish were placed in each exposure chamber. Test solutions overflowed from the exposure chambers into water baths which were maintained at 12°C using temperature-controlled recirculators (VWR Scientific Products Recirculator ). Mortality was monitored frequently during the day and recorded. Mortalities were blotted dry with a paper towel and the lengths (mm) and weights (g) measured and recorded. Each test exposed the fish for a total of 7 days. At the end of the tests, surviving fish from each exposure chamber were terminally anesthetized with MS222, blotted dry with a paper towel and the total lengths (mm) and weights (g) measured and recorded.
Toxicity tests with copper alone and zinc alone were conducted twice at different times to improve reliability of toxicity data. The target concentrations for both zinc tests were 2000, 1000, 500, 250, 125 and 0 µg Zn/L. The target concentrations for one copper test was 100, 50, 25, 12.5, 6.25 and 0 µg Cu/L. The target concentration for the second copper test was 80, 40, 20, 10, 5 and 0 µg Cu/L. In addition to the single metal tests, four test were conducted with different ratios of zinc to copper. The target zinc to copper ratios were 4:1, 8:1, 16:1 and 32:1.
During the first 96 hours of each experiment, water quality characteristics of exposure water were measured daily in two randomly selected exposure chambers from each diluter. Hardness and alkalinity were determined according to Standard Methods (APHA 1985). pH was measured using an Orion Research pH meter 811 calibrated prior to each use with pH 7.00 and pH 4.00 buffers. Conductivity was determined using a YSI Model 35 conductance meter. Dissolved oxygen was measured using a YSI Model 58 dissolved oxygen meter. Total chlorine was measured weekly using the DPD spectrophotometric method (APHA 1985).
During the initial 96 hours, water samples for metals analysis were collected daily from all treatment levels within a replicate. Replicates were alternated each day. Water samples were passed through a 0.45 µm filter (Acrodisc) prior to acidification in order to collect the dissolved fraction. Water samples with copper below 20 µg/L were analyzed with a SH4000 atomic absorption specrophotometer with CTF 188 controlled temperature graphite furnace (Thermo Jarrell Ash, Franklin MA) and using Smith-Hieftje background correction. Analyses of zinc and copper >20 µg/L were analyzed using an Instrumentation Laboratory Video 22 (Allied Analytical Systems, Franklin, MA) atomic absorption spectrometer with air-acetylene flame and Smith-Hieftje background

correction. Spectrometers were calibrated prior to each use and the calibration verified using a NIST traceable external QAQC standard (High Purity Standards, Charleston SC).
Statistical analyses were conducted using Toxstat version 3.5 software (West Inc. 1996). Ninety six hour median lethal concentrations (LC50) were estimated by the Trimmed Spearman-Karber technique (Hamilton et al. 1977, 1978). The probit technique (Finney 1971) was used to estimate LC10, LC20, LC30 and LC40 for the individual metals using the combined data from both single metal toxicity tests.
RESULTS
Mean water quality characteristics from all the tests are shown in Table 4. The ranges show a greater degree of variation than is typical for this water source. The water quality characteristics are separated out into the different experiments in Table 5. Hardnesses were most elevated in the first copper only test (0:1 Zn:Cu I) and the 16:1 test followed by the zinc only second test (1:0 Zn:Cu II). Water hardnesses of the remaining tests were in the range of 45-47 ppm. Alkalinity was similarly elevated in the first copper only test (0:1 Zn:Cu) and the 16:1 test. The pH ranged from a low of 7.00 in the first 1:0 Zn:Cu test to a high of 7.35 in the first 0:1, 16:1 and the 32:1 Zn:Cu ratios. Chlorine was below the detection limit of 20 µg/L.
The mean measured dissolved zinc and copper concentrations for each of the experiments are shown in Tables 6-13. Dissolved metal concentrations were consistent over the duration of each experiment. The associated mean mortality (%) of the brown trout exposed for 96 hours and seven days are also shown in Tables 6-13. In almost all instances, the mortality after seven days occurred within the first 96 hours. Subsequent mortality after the initial 96 hours was the result of a single additional fatality increasing the mean mortality by only 2.5 %. The copper alone and the zinc alone experiments were repeated. This was to provide a greater degree of confidence in the calculation of LC10, LC20 LC30 and LC40 from the Probit analysis. Results from the two copper alone tests (Tables 6 and 7) are quite similar. The two zinc only toxicity tests were much less consistent with each other as the copper alone tests. Zinc exhibited slightly greater toxicity in the first test compared to the second (Tables 12 and 13). Table 8 through Table 11 shows mean measured copper and zinc concentrations and associated mortality of the zinc and copper mixtures. The tables are arranged in increasing ratio of zinc to copper. The data show that for a given copper concentration, mortality increases as the ratio of zinc increases. The 96 hour median lethal concentration (LC50) for each of the tests are summarized in Table 14. This table shows more concisely the effect of different mixtures of zinc and copper on acute mortality of brown trout. This table again illustrates that increasing the ratio of zinc decreases the copper 96 hour LC50.
The combined data of the copper alone and zinc alone tests were used to estimate the LC10, LC20, LC30, and LC40 concentrations for each metal alone. In Figure 1, the LC10, LC20, LC30 and LC40 of copper is plotted respectively against the LC40, LC30, LC20, and LC10 of zinc. The line connecting these points represents the estimated LC50s of mixtures of copper and zinc assuming additive toxicity. The measured LC50s of the mixtures tested in this experiment are plotted on the same

graph. The measured LC50 of the 4:1 and 8:1 Zn:Cu tests fall slightly below the line whereas the 16:1 nearly falls on the line. The LC50 from the 32:1 is far above and to the right of the line.
DISCUSSION
The LC50s from the copper alone test are in agreement with other tests conducted with brown trout in this laboratory. The LC50 from combined data from this experiment was 33.4 µg Cu/L. Davies and Brinkman (2000) reported a copper LC50 of 33.9 µg/L for 92 mm brown trout at 12°C and 57.3 µg/L at 10.8°C. Other LC50s include 30.2 and 39.4 µg/L for unacclimated brown trout (Davies and Brinkman 2002). The reported range of LC50s of zinc to brown trout varies somewhat. Davies and Brinkman (1999) found LC50s of 871, 392 and 1033 µg Zn/L for unacclimated brown trout. The LC50 values for the zinc alone tests reported here are within this range.
Additive toxicity occurs when the toxicity of a mixture is approximately equivalent to that expected from the algebraic summation of the toxicities of the individual chemical present in the mixture (Rand 1995). Thus with additive toxicity, a mixture containing the LC20 of zinc mixed with the LC30 for copper should result in 50% mortality. Less than 50% mortality would indicate antagonism of the mixture. Greater than 50% mortality indicates the two components interact synergistically. The line in Figure 2 represents the estimated LC50s of different mixtures of copper and zinc based on additive toxicity. The proximity of the measured LC50 of the different mixtures indicate copper and zinc toxicities are probably additive. There is some indication from the data that low levels of copper may reduce the toxicity of the zinc. Table 14 shows the presence of low concentrations of copper (approximately a 32:1 ratio Zn:Cu) increased the LC50 for zinc in the mixture to a value much greater than the LC50 from zinc alone. Whether there is some copper antagonism with zinc toxicity or if this is some anomaly requires additional testing.

Table 4. Mean, standard deviation and range of water quality characteristics of used in toxicity tests.
pH (S.U.)
Temperatur
e (°C)
Hardness
(ppm CaCO3)
Alkalinity
(ppm CaCO3)
Conductivit
y ( µS/cm)
Dissolve
d Oxygen
(mg O2/L)
Mean
7.2
12.2
48.6
35.7
89.5
7.41
Std. Dev.
0.2
0.5
4.2
4.1
6.9
0.41
Rang
e
6.61-7.64
11.4-13.5
42.0-57.6
29.2-47.2
77.0-102.8
6.78-8.50

Table 5. Mean and standard deviation (in parentheses) of water quality characteristics of used in each of the toxicity tests.
pH (S.U.)
Temperature
(°C)
Hardness
(ppm CaCO3)
Alkalinity
(ppm CaCO3)
Conductivity
( µS/cm)
Dissolved Oxygen
(mg O2/L)
0:1 Zn:Cu First Test
7.35 (0.18)
12.5 (0.5)
54.5 (1.6)
41.8 (4.2)
99.8 (1.5)
7.71
(0.53)
0:1 Zn:Cu Second Test
7.04 (0.15)
11.6
(0.15)
44.7 (1.9)
32.6 (2.5)
80.8 (3.0)
7.96
(0.22)
4:1 Zn:Cu
7.22 (0.14)
12.4 (0.3)
46.6 (1.0)
34.1 (1.1)
86.2 (3.4)
7.95
(0.27)
8:1 Zn:Cu
7.14 (0.08)
12.1 (0.3)
46.8 (1.4)
34.0 (1.1)
86.8 (1.7)
8.18
(0.19)
16:1 Zn:Cu
7.35 (0.19)
12.4 (0.5)
55.1 (2.0)
41.0 (3.3)
99.4 (1.6)
7.99
(0.25)
32:1 Zn:Cu
7.35 (0.15)
12.4 (0.4)
47.0 (2.4)
35.4 (1.8)
90.7 (2.6)
7.34
(0.28)
1:0 Zn:Cu First Test
7.00 (0.23)
12.4
(0.22)
45.3 (1.8)
32.4 (1.9)
84.4 (2.6)
7.61
(0.46)
1:0 Zn:Cu Second Test
7.12 (0.10)
12.1 (0.4)
49.5 (2.8)
35.0 (2.2)
88.9 (4.3)
7.49
(0.25)

Table 6. Mean measured copper concentrations (µg/L) and associated 96 hour and 7 day mortality (%) of brown trout exposed to copper alone-the first of two tests. Standard deviations in parentheses.
Exposure
0
5 4 3 2
1 Measured Zn
(µg/L)
--
--
--
--
--
--
Measured Cu
(µg/L)
<0.5 (0.1)
6.0
(0.2)
12.0 (0.6)
27.0 (1.0)
54.2 (2.1)
116.0 (2.1)
96 hr
Mortality (%)
0
(0.0)
0
(0.0)
0
(0.0)
17.5
(12.6)
97.5 (5.0)
100 (0.0)
7 day
Mortality (%)
0.0
(0.0)
0.0
(0.0)
2.5
(5.0)
17.5
(12.6)
97.5 (5.0)
100 (0.0)
Table 7. Mean measured copper concentrations (µg/L) and associated 96 hour and 7 day mortality (%) of brown trout exposed to copper alone-the second of two tests. Standard deviations in parentheses.
Exposure
0
5 4 3 2
1 Measured Zn
(µg/L)
--
--
--
--
--
--
Measured Cu
(µg/L)
<0.5 (0.1)
5.9
(0.4)
11.2 (1.1)
22.0 (0.7)
40.6 (2.3)
85.3 (2.5)
96 hr
Mortality (%)
0
(0.0)
0
(0.0)
0
(0.0)
27.5 (9.6)
75.0
(17.3)
100 (0.0)
7 day
Mortality (%)
0.0
(0.0)
0.0
(0.0)
0.0
(0.0)
27.5 (9.6)
75.0
(17.3)
100 (0.0)

Table 8. Mean measured zinc and copper concentrations (µg/L) and associated 96 hour and 7 day mortality (%) of brown trout exposed in a 4:1 ratio Zn:Cu. Standard deviations in parentheses.
Exposure
0
5 4 3 2
1 Measured Zn
(µg/L)
<10 (4)
24 (3)
54 (4)
107 (7)
223 (16)
474 (42)
Measured Cu (µg/L)
<0.5 (0.1)
5.2
(1.1)
12.2 (1.2)
22.8 (3.3)
50.8 (5.2)
111 (11)
96 hr
Mortality (%)
2.5
(5.0)
0.0
(0.0)
0.0
(0.0)
32.5
(22.2)
100 (0.0)
100 (0.0)
7 day
Mortality (%)
2.5
(5.0)
0.0
(0.0)
0.0
(0.0)
37.5
(26.3)
100 (0.0)
100 (0.0)
Table 9. Mean measured zinc and copper concentrations (µg/L) and associated 96 hour and 7 day mortality (%) of brown trout exposed in a 8:1 ratio Zn:Cu. Standard deviations in parentheses.
Exposure
0
5 4 3 2
1 Measured Zn
(µg/L)
<10 (4)
51 (3)
107 (3)
218 (3)
446 (13)
882 (2)
Measured Cu (µg/L)
<0.5 (0.1)
5.6
(0.3)
12.1 (0.5)
24.4 (2.7)
50.2 (1.9)
101 (1.4)
96 hr
Mortality (%)
0.0
(0.0)
0.0
(0.0)
2.5
(5.0)
35.0
(10.0)
100 (0.0)
100 (0.0)
7 day
Mortality (%)
0.0
(0.0)
0.0
(0.0)
2.5
(5.0)
35.0
(10.0)
100 (0.0)
100 (0.0)

Table 10. Mean measured zinc and copper concentrations (µg/L) and associated 96 hour and 7 day mortality (%) of brown trout exposed in a 16:1 ratio Zn:Cu. Standard deviations in parentheses.
Exposure
0
5 4 3 2
1 Measured Zn
(µg/L)
<10 (3)
93 (4)
204 (6)
426 (15)
888 (23)
1756 (6)
Measured Cu (µg/L)
<0.5 (0.1)
4.8
(0.2)
12.3 (0.3)
26.2 (1.3)
53.3 (1.2)
105 (0)
96 hr
Mortality (%)
0
(0.0)
0
(0.0)
2.5
(5.0)
60.0 (8.2)
100 (0.0)
100 (0.0)
7 day
Mortality (%)
0.0
(0.0)
0.0
(0.0)
2.5
(5.0)
62.5
(12.6)
100 (0.0)
100 (0.0)
Table 11. Mean measured zinc and copper concentrations (µg/L) and associated 96 hour and 7 day mortality (%) of brown trout exposed in a 32:1 ratio Zn:Cu. Standard deviations in parentheses.
Exposure
0
5 4 3 2
1 Measured Zn
(µg/L)
<10 (2)
85
(10)
199 (10)
444 (6)
886 (18)
1756 (35)
Measured Cu (µg/L)
<0.5 (0.1)
2.3
(0.4)
5.2
(0.3)
11.6 (0.3)
26.0 (1.0)
51.0 (1.4)
96 hr
Mortality (%)
0
(0.0)
0
(0.0)
0
(0.0)
15.0
(10.0)
100 (0.0)
100 (0.0)
7 day
Mortality (%)
0.0
(0.0)
0.0
(0.0)
0.0
(0.0)
15.0
(10.0)
100 (0.0)
100 (0.0)

Table 12. Mean measured zinc concentrations (µg/L) and associated 96 hour and 7 day mortality (%) of brown trout exposed to zinc alone-the first of two tests. Standard deviations in parentheses.
Exposure
0
5 4 3 2
1 Measured Zn
(µg/L)
<10 (2)
99 (8)
229 (11)
478 (8)
1037 (23)
2272 (82)
Measured Cu (µg/L)
–
–
–
–
–
--
96 hr
Mortality (%)
2.5
(5.0)
0
(0.0)
25.0
(17.3)
62.5
(22.2)
95.0 (5.8)
100 (0.0)
7 day
Mortality (%)
2.5
(5.0)
0.0
(0.0)
25.0
(17.3)
62.5
(22.2)
95.0 (5.8)
100 (0.0)
Table 13. Mean measured zinc concentrations (µg/L) and associated 96 hour and 7 day mortality (%) of brown trout exposed to zinc alone-the second of two tests. Standard deviations in parentheses.
Exposure
0
5 4 3 2
1 Measured Zn
(µg/L)
<10 (1)
99 (3)
217 (5)
486 (15)
1058 (32)
2340 (71)
Measured Cu (µg/L)
--
--
--
--
--
--
96 hr
Mortality (%)
0
(0.0)
0
(0.0)
7.5
(5.0)
50.0
(21.6)
85.0 (5.8)
100 (0.0)
7 day
Mortality (%)
0.0
(0.0)
0.0
(0.0)
7.5
(5.0)
50.0
(21.6)
85.0 (5.8)
100 (0.0)

Table 14. 96 hour median lethal concentrations (LC50) of brown trout exposed to different ratios of zinc and copper. Zn:Cu Ratio
Zinc LC50 (95% CI)
Copper LC50 (95% CI)
0:1 First Test
--
35.8 (33.6-38.2)
0:1 Second Test
--
29.4 (25.9-33.4)
0:1 Combined
--
33.4 (31.0-36.1)
4:1
129 (115-146)
28.1 (24.6-32.0)
8:1
242 (216-271)
27.2 (24.2-30.5)
16:1
391 (346-441)
23.8 (21.1-26.8)
32:1
590 (559-623)
16.2 (15.2-17.2)
1:0 First Test
382 (310-470)
--
1:0 Second Test
508 (426-607)
--
1:0 Combined
429 (377-487)
--

LITERATURE CITED APHA. 1985. Standard Methods for the Examination of Water and Wastewater, 16th
edn. American Public Health Association, American Water Works Association, and Water Pollution Control Federation. Washington, D.C.
Benoit, D.A., V.R. Mattson, and D.C. Olsen. 1982. A Continuous Flow Mini-diluter
System for Toxicity Testing. Water Research. 16:457-464. Davies, P. H. and S. F. Brinkman. 1997. Federal Aid in Fish and Wildlife Restoration.
Job Progress Report F-243R-4. Colorado Division of Wildlife, Fort Collins, CO, USA.
Davies, P. H. and S. F. Brinkman. 1999. Federal Aid in Fish and Wildlife Restoration.
Job Progress Report F-243R-6. Colorado Division of Wildlife, Fort Collins, CO, USA.
Davies, P. H. and S. F. Brinkman. 2000. Federal Aid in Fish and Wildlife Restoration.
Job Progress Report F-243R-7. Colorado Division of Wildlife, Fort Collins, CO, USA.
Finney, D. J. 1971. Probit Analysis, 3rd Edition. Cambridge Press, New York. Hamilton, M.A., R.C. Russo, and R.V. Thurston. 1977. Trimmed Spearman-Karber
method for estimating median lethal concentrations in toxicity bioassays. Env. Sci. Tech. 11(7): 714-719.
Hamilton, M.A., R.C. Russo, and R.V. Thurston. 1978. Correction. Env. Sci. Tech. 12: 417. Rand, G.M., ed. 1995. Fundamentals of Aquatic Toxicology, Second Edition. Taylor &
Francis, Bristol, Pennsylvania. West Inc. 1996. Toxstat Version 3.5. Western EcoSystems Technology, Cheyenne WY. Williams, D. A. 1971. A test for differences between treatment means when several
dose levels are compared with a zero dose control. Biometrics 27:103-117. Williams, D. A. 1972. The comparison of several dose levels with a zero dose control.
Biometrics 27:103-117.

Toxicity, acclimation and deacclimation of early life stage brown trout exposed to copper in water hardness of 50 mg/L.
ABSTRACT
A chronic test studying the effects of copper exposure to early life stage brown trout was conducted with a water hardness of 50 mg/L. After 67 days of exposure, exposure to 18.5 µg Cu/L resulted in decreased survival in 18.5 µg Cu/L and exposure to 10.4 µg/L reduced growth of fry. The chronic value for brown trout exposed to copper was 13.9 µg Cu/L on the basis of survival and 8.1 µg Cu/L on the basis of growth. Brown trout surviving the ELS test were subjected to an acute challenge to test for acclimation to copper. The median lethal concentrations (LC50s) of brown trout exposed to 18.5 and 10.4 µg Cu/L were about 50% greater than brown trout exposed to 5.5 µg Cu/L and the unexposed control. Acclimation was lost within 4 weeks following return to copper free-water.
INTRODUCTION
Brown trout are an important component of Colorado ecosystems in many headwater streams. Some of these streams are impacted by heavy metal contamination as a result of past mining activity. Exposure to low concentrations of copper often results in acclimation of an organism which enables it to withstand levels that would otherwise be toxic (Buckley et al. 1982, McCarter and Roch 1983, Dixon and Sprague 1981,Yamamoto and Inoue 1985). This acclimation however may come at the expense of growth. Furthermore, the acclimation is transient and can be rapidly lost following a return to clean water. The goal of this study is to determine the effect of chronic copper exposure on early life stage brown trout survival and growth. Measure the degree of acclimation associated with exposure to sublethal levels of copper. And finally to determine if deacclimation occurs following the return of brown trout to clean, undosed water.
MATERIAL and METHODS Early Life Stage Exposure
A modified continuous-flow diluter (Benoit et al. 1982) was used to deliver the exposure solutions. The source water consisted of dechlorinated Fort Collins municipal tap water. The diluter was constructed of teflon, polyethylene and polypropylene components with silicone stoppers and Nalgene FDA food grade vinyl tubing. Chemical stock solutions for preexposure and toxicity tests were prepared by dissolving a calculated amount of reagent grade copper sulfate pentahydrate (CuSO4
.7H2O) (Mallinkrodt) in deionized water. The chemical stock solution was delivered to the diluter via a peristaltic pump (Cole-Palmer model C/L) at a rate of 1.5 mls/minute. New stock solutions were prepared as needed during preexposure and toxicity tests. The diluter delivered five concentrations of metal mixture with a 50% dilution ratio and control. Target concentrations of copper for the early life stage exposures were 80, 40,
20, 10, 5 and 0 µg Cu/L. A flow splitter allocated each concentration equally among four replicate exposure chambers at a rate of 40 mls/minute each. Operation of the diluter and toxicant flow were monitored daily to ensure proper performance. Exposure chambers consisted of polyethylene containers with tinted polyethylene covers and a capacity of 2.8 liters. Test solutions overflowed from the exposure chambers into a water bath which was maintained at 12°C using a temperature-controlled recirculator (VWR Scientific Products Recirculator ). A photocell regulated the fluorescent lighting to provide a natural photoperiod for Ft Collins during December and January.
Brown trout embryos were obtained as eyed eggs from the Colorado Division of Wildlife Research Hatchery in Bellevue Colorado. The eggs were spawned from feral brown trout in North Delaney Butte Reservoir in Northern Colorado. Eighty brown trout eggs were counted and placed into each exposure chamber. Hatching of eyed eggs occurred approximately three days after start of exposure. Fry reached swimup stage about three weeks after hatch. Fry were fed appropriately sized Silver Cup trout food four times daily (twice daily on weekends and holidays) at an estimated rate of 2% body weight /day. The trout food diet was supplemented with a concentrated suspension of brine shrimp naupalii (San Francisco brand). Mortality of eggs and fry were monitored and recorded daily. Early life stage exposure continued for six weeks following swimup for a total of 67 days of exposure. At the end of the ELS exposure, 12 fish from each exposure chamber were randomly removed, terminally anesthetized, blotted dry with a paper towel, and the lengths and weights were recorded in order to assess the effect of copper exposure on growth of brown trout.
Water quality characteristics of exposure solutions were measured weekly in all treatment levels within a replicate. Replicates were alternated each week. Hardness and alkalinity were determined according to Standard Methods (APHA 1985). pH was measured using an Orion Research pH meter 811 calibrated prior to each use with pH 7.00 and pH 4.00 buffers. Conductivity was determined using a YSI Model 35 conductance meter. Dissolved oxygen was measured using a YSI Model 58 dissolved oxygen meter.
Water samples for copper analyses were collected weekly from each treatment level with surviving fry. Water samples were collected from a single replicate which was alternated each week. Total (acid soluble) samples were collected in disposable polystyrene tubes (Falcon) and immediately preserved with Ultrex® triple distilled nitric acid to pH <2. Dissolved samples were passed through a 0.45 µm filter (Acrodisc) prior to acidification. Water samples with copper concentrations greater than 20 µg/L were analyzed using an Instrumentation Laboratory Video 22 (Allied Analytical Systems, Franklin, MA) atomic absorption spectrometer with air-acetylene flame and Smith-Hieftje background correction. Lower levels of copper were analyzed using a Thermo Jarrell Ash SH4000 spectrometer with a CTF controlled temperature graphite furnace. The spectrometers were calibrated prior to each use and the calibration verified using a NIST traceable QAQC standard from an outside source (High Purity Standards, Charleston SC). Tests of acclimation and deacclimation
Four exposure levels from the early life stage experiment had sufficient number

of surviving organisms to conduct tests to evaluate acclimation to copper. A toxicity test was conducted on each of these groups and the 96 hour median lethal concentration was compared to the preexposure control to determine acclimation. Using a diluter identical to the preexposure diluter, each preexposure group was placed into a single replicate so that four unreplicated tests were conducted simultaneously. The first replicate received fish from the preexposure control, the second replicate received fish from the 5 µg Cu/L preexposure, the third replicate received fish from the 10 µg Cu/L preexposure and the remaining replicate received fish from the 20 µg Cu/L preexposure. Each exposure chamber contained 12 fish, three from each of the preexposure replicates. Target exposure concentrations during the acclimation test were 160, 80, 40, 20, 10 and 0 µg Cu/L. Exposure continued for seven days. Fish were not fed during the initial 96 hours of exposure and were fed at a rate of 1% body weight/day thereafter. At the end of the 7 day exposure, fish were terminally anaesthetized, blotted dry with a paper towel, and lengths and weights measured and recorded.
Water quality characteristics were measured on all exposure chambers within a replicate on two separate occasions during the initial 96 hours of the test. Water quality characteristics were determined as described above for the Early Life Stage test. Water samples for metal analyses were collected and analyzed as described above for the Early Life Stage test except that samples were collected daily during the initial 96 hours of the test.
After the start of the acclimation test, the copper toxicant delivery to the fish remaining from the ELS and acclimation test was stopped so that all exposure chambers previously receiving copper-dosed water received only clean dilution water. These fish were allowed to deacclimate for a period of four weeks. Following this deacclimation period, toxicity tests were again conducted. As before, 96 hour median lethal concentrations were again compared to preexposure control to assess the extent of deacclimation. Test methods for deacclimation were identical with the exception of the target copper concentrations which were 100, 50, 25, 12.5, 6.2 and 0 µg Cu/L. Statistical analyses
Statistical analyses were conducted using Toxstat version 3.5 software (West Inc. 1996). Hatching success and survival data were transformed by arcsine square root prior to ANOVA (Snedecor and Cochran 1980). Normality and homogeneity of variances were tested using Shipiro-Wilk’s test and Bartlett’s test, respectively (Weber et al., 1989). Treatment means were compared to the control using William’s one-tailed test (p<0.05) (Williams 1971, Williams 1972). The highest copper concentration not associated with a treatment effect (e.g. decreased survival, decreased body weight) was designated as the no-observed-effect concentration (NOEC). The lowest concentration of copper that was associated with a treatment effect was designated as the lowest-observed-effect concentration (LOEC). Chronic values were calculated as the geometric mean of the LOEC and NOEC. The inhibition concentration (IC20 value), the concentration estimated to cause a 20% reduction in organism performance compared with the control, was also calculated (USEPA 1993) using the combined weight of surviving organisms from each treatment. Ninety six hour median lethal

concentrations (LC50) were based on mean measured dissolved metal concentrations and estimated by the Trimmed Spearman-Karber technique (Hamilton et al. 1977, 1978). The LC50s of each preexposure group were compared with the preexposure controls. Non overlap of 95% confidence intervals was used to determine a statistical difference.
RESULTS Early Life Stage Exposure
The results of water quality characteristics measured during the Early Life Stage test are shown in Table 15. Water quality characteristics were consistent over the course of the experiment. Hardness was just under 50 mg/L and alkalinity around 35 mg/L. Temperature was very close to the target of 12°C and pH was slightly over neutral at 7.5. Conductivity was just under 100 µS/cm and dissolved oxygen acceptable for trout.
Dissolved concentrations of copper during the Early Life Stage exposure were in most cases slightly lower than the measured total (Table 16). Hatching success of the brown trout eggs was very high and exceeded 97% in all treatments (Table 16). Survival and hatching success of brown trout eggs exposed to copper for three days were unaffected by copper concentrations used in this test. Survival of sac fry exceeded 95% in copper exposures of 10.4 µg Cu/L or less but was significantly reduced at 18.5 µg Cu/L (p<0.05) and virtually zero at copper concentrations of 38 µg Cu/L. All sac fry exposed to 82 µg Cu/L died. Mortality of sac fry tended to occur shortly after hatching with a large majority taking place within 2 or 3 days of hatch. Survival through the 67 days of Early Life Stage exposure was greater than 80% in the lower exposures and control. Survival was significantly reduced at dissolved copper concentrations of 18.5 µg Cu/L and greater (p<0.05). The no observed effect concentration (NOEC) based on lethality is 10.4 µg Cu/L and the lowest observed effect concentration (LOEC) is 18.5 µg Cu/L. The chronic value based reduced survival as an effect was 13.9 µg Cu/L. The effect of copper exposure on growth of ELS brown trout is shown in Table 17. Mean length and weight of all copper-exposed brown trout were lower than the control though this effect was significant only for copper exposures 10.4 µg Cu/L and greater. The LOEC based on length and weight for copper exposure was 10.4 µg Cu/L and the NOEC was 5.5 µg Cu/L. The chronic value based on growth effects is 8.1 µg Cu/L. Acclimation The water quality characteristic of the acclimation test are shown in Table 18. Water quality characteristics are virtually identical conditions during the ELS phase (see Table 15 for comparison). Measured dissolved and total copper concentrations were consistent throughout the course of the acclimation challenge (Table 19). As with the preexposure phase, total copper is largely present as dissolved. Survival of brown trout fry preexposed to 18.5, 10.4, 5.5 µg Cu/L and the preexposure control are shown with associated copper concentrations in Table 19. The dose-response relationship shown in Table 19 indicate a greater tolerance for brown trout preexposed to 10.4 and 18.5 µg Cu/L compared the 5.5 µg Cu/L preexposure and the preexposure control. For example, no brown trout preexposed to 5.5 µg Cu/L and the preexposure control survived exposure to 44 µg Cu/L whereas 50% and 58.3% survived following preexposure to 10.4 and 18.5 µg Cu/L, respectively. In the 23 µg Cu/L exposure, low levels of mortality occurred for the preexposure control and the 5.5 µg Cu/L preexposure but none for the 10.4 and 18.5 µg Cu/L preexposures. There was little difference in the survival pattern between the preexposure control and the 5.5 µg Cu/L

preexposure indicating a lack of acclimation at this level of preexposure. The mortality pattern of the 10.4 and 18.4 µg Cu/L preexposures were also similar to each other which suggests that increasing preexposure to copper at these two levels did not lead to increased acclimation. These trends are illustrated in Table 20 which shows the 96 hour median lethal concentration (LC50) of the four preexposure groups. The LC50s of the preexposure treatments fall into two distinct groups. The LC50 of the preexposure control and the 5.5 µg Cu/L are nearly the same. The LC50 of the two higher preexposure groups are significantly greater than the preexposure control but are nearly identical to each other. Deacclimation
The water quality measured during the acute toxicity test conducted following 4 weeks of deacclimation is shown in Table 21. Water quality characteristics are similar to those during the preexposure phase (Table 15) and the acclimation challenge (Table 19). Measured total and dissolved copper concentrations varied little over the course of the deacclimation toxicity test (Table 22). The dissolved copper comprised a majority of the total copper as was the case for the preexposure phase and the acclimation challenge. The results of the acute test conducted on the different preexposure groups deacclimated for 4 weeks are also shown in Table 22. The survival patterns of the four preexposure groups are all very similar. Table 23 shows the 96 hour LC50s for the acute tests conducted on the four preexposure treatments following four weeks deacclimation. Substantial overlap of the 95% confidence interval indicate no statistical difference of any of the preexposed groups from the preexposure control.
DISCUSSION
Copper can be a major pollutant in mining impacted areas such as upper Clear Creek in Colorado. Previous studies investigating the chronic toxicity of copper to brown trout is limited to a single test (McKim et al. 1978). The chronic values derived from that test are substantially higher than those found from this test. The chronic value from McKim et al. 1978 was 30.8 µg Cu/L based on standing crop (biomass at test termination). The present study derived a chronic value for copper of 13.9 µg Cu/L on the basis of mortality and 8.1 µg Cu/L on the basis of growth. The water hardness of the tests were both near 50 mg/L. However, mean water temperature used by McKim et al was 5.5°C compared to 11.9°C for our test. The much lower temperature is the most likely reason for their lower reported toxicity.
Several experiments have been conducted evaluating acclimation of salmonids to copper (Buckley et al. 1982, McCarter and Roch 1983, Dixon and Sprague 1981,Yamamoto and Inoue 1985.) however no work has been done using brown trout. The degree of brown trout acclimation to copper found in this test was relatively small. Only about 50% increase in the LC50 was observed. The lowest copper preexposure, 5.5 µg Cu/L, had a slightly lower (but non significant) LC50 than the preexposure control. Dixon and Sprague (1981) had a similar find during an investigation of duration and magnitude of copper exposure on resulting degree of acclimation to copper in rainbow trout. They found that rainbow trout required exposure to about 0.18 the lethal level for an acclimation response to occur. At lower levels of exposure (0.09), there was

no acclimation but rather increased sensitivity. This experiment found that increasing the level of preexposure from 10.4 to 18.5
µg Cu/L did not result in an increase in the degree of acclimation. Preexposure to 18.5 µg Cu/L resulted in the same degree of acclimation as preexposure to 10.4 µg Cu/L. These two preexposure groups both experienced an increase in tolerance to copper by about 50% greater than unexposed brown trout. The acclimation response was lost following a return to copper free water for 4 weeks. This loss of acclimation argues against the practice of setting water quality standards in metal contaminated streams based on the ability of fish to acclimate to metals. This acclimation could be lost during spring runoff when dilution from snowmelt substantially reduce metal concentrations in streams. Acclimation could be similarly lost following migration of fish into uncontaminated tributaries. Preexposure to copper and the resulting acclimation response apparently has a metabolic cost in that the growth of brown trout was significantly reduced. Reduced growth leads to an increased risk of predation, increased specific metabolism and reduced swimming speed which limits available habitat for fry and could lead to lower overwinter survival.

Table 15. Mean, standard deviation and range of water quality characteristics of exposure water used during copper exposure to early life stage brown trout.
pH (S.U.)
Temperatur
e (°C)
Hardness
(ppm CaCO3)
Alkalinity
(ppm CaCO3)
Conductivit
y ( µS/cm)
Dissolve
d Oxygen
(mg O2/L)
Mean
7.53
11.9
48.7
35.2
94.9
7.88
Std. Dev.
0.16
0.6
5.3
3.8
5.8
0.94
Rang
e
7.25-7.90
10.3-13.5
37.4-58.0
26.4-40.8
85.6-117
5.7-9.6
Table 16. Mean measured total and dissolved copper concentrations (µg/L) and associated hatching success, sac fry and swimup fry survival (%) of brown trout. Standard deviations in parentheses.
Measured Total Cu (µg/L)
1.3
(1.4)
5.8
(2.3)
11.3 (1.0)
20.9 (2.6)
41.6 (2.5)
81.5 (0.7)
Measured Dissolved
Cu (µg/L)
<1.0 (0.8)
5.5
(2.1)
10.4 (1.6)
18.5 (2.3)
38.2 (4.2)
82.0 (1.4)
Hatching Success
(%)
98.8 (1.0)
97.8 (2.1)
99.1 (0.6)
99.1 (0.6)
97.5 (1.0)
98.1 (1.6)
Sac Fry Survival
(%)
95.9 (2.1)
95.3 (1.9)
98.8 (1.0)
71.6* (9.7)
5.3* (2.8)
0* (0)
Swimup Fry Survival
(%)
89.1 (3.1)
80.6 (7.8)
90.3 (3.3)
57.2* (6.2)
2.8* (1.9)
0* (0)
*Significantly lower than control (p<0.05) Chronic Value = 13.9 µg/L

Table 17. Mean measured total and dissolved copper concentrations (µg/L) and associated mean length (mm) and weight (g) of brown trout surviving 67 days of exposure. Standard deviations in parentheses.
Measured Total Cu (µg/L)
1.3
(1.4)
5.8
(2.3)
11.3 (1.0)
20.9 (2.6)
41.6 (2.5)
81.5 (0.7)
Measured Dissolved
Cu (µg/L)
<1.0 (0.8)
5.5
(2.1)
10.4 (1.6)
18.5 (2.3)
38.2 (4.2)
82.0 (1.4)
Mean Length (mm)
31.6 (0.3)
30.8 (0.4)
29.7* (0.6)
27.9* (1.2)
26.4* (2.1)
--
Mean Weight (g)
0.229
(0.013)
0.210
(0.014)
0.178* (0.022)
0.158* (0.026)
0.162* (0.025)
--
*Significantly lower than control (p<0.05) Chronic Value = 8.1 µg/L Table 18. Mean, standard deviation and range of water quality characteristics of exposure water used during copper acclimation test.
pH (S.U.)
Temperatur
e (°C)
Hardness
(ppm CaCO3)
Alkalinity
(ppm CaCO3)
Conductivit
y ( µS/cm)
Dissolve
d Oxygen
(mg O2/L)
Mean
7.5
11.6
51.2
35.4
96.8
8.53
Std. Dev.
0.04
0.1
0.7
0.7
1.7
0.27
Rang
e
7.42-7.56
11.4-11.8
50.2-52.0
34.2-36.2
95.1-99.8
8.1-8.8

Table 19. Mean measured total and dissolved copper (µg/L) concentrations and associated survival (%) of 4 week post swimup brown trout fry preexposed to different concentrations of copper. Standard deviations in parentheses.
Measured Total Cu (µg/L)
<1.0 (0.1)
12.7 (0.6)
24.0 (0.0)
44.4 (2.9)
85.3 (3.8)
169 (3)
Measured Dissolved
Cu (µg/L)
<1.0 (0.2)
12.4 (0.3)
23.0 (1.0)
44.2 (1.5)
85.6 (2.5)
169 (0)
Preexposure Control
100
100
91.7
0
0
0
5.5 µg/L Preexposure
100
100
75
0
0
0
10.4 µg/L
Preexposure
100
100
100
50
0
0
18.5 µg/L
Preexposure
91.7
91.7
100
58.3
0
0
Table 20. 96 hour median lethal concentrations and 95% confidence intervals of brown trout preexposed to 5.5, 10.4, 18.5 µg Cu/L and the preexposure control.
96 hr LC50 95% Confidence Interval
Preexposure Control
30.2
27.3-33.5
5.5 µg/L Preexposure
27.2
23.2-31.9
10.4 µg/L Preexposure
44.3*
36.6-53.5
18.5µg/L Preexposure
46.0*
36.5-57.9
*Significantly greater than preexposure control.

Table 21. Mean, standard deviation and range of water quality characteristics of exposure water used during copper deacclimation tests.
pH (S.U.)
Temperatur
e (°C)
Hardness
(ppm CaCO3)
Alkalinity
(ppm CaCO3)
Conductivit
y ( µS/cm)
Dissolve
d Oxygen
(mg O2/L)
Mean
7.36
12.5
50.9
35.7
92.5
8.54
Std. Dev.
0.06
0.2
1
0.6
1
0.23
Rang
e
7.28-7.48
12.1-12.8
49.6-52.4
34.8-36.6
91.0-94.8
8.2-8.9
Table 22. Mean measured total and dissolved copper (µg/L) concentrations and associated survival (%) of brown trout after 4 weeks deacclimation from preexposure to different concentrations of copper. Standard deviations in parentheses.
Measured Total Cu (µg/L)
<1.0 (0.1)
6.3
(0.5)
12.0 (1.9)
21.8 (2.6)
46.8 (2.4)
102 (0.7)
Measured Dissolved
Cu (µg/L)
<1.0 (0.1)
6.2
(0.4)
11.2 (1.9)
21.6 (2.7)
43.4 (2.6)
98.5 (0.7)
Preexposure Control
100
100
100
100
33.3
0
5.5 µg/L Preexposure
100
91.7
100
100
33.3
0
10.4 µg/L
Preexposure
100
100
100
83.3
66.7
0
18.5 µg/L
Preexposure
100
100
100
100
25
0
Table 23. 96 hour median lethal concentrations and 95% confidence intervals of brown trout preexposed to different copper concentrations followed by a four week deacclimation period.
96 hr LC50 95% Confidence Interval

Preexposure Control 39.4 32.1-48.5
5.5 µg/L Preexposure
36.4
27.8-47.6
10.4 µg/L Preexposure
45.4
35.2-58.4
18.5 µg/L Preexposure
37
30.6-44.7 *Significantly greater than preexposure control
LITERATURE CITED APHA. 1985. Standard Methods for the Examination of Water and Wastewater, 16th
edn. American Public Health Association, American Water Works Association, and Water Pollution Control Federation. Washington, D.C.
Benoit, D.A., V.R. Mattson, and D.C. Olsen. 1982. A Continuous Flow Mini-diluter
System for Toxicity Testing. Water Research. 16:457-464. Buckley, J. T., M. Roch, J. A. McCarter, C. A. Rendel, and A. T. Matheson. 1982.
Chronic exposure of coho salmon to sublethal concentrations of copper. I. Effect on growth, on accumulation and distribution of copper, and on copper tolerance. Comparative Biochemistry and Physiology C. Comparative Pharmacology 72:15-19.
Dixon, D.G. and Sprague, J.B. 1981. Acclimation to copper by rainbow trout (Salmo gairdneri)
-a modifying factor in toxicity. Canadian Journal of Fisheries and Aquatic Sciences 38:880-888.
Hamilton, M.A., R.C. Russo, and R.V. Thurston. 1977. Trimmed Spearman-Karber
method for estimating median lethal concentrations in toxicity bioassays. Env. Sci. Tech. 11(7): 714-719.
Hamilton, M.A., R.C. Russo, and R.V. Thurston. 1978. Correction. Env. Sci. Tech. 12: 417. Macek, K.J. and Sleight, B. H.. 1997. Utility of toxicity tests with embryos and fry in
evaluating hazards associated with the chronic toxicity of chemicals to fishes. In:Aquatic Toxicology and Hazard Evaluation, edited by F.L. Mayer, J.L. Hamelink, pp 137-146. ASTM STP 634. Philadelphia PA.
McCarter, J.A., and M. Roch. 1983. Hepatic metallothionein and resistance to copper
in juvenile coho salmon. Comparative Biochemistry and Physiology. 74C (1):133-137.
McKim, J.M. 1977. Evaluation of tests with early life stages of fish for predicting long-
term toxicity. Journal of Fishery Research Board of Canada 31:449-452.

Snedecor, G. W. and W. G. Cochran. 1980. Statistical Methods. The Iowa State University Press, Ames Iowa
Weber, C. I., et al. 1989. Short-term methods for estimating the chronic toxicity of
effluents and receiving waters to freshwater organisms, second edition. Environmental Monitoring Systems Laboratory, Environmental Protection Agency, Cincinnati, Ohio. EPA/600/4-89/001.
West Inc. 1996. Toxstat Version 3.5. Western EcoSystems Technology, Cheyenne WY. Williams, D. A. 1971. A test for differences between treatment means when several
dose levels are compared with a zero dose control. Biometrics 27:103-117. Williams, D. A. 1972. The comparison of several dose levels with a zero dose control.
Biometrics 27:103-117. Yamamoto, Y. and M. Inoue. 1985. Lethal tolerance of acute cadmium toxicity in
rainbow trout previously exposed to cadmium. Bulletin of the Japanese Society of Scientific fisheries. 51:1733-1735.
USEPA. 1993. A Linear Interpolation Method for Sublethal Toxicity: The Inhibition
Concentration (Icp) Approach (Version 2.0). Norberg-King, T.J. NETAC Technical Report 03-93. U.S. Environmental Protection Agency, Duluth, MN.

Toxicity of zinc to early life stage brown trout and brook trout in water hardness of 50 mg/L
INTRODUCTION
Brown and brook trout are an important component of Colorado ecosystems in
many headwater streams. Many of these streams are impacted by heavy metal contamination as a result of past mining activity. Little work has been done on the chronic toxicity of zinc to brook trout, there are little data regarding the toxicity of zinc to brown trout. The purpose of this experiment was to measure the chronic toxicity of zinc to early life stage brown and brook trout in a water hardness of 50 mg/L.
MATERIAL AND METHODS Early Life Stage Exposure
Two modified continuous-flow diluters (Benoit et al. 1982) were used to deliver the exposure solutions. The source water consisted of dechlorinated Fort Collins municipal tap water. The diluters were constructed of teflon, polyethylene and polypropylene components with silicone stoppers and Nalgene FDA food grade vinyl tubing. Chemical stock solutions for preexposure and toxicity tests were prepared by dissolving a calculated amount of reagent grade zinc sulfate heptahydrate (ZnSO4
.7H2O) (Mallinkrodt) in deionized water. The chemical stock solution was delivered to the diluter via a peristaltic pump (Cole-Palmer model C/L) at a rate of 1.5 mls/minute. New stock solutions were prepared as needed during preexposure and toxicity tests. The diluters delivered five exposures with a 50% dilution ratio, and a exposure control. Target concentrations of zinc were 2000, 1000, 500, 250, 125, and 0 µg Zn/L. A flow splitter allocated each concentration equally among four replicate exposure chambers at a rate of 40 mls/minute each. Operation of the diluters and toxicant flow were monitored daily to ensure proper operation. Exposure chambers consisted of polyethylene containers with a capacity of 2.8 liters. Test solutions overflowed from the exposure chambers into water baths which were maintained at 12°C using temperature-controlled recirculators (VWR Scientific Products Recirculator ). A photocell regulated the fluorescent lighting to provide a natural photoperiod for Ft Collins.
Brown trout embryos were obtained as eyed eggs from the Colorado Division of Wildlife Research Hatchery in Bellevue Colorado. The eggs were spawned from feral brown trout in North Delaney Butte Reservoir in Northern Colorado. Fifteen eggs were placed into each exposure chamber of one of the diluters. The number of hatched eggs and mortality of eggs and fry were monitored and recorded daily. Brown trout eggs started hatching in the control approximately two days after initiation of zinc exposure. Brown trout embryos remained as sac fry for approximately three and a half weeks prior to swimup stage. Exposure of brown trout swimup fry continued for 30 days for a total of 58 days of exposure.
Eyed brook trout eggs were received from Ten Sleep Hatchery in Wyoming. Brook trout eggs were exposed for 16 days before hatching started. Exposure during

the sac fry stage continued for 3 weeks before swimup stage. Swimup brook trout fry were exposed for 34 days before termination of the test for a total of 71 days exposure.
Swimup fry were fed appropriately sized Silver Cup trout food four times daily (twice daily on weekends and holidays) at an estimated rate of 2% body weight /day. The trout food diet was supplemented with a concentrated suspension of brine shrimp naupalii (San Francisco brand). At the end of the tests, surviving fish from each exposure chamber were terminally anesthetized, blotted dry with a paper towel and the total lengths (mm) and weights (g) measured and recorded.
Water quality characteristics of exposure water were measured weekly in all treatment levels within a replicate. Replicates were alternated each week. Hardness and alkalinity were determined according to Standard Methods (APHA 1985). pH was measured using an Orion Research pH meter 811 calibrated prior to each use with pH 7.00 and pH 4.00 buffers. Conductivity was determined using a YSI Model 35 conductance meter. Dissolved oxygen was measured using a YSI Model 58 dissolved oxygen meter.
Water samples for zinc analyses were collected weekly from each exposure level with surviving fry. Water samples were collected from a single replicate which was alternated each week. Total (acid soluble) samples were collected in disposable polystyrene tubes (Falcon) and immediately preserved with Ultrex® triple distilled nitric acid to pH <2. Dissolved samples were passed through a 0.45 µm filter (Acrodisc) prior to acidification. Samples were analyzed using an Instrumentation Laboratory Video 22 (Allied Analytical Systems, Franklin, MA) atomic absorption spectrometer with air-acetylene flame and Smith-Hieftje background correction. The spectrometer was calibrated prior to each use and the calibration verified using a NIST traceable QAQC standard from an outside source (High Purity Standards, Charleston SC). Statistical analyses
Statistical analyses were conducted using Toxstat version 3.5 software (West Inc. 1996). Analysis of variance (ANOVA) was used to test toxicity endpoints which included hatching success, fry and swimup survival, mean time to hatch, and lengths and weights of surviving at test termination. Hatching success and survival data were transformed by arcsine square root prior to ANOVA (Snedecor and Cochran 1980). Normality and homogeneity of variances were tested using Shipiro-Wilk’s test and Bartlett’s test, respectively (Weber et al., 1989). Treatment means were compared to the control using William’s one-tailed test (p<0.05) (Williams 1971, Williams 1972). The highest zinc concentration not associated with a treatment effect (e.g. decreased survival, decreased body weight) was designated as the no-observed-effect concentration (NOEC). The lowest concentration of zinc that was associated with a treatment effect was designated as the lowest-observed-effect concentration (LOEC). Chronic values were calculated as the geometric mean of the LOEC and NOEC. The inhibition concentration (IC20 value), the concentration estimated to cause a 20% reduction in organism performance compared with the control, was also calculated (USEPA 1993) using the combined weight of surviving organisms from each treatment.
RESULTS

The results of water quality characteristics measured during the Early Life Stage
test are shown in Tables 24 and 25 for the brown trout and brook trout experiments, respectively. The standard deviations and ranges indicate the water quality characteristics were consistent over the course of the experiments. Water quality characteristics between the two experiments are very similar. Hardness was just under 50 mg/L and alkalinity around 35 mg/L. Temperature was very close to the target of 12°C and pH was slightly over neutral at 7.5. Conductivity was just under 100 µS/cm and dissolved oxygen acceptable for trout.
As is typical for the water used in these experiments, the total zinc concentrations are primarily in the dissolved form (Tables 26 and 28). Mean hatching success, sac fry and swimup fry survival for the brown trout embryos and the associated zinc exposure concentrations are shown in Table 26. Mean hatching success was 90% or greater in all exposures and was unaffected by exposure to the zinc concentrations used in this experiment. Survival of sac fry were generally high with the exception of the highest zinc exposure (2172 µg /L) which was only 78.3% and was significantly lower than the control survival (p<0.05). The no observed effect concentration (NOEC) for brown trout embryos exposed to zinc is 1078 µg /L on the basis of sac fry and swimup fry survival. The lowest observed effect concentration is 2172 µg /L for a chronic value of 1530 µg Zn/L based on survival. Survival of brown trout at termination was significantly lower in the highest zinc concentration (p<0.05). Most of the mortality in this highest concentration occurred during the sac fry stage. Fish that survived zinc exposure during the sac fry stage went on to survive until the end of the experiment. Time required for brown trout eggs to hatch was strongly affected by zinc exposure (Table 27). There was a general trend of increasing time to hatch with zinc concentration. At an exposure of 1078 µg Zn/L, the time to hatch is nearly two fold greater than the control. Mean time to hatch for eggs exposed to a zinc concentration of 274 µg Zn/L or greater were significantly greater than the control. The NOEC and LOEC based on time to hatch is 140 and 274, respectively for a chronic value of 196 µg Zn/L. The effect of zinc exposure on growth of brown trout embyros and fry is shown in Table 28. Growth, as measured by lengths and weights of surviving brown trout, in general decreased as zinc concentration increased. The NOEC and LOEC based on length at termination of the test is 274 and 558 µg Zn/L, respectively for a chronic value of 391 µg Zn/L. Weight at termination of the test was a more sensitive indicator of zinc effects on growth than length. The NOEC and LOEC based on weight was 140 and 274 µg Zn/L, respectively, for a chronic value of 196 µg Zn/L. The 20% inhibition concentration (IC20) for combined weight of brown trout at the end of the experiment exposure was 541 µg Zn/L (Table 32).
Brook trout hatching success, sac and swimup fry survival and associated zinc exposure concentrations are shown in Table 29. Hatching success and survival of brook trout fry were somewhat lower than brown trout but usually exceeded 75%. There were no significant differences in any of these endpoints for the zinc concentrations used in these experiments. Mean time to hatch for brook trout eggs were substantially greater than for brown trout eggs (Table 30). No significant difference in mean time to hatch was found for brook trout eggs exposed to zinc. As with brown trout, brook trout growth was significantly reduced as a result of exposure to

zinc (Table 31). Growth, as defined by length and weight at termination, was significantly reduced in brook trout exposed to 318 µg Zn/L or greater (LOEC), but was unaffected by exposure to 188 µg Zn/L (NOEC). The chronic value for brook trout exposed to zinc on the basis of growth is 245 µg Zn/L. The 20% inhibition concentration (IC20) for combined weight of brook trout at the end of the experiment exposure was 946 µg Zn/L and is shown in Table 32 with a summary of all endpoints for brown and brook trout.
DISCUSSION
Acute and chronic toxicity of zinc data with brown trout are quite limited. There have been toxicity studies conducted using brook trout but information on chronic toxicity consists of a single test (Holcombe et al 1979, USEPA Criteria). Both of these species are important in many of Colorado headwater streams where zinc contamination in mining areas occur. These experiments were conducted in order to develop information that can be used to better assess possible impacts to these species from zinc contamination and to identify areas that would benefit from reductions of zinc levels in the water. Brown trout
Hatching success of brown trout eggs were unaffected by exposure to zinc concentrations used in this test. Hatching of brown trout eggs was delayed by exposure to zinc concentrations as low as 274 µg/L. The increased time to hatch is relatively small on an absolute basis: 42-200 hours longer than the control. However this represents an increase of 127-200%. This increase is rather large considering the eggs were only exposed for 3 days or so before they started to hatch. It would be interesting to conduct a zinc toxicity test starting with freshly fertilized brown trout eggs to see what effects longer term zinc exposure would have on mean time to hatch. Eggs are usually more tolerant to the effects of metals than other life stages. Altered mean time to hatch is not a common endpoint for metal toxicity. However, manganese was found to accelerate hatching in brown trout (Stubblefield et al. 1997) and brook and rainbow trout eggs (Davies and Brinkman 1998).
Survival of brown trout was decreased in the highest zinc exposure of 2172 µg/L but was not significantly affected at a concentration of 1078 µg/L. A previous ELS test conducted with brown trout did not detect an effect on survival at a zinc concentration of 2139 µg/L (Davies and Brinkman 1999). However this was probably due to poor survival in the control which decreased statistical power to detect high mortality at the higher zinc concentrations. Growth, as measured by length and weight at termination, proved to be a more sensitive endpoint for zinc toxicity than survival. In this experiment, length of surviving brown trout were affected between 274 and 558 µg Zn/L while weight was affected between 140 and 274 µg Zn/L. These ranges are not far from 375-698 µg Zn/L found in the tests conducted in 1999. The IC20 from the present test was 541 µg Zn/L which is somewhat higher than 409 µg Zn/L reported in 1999. Brook Trout

Hatching success was somewhat lower than brown trout but was similarly unaffected by zinc concentrations used in this experiment.. Unlike brown trout, time to hatch was not affected despite much longer exposure of this life stage to zinc prior to hatching. Survival of sac fry and swimup fry was not affected at concentrations as high as 2000 µg Zn/L. As with brown trout, growth of brook trout fry was much more sensitive to the effects of zinc than survival. Lengths and weights were affected as low as 319 µg Zn/L which is much lower than the 1368 µg Zn/L value reported for brook trout by Holcombe et al 1979. The calculated IC20 is 946 which agrees well with the 855 chronic value derived by Holcombe et al. in 1979.
ELS tests are useful because the ELS portion of the exposure is thought to encompass the most sensitive life stages for aquatic organisms. Review of data have compared ELS tests with life cycle tests and been found to be comparable (Macek and Sleight 1997, McKim 1997). We have found ELS tests are sensitive for detecting effects of metal exposure on growth of trout. Growth is typically a more sensitive indicator of metal toxicity than survival. Growth is important to trout because reduced size can mean increased specific metabolism, reduced swimming speed which reduces available habitat and increased risk of predation. However, ELS tests may underestimate effects of metal exposure on chronic mortality. This can occur because exposure is initiated during a tolerant life stage such as eggs or sac fry. This provides an opportunity for the exposed organisms to become acclimated and more resistant to lethal effects during a more sensitive life stage.

Table 24. Mean, standard deviation and range of water quality characteristics of exposure water used during zinc exposure to early life stage brown trout.
pH
(S.U.)
Temperatur
e
(°C)
Hardness
(ppm
CaCO3)
Alkalinity
(ppm
CaCO3)
Conductivit
y
( µS/cm)
Dissolve
d Oxygen
(mg O2/L)
Mean
7.59
11.7
47.7
33.6
94.8
8.52
Std. Dev.
0.12
0.4
5.8
3.9
3.8
0.84
Rang
e
7.29-7.80
10.5-12.4
37.8-58.6
26.4-39.8
86.5-101.7
6.90-9.50
Table 25. Mean, standard deviation and range of water quality characteristics of exposure water used during zinc exposure to early life stage brook trout.
pH
(S.U.)
Temperatur
e
(°C)
Hardness
(ppm
CaCO3)
Alkalinity
(ppm
CaCO3)
Conductivit
y
( µS/cm)
Dissolve
d Oxygen
(mg O2/L)
Mean
7.6
12.1
48.1
34.7
94.8
8.33
Std. Dev.
0.17
0.7
4.2
2.7
4.7
0.96
Rang
e
7.24-8.01
10.0-13.5
40.4-56.0
28.0-38.2
82.9-101.3
6.3-9.7

Table 26. Mean measured total and dissolved zinc concentrations (µg/L) and associated hatching success, sac fry and swimup fry survival (%) of brown trout. Standard deviations in parentheses.
Measured Total Zn (µg/L)
<10 (4)
141 (9)
275 (14)
563 (35)
1090 (67)
2196 (216)
Measured Dissolved
Zn (µg/L)
<10 (3)
140 (8)
274 (14)
558 (29)
1078 (52)
2172 (207)
Hatching Success
(%)
96.6 (3.9)
93.3 (5.4)
100 (0)
96.6 (3.9)
90.0 (3.8)
91.7 (6.4)
Sac Fry Survival
(%)
93.3 (5.4)
88.3
(11.4)
96.6 (3.9)
91.7 (6.4)
88.4 (3.3)
78.3* (6.4)
Swimup Fry Survival
(%)
90.0 (3.8)
86.7
(14.4)
96.6 (3.9)
91.7 (6.4)
85.0 (6.4)
76.7* (8.6)
*Significantly lower than control (p<0.05) Table 27. Mean measured dissolved zinc concentrations (µg/L) and associated mean time to hatch (hours) of brown trout eggs. Standard deviations in parentheses. Measured Dissolved
Zn (µg/L)
<10 (3)
140 (8)
274 (14)
558 (29)
1078 (52)
2172 (207)
Mean Time to Hatch
(Hours)
75
(11)
78 (6)
92* (4)
123* (14)
147* (12)
157* (7)
*Significantly greater than control (p<0.05) Table 28. Mean measured dissolved zinc concentrations (µg/L) and associated brown trout mean length (mm) and weight (g) after 58 days of exposure. Standard deviations in parentheses. Measured Dissolved
Zn (µg/L)
<10 (3)
140 (8)
274 (14)
558 (29)
1078 (52)
2172 (207)
Mean Length
(mm)
33.3 (0.6)
32.8 (1.0)
32.8 (0.4)
31.2* (0.7)
31.0* (0.5)
30.4* (0.2)
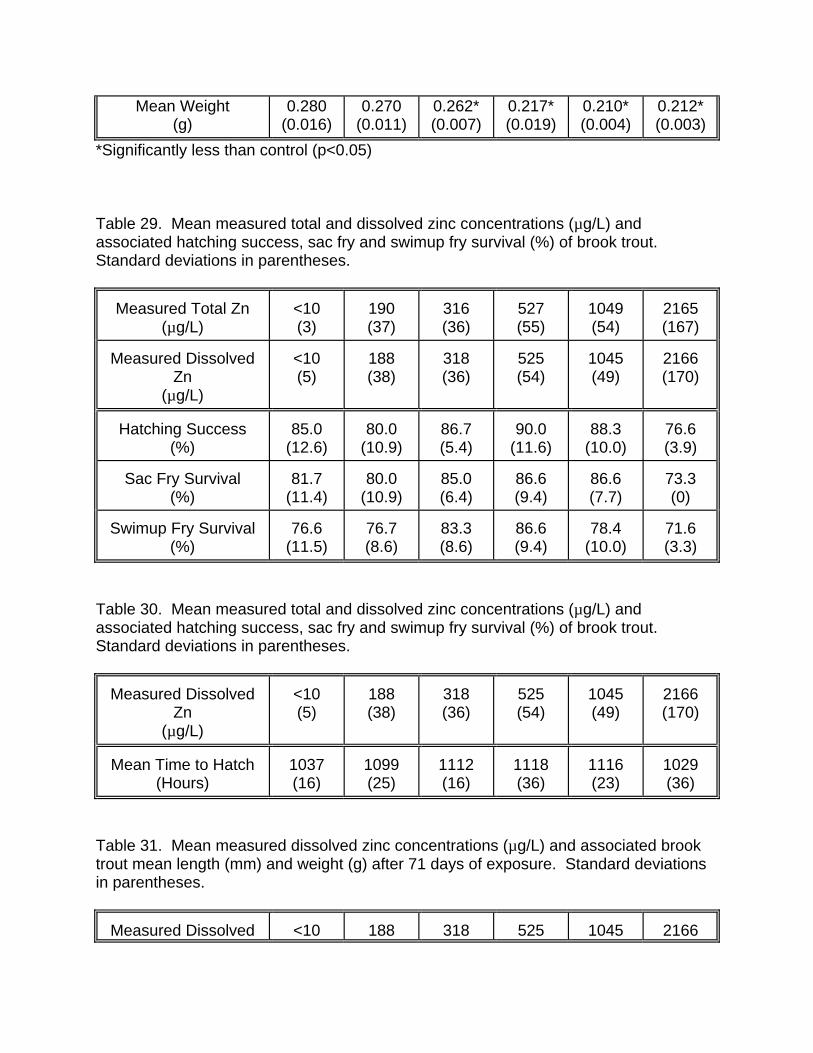
Mean Weight (g)
0.280 (0.016)
0.270 (0.011)
0.262* (0.007)
0.217* (0.019)
0.210* (0.004)
0.212* (0.003)
*Significantly less than control (p<0.05) Table 29. Mean measured total and dissolved zinc concentrations (µg/L) and associated hatching success, sac fry and swimup fry survival (%) of brook trout. Standard deviations in parentheses.
Measured Total Zn (µg/L)
<10 (3)
190 (37)
316 (36)
527 (55)
1049 (54)
2165 (167)
Measured Dissolved
Zn (µg/L)
<10 (5)
188 (38)
318 (36)
525 (54)
1045 (49)
2166 (170)
Hatching Success
(%)
85.0
(12.6)
80.0
(10.9)
86.7 (5.4)
90.0
(11.6)
88.3
(10.0)
76.6 (3.9)
Sac Fry Survival
(%)
81.7
(11.4)
80.0
(10.9)
85.0 (6.4)
86.6 (9.4)
86.6 (7.7)
73.3 (0)
Swimup Fry Survival
(%)
76.6
(11.5)
76.7 (8.6)
83.3 (8.6)
86.6 (9.4)
78.4
(10.0)
71.6 (3.3)
Table 30. Mean measured total and dissolved zinc concentrations (µg/L) and associated hatching success, sac fry and swimup fry survival (%) of brook trout. Standard deviations in parentheses. Measured Dissolved
Zn (µg/L)
<10 (5)
188 (38)
318 (36)
525 (54)
1045 (49)
2166 (170)
Mean Time to Hatch
(Hours)
1037 (16)
1099 (25)
1112 (16)
1118 (36)
1116 (23)
1029 (36)
Table 31. Mean measured dissolved zinc concentrations (µg/L) and associated brook trout mean length (mm) and weight (g) after 71 days of exposure. Standard deviations in parentheses. Measured Dissolved
<10
188
318
525
1045
2166

Zn (µg/L)
(5) (38) (36) (54) (49) (170)
Mean Length
(mm)
34.3 (1.1)
33.7 (1.4)
32.5* (1.2)
32.3* (1.0)
31.8* (0.3)
30.6* (1.4)
Mean Weight
(g)
0.306
(0.018)
0.282
(0.036)
0.251* (0.023)
0.252* (0.032)
0.231* (0.010)
0.207* (0.026)
*Significantly less than control (p<0.05)

Table 32. Summary of chronic values for different endpoints of brown and brook trout exposed to zinc. Endpoint
Brown Trout
Chronic Value (µg Zn/L)
Brook Trout
Chronic Value (µg Zn/L) Hatch Success
>2172
>2166
Sac Fry Survival
1530
>2166
Swimup Survival
1530
>2166
Mean Time to Hatch
196
>2166
Length at termination
391
245
Weigh at termination
196
245
IC20
541
946

LITERATURE CITED APHA. 1985. Standard Methods for the Examination of Water and Wastewater, 16th
edn. American Public Health Association, American Water Works Association, and Water Pollution Control Federation. Washington, D.C.
Benoit, D.A., V.R. Mattson, and D.C. Olsen. 1982. A Continuous Flow Mini-diluter
System for Toxicity Testing. Water Research. 16:457-464. Davies, P. H. and S. F. Brinkman. 1998. Federal Aid in Fish and Wildlife Restoration.
Job Progress Report F-243R-5. Colorado Division of Wildlife, Fort Collins, CO, USA.
Davies, P. H. and S. F. Brinkman. 1999. Federal Aid in Fish and Wildlife Restoration.
Job Progress Report F-243R-6. Colorado Division of Wildlife, Fort Collins, CO, USA.
Dixon, D.G. and Sprague, J.B. 1981. Acclimation to copper by rainbow trout (Salmo gairdneri)
-a modifying factor in toxicity. Canadian Journal of Fisheries and Aquatic Sciences 38:880-888.
Hamilton, M.A., R.C. Russo, and R.V. Thurston. 1977. Trimmed Spearman-Karber
method for estimating median lethal concentrations in toxicity bioassays. Env. Sci. Tech. 11(7): 714-719.
Hamilton, M.A., R.C. Russo, and R.V. Thurston. 1978. Correction. Env. Sci. Tech. 12: 417. Holcombe, G. W., D. A. Benoit and E. N. Leonard. 1979. Long-term effects of zinc
exposures on brook trout (Salvelinus fontinalis). Trans. Am. Fish. Soc. 108:76-87.
Macek, K.J. and Sleight, B. H.. 1997. Utility of toxicity tests with embryos and fry in
evaluating hazards associated with the chronic toxicity of chemicals to fishes. In:Aquatic Toxicology and Hazard Evaluation, edited by F.L. Mayer, J.L. Hamelink, pp 137-146. ASTM STP 634. Philadelphia PA.
McKim, J.M. 1977. Evaluation of tests with early life stages of fish for predicting long-
term toxicity. Journal of Fishery Research Board of Canada 31:449-452. Snedecor, G. W. and W. G. Cochran. 1980. Statistical Methods. The Iowa State
University Press, Ames Iowa. Stubblefield, W. A.,S. F. Brinkman, P. H. Davies, T. D. Garrison, J. R. Hockett, and M.
W. McIntyre. 1997. Effects of water hardness on the toxicity of manganese to developing brown trout (Salmo trutta). Environmental Toxicology and

Chemistry. 16(10):2082-2089.

Weber, C. I., et al. 1989. Short-term methods for estimating the chronic toxicity of effluents and receiving waters to freshwater organisms, second edition. Environmental Monitoring Systems Laboratory, Environmental Protection Agency, Cincinnati, Ohio. EPA/600/4-89/001.
West Inc. 1996. Toxstat Version 3.5. Western EcoSystems Technology, Cheyenne WY.
Williams, D. A. 1971. A test for differences between treatment means when several dose levels are compared with a zero dose control. Biometrics 27:103-117.
Williams, D. A. 1972. The comparison of several dose levels with a zero dose control.
Biometrics 27:103-117. USEPA. 1993. A Linear Interpolation Method for Sublethal Toxicity: The Inhibition
Concentration (Icp) Approach (Version 2.0). Norberg-King, T.J. NETAC Technical Report 03-93. U.S. Environmental Protection Agency, Duluth, MN.

STUDY PLAN C: TECHNICAL ASSISTANCE
Objective:
To provide expertise, consultation, evaluation and training in aquatic toxicology and aquatic chemistry to Division of Wildlife personnel, and other state and federal agencies. Job C1. Water Quality Assistance to Other Personnel
Objectives:
1. To oversee the training and evaluation of metal analysis by laboratory technicians.
2. To assist Division and other state and federal personnel in the analysis and toxicological assessment of water quality data.
3. To develop and maintain a quality assurance program to evaluate the quality of analytical results for metals.
4. To collect and analyze metals concentrations in samples from the Arkansas River. ACCOMPLISHMENTS: Water quality characteristics and or metal analyses were performed for the following persons and agencies: Phil Schler, Colorado Division of Wildlife (CDOW) John Woodling, CDOW Barb Horn, CDOW Andre Duval, CDOW Larry Harris, CDOW Gary Guggenberger, CDOW John Alves, CDOW Mark Jones, CDOW Gene Rauch, CDOW Del Nimmo, University of Southern Colorado Jim Hansen, Stratus Corporation Rotenone analyses were performed for : Sherman Hebein, CDOW


Analytical Assistance and Laboratory facilities were provided for: Barry Nehring, CDOW George Schisler, CDOW Blair Prusha, CSU Interpretation of chemical data and toxicity information was provided to: Mike Holmes, U.S. Environmental Protection Agency Stan Christensen, U.S. Environmental Protection Agency Andrew Archuleta, U.S. Fish and Wildlife Service Vicky Peters, Attorney Generals Office Rob Marsh, Attorney Generals Office Sean McAllister, Attorney Generals Office Lee Provanka, Dept of Public Health and Environment Angus Campbell, Department of Public Health and Environment Russ Allen, Department of Public Health and Environment Harry Posey, Department of Natural Resources Will Tully, Bureau of Reclamation