water for a sustainable world facts and …unesdoc.unesco.org/images/0023/002322/232273e.pdf4 •...
TRANSCRIPT

UNSUSTAINABLE GROWTH AND INCREASING GLOBAL WATER DEMAND• The world’s population is growing by about 80 million
people per year (USCB, 2012) and is predicted to reach 9.1 billion by 2050, with 2.4 billion people living in sub-Saharan Africa (UNDESA, 2013a).
• Global gross domestic product (GDP) rose an average of 3.5% per year from 1960 to 2012 (World Economics, 2014). Much of this economic growth has come at a significant social and environmental cost.
• Population growth, urbanization, industrialization, and increases in production and consumption have all generated ever-increasing demands for freshwater resources.
• By 2030, the world is projected to face a 40% global water deficit under the business-as-usual climate scenario (2030 WRG, 2009).
• The fact is there is enough water to meet the world’s growing needs, but not without dramatically changing the way water is used, managed and shared. The global water crisis is one of governance (WWAP, 2006), much more than of resource availability.
• Competing demands increases the risk of localized conflicts and will lead to increasingly difficult allocation decisions and limit the expansion of sectors critical to sustainable development. Difficult policy choices are posed by the water-food-energy-nexus and trade-offs are involved in managing each sector, either separately or together (WWAP, 2014).
• Of the world’s 263 transboundary basins, 158 lack any type of cooperative management framework. Of the 105 water basins with water institutions, approximately two thirds include three or more riparian states and yet less than 20% of the accompanying agreements are multilateral (UNEP, 2002).
Report
FACTS AND FIGURESWATER FOR A SUSTAINABLE WORLD
The United Nations World Water Development Report 2015

2
• Climate change will exacerbate the risks associated with variations in the distribution and availability of water resources.
• Groundwater provides drinking water to at least 50% of the global population and accounts for 43% of all of the water used for irrigation (FAO, 2010). Worldwide, 2.5 billion people depend solely on groundwater resources to satisfy their basic daily water needs (UNESCO, 2012).
• An estimated 20% of the world’s aquifers is being over-exploited (Gleeson et al., 2012), leading to serious consequences such as land subsidence and saltwater intrusion (USGS, 2013).
• Economic losses due to water-related hazards have risen greatly in the past decade. Since 1992, floods, droughts and storms have affected 4.2 billion people (95% of all people affected by all disasters) and caused US$1.3 trillion of damage (63% of all damage) (UNISDR, 2012).
• Water availability faces pressures from pollution. Eutrophication of surface water and coastal zones is expected to increase almost everywhere until 2030 (UNDESA, 2012). Globally, the number of lakes with harmful algal blooms will increase by at least 20% until 2050.
• Regionally, the global limit of ecological sustainability of water available for abstraction is reported to have been exceeded for about one-third of the human population and it will rise to about half by 2030 (WWAP, 2012).
• In most countries, funding for water infrastructure comes from government allocations, although many developing countries still depend on external assistance to fund water resources management and utilities. Over 50% of countries low on the Human Development Index have reported that financing for water resources development and management from government budgets and official development assistance has been increasing over the past 20 years (UN-Water, 2012).
• Challenges such as economic shocks, food shortages and climate change threaten to undercut economic and social progress made in recent years.
Full bibliographic details for the sources cited within this brochure can be found in the WWDR 2015, which can be downloaded for free from
FIG
URE
1 Groundwater development stress (2010)
Source: IGRAC (2014).IGRAC (International Groundwater Resources Assessment Centre). 2014. Information System. Global Overview application. Delft, Netherlands, IGRAC. http://ggmn.e-id.nl/ggmn/GlobalOverview.html (Accessed December 2014). © IGRAC 2014.

WATER AND THE THREE DIMENSIONS OF SUSTAINABLE DEVELOPMENT
Poverty• About 1.2 billion people live in areas where water is
physically scarce (UN-Water and FAO, 2007). Limited water access by the poor can result not only from economic pressures, but also from socio-political and environmental pressures, weak governance and human capacities, and a lack of infrastructure (Comprehensive Assessment of Water Management in Agriculture, 2007).
• Eradication of extreme poverty and hunger has been the number one priority under the Millennium Development Goals. Great strides have been made in many countries (e.g. Brazil, China and India) to reduce poverty. Nevertheless, as of 2012, 1.2 billon people still lived in extreme poverty (Lockhart and Vincent, 2013).
• Although integrated water resources management approaches are guided by a balanced concern for
economic efficiency, environmental sustainability and social equity, in practice, the social equity goal is often given less priority when water allocation decisions are made (WGF, 2012). Comparatively powerless groups tend to be shut out of access to water.
• Non-inclusive growth coupled with inappropriate allocation of water resources and services and increasing demand for water run the risk of making societies more unstable and prone to tensions and conflicts.
Economic development • Investments in water infrastructure are fundamental to
unlocking the full potential of economic growth in the early stages of a country’s economic development. Once the marginal benefits of further development decreases, emphasis must gradually shift towards building human and institutional capabilities to enhance water efficiency and sustainability, and secure economic and social development gains.
3
http://www.unesco.org/new/en/natural-sciences/environment/water/wwap/wwdr/
1990-92 2012-14*Undernourisheda
(in millions)Prevalence of
undernourishmentb
(%)
Undernourisheda (in millions)
Prevalence of undernourishmentb
(%)
World 1 014.5 18.7 805.3 11.3
Developed Regions 20.4 <5 14.6 <5
Developing Regions 994.1 23.4 790.7 13.5
Africa 182.1 27.7 226.7 20.5
Sub-Saharan Africa 176.0 33.3 214.1 23.8
Asia 742.6 27.3 525.6 12.7
Eastern Asia 295.2 23.2 161.2 10.8
South-Eastern Asia 138.0 30.7 63.5 10.3
Southern Asia 291.7 24.0 276.4 15.8
Western Asia 8.0 6.3 18.5 8.7
Latin America and the Caribbean
68.5 15.3 37.0 6.1
Latin America 60.3 14.4 29.5 5.1
Oceania 1.0 15.7 1.4 14.0
* Projections. a Undernourishment or chronic hunger is a state, lasting for at least one year, of inability to acquire enough food, defined as a level of food intake insufficient to meet dietary energy requirements (FAO, n.d.). b The prevalence of undernourishment shows the proportion of the population suffering from such chronic hunger.Source: Modified from FAO, IFAD and WFP (2014, Table 1, p. 8).FAO (Food and Agriculture Organization of the United Nations). n.d. The FAO Hunger Map 2014 – Basic Definitions. Rome, FAO. http://www.fao.org/hunger/en/ (Accessed Nov 2014) FAO, IFAD and WFP. 2014. The State of Food Insecurity in the World 2014: Strengthening the Enabling Environment for Food Security and Nutrition. Rome, FAO. http://www.fao.org/3/a-i4030e.pdf
Prevalence of undernourishment globally (1990–2014)
TAB
LE
1

4
• Water supply (quantity and quality) at the place where the user needs it must be reliable and predictable to support financially sustainable investments in economic activities. This requires both hard and soft infrastructure that is financed, operated and reliably maintained.
• Infrastructure to reduce the risk of water scarcity and to manage water-related disasters can make a country’s development efforts more sustainable by reducing the vulnerability and/or increasing the resilience of economies to extreme events.
• To avoid solving one problem by worsening another, it is essential to understand how different areas of the economy are linked to each other through water (WWAP, 2012).
• Measures of improved water resource management have shown considerable economic gains. A US$15 to
US$30 billion investment in improved water resources management in developing countries can have direct annual income returns in the range of US$60 billion. Every US$1 invested in watershed protection can save anywhere from US$7.5 to nearly US$200 in costs for new water treatment and filtration facility (SIWI, 2005).
• Policies to support income generation for small-scale producers stimulate economic growth in rural areas. For example, the internal rate of return on investing in large-scale irrigation in Central Africa was calculated at 12%, while the figure for investing in small-scale irrigation in the Sahel stood at 33% (UN-Water, 2013).
Ecosystems• Healthy ecosystems provide water services that
have enormous societal value through flood control, groundwater recharge, river-bank stabilization and
FIG
URE
2 Environmental stress due to flow regime alterations (1981-2010)
Note: Natural flow regimes are heavily modified by water abstractions and dam operations. The indicator “environmental water stress due to flow regime alterations” is used to assess the hydrological alterations resulting from these impacts (Schneider et al. 2013). Daily time series of modified and natural river discharge were simulated by the global water WaterGAP3 model on a global 5×5 arc minute grid (i.e. about 8×8km at the Equator) considering over 6 000 large dams.
Flow regimes are particularly altered due to dam and water management in the USA, Mexico, Spain, Portugal, the Middle East, India, and the Northeast and Northwest of China. In Eastern Australia, the Murray Darling basin shows severe deviations from natural conditions, and hotspots in Africa are the Nile River basin in Egypt, Sudan, South Sudan and Uganda, the Orange and Limpopo basins in South Africa, and basins in Morocco. This increases the risk for ecosystem degradation notably the intrusion of invasive species. For a detailed description of the methodology, background work and findings: http://www.usf.uni-kassel.de/cesr/index.php?option=com_content&task=view&id=57&Itemid=86
Source: Center for Environmental Systems Research, University of Kassel (Generated in December 2014 using WaterGAP3 model)Schneider, C., Laize, C.L.R., Acreman, M.C. and Flörke, M. (2013). How will climate change modify river flow regimes in Europe? Hydrology and Earth System Sciences 17, 325-339.

5
erosion protection, water purification, biodiversity conservation, as well as transportation, recreation and tourism (MEA, 2005b).
• There has been a 30% decline in biodiversity health since 1970 (WWF, 2012). Poor water management approaches can be a driver of this decline.
• Ecosystems across the world, particularly wetlands, are in decline in terms of the services they provide. Between US$4.3 and US$20.2 trillion per year worth of ecosystem services were lost between 1997 and 2011 due to land use change (Costanza et al., 2014).
• Human-built infrastructure such as dams can cause biodiversity loss and degradation of ecosystem services, yet they often directly depend on ecosystem services to maintain their performance. The challenge is to manage water resources to maintain a beneficial mix between built and natural infrastructure and provision of their respective services.
• Ecosystem valuation has demonstrated that benefits far exceed costs of water-related investments in ecosystem conservation. The 2011 economic value of ecosystem services has been globally estimated at US$124.8 trillion. Global GDP was estimated at US$75.2 trillion in the same year (Costanza et al., 2014).
• Climate change has a significant impact on ecosystems. The effect on wetlands and their multiple ecosystem services is expected to be severe.
ADDRESSING CRITICAL DEVELOPMENTAL CHALLENGES
Water, sanitation and hygiene (WASH)• Access to water and sanitation is recognized as a
human right and has long been central to international development policies and targets (UNCESCR, 2003; UNGA, 2010). Nevertheless, discrimination based on ethnicity, religion, economic class, social status, gender, age or physical abilities often restricts people from accessing land and water resources and related services. Such exclusion has long-term social and economic effects.
• Inadequate WASH is one of many deprivations still suffered by the world’s poorest and most marginalized populations.
• Impressive progress has been made over the past two decades, with 2.3 billion people gaining access to an
improved drinking water source and 1.9 billion to an improved sanitation facility (WHO and UNICEF, 2014a). Of those gaining access to drinking water, 1.6 billion now use a higher level of service (a piped water supply on premises).
• Much still needs to be done – 748 million people do not use an improved source of drinking water and 2.5 billion do not use an improved sanitation facility (WHO and UNICEF, 2014).
• One billion people defecate in the open (WHO and UNICEF, 2014a). An estimated 1.8 billion people are using a source of drinking water that is faecally contaminated (Bain et al., 2014).
• Coverage alone does not fully reflect inequalities; disparities are evident in the levels of service related to safety, accessibility and reliability (WHO and UNICEF, 2011).
• In many countries, increases in sewer-connected sanitation coverage have been made without due attention to treatment and disposal of wastewater. Even in upper-middle income countries wastewater from an estimated 75% of households with sewer connections may not receive adequate treatment (Baum et al., 2013).
• To achieve universal coverage, US$53 billion a year over a five-year period would be needed (Hutton, 2013) – less than 0.1% of global world product (in 2010) and with a return on investment many times higher.
• The benefits of achieving universal access to sanitation are estimated to outweigh the costs by a factor of 5.5 to 1, whereas for universal access to drinking water the ratio is estimated at 2 to 1 (WHO, 2012a).
• In developing regions, the return on investment in water and sanitation services has been estimated at US$5 to US$28 per dollar invested (WHO, 2012).
• An estimated 6% of people primarily relied on bottled water in 2010 (WHO and UNICEF, 2012a). There are concerns about the environmental sustainability of the increased packaging of water and the affordability of this trend.
• Women and girls are often responsible for collecting water; in rural sub-Saharan Africa many spend at least half an hour to do so (WHO and UNICEF, 2012a), and some make multiple trips taking up two to four hours a day (Pickering and Davis, 2012). Lack of sanitation is

6
more likely to hinder a girl’s educational attainment than a boy’s.
Urbanization• In 2014, 3.9 billion people, or 54% of the global
population, lived in cities, and by 2050, 6.3 billion (WWAP, 2012) or two-thirds of the global population will be living in urban settlements (UNDESA, 2014).
• By 2050, global water demand is projected to increase by 55%, mainly from demands related to growing urbanization in developing countries (OECD, 2012a). Cities will have to go further or dig deeper to access water, or will have to depend on innovative solutions or advanced technologies to meet their water demands.
• Developing countries account for 93% of urbanization globally, 40% of which is the expansion of slums. By 2030, the urban population in Africa and Asia will double (UN-Habitat, 2010).
• Between 1990 and 2012, in absolute terms, the number of urban residents without access to an improved drinking water source increased from 111 million to 149 million (WHO and UNICEF, 2014a). In sub-Saharan Africa, where urbanization is happening most rapidly, the percentage of people who received piped water on their premises decreased from 42% to 34% (WHO and UNICEF, 2014a).
• Although access to sanitation is generally higher in urban than in rural areas, because of rapid urbanization, the number of urban residents without access to improved sanitation increased by 40%, from 541 to 754 million, between 1990 and 2012 (WHO and UNICEF, 2014a). The increase in the number of people without access to water and sanitation in urban areas is directly related to the rapid growth of slum populations in the developing world.
• Most cities do not have or allocate the necessary resources for wastewater management. An estimated 90% of wastewater in cities in developing countries is discharged untreated directly into rivers, lakes or the ocean (UNEP, 2010). Wastewater-related emissions of methane and nitrous oxide could rise by 50% and 25%, respectively, between 1990 and 2020 (UNEP, 2010).
• One study suggests that US$1 of water and sewer infrastructure investment increases private output GDP in the long-term by US$6.35 and yields a further US$2.62 output in other industries. These benefits accrue in terms of jobs created, final output and private sector investment (Krop et al., 2008).
• As the urban poor tend to live in concentrated and highly vulnerable areas such as river banks, they are more vulnerable to the impacts of climate change.
• The global costs of climate change adaptation from 2010 to 2050 are estimated to be US$70–100 billion a year (World Bank, 2010a), with urban areas requiring an estimated 80% of the total funding (World Bank, 2010b). As most of this investment will be required in developing countries, where the infrastructure and systems are yet to be built, there are possibilities for making future cities climate-smart.
Food and agriculture• The agricultural sector accounts for roughly 70% of all
freshwater withdrawals globally, and more than 90% in most of the world’s least-developed countries (WWAP, 2014).
• By 2050, agriculture will need to produce 60% more food globally, and 100% more in developing countries (Alexandratos and Bruinsma, 2012).
• Current growth rates of agricultural demands on the world’s freshwater resources are unsustainable.
• Inefficient use of water for crop production depletes aquifers, reduces river flows, degrades wildlife habitats, and has caused salinization of 20% of the global irrigated land area (FAO, 2011a).
• In most cases, increasing water productivity (i.e. producing more crop or value per volume of water applied) is the most important avenue for managing water demand in agriculture. It is made possible through a combination of improved water control, improved land management and agronomic practices.
• Investments in water infrastructure alone cannot suffice to improve agricultural productivity. Farmers need access to inputs like fertilizer and seed material, access to credit, and better education and information regarding the use of inputs and latest techniques.
• With increased intensive agriculture, water pollution from both point and non-point sources may worsen. Experience from high income countries shows that a combination of incentives, including more stringent regulation, enforcement and well-targeted subsidies, can help reduce water pollution (FAO, 2012).
• To be sustainable, agricultural development must benefit those whose livelihoods depend on it by increasing their

7
access to resources and assets, participation in markets and job opportunities.
• Because 75% of the world’s poor live in rural areas, broad-based rural development and the wide sharing of its benefits are the most effective means of reducing poverty and food insecurity (World Bank, 2007b).
• The status of women, who make up the majority of the world’s hungry and have disproportionately low levels of resource ownership, requires special attention. With equal access to resources and knowledge, female farmers, who account for the majority of all subsistence farmers, could produce enough additional food to reduce the number of the world’s hungry by 150 million (FAO, 2011b).
Energy• More than 1.3 billion people lack access to electricity,
and roughly 2.6 billion use solid fuels (mainly biomass) for cooking (IEA, 2012). Another estimated 400 million people rely on coal for cooking and heating, which causes air pollution and has potentially serious health implications when used in traditional stoves.
• The same people who lack access to improved water and sanitation are also likely to lack access to electricity and to rely on solid fuel for cooking (WWAP, 2014). Women and children represent a disproportional share of the underserved.
• Energy is required for the collection, treatment and delivery of water. Electricity accounts for an estimated 5–30% of the total operating cost of water and wastewater utilities (World Bank, 2012).
• Nearly all forms of energy require water as part of their production process. Freshwater withdrawals for energy production account for 15% of the world’s total (WWAP, 2014) and are expected to increase by 20% through 2035 (IEA, 2012).
• Over the past decade, the increased intensity of droughts, heatwaves and local water shortages has interrupted electricity generation, with serious economic consequences. At the same time, limitations on energy availability have constrained the delivery of water services.
Share of people with electricity access in developing countries (2012)
Note: Data are given as a percentage of the population.Source: WWAP (2015), with data from the IEA World Energy Outlook 2014 Electricity Access Database http://www.worldenergyoutlook.org/resources/energydevelopment/energyaccessdatabase/ (Accessed December 2014)
FIG
URE
3
8
• Thermal power generation and hydropower respectively account for 80% and 15% of global electricity production and generally require large quantities of water.
• Globally, energy demand is projected to increase by one third by 2035, with demand for electricity expected to grow by 70% (IEA, 2013a). Because 90% of thermal power is water intensive, the 70% increase translates to a 20% increase in total freshwater withdrawals (IEA, 2012). Maximizing the water use efficiency of power plants will be a key determinant in achieving a sustainable water future.
• There is much room for development of hydropower installations, particularly in sub-Saharan Africa and South-East Asia where access to modern energy services is lowest and undeveloped technical potential is greatest.
• Wind and solar photovoltaic (PV), accounting for only 3% of the global power mix (IEA, 2012), are the most sustainable forms of power generation. In terms of water impacts, but the intermittent service provided by them needs to be compensated for by other sources of power.
• Renewables can make a substantial contribution to energy supply and freshwater demand at the local or national scales, even if they do remain marginal at the global scale.
• Optimism over biofuels is tempered by concerns over their economic viability and their implications for socio-economic development, food security and environmental sustainability (WWAP, 2014).
Industry• Global water demand for manufacturing is predicted to
increase by 400% from 2000 to 2050, which is much larger than any other sector (OECD, 2012b). Most of this increase will be in emerging economies and developing countries.
• Large corporations, often multinational or global, have made considerable progress in evaluating and reducing their water use and that of their supply chains. Small and medium-sized enterprises (SMEs) are faced with similar water challenges on a smaller scale, but have fewer means and less ability to meet them.
• Balancing the requirements of sustainability against the conventional view of industrial mass production creates a number of conundrums for industry. This stand-off can only be resolved by effecting trade-offs and changing paradigms.
• Industry’s priority is to maximize production rather than water efficiency and conservation. Investment in efficient water treatment technology or cooling processes may have longer payback periods than the immediate returns of alternative short-term investment in production. Moreover low (or non-existent) water prices do not encourage investment in water efficiency. Managers have to see and make the business case to offset shareholder and stakeholder pressure. However, it is incumbent upon the political and legal authorities to develop appropriate incentives for industries with objectives to align business decisions with the public interest.
Adapting to climate variability and change• The global in situ hydrometeorological network has been
in decline since the 1980s, and large regions, mainly in the tropics and subtropics, currently have insufficient rain gauge density and in some instances do not provide good quality data (WMO, 2009).
• This scarcity of good quality and relevant data impacts the performance of socio-economic, hydrological and climate models, and thus limits their usefulness and credibility in supporting decision-making and policy formulation.
• Exploration and support for new forms of data collection would help build the knowledge base and broaden the understanding of trends. For example, remote sensing technologies have a high initial cost but can provide observational data in traditionally data scarce areas.
• Capacity-building of technicians, water managers and policy makers is a priority to optimize the creation of actionable knowledge.
• Many of the biggest and fastest growing megacities are located in coastal areas, and are facing a combination of threats emerging from increasing flood risk and degradation of essential ecosystem services (World Bank, 2010c; Hallegatte et al., 2013).
• Climate change will tend to exacerbate existing equality patterns, including gender inequality. Women are often disproportionately affected by climate change-related natural disasters.

9
REGIONAL PERSPECTIVES
Europe and North America• While many countries in the UNECE region have
high levels of economic development and per capita resource use, poverty is widespread in the Eastern part of the pan-European region. In both cases, the main challenges are increasing resource use efficiency, reducing waste, influencing consumption patterns and choosing appropriate technologies.
• The EU Roadmap to a Resource Efficient Europe requires that by 2020 water abstraction should stay below 20% of available renewable water resources.
• There is friction between water use sectors in many basins in the region (UNECE, 2011). Reconciling different water uses at the basin level and improving policy coherence nationally and across borders will be priorities for many years to come.
• Diffuse agricultural pollution poses significant pressure on 38% of the region’s water bodies.
• Wastewater reuse is recognized to have considerable potential in many EU Member States, but is constrained by a lack of standards and concerns about its safety and its possible effect on the sale of crops.
• The reform of the EU Common Agricultural Policy (CAP) for the post-2013 period may significantly alter water use in agriculture in the EU (ECA, 2014).
Asia and the Pacific• The number of people using improved drinking water
supplies in this heavily populated region increased by 19% in Southern Asia and 23% in Eastern Asia between 1990 and 2012, but nearly 1.7 billion people in the region (with more than half of these living in rural areas) still did not have access to improved sanitation in 2012 (WHO and UNICEF, 2014a).
• This is one of the most rapidly urbanizing regions in the world, with 2.4% annual growth of the urban population. In 2012, 47.5% of the total population (more than 2 billion) lived in urban areas (UNDESA, 2014), with 30% of the region’s urban population living in slums (UN-Habitat, 2013). By 2015, it is estimated that 2.7 billion people will be living in urban areas (UNDESA, 2014). The region faces myriad urban water challenges.
• This is one of the most disaster-prone regions in the world. Exposure of people and assets to hydro-meteorological hazards has been growing over the past few decades. Urbanization localizes people and increasingly valuable economic assets in more hazardous areas such as floodplains (UNESCAP/UNISDR, 2012).
• Groundwater irrigation contributes an estimated US$10–12 billion per year to the Asian economy. When also including earnings from groundwater sales for irrigation, that estimate increases to US$25–30 billion (Shah et al., 2003). Bangladesh, China, India, Nepal and Pakistan together account for nearly half the world’s total groundwater use (IGRAC, 2010).
• In India, the groundwater revolution (the increase in the total number of mechanized wells and tube wells rose from less than 1 million in 1960 to 19 million in 2000) has largely contributed to relieving poverty, but the increase in demand for irrigation has also caused severe groundwater stress in some areas.
• If groundwater resources continue to be used beyond sustainable limits, agricultural production in the region will be threatened, which is the main source of income for the majority of the population.
The Arab Region• Water scarcity stands at the forefront of water-related
challenges that impede progress towards sustainable development in the Arab region. In the Arabian Peninsula, freshwater withdrawal as a percentage internal renewable water resources was estimated at 505% in 2011 (FAO AQUASTAT).
• Population growth and increasing socio-economic pressures have reduced the availability of freshwater resources in this region. Almost 75% of the Arab population live under the water scarcity level of 1,000 m3/capita/year, and nearly half live under extreme water scarcity level of 500 m3/capita/year.
• Out of the total Arab population estimated at 355 million people in 2011, approximately 17% (60 million) do not have access to improved drinking water sources. However, this does not mean that consumers have regular or reliable access to water supplies, or that the quality of water supplied is safe for drinking. 20% (71 million) of the population in Arab region do not have access to improved sanitation facilities (UNESCWA, 2013a; WHO and UNICEF, 2013). Regional conflicts can further exacerbate sustainability of water supply and sanitation services.
10
• There has been a consistent warming trend across the Arab region since the mid-twentieth century (Donat et al., 2014). Drought now affects over two thirds of the land area of UNESCWA member countries (UNESCWA, 2013a). Meanwhile, infrequent yet intensive flash floods damaged and destroyed infrastructure in several countries in 2012 and 2013.
• On average, the agricultural sector continues to be the greatest consumer of water in the Arab region, although consumption levels vary significantly between countries
− representing only 16% of freshwater withdrawals in Djibouti, but 99% in Somalia over the past decade (FAO AQUASTAT).
• Most Arab countries remain dependent upon food imports to offset national food deficits. The urgent social and political need to ensure food security while avoiding negative impact on rural livelihoods has led Arab governments with agriculture-dependent segments of society to pursue irrigation efficiency programmes, wastewater reuse and water harvesting schemes as ways to conserve water resources.
• Although several countries in the region are rich in oil and gas reserves, desalination cannot be a sustainable option unless alternative energy sources are considered.
Investments in nuclear energy are being pursued to diversify the region’s water–energy mix. Dozens of nuclear-powered desalination plants are expected to go online in Arab countries over the next 20 years, with Saudi Arabia alone expected to build up to 16 nuclear desalination facilities by 2030 (WNA, 2013).
Latin America and the Caribbean• In the past decade, Latin America and the Caribbean
has seen significant reductions in poverty, high economic growth and greater macroeconomic stability, as well as the emergence of a middle class (UNECLAC, 2013a and 2013b). However, over 160 million people (about 28% of its population) still live in poverty.
• The levels of provision of water and sanitation achieved in the region compare favourably to those in other developing nations (WHO and UNICEF, 2014b; Jouravlev, 2004; Sato et al., 2013). However, such overall estimates tend to exaggerate real levels of access to services and especially the serious deficiencies in service quality which disproportionally affect rural areas and the poor (Jouravlev, 2011).
• Given the relative abundance of water in the region, the first priority is to improve and consolidate water governance, with a paradigm shift to the sustainable
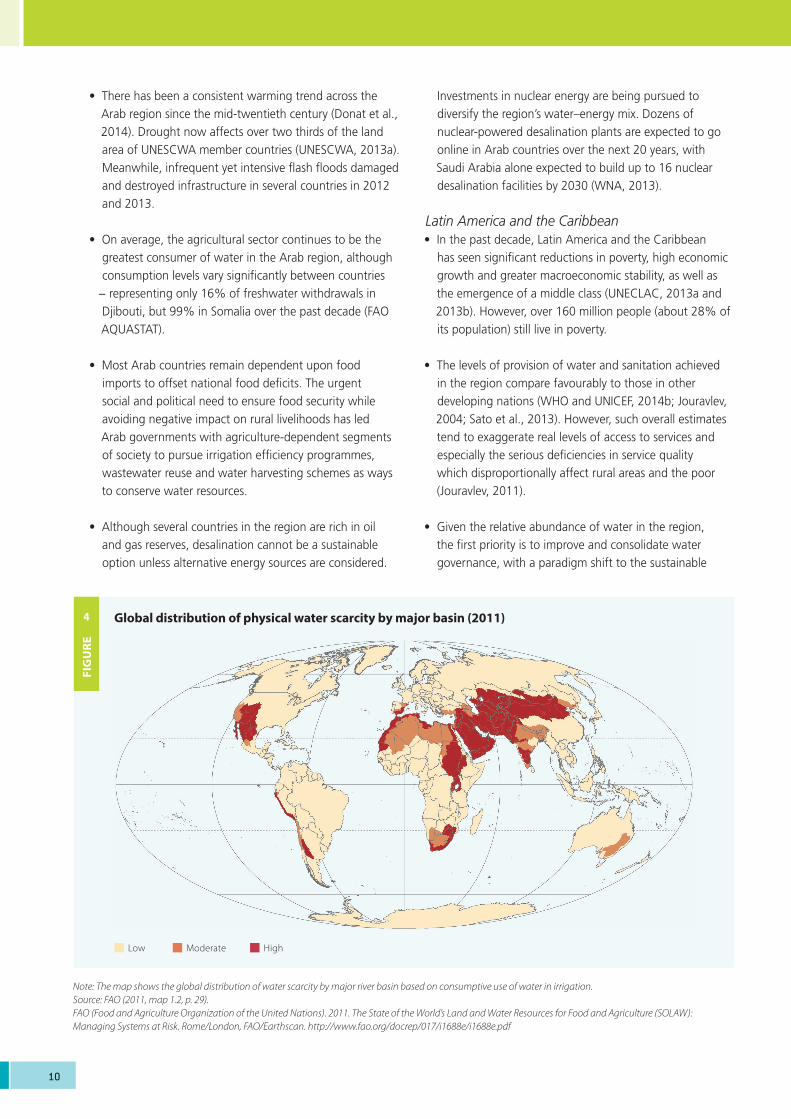
Note: The map shows the global distribution of water scarcity by major river basin based on consumptive use of water in irrigation.Source: FAO (2011, map 1.2, p. 29).FAO (Food and Agriculture Organization of the United Nations). 2011. The State of the World’s Land and Water Resources for Food and Agriculture (SOLAW): Managing Systems at Risk. Rome/London, FAO/Earthscan. http://www.fao.org/docrep/017/i1688e/i1688e.pdf
FIG
URE
4 Global distribution of physical water scarcity by major basin (2011)
HighModerateLow

11
integration of water resources management and use into socio-economic development and poverty reduction.
• The basis of most economies in the region remains the export of natural resources, which use large quantities of water in production. Economic activities and population tend to be concentrated in dry and sub-humid areas. This leads to increasing competition in terms of quantity, but also more recently in terms of quality and opportunity of use for scarce water resources.
Africa• Only 5% of the Africa’s potential water resources are
currently developed and average per capita storage is 200 m3 compared to 6,000 m3 in North America.
• Less than 10% of hydropower potential is utilized for electricity generation (Sperling and Bahri, 2014), while only 57% of the population have access to modern energy services (mainly electricity), which are becoming less reliable with the accelerating rate of urbanization in most of the region’s major cities (IEA, 2013).
• On average about 36% of the total population did not have access to improved water sources and 70% still had no access to improved sanitation in 2012 (WHO and UNICEF, 2014b).
• The backbone of many African economies is agriculture, which is highly dependent on highly variable and unpredictable rainfall patterns. Only 5% of Africa’s cultivated land is irrigated.
• The region is increasingly dependent on imports. African countries spent US$35 billion on food imports (excluding fish) in 2011 and the share accounted for by intra-African trade is less than 5% (Africa Progress Panel, 2014).
RESPONSES AND IMPLEMENTATION
The post-2015 development agenda• No specific targets were included in the Millennium
Development Goals (MDGs) for sustainable water resources management (surface water and groundwater), for water quality, pollution, wastewater treatment or for maintaining the roles of ecosystems. Water-related gender and hygiene dimensions were also lacking, as were water-related disasters.
• Achieving the Sustainable Development Goals (SDGs) by 2030 will require a concerted effort across multiple domains and sectors, and water will need to be
recognized as the nexus through which various SDGs and other development objectives are linked.
• MDGs concentrated efforts on developing countries, whereas the post-2015 SDGs will aim for a worldwide ambit. This is especially important in the context of water services since the drinking water and wastewater infrastructure of developed nations has deteriorated in the past decades (ASCE, 2011) and vulnerable populations still lack access to WASH in rich countries (Government of Canada, 2014).
Achieving The Future We Want• Managing and allocating water across competing
developmental sectors to meet multiple challenges is required to ensure that benefits created for one group of stakeholders do not disadvantage others. Stakeholders and decision-makers in each region, country, basin and community must identify the most appropriate mix of solutions and means of implementation for their particular situation.
• During recent years many countries have reoriented their water policies towards an integrated water resources management approach, which provides a sound basis for countries to adopt more integrated decision-making that provides greater incentives for sustainable development, with water as the catalyst for progress (Planet Under Pressure, 2012). But many countries still face huge implementation problems and water reform is stalling (WWAP, 2006 and 2009).
• New approaches for comprehensive assessments of water resources are urgently needed to support complex decision-making. Assessments require scientific data on the status of hydrological basins and groundwater resources, coupled with metrics concerning water demand, withdrawals, consumption and discharges by different users.
• Present water tariffs are commonly far too low to actually limit excessive water use by wealthy households or industry. While it is important that pricing policies reward users for saving water, responsible use may at times be more effectively fostered through awareness raising and appealing to the common good.
Targeting gender equality• Access to safe drinking water and sanitation is a human
right, yet many women and children are carrying water as a daily chore and may face harassment and violence when collecting water, when using communal toilet facilities or when undertaking open defecation in the evenings.

12 WWDR 2015 FACTS AND FIGURES
• One 2012 estimate suggests that cutting just 15 minutesoff the walking time to a water source could reduceunder-five child mortality by 11% and the prevalenceof nutrition-depleting diarrhoea by 41%. In Ghana, a15-minute reduction in water collection time increasedgirls’ school attendance by 8% to 12%. A Bangladeshschool sanitation project that provided separate facilitiesfor boys and girls boosted girls’ school attendance by anannual average of 11% (UN-Women, 2012; Nauges andStrand, 2011).
• The past two decades have seen a significant increasein gender awareness. However, inclusion of women indecision-making on water development and managementat all levels is still lagging, and results on the groundremain rather limited.
Data and information• Monitoring water availability, use and the related impacts
represents a massive and persistent challenge. Reliable
and objective information is often poor, lacking or otherwise unavailable (WWAP, 2009).
• There is a need to couple data and information on waterresources and their use with indicators of growth invarious economic sectors in order to assess its role andcontribution in terms of economic development.
• In terms of human well-being, much of the focus hasbeen on monitoring access to safe water supply andsanitation services. However, most countries do notreport on the quantity available, possible security threatssuch as risks on the journey to fetch water, frequencyand duration of access or supply, and water’s potentiallyprohibitive cost (Dar and Khan, 2011).
• Indicators that disaggregate data by gender, age andsocial group pose both a challenge and an opportunityfor the Sustainable Development Goals in the post-2015development agenda (UN-Water, 2013).
Note: Unweighted averages; the numbers in parentheses indicate the number of countries averaged. The difference up to 100% is made up by the share of households where a person from outside the household would collect the water or missing information.Source: UNDESA (2010, Fig. 7.1, p. 143, based on sources cited therein).UNDESA (United Nations Department of Economic and Social Affairs). 2010. The World's Women 2010: Trends and Statistics. ST/ESA/STAT/SER.K/19. New York, UNDESA. http://unstats.un.org/unsd/demographic/products/Worldswomen/WW_full%20report_color.pdf
Water on premises
Woman 15 years or older
Man 15 years or older
Girl under 15 years
Boy under 15 years
Sub-Saharan Africa(18 countries)
Rural (%) 11.9 62.9 11.2 7.0 4.1
Urban (%) 51.5 29.0 10.2 4.3 3.1
Asia(18 countries)
Rural (%) 52.3 30.0 12.9 2.5 1.7
Urban (%) 83.9 8.7 5.3 0.8 1.0
Latin America and the Caribbean(6 countries)
Rural (%) 74.2 10.5 12.7 1.0 0.7
Urban (%) 90.8 3.1 4.9 0.2 0.4
Eastern Europe(6 countries)
Rural (%) 75.5 11.7 9.2 0.1 0.2
Urban (%) 95.6 2.0 2.3 0.1 0.1
Percentage distribution of households by person responsible for water collection by region and by urban or rural area (2005–2007)
TAB
LE
2
Prepared by: WWAP | Alice Franek, Engin Koncagul, Richard Connor and Diwata Hunziker
Photo credits: Cover left: Pedestrians at Shibuya crossing in Tokyo (Japan). Photo: Thomas La Mela/Shutterstock.com; Cover right top: Puzhehei Lake in Qiubei County (China) is the focus of a project to reduce pollution. Photo: P. Feiereisen; Cover right bottom: Effects of water scarcity (Timor Leste). Photo: UN Photo/Martine Perret
United Nations World Water Assessment ProgrammeProgramme Office for Global Water Assessment
Division of Water Sciences, UNESCO06134 Colombella, Perugia, Italy
Email: [email protected]://www.unesco.org/water/wwap
SC/2
015/
PI/H/2
We acknowledge with gratitude the financial support provided by the Government of Italy and Umbria Region.