water footprints of nations: water use by people as a...
TRANSCRIPT
Water Resour Manage (2006)
DOI 10.1007/s11269-006-9039-x
ORIGINAL ART ICLE
Water footprints of nations: Water use by people as afunction of their consumption pattern
A. Y. Hoekstra · A. K. Chapagain
Received: 18 January 2005 / Accepted: 12 October 2005C© Springer Science + Business Media B.V. 2006
Abstract The water footprint shows the extent of water use in relation to consumption
of people. The water footprint of a country is defined as the volume of water needed for
the production of the goods and services consumed by the inhabitants of the country. The
internal water footprint is the volume of water used from domestic water resources; the
external water footprint is the volume of water used in other countries to produce goods and
services imported and consumed by the inhabitants of the country. The study calculates the
water footprint for each nation of the world for the period 1997–2001. The USA appears to
have an average water footprint of 2480 m3/cap/yr, while China has an average footprint of
700 m3/cap/yr. The global average water footprint is 1240 m3/cap/yr. The four major direct
factors determining the water footprint of a country are: volume of consumption (related to
the gross national income); consumption pattern (e.g. high versus low meat consumption);
climate (growth conditions); and agricultural practice (water use efficiency).
Keywords Water footprint . Consumption . Virtual water . Indicators . Water use
efficiency . External water dependency
Introduction
Databases on water use traditionally show three columns of water use: water withdrawals
in the domestic, agricultural and industrial sector respectively (Gleick, 1993; Shiklomanov,
2000; FAO, 2003). A water expert being asked to assess the water demand in a particular
country will generally add the water withdrawals for the different sectors of the economy.
Although useful information, this does not tell much about the water actually needed by the
people in the country in relation to their consumption pattern. The fact is that many goods
A. Y. Hoekstra (�)University of Twente, Enschede, The Netherlandse-mail: [email protected]
A. K. ChapagainUNESCO-IHE, Delft, The Netherlands
Springer

Water Resour Manage (2006)
consumed by the inhabitants of a country are produced in other countries, which means that it
can happen that the real water demand of a population is much higher than the national water
withdrawals do suggest. The reverse can be the case as well: national water withdrawals
are substantial, but a large amount of the products are being exported for consumption
elsewhere.
In 2002, the water footprint concept was introduced in order to have a consumption-
based indicator of water use that could provide useful information in addition to the tra-
ditional production-sector-based indicators of water use (Hoekstra and Hung, 2002). The
water footprint of a nation is defined as the total volume of freshwater that is used to pro-
duce the goods and services consumed by the people of the nation. Since not all goods
consumed in one particular country are produced in that country, the water footprint consists
of two parts: use of domestic water resources and use of water outside the borders of the
country.
The water footprint has been developed in analogy to the ecological footprint concept
as was introduced in the 1990s (Rees, 1992; Wackernagel and Rees, 1996; Wackernagel
et al., 1997). The ‘ecological footprint’ of a population represents the area of productive
land and aquatic ecosystems required to produce the resources used, and to assimilate the
wastes produced, by a certain population at a specified material standard of living, wherever
on earth that land may be located. Whereas the ‘ecological footprint’ thus quantifies the areaneeded to sustain people’s living, the ‘water footprint’ indicates the water required to sustain
a population.
The water footprint concept is closely linked to the virtual water concept. Virtual water
is defined as the volume of water required to produce a commodity or service. The concept
was introduced by Allan in the early 1990s (Allan, 1993, 1994) when studying the option
of importing virtual water (as opposed to real water) as a partial solution to problems of
water scarcity in the Middle East. Allan elaborated on the idea of using virtual water import
(coming along with food imports) as a tool to release the pressure on the scarcely available
domestic water resources. Virtual water import thus becomes an alternative water source,
next to endogenous water sources. Imported virtual water has therefore also been called
‘exogenous water’ (Haddadin, 2003).
When assessing the water footprint of a nation, it is essential to quantify the flows of virtual
water leaving and entering the country. If one takes the use of domestic water resources as
a starting point for the assessment of a nation’s water footprint, one should subtract the
virtual water flows that leave the country and add the virtual water flows that enter the
country.
The objective of this study is to assess and analyse the water footprints of nations. The study
builds on two earlier studies. Hoekstra and Hung (2002, 2005) have quantified the virtual
water flows related to the international trade of crop products. Chapagain and Hoekstra (2003)
have done a similar study for livestock and livestock products. The concerned time period in
these two studies is 1995–1999. The present study takes the period of 1997–2001 and refines
the earlier studies by making a number of improvements and extensions.
Method
A nation’s water footprint has two components, the internal and the external water footprint.
The internal water footprint (IWFP) is defined as the use of domestic water resources to
produce goods and services consumed by inhabitants of the country. It is the sum of the total
water volume used from the domestic water resources in the national economy minus the
Springer

Water Resour Manage (2006)
volume of virtual water export to other countries insofar related to export of domestically
produced products:
I W F P = AWU + I W W + DW W − V W Edom (1)
Here, AWU is the agricultural water use, taken equal to the evaporative water demand of
the crops; IWW and DWW are the water withdrawals in the industrial and domestic sectors
respectively; and VWEdom is the virtual water export to other countries insofar related to
export of domestically produced products. The agricultural water use includes both effective
rainfall (the portion of the total precipitation which is retained by the soil and used for crop
production) and the part of irrigation water used effectively for crop production. Here we do
not include irrigation losses in the term of agricultural water use assuming that they largely
return to the resource base and thus can be reused.
The external water footprint of a country (EWFP) is defined as the annual volume of water
resources used in other countries to produce goods and services consumed by the inhabitants
of the country concerned. It is equal to the so-called virtual water import into the country
minus the volume of virtual water exported to other countries as a result of re-export of
imported products.
EW F P = V W I − V W Ere−export (2)
Both the internal and the external water footprint include the use of blue water (ground and
surface water) and the use of green water (moisture stored in soil strata).
The use of domestic water resources comprises water use in the agricultural, industrial and
domestic sectors. For the latter two sectors we have used data from AQUASTAT (FAO, 2003).
Though significant fractions of domestic and industrial water withdrawals do not evaporate
but return to either the groundwater or surface water system, these return flows are generally
polluted, so that they have been included in the water footprint calculations. The total volume
of water use in the agricultural sector has been calculated in this study based on the total
volume of crop produced and its corresponding virtual water content. For the calculation of
the virtual water content of crop and livestock products we have used the methodology as
described in Chapagain and Hoekstra (2004). In summary, the virtual water content (m3/ton)
of primary crops has been calculated based on crop water requirements and yields. Crop water
requirement have been calculated per crop and per country using the methodology developed
by FAO (Allen et al., 1998). The virtual water content of crop products is calculated based on
product fractions (ton of crop product obtained per ton of primary crop) and value fractions
(the market value of one crop product divided by the aggregated market value of all crop
products derived from one primary crop). The virtual water content (m3/ton) of live animals
has been calculated based on the virtual water content of their feed and the volumes of
drinking and service water consumed during their lifetime. We have calculated the virtual
water content for eight major animal categories: beef cattle, dairy cows, swine, sheep, goats,
fowls/poultry (meat purpose), laying hens and horses. The calculation of the virtual water
content of livestock products is again based on product fractions and value fractions.
Virtual water flows between nations have been calculated by multiplying commodity trade
flows by their associated virtual water content:
V W F[ne, ni , c] = CT [ne, ni , c] × V WC[ne, c] (3)
Springer

Water Resour Manage (2006)
in which VWF denotes the virtual water flow (m3yr−1) from exporting country ne to importing
country ni as a result of trade in commodity c; CT the commodity trade (ton yr−1) from the
exporting to the importing country; and VWC the virtual water content (m3 ton−1) of the
commodity, which is defined as the volume of water required to produce the commodity in
the exporting country. We have taken into account the trade between 243 countries for which
international trade data are available in the Personal Computer Trade Analysis System of the
International Trade Centre, produced in collaboration with UNCTAD/WTO. It covers trade
data from 146 reporting countries disaggregated by product and partner countries (ITC, 2004).
We have carried out calculations for 285 crop products and 123 livestock products. The virtual
water content of an industrial product can be calculated in a similar way as described earlier
for agricultural products. There are however numerous categories of industrial products with
a diverse range of production methods and detailed standardised national statistics related to
the production and consumption of industrial products are hard to find. As the global volume
of water used in the industrial sector is only 716 Gm3/yr (≈10% of total global water use),
we have – per country – simply calculated an average virtual water content per dollar added
value in the industrial sector (m3/US$) as the ratio of the industrial water withdrawal (m3/yr)
in a country to the total added value of the industrial sector (US$ /yr), which is a component
of the Gross Domestic Product.
Water needs by product
The total volume of water used globally for crop production is 6390 Gm3/yr at field level. Rice
has the largest share in the total volume water used for global crop production. It consumes
about 1359 Gm3/yr, which is about 21% of the total volume of water used for crop production
at field level. The second largest water consumer is wheat (12%). The contribution of some
major crops to the global water footprint insofar related to food consumption is presented in
Figure 1. Although the total volume of the world rice production is about equal to the wheat
production, rice consumes much more water per ton of production. The difference is due
Cassava
2%
Natural Rubber
1%
Oil Palm Fruit
2%
Groundnuts in Shell
2%
Rice, Paddy
21%
Other
37%
Other minor crops
26%
Potatoes
1%
Cocoa Beans
1%Wheat
12%
Maize
9%
Soybeans
4%
Sugar Cane
3%
Seed Cotton
3%
Barley
3%Sorghum
3%Coconuts
2%
Millet
2%
Coffee, Green
2%
Fig. 1 Contribution of different crops to the global water footprint
Springer

Water Resour Manage (2006)
to the higher evaporative demand for rice production. As a result, the global average virtual
water content of rice (paddy) is 2291 m3/ton and for wheat 1334 m3/ton.
The virtual water content of rice (broken) that a consumer buys in the shop is about
3420 m3/ton. This is larger than the virtual water content of paddy rice as harvested from the
field because of the weight loss if paddy rice is processed into broken rice. The virtual water
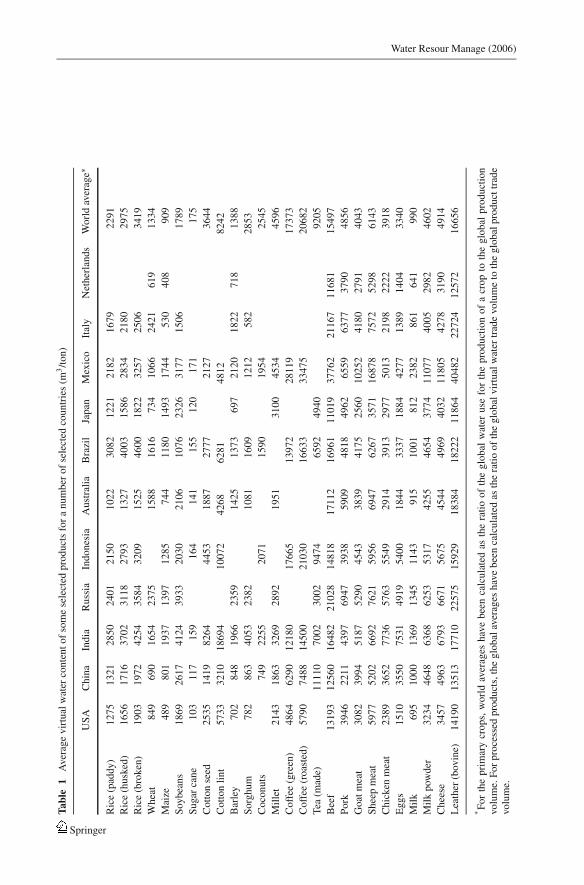
content of some selected crop and livestock products for a number of selected countries are
presented in Table 1.
In general, livestock products have a higher virtual water content than crop products. This
is because a live animal consumes a lot of feed crops, drinking water and service water in its
lifetime before it produces some output. We consider here an example of beef produced in an
industrial farming system. It takes in average 3 years before it is slaughtered to produce about
200 kg of boneless beef. It consumes nearly 1300 kg of grains (wheat, oats, barley, corn, dry
peas, soybean meal and other small grains), 7200 kg of roughages (pasture, dry hay, silage
and other roughages), 24 cubic meter of water for drinking and 7 cubic meter of water for
servicing. This means that to produce one kilogram of boneless beef, we use about 6.5 kg of
grain, 36 kg of roughages, and 155 l of water (only for drinking and servicing). Producing the
volume of feed requires about 15340 l of water in average. With every step of food processing
we loose part of the material as a result of selection and inefficiencies. The higher we go up
in the product chain, the higher will be the virtual water content of the product. For example,
the global average virtual water content of maize, wheat and rice (husked) is 900, 1300 and
3000 m3/ton respectively, whereas the virtual water content of chicken meat, pork and beef
is 3900, 4900 and 15500 m3/ton respectively. However, the virtual water content of products
strongly varies from place to place, depending upon the climate, technology adopted for
farming and corresponding yields.
The units used so far to express the virtual water content of various products are in terms
of cubic meters of water per ton of the product. A consumer might be more interested to
know how much water it consumes per unit of consumption. One cup of coffee requires
for instance 140 l of water in average, one hamburger 2400 l and one cotton T-shirt 2000 l
(Table 2).
The global average virtual water content of industrial products is 80 l per US$ . In the
USA, industrial products take nearly 100 l per US$ . In Germany and the Netherlands, average
virtual water content of industrial products is about 50 l per US$ . Industrial products from
Japan, Australia and Canada take only 10–15 l per US$ . In world’s largest developing nations,
China and India, the average virtual water content of industrial products is 20–25 l per US$ .
Water footprints of nations
The global water footprint is 7450 Gm3/yr, which is 1240 m3/cap/yr in average. In absolute
terms, India is the country with the largest footprint in the world, with a total footprint of
987 Gm3/yr. However, while India contributes 17% to the global population, the people in
India contribute only 13% to the global water footprint. On a relative basis, it is the people
of the USA that have the largest water footprint, with 2480 m3/yr per capita, followed by
the people in south European countries such as Greece, Italy and Spain (2300–2400 m3/yr
per capita). High water footprints can also be found in Malaysia and Thailand. At the other
side of the scale, the Chinese people have a relatively low water footprint with an average of
700 m3/yr per capita. The average per capita water footprints of nations are shown in Figure 2.
The data are shown in Table 3 for a few selected countries.
Springer
Water Resour Manage (2006)
Tabl
e1
Aver
age
vir
tual
wat
erco
nte
nt
of
som
ese
lect
edp
rod
uct
sfo
ra
nu
mb
ero
fse
lect
edco
un
trie
s(m
3/t
on
)
US
AC
hin
aIn
dia
Ru
ssia
Ind
on
esia
Au
stra
lia
Bra
zil
Jap
anM
exic
oIt
aly
Net
her
lan
ds
Wo
rld
aver
age∗
Ric
e(p
add
y)
12
75
13
21
28
50
24
01
21
50
10
22
30
82
12
21
21
82
16
79
22
91
Ric
e(h
usk
ed)
16
56
17
16
37
02
31
18
27
93
13
27
40
03
15
86
28
34
21
80
29
75
Ric
e(b
roken
)1
90
31
97
24
25
43
58
43
20
91
52
54
60
01
82
23
25
72
50
63
41
9
Wh
eat
84
96
90
16
54
23
75
15
88
16
16
73
41
06
62
42
16
19
13
34
Mai
ze4
89
80
11
93
71
39
71
28
57
44
11
80
14
93
17
44
53
04
08
90
9
Soy
bea
ns
18
69
26
17
41
24
39
33
20
30
21
06
10
76
23
26
31
77
15
06
17
89
Su
gar
can
e1
03
11
71
59
16
41
41
15
51
20
17
11
75
Co
tto
nse
ed2
53
51
41
98
26
44
45
31
88
72
77
72
12
73
64
4
Co
tto
nli
nt
57
33
32
10
18
69
41
00
72
42
68
62
81
48
12
82
42
Bar
ley
70
28
48
19
66
23
59
14
25
13
73
69
72
12
01
82
27
18
13
88
So
rgh
um
78
28
63
40
53
23
82
10
81
16
09
12
12
58
22
85
3
Co
con
uts
74
92
25
52
07
11
59
01
95
42
54
5
Mil
let
21
43
18
63
32
69
28
92
19
51
31
00
45
34
45
96
Co
ffee
(gre
en)
48
64
62
90
12
18
01
76
65
13
97
22
81
19
17
37
3
Co
ffee
(ro
aste
d)
57
90
74
88
14
50
02
10
30
16
63
33
34
75
20
68
2
Tea
(mad
e)1
11
10
70
02
30
02
94
74
65
92
49
40
92
05
Bee
f1
31
93
12
56
01
64
82
21
02
81
48
18
17
11
21
69
61
11
01
93
77
62
21
16
71
16
81
15
49
7
Po
rk3
94
62
21
14
39
76
94
73
93
85
90
94
81
84
96
26
55
96
37
73
79
04
85
6
Go
atm
eat
30
82
39
94
51
87
52
90
45
43
38
39
41
75
25
60
10
25
24
18
02
79
14
04
3
Sh
eep
mea
t5
97
75
20
26
69
27
62
15
95
66
94
76
26
73
57
11
68
78
75
72
52
98
61
43
Ch
icken
mea
t2
38
93
65
27
73
65
76
35
54
92
91
43
91
32
97
75
01
32
19
82
22
23
91
8
Eg
gs
15
10
35
50
75
31
49
19
54
00
18
44
33
37
18
84
42
77
13
89
14
04
33
40
Mil
k6
95
10
00
13
69
13
45
11
43
91
51
00
18
12
23
82
86
16
41
99
0
Mil
kp
owd
er3
23
44
64
86
36
86
25
35
31
74
25
54
65
43
77
41
10
77
40
05
29
82
46
02
Ch
eese
34
57
49
63
67
93
66
71
56
75
45
44
49
69
40
32
11
80
54
27
83
19
04
91
4
Lea
ther
(bov
ine)
14
19
01
35
13
17
71
02
25
75
15
92
91
83
84
18
22
21
18
64
40
48
22
27
24
12
57
21
66
56
∗ Fo
rth
ep
rim
ary
cro
ps,
wo
rld
aver
ages
hav
eb
een
calc
ula
ted
asth
era
tio
of
the
glo
bal
wat
eru
sefo
rth
ep
rod
uct
ion
of
acr
op
toth
eg
lob
alp
rod
uct
ion
volu
me.
Fo
rp
roce
ssed
pro
du
cts,
the
glo
bal
aver
ages
hav
eb
een
calc
ula
ted
asth
era
tio
of
the
glo
bal
vir
tual
wat
ertr
ade
volu
me
toth
eg
lob
alp
rod
uct
trad
evo
lum
e.
Springer

Water Resour Manage (2006)
Table 2 Global average virtual water content of some selected products, per unit of product
Product Virtual water content (litres)
1 glass of beer (250 ml) 75
1 glass of milk (200 ml) 200
1 cup of coffee (125 ml) 140
1 cup of tea (250 ml) 35
1 slice of bread (30 g) 40
1 slice of bread (30 g) with cheese(10 g) 90
1 potato (100 g) 25
1 apple (100 g) 70
1 cotton T-shirt (250 g) 2000
1 sheet of A4-paper (80 g/m2) 10
1 glass of wine (125 ml) 120
1 glass of apple juice (200 ml) 190
1 glass of orange juice (200 ml) 170
1 bag of potato crisps (200 g) 185
1 egg (40 g) 135
1 hamburger (150 g) 2400
1 tomato (70 g) 13
1 orange (100 g) 50
1 pair of shoes (bovine leather) 8000
1 microchip (2 g) 32
Fig. 2 Average national water footprint per capita (m3/capita/yr). Green means that the nation’s water footprintis equal to or smaller than global average. Countries with red have a water footprint beyond the global average
The size of the global water footprint is largely determined by the consumption of food
and other agricultural products (Figure 3). The estimated contribution of agriculture to the
total water use (6390 Gm3/yr) is even bigger than suggested by earlier statistics due to the
inclusion of green water use (use of soil water). If we include irrigation losses, which globally
add up to about 1590 Gm3/yr (Chapagain and Hoekstra, 2004), the total volume of water used
in agriculture becomes 7980 Gm3/yr. About one third of this amount is blue water withdrawn
for irrigation; the remaining two thirds is green water (soil water).
The four major direct factors determining the water footprint of a country are: volume of
consumption (related to the gross national income); consumption pattern (e.g. high versus
Springer

Water Resour Manage (2006)Ta
ble
3C
om
po
siti
on
of
the
wat
erfo
otp
rin
tfo
rso
me
sele
cted
cou
ntr
ies.
Per
iod
:1
99
7–
20
01
Use
of
dom
esti
cw
ater
reso
urc
esU
seof
fore
ign
wat
erre
sourc
esW
ater
footp
rint
by
consu
mpti
on
cate
gory
Agri
cult
ura
lgoods
Indust
rial
goods
Cro
pev
apotr
ansp
irat
ion
∗In
dust
rial
wat
erw
ithdra
wal
For
nat
ional
consu
mpti
on
Dom
esti
cw
ater
Dom
esti
cF
or
re-e
xport
Wat
erfo
otp
rint
Inte
rnal
Inte
rnal
Exte
rnal
Inte
rnal
Exte
rnal
wat
erF
or
nat
ional
For
nat
ional
Agri
cult
ura
lIn
dust
rial
of
import
edw
ater
wat
erw
ater
wat
erw
ater
wit
hdra
wal
consu
mpti
on
For
export
consu
mpti
on
For
export
goods
goods
pro
duct
sT
ota
lP
erca
pit
afo
otp
rint
footp
rint
footp
rint
footp
rint
footp
rint
Countr
yP
opula
tion
(Gm
3/y
r)(G
m3/y
r)(G
m3/y
r)(G
m3/y
r)(G
m3/y
r)(G
m3/y
r)(G
m3/y
r)(G
m3/y
r)(G
m3/y
r)(m
3/c
ap/y
r)(m
3/c
ap/y
r)(m
3/c
ap/y
r)(m
3/c
ap/y
r)(m
3/c
ap/y
r)(m
3/c
ap/y
r)
Aust
rali
a19071705
6.5
114.0
368.6
71.2
29
0.1
20.7
84.0
24.2
126.5
61393
341
736
41
64
211
Ban
gla
des
h129942975
2.1
2109.9
81.3
80.3
44
0.0
83.7
10.3
40.1
3116.4
9896
16
846
29
33
Bra
zil
169109675
11.7
6195.2
961.0
18.6
66
1.6
314.7
63.1
15.2
0233.5
91381
70
1155
87
51
18
Can
ada
30649675
8.5
530.2
252.3
411.2
11
20.3
67.7
45.0
722.6
262.8
02049
279
986
252
366
166
Chin
a1257521250
33.3
2711.1
021.5
581.5
31
45.7
349.9
97.4
55.6
9883.3
9702
26
565
40
65
6
Egypt
63375735
4.1
645.7
81.5
56.4
23
0.6
612.4
90.6
40.4
969.5
01097
66
722
197
101
10
Fra
nce
58775400
6.1
647.8
434.6
315.0
94
12.8
030.4
010.6
931.0
7110.1
91875
105
814
517
257
182
Ger
man
y82169250
5.4
535.6
418.8
418.7
71
13.1
549.5
917.5
038.4
8126.9
51545
66
434
604
228
213
India
1007369125
38.6
2913.7
035.2
919.0
65
6.0
413.7
52.2
41.2
4987.3
8980
38
907
14
19
2
Indones
ia204920450
5.6
7236.2
222.6
20.4
04
0.0
626.0
91.5
82.7
4269.9
61317
28
1153
127
28
Ital
y57718000
7.9
747.8
212.3
510.1
33
5.6
059.9
78.6
920.2
9134.5
92332
138
829
1039
176
151
Japan
126741225
17.2
020.9
70.4
013.7
02
2.1
077.8
416.3
84.0
1146.0
91153
136
165
614
108
129
Jord
an4813708
0.2
11.4
50.0
70.0
35
0.0
04.3
70.2
10.2
26.2
71303
44
301
908
743
Mex
ico
97291745
13.5
581.4
812.2
62.9
98
1.1
335.0
97.0
57.9
4140.1
61441
139
837
361
31
72
Net
her
lands
15865250
0.4
40.5
02.5
12.5
62
2.2
09.3
06.6
152.8
419.4
01223
28
31
586
161
417
Pak
ista
n136475525
2.8
8152.7
57.5
71.7
06
1.2
88.5
50.3
30.6
7166.2
21218
21
1119
63
12
2
Russ
ia145878750
14.3
4201.2
68.9
613.2
51
34.8
341.3
30.8
03.9
4270.9
81858
98
1380
283
91
5
South
Afr
ica
42387403
2.4
327.3
26.0
51.1
23
0.4
07.1
81.4
22.1
039.4
7931
57
644
169
26
33
Thai
land
60487800
1.8
3120.1
738.4
91.2
39
0.5
58.7
32.4
93.9
0134.4
62223
30
1987
144
20
41
Unit
edK
ingdom
58669403
2.2
112.7
93.3
86.6
73
1.4
634.7
316.6
712.8
373.0
71245
38
218
592
114
284
US
A280343325
60.8
0334.2
4138.9
6170.7
77
44.7
274.9
155.2
945.6
2696.0
12483
217
1192
267
609
197
Glo
bal
tota
l/av
g.
5994251631
344
5434
957
476
240
957
240
427
7452
1243
57
907
160
79
40
∗ Incl
ud
esb
oth
blu
ean
dg
reen
wat
eru
sein
agri
cult
ure
Springer

Water Resour Manage (2006)
Domestic water consumption
5%
Industrial products
6%
Agricultural products
73%
External water footprint
16 %
Industrial products
3%
Agricultural products
13%
Internal water footprint
84.0%
Fig. 3 Contribution of different consumption categories to the global water footprint, with a distinctionbetween the internal and external footprint
low meat consumption); climate (growth conditions); and agricultural practice (water use
efficiency). In rich countries, people generally consume more goods and services, which
immediately translates into increased water footprints. But it is not consumption volume
alone that determines the water demand of people. The composition of the consumption
package is relevant too, because some goods in particular require a lot of water (bovine meat,
rice). In many poor countries it is a combination of unfavourable climatic conditions (high
evaporative demand) and bad agricultural practice (resulting in low water productivity) that
contributes to a high water footprint. Underlying factors that contribute to bad agricultural
practice and thus high water footprints are the lack of proper water pricing, the presence
of subsidies, the use of water inefficient technology and lack of awareness of simple water
saving measures among farmers.
The influence of the various determinants varies from country to country. The water
footprint of the USA is high (2480 m3/cap/yr) partly because of large meat consumption per
capita and high consumption of industrial products. The water footprint of Iran is relatively
high (1624 m3/cap/yr) partly because of low yields in crop production and partly because
of high evapotranspiration. In the USA the industrial component of the water footprint is
806 m3/cap/yr whereas in Iran it is only 24 m3/cap/yr.
The aggregated external water footprints of nations in the world constitute 16% of the
total global water footprint (Figure 3). However, the share of the external water footprint
strongly varies from country to country. Some African countries, such as Sudan, Mali, Nigeria,
Ethiopia, Malawi and Chad have hardly any external water footprint, simply because they
have little import. Some European countries on the other hand, e.g. Italy, Germany, the UK
and the Netherlands have external water footprints contributing 50–80% to the total water
footprint. The agricultural products that contribute most to the external water footprints of
nations are: bovine meat, soybean, wheat, cocoa, rice, cotton and maize.
Eight countries – India, China, the USA, the Russian Federation, Indonesia, Nigeria,
Brazil and Pakistan – together contribute fifty percent to the total global water footprint.
India (13%), China (12%) and the USA (9%) are the largest consumers of the global water
resources (Figure 4).
Both the size of the national water footprint and its composition differs between countries
(Figure 5). On the one end we see China with a relatively low water footprint per capita, and on
Springer

Water Resour Manage (2006)
Mexico
2%
Thailand
2%
Other
44%
Other
58%
Japan
2%
Pakistan
2%
Brazil
3%
Nigeria
3%
Indonesia
4%
Russian Federation
4%
USA
9%
China
12%
India
13%
Fig. 4 Contribution of major consumers to the global water footprint
0
500
1000
1500
2000
2500
3000
ani
hC
aid
nI
na
pa
J
nat
sik
aP
ais
en
od
nI
liz
arB
oci
xe
M
ais
su
R
aire
giN
dn
alia
hT
ylatI
AS
U
m( tnir
pto
of ret
aW
3)r
y/p
ac/
Domestic water consumption Industrial goods Agricultural goods
Fig. 5 The national water footprint per capita and the contribution of different consumption categories forsome selected countries
the other end the USA. In the rich countries consumption of industrial goods has a relatively
large contribution to the total water footprint if compared with developing countries. The
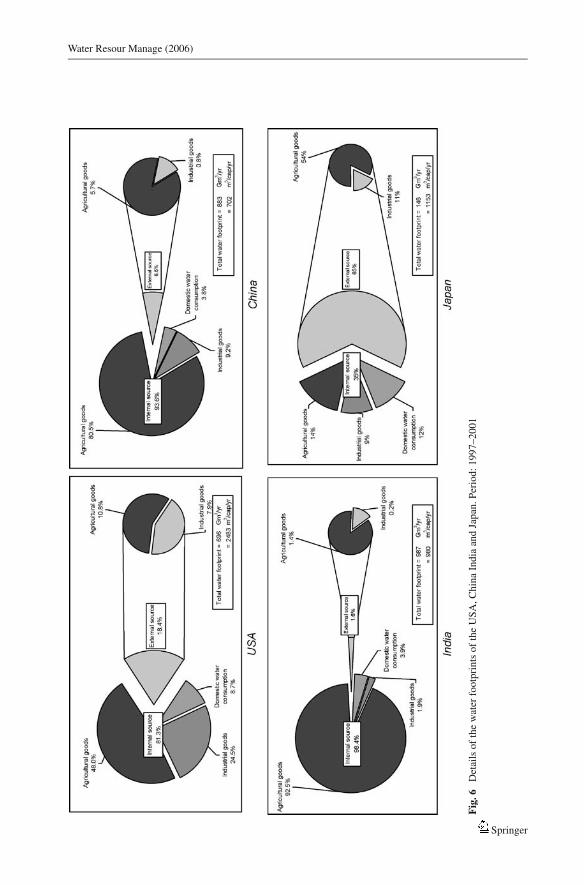
water footprints of the USA, China, India and Japan are presented in more detail in Figure 6.
The contribution of the external water footprint to the total water footprint is very large in
Japan if compared to the other three countries. The consumption of industrial goods very
significantly contributes to the total water footprint of the USA (32%), but not in India
(2%).
Conclusion
The global water footprint is 7450 Gm3/yr, which is in average 1240 m3/cap/yr. The differ-
ences between countries are large: the USA has an average water footprint of 2480 m3/cap/yr
whereas China has an average water footprint of 700 m3/cap/yr. There are four most im-
portant direct factors explaining high water footprints. A first factor is the total volume of
Springer
Water Resour Manage (2006)
Fig
.6D
etai
lso
fth
ew
ater
foo
tpri
nts
of
the
US
A,C
hin
aIn
dia
and
Jap
an.P
erio
d:
19
97
–2
00
1
Springer

Water Resour Manage (2006)
consumption, which is generally related to gross national income of a country. This partially
explains the high water footprints of for instance the USA, Italy and Switzerland. A second
factor behind a high water footprint can be that people have a water-intensive consump-
tion pattern. Particularly high consumption of meat significantly contributes to a high water
footprint. This factor partially explains the high water footprints of countries such as the
USA, Canada, France, Spain, Portugal, Italy and Greece. The average meat consumption in
the United States is for instance 120 kg/yr, more than three times the world-average meat
consumption. Next to meat consumption, high consumption of industrial goods significantly
contributes to the total water footprints of rich countries. The third factor is climate. In re-
gions with a high evaporative demand, the water requirement per unit of crop production is
relatively large. This factor partially explains the high water footprints in countries such as
Senegal, Mali, Sudan, Chad, Nigeria and Syria. A fourth factor that can explain high water
footprints is water-inefficient agricultural practice, which means that water productivity in
terms of output per drop of water is relatively low. This factor partly explains the high water
footprints of countries such as Thailand, Cambodia, Turkmenistan, Sudan, Mali and Nigeria.
In Thailand for instance, rice yields averaged 2.5 ton/ha in the period 1997–2001, while the
global average in the same period was 3.9 ton/ha.
Reducing water footprints can be done in various ways. A first way is to break the seem-
ingly obvious link between economic growth and increased water use, for instance by adopt-
ing production techniques that require less water per unit of product. Water productivity in
agriculture can be improved for instance by applying advanced techniques of rainwater har-
vesting and supplementary irrigation. A second way of reducing water footprints is to shift
to consumptions patterns that require less water, for instance by reducing meat consumption.
However, it has been debated whether this is a feasible road to go, since the world-wide
trend has been that meat consumption increases rather than decreases. Probably a broader
and subtler approach will be needed, where consumption patterns are influenced by pricing,
awareness raising, labelling of products or introduction of other incentives that make people
change their consumption behaviour. Water costs are generally not well reflected in the price
of products due to the subsidies in the water sector. Besides, the general public is – although
often aware of energy requirements – hardly aware of the water requirements in producing
their goods and services.
A third method that can be used – not yet broadly recognized as such – is to shift production
from areas with low water-productivity to areas with high water productivity, thus increasing
global water use efficiency (Chapagain et al., 2005a). For instance, Jordan has successfully
externalised its water footprint by importing wheat and rice products from the USA, which
has higher water productivity than Jordan.
The water footprint of a nation is an indicator of water use in relation to the consumption
volume and pattern of the people. As an aggregated indicator it shows the total water require-
ment of a nation, a rough measure of the impact of human consumption on the natural water
environment. More information about the precise components and characteristics of the total
water footprint will be needed, however, before one can make a more balanced assessment
of the effects on the natural water systems. For instance, one has to look at what is blue
versus green water use, because use of blue water often affects the environment more than
green water use. Also it is relevant to consider the internal versus the external water foot-
print. Externalising the water footprint for instance means externalising the environmental
impacts. Also one has to realise that some parts of the total water footprint concern use of
water for which no alternative use is possible, while other parts relate to water that could
have been used for other purposes with higher added value. There is a difference for instance
between beef produced in extensively grazed grasslands of Botswana (use of green water
Springer

Water Resour Manage (2006)
without alternative use) and beef produced in an industrial livestock farm in the Netherlands
(partially fed with imported irrigated feed crops).
The current study has focused on the quantification of consumptive water use, i.e. the
volumes of water from groundwater, surface water and soil water that evaporate. The effect
of water pollution was accounted for to a limited extent by including the (polluted) return
flows in the domestic and industrial sector. The calculated water footprints thus consists of
two components: consumptive water use and wastewater production. The effect of pollution
has been underestimated however in the current calculations of the national water footprints,
because one cubic metre of wastewater should not count for one, because it generally pollutes
much more cubic metres of water after disposal (various authors have suggested a factor of
ten to fifty). The impact of water pollution can be better assessed by quantifying the dilution
water volumes required to dilute waste flows to such extent that the quality of the water
remains below agreed water quality standards. We have shown this in a case study for the
water footprints of nations related to cotton consumption (Chapagain et al., 2005b).
International water dependencies are substantial and are likely to increase with continued
global trade liberalisation. Today, 16% of global water use is not for producing products
for domestic consumption but for making products for export. Considering this substantial
percentage and the upward trend, we suggest that future national and regional water policy
studies should include an analysis of international or interregional virtual water flows.
References
Allan JA (1993) Fortunately there are substitutes for water otherwise our hydro-political futures would beimpossible. In: Priorities for water resources allocation and management, ODA, London, pp 13–26
Allan JA (1994) Overall perspectives on countries and regions. In: Rogers P, Lydon P (eds) Water in the ArabWorld: perspectives and prognoses. Harvard University Press, Cambridge, Massachusetts, pp 65–100
Allen RG, Pereira LS, Raes D, Smith M (1998) Crop evapotranspiration - Guidelines for com-puting crop water requirements – FAO Irrigation and Drainage Paper 56, FAO, Rome, Italy,http://www.fao.org/docrep/X0490E/x0490e00.htm
Chapagain AK, Hoekstra AY (2003) Virtual water flows between nations in relation to trade in livestock andlivestock products. Value of Water Research Report Series No. 13, UNESCO-IHE, Delft, The Netherlands,http://www.waterfootprint.org/Reports/Report13.pdf
Chapagain AK, Hoekstra AY, Savenije HHG (2005a) Saving water through global trade.Value of Water Research Report Series No. 17, UNESCO-IHE, Delft, the Netherlands,http://www.waterfootprint.org/Reports/Report17.pdf
Chapagain AK, Hoekstra AY, Savenije HHG, Gautam R (2005b) The water footprint of cottonconsumption. Value of Water Research Report Series No. 18, UNESCO-IHE, The Netherlands,http://www.waterfootprint.org/Reports/Report18.pdf
Chapagain AK, Hoekstra AY (2004) Water footprints of nations. Value of Water Research Report Series No.16, UNESCO-IHE, Delft, The Netherlands, http://www.waterfootprint.org/Reports/Report16.pdf
FAO (2003) AQUASTAT 2003. Food and Agriculture Organization of the United Nations, Rome, Italy,ftp://ftp.fao.org/agl/aglw/aquastat/aquastat2003.xls
Gleick PH (ed) (1993) Water in crisis: A guide to the world’s fresh water resources. Oxford University Press,Oxford, UK
Haddadin MJ (2003) Exogenous water: A conduit to globalization of water resources. In: HoekstraAY (ed) Virtual water trade: Proceedings of the International Expert Meeting on Virtual WaterTrade. Value of Water Research Report Series No. 12, UNESCO-IHE, Delft, The Netherlands,http://www.waterfootprint.org/Reports/Report12.pdf
Hoekstra AY, Hung PQ (2002) Virtual water trade: A quantification of virtual water flows between nations inrelation to international crop trade. Value of Water Research Report Series No. 11, UNESCO-IHE Institutefor Water Education, Delft, The Netherlands, http://www.waterfootprint.org/Reports/Report11.pdf
Hoekstra AY, Hung PQ (2005) Globalisation of water resources: International virtual water flows in relationto crop trade. Global Environmental Change 15(1):45–56
ITC (2004) PC-TAS version 1997–2001 in HS or SITC, CD-ROM. International Trade Centre, Geneva
Springer

Water Resour Manage (2006)
Rees WE (1992) Ecological footprints and appropriated carrying capacity: what urban economics leaves out.Environ Urban 4(2):121–130
Shiklomanov IA (2000) Appraisal and assessment of world water resources. Water International 25(1):11–32Wackernagel M, Onisto L, Linares AC, Falfan ISL, Garcia JM, Guerrero IS, Guerrero MGS (1997) Ecolog-
ical footprints of nations: How much nature do they use? How much nature do they have?. Centre forSustainability Studies, Universidad Anahuac de Xalapa, Mexico
Wackernagel M, Rees W (1996) Our ecological footprint: Reducing human impact on the Earth. New SocietyPublishers, Gabriola Island, BC, Canada
Springer