water footprints of milk production - · pdf fileindia n states punjab districts ... products...
TRANSCRIPT

A Case Study in the Moga district of Punjab, India
Water Footprints of Milk
Production
Upali Amarasinghe, Vladimir Smakhtin, Bharat Sharma and Nishadi Eriyagama
of International Water Management Institute
Carlo Galli and Manfred Noll
of
Nestle

Outline
1. Background and objectives
2. Components of milk water footprints
3. Impact of Moga water footprints
4. Reducing water footprints

Increasing physical water scarcity
Degree of development (%)
No data 0 - 25 25 - 60 > 60
2000 2025 2050
1. Background

1.2 Moga in a brief
Indian states
Punjab districts
Moga blocks

1.3 Moga in a brief
• 11th largest district in Punjab
• Have an arid climate - Annual rainfall 438 mm,
temperature 7 - 48°C
• Population is 895,000.
• 80% live in rural areas and livelihoods depends on
agriculture
• Average land holding size is 13 acres

1.4 Why Moga?
-35
-30
-25
-20
-15
-10
-5
0
1998 2000 2002 2004 2006 2008 2010
Dep
th (m
eter
s)
Depth to groundwater (m) in few villages before and after irrigating rice in the Kharif season

1.5 Why Moga?
• Groundwater is the major source of irrigation
and is overexploited everywhere
• At risk are sustainable agriculture production,
industrial expansion, domestic water supply
etc.
• Moga is one of Nestlé's Milk districts and
feed production depends on groundwater
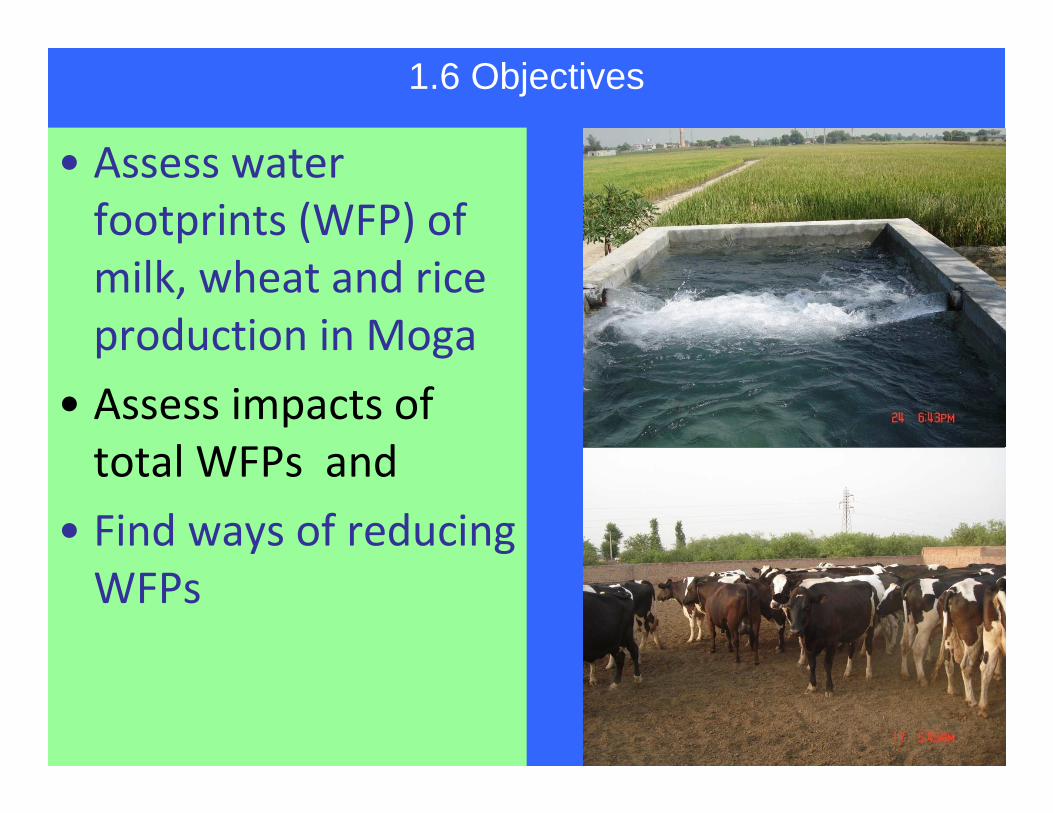
1.6 Objectives
• Assess water
footprints (WFP) of
milk, wheat and rice
production in Moga
• Assess impacts of
total WFPs and
• Find ways of reducing
WFPs

2.1 Components of water footprints
WFP = the consumptive water use (Evapo-transpiration)
Water Footprints
Direct water use Indirect water useDirect water use Indirect water useDirect water use
Green water
footprints
Irrigation water
footprints
Gray water
footprints
Internal water
footprints
External water
footprints

2.2. Components of WFPs of milk and crops
WFP Direct water use + Indirect water use Green = na + CWU from soil moisture
in fodder and other feed crops
Irrigation = Drinking/servicing of animals
+ CWU from irrigation in fodder and other feed crops
=MilkWFP
{
Grey = na + Water pollution through input use or in by products
Green = CWU from soil moisture in crop production
+ na
Irrigation = CWU from irrigation water in crop production
+ na =1Crop
WFP
{ Grey = Water pollution from
input use or in byproducts
+ na
2.3 Data and methodology
• Estimated WFPs (m3/ton) using primary data
– collected from a sample survey in Moga
– Sample size of 300 farmers
• Combined with secondary data of total
production to estimate total WFP (million
m3/year)
• Used production surpluses and value to assess
impacts of total WFP

2.4 Water footprints of milk, wheat and rice (m3/ton)
Water footprints
• Rice - 1,870 m3/ton
• Milk- 940 m3/ton
• Wheat- 554 m3/ton
• Contribution from external water
footprints to milk production is
37%
Commodity Water Footprint (m3/ton)
Green Irrigation Grey
Canal Groundwater
Milk 58 - 882 (94%) 143
Wheat 17 42 495 (90%) 74
Rice 346 50 984 (71%) 195
-
400
800
1,200
1,600
2,000
Rice(Internal)
Wheat(Internal)
Milk(Internal)
Milk(External)
WF
P (m
3 /ton)
Green Irrigation (canal water)Irrigation (groundwater) Irrigation (non beneficial)Grey

Crop water requirements
Crop water requirements
• rice - 671mm
• Wheat – 268
• Fodder crops – 727 mm
Effective rainfall and net irrigation requirement
167
8132
504
260
595
0
200
400
600
800
Rice Wheat Fodder crops
Eff
rf &
NE
T (m
m)
Effective rainfall Net evapotranspiration
Water footprints of milk
• Green fodder - 196 m3/ton
• Dry fodder – 184 m3/ton
• Concentrates – internal – 218 m3/ton
• Concentrates – External - 327 m3/ton
• Drinking/bathing – 15 m3/ton
21%
20%
23%
34%
2%
Green
Dry
Concentrates
Concentrates -externalDrinking/servicing
Composition of milk water footprints

3.1 Impacts- Groundwater footprints
• Internal groundwater footprint
– contributes to 78% of total
– of the exports (of 84 mcm) is more than natural recharge limits (1200 mcm/yr)
– Needs to be reduced for sustainable agricultural production
Commodity Internal water footprint
(million cubic meters /year)
Virtual water in production
surpluses (million cubic
meters/year)
Total Irrigation Groundwater Total Groundwater
Milk 127 113 113 72 64
Wheat 464 450 415 412 368
Rice 1,198 898 854 1,194 852
Total 1,789 1,461 1,382 1,678 1,284

3.2 Impacts – Virtual water contribution
• Value of output per unit of net
irrigated area
– US$ 4,221/ha in Milk only
– US$ 3433/ha in milk-wheat
– US$ 3081/ha in milk-wheat-rice
• High dependency of milk only outputs
from virtual water
0.0
0.1
0.2
0.4
0.5
0.6
Irrig
atio
nW
FP
Gro
und
wat
er
Irrig
atio
nW
FP
Gro
und
wat
er
Irrig
atio
nW
FP
Gro
und
wat
er
Rice, wheat andmilk production
system
Wheat and milkproduction
system
Milk onlyproduction
system
Vla
ue ($
/m3)
-
1
2
3
4
5
Val
ue (U
S$
1000
/ha)
Rice Wheat Milk-internal
milk-external Value ($/ha)

4.1 Reducing water footprints: Agriculture diversification
Observations
• Virtual groundwater content and
exports of rice is large
• Milk only or wheat-milk production
systems have higher value of output
• Dairy intensive production systems
with less rice area offer the most
benefits
• An ideal scenario is a combination of
– Less rice area
– More dairy animals
– Same wheat area
– More fodder area

4.2. Impact of Agriculture diversification Scenario Crop area - % of total Number of lactating
animals per 6 ha land
Kharif Rabi Crossbred cows
Buffaloes
Rice Fodder Wheat Fodder
Base 90 10 90 10 1 3
A1 0 10 90 10 1 3
A2 0 31 90 10 8 3
A3 62 20 90 10 5 3
A4 62.5 19.9 90 10 1 7
1,752
3,294
3,609 3,575
3,124
1,382
541
711
1,200 1200
Base A1 A2 A3 A4 Base A1 A2 A3 A4
Scenarios Scenarios
Val
ue ($
/ha)
Tot
al W
FP
(mcm
)
Value of output ($/ha) Groundwater WFP (mcm)
• Scenario A3 is the
optimum under current
level of productivities.
• Value of output is
US$480/ ha more than the base scenario
4.3. Policy recommendations for reducing WFP
1. Diversify agriculture to dairy intensive production systems, especially for small holders
� Wheat-milk or Milk only is preferred
� Value of output will increase, but
� Virtual water imports also will increase.� Increase virtual trade opportunities, possibly, for rainfed areas
2. Reduce rice area, increase number of lactating cross-bred cows, and increase fodder area
� 62% rice area, 20% fodder area in Kharif� 90% wheat area and 10% fodder area in Rabi
� 5 cross-bred cows and 3 buffaloes (Total of 8 lactating animals/ 6 ha)

4.4 Policy recommendations for reducing water withdrawals
Interventions already in place in Moga
1. Strictly adhering to delayed rice
planting till June 10th
• Reduce ET by 9%
• Reduce withdrawals by 141 million
m3
2. Laser land leveling in all irrigated
areas
– Only 17% of area is laser leveled at
present
– Irrigation depth on laser level land
is 124 mm
0
400
800
1200
1600
2000
10-J
un11
-Jun
12-J
un13
-Jun
14-J
un15
-Jun
16-J
un17
-Jun
18-J
un20
-Jun
26-J
un10
-Jun
11-J
un12
-Jun
13-J
un14
-Jun
15-J
un16
-Jun
17-J
un18
-Jun
20-J
un26
-Jun
With out laser levelling With laser levelling
Net
or
irrig
atio
n w
ithdr
aw
als
(mm
)
Irrigation withdrawals - net irrigation requirement
Net Irrigation requirement

Acknowledgement:
• NESTLE India for providing financial support
• Moga and Punjab Agriculture department for data collection
support
• Carlo Galli, Manfred Noll, Babarjit Bhullar of Nestle for
logistical support
• Nestle Moga staff for sample survey data collection support