water footprints of a nation
DESCRIPTION
Water Footprints of a NationTRANSCRIPT

Water footprints of nations : Water use by people as a function of their
consumption pattern
A.Y. Hoekstra, A.K. Chapagain

Water footprint
Water footprint of a nation is defined as the total volume of freshwater that is used to produce the goods and services consumed by the people of the nation- Consumption based indicator of water - Water footprint consists of two parts: use of domestic
water resources and use of water outside the borders of the country (Internal and External water footprint)

Internal Water footprintUse of domestic water resources to produce goods and services consumed by inhabitants of the country
IWFP = AWU + IWW + DWW - VWEdom
AWU - Agricultural sector withdrawalIWW - Industrial sector withdrawal DWW - Domestic sector withdrawalVWEdom - Virtual water exported
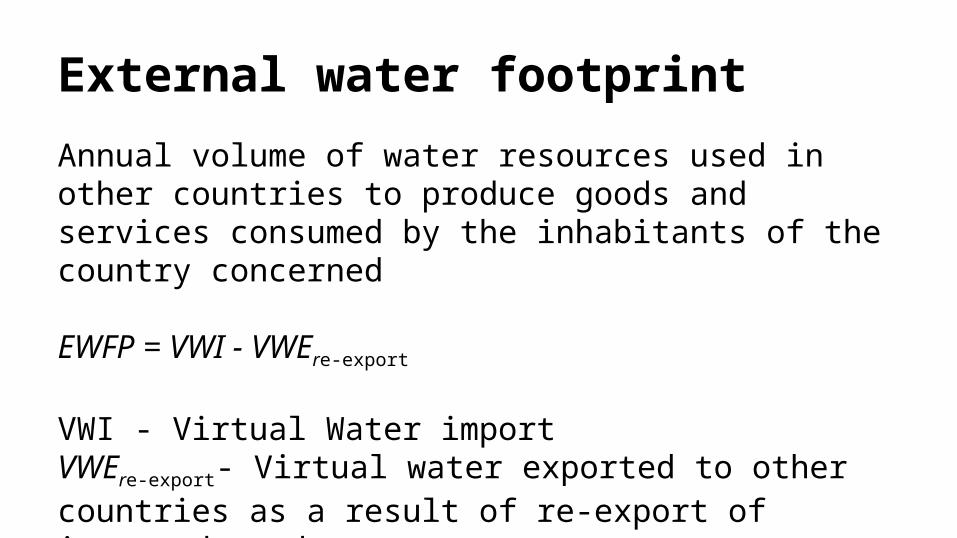
External water footprint
Annual volume of water resources used in other countries to produce goods and services consumed by the inhabitants of the country concerned
EWFP = VWI - VWEre-export
VWI - Virtual Water importVWEre-export- Virtual water exported to other countries as a result of re-export of imported products

Virtual water flows between nations
VWF [ne,ni,c] = CT [ne,ni,c] x VWC [ne,c]
VWF - Virtual water flow (m3yr−1) from exporting country ne to importing country ni as a result of trade in commodity c CT - Commodity trade (ton yr−1) from the exporting to the importing countryVWC - Virtual water content (m3 ton−1) of the commodity
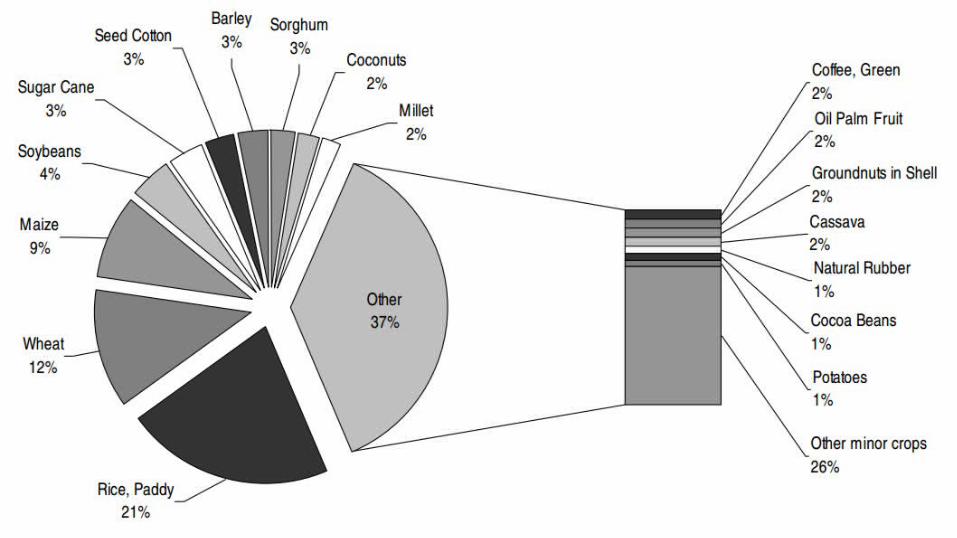
Water needs by product
Total volume of water used globally for crop production is 6390 Gm3/yr at field level
Livestock products have a higher virtual water content than crop products

Virtual water content of Industrial products
Nations Industrial Virtual Water content (Avg)
USA 801 per US$
Germany & Netherlands 501 per US$
Japan, Australia & Canada
10 - 151 per US$
China & India 20 - 251 per US$

● Global water footprint is 7450 Gm3/yr● Average Global water footprint is 1240 m3/cap/yr In absolute terms, India is the country with the largest footprint in the world, with a total footprint of 987 Gm3/yr Much lower on per capita basis● USA - 2480 m3/yr per capita● Southern European countries (Greece, Italy & Spain)
2300–2400 m3/yr per capita● China - 700 m3/yr per capita● Malaysia & Thailand - High water footprints
Water footprint of nations


Factors influencing Water footprints● Total volume of consumption (Related to income)● Water intensive consumption pattern (Livestock products)● Climate● Water inefficient agricultural practices

How can water footprints be reduced?
● Link between economic growth and increased water use - Production techniques that require less water per unit of product
● Production from areas with low water productivity to high water productivity
● Shift to consumption patterns that require less water
Conclusion
National and regional water policy studies should include an analysis of international or inter- regional virtual water flows