water conservation, plumbing & high performance designhigh ... · water conservation, plumbing...
TRANSCRIPT
Water Conservation, Plumbing & High Performance DesignHigh Performance Design
Zach F. Gallgher, P.E. , LEED® APManaging Engineerg g g
Alliance Environmental LLC
ll h @Alli E i t [email protected]
www.AllianceEnvironmentalLLC.com

Agenda• Introduction
– Sustainability, Integrated Systems & High Performance Design
• Water Conservation– Standards / Guidelines
Practices
We must not complacently accept the problems associated with traditional – Practices
• Water Reuse– Performance Standards
water resource management methods when better solutions already exist
– Case Studies
• Economics

Water Resource Management as a Component of Sustainability Planning and ImplementationSustainability Planning and Implementation
Ecology
Regenerative – restore functionTriple Bottom Line
Sustainable – address future needs
Green –exceed regulationGreen exceed regulation
Status Quo - meet regulation

Systems Segregation and Fragmentation Creates Inadequate FunctionCreates Inadequate Function
4 quads + 4 quads = 8 quads US (Mark Shannon 2008)
Linear Segmented Approach
Energy
•Adds energy at each step
Stuff Solid Waste
Community
Energy
• Depletes resources on supply side
y
• Contaminates environment on disposal sidep
http://www.storyofstuff.com/

Functional System Integration to Achieve Higher Sustainability LevelsAchieve Higher Sustainability Levels
Integrated Systems N t bl W tIntegrated Systems Reduce and Reuse•Add less energy at each step and extract
Nonpotable Water Reuse
Energy
each step and extract energy post consumer use Natural Resource
RecyclingStuff Solid Waste
Community
Energy
• Use less natural resources on production side• Release less contaminants to environment on post
idconsumer side Nutrient Recycling

Dynamic Balance Sheet for Water
Inputs (Income) Storage (Assets) Discharge (Expense)
Stream Flow
Stream FlowSurface Water
Public Storm Water
Inputs (Income) Storage (Assets) Discharge (Expense)
Public Storm Water Discharge
Soil Water
Storm Water
Precipitation EvapotranspirationSoil Water
Infiltration
Percolation
Groundwater Flow
Groundwater FlowAquifer Storage
tion
Public WastewaterIrrigation
Irrig
at
Wel
l
Public Water Supply
Public Wastewater DischargeDistribution Collection

American StandardThe quintessential dual flush toilet – What’s in Your Tank?
• If given the choice would you flush your toilet with bottled water?
• So why is this our current standard?
rico,
200
7C
opyr
ight
Ed
Cle
C

Water Reuse Is Environmental Transformation That Begins With A Simple Change In Perspective
Our current perspective dates back to 500 BC when the Roman Goddess of the sewers, Cloacina, carried wastes to th i S b d ti f tthe river. So began our modern perspective of waste management , dilution is the solution. With 319 million trillion gallons of water on earth the natural water cycle will purify and protect us
.
will purify and protect us.
1,200 GPD per capita to operate US economy, but less then 1 GPD per capita is actually consumed, in h h h 1 199 GPD ld dil btheory the other 1,199 GPD could readily be reuse water
Using potable water to flush toilets, irrigate lawns and wash clothes is rather uncivilized and uncaring ggiven the fact alternatives are available. “Problems can not be solved at
the same level of awareness that created them.” Einstein
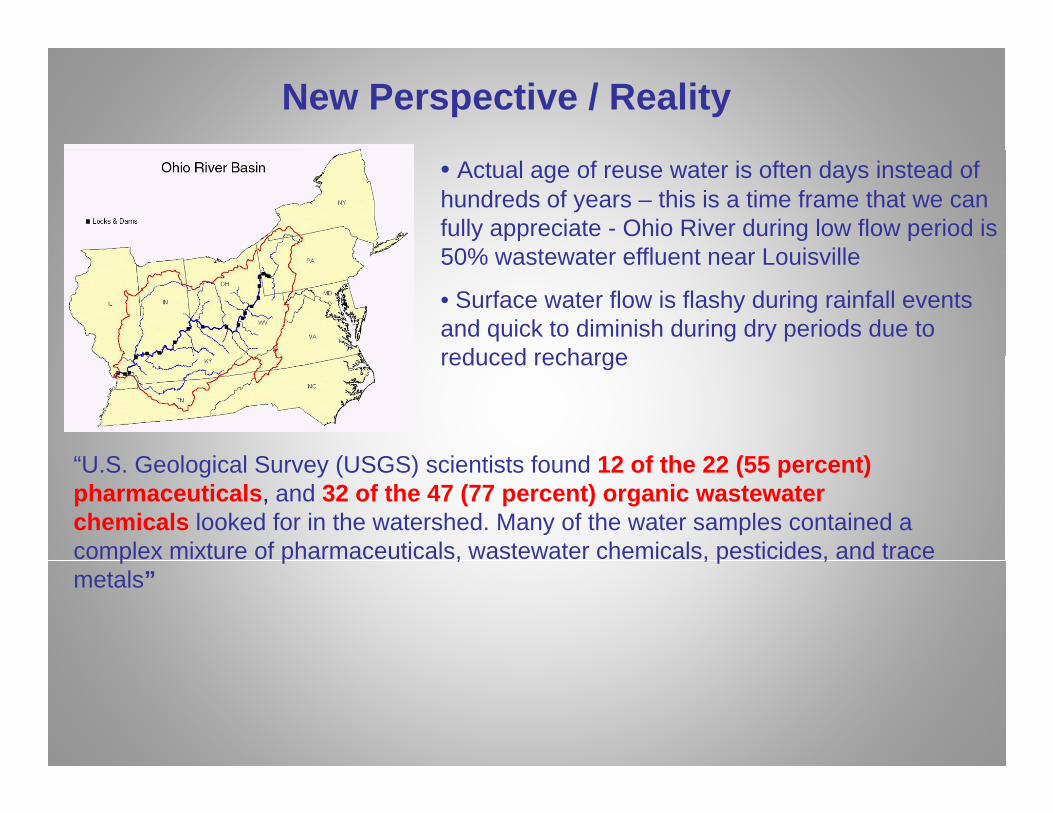
New Perspective / Reality
• Actual age of reuse water is often days instead of hundreds of years – this is a time frame that we can fully appreciate - Ohio River during low flow period is 50% wastewater effluent near Louisville50% wastewater effluent near Louisville
• Surface water flow is flashy during rainfall events and quick to diminish during dry periods due to reduced rechargereduced recharge
“U S G l i l S (USGS) i ti t f d 12 f th 22 (55 t)“U.S. Geological Survey (USGS) scientists found 12 of the 22 (55 percent) pharmaceuticals, and 32 of the 47 (77 percent) organic wastewater chemicals looked for in the watershed. Many of the water samples contained a complex mixture of pharmaceuticals, wastewater chemicals, pesticides, and trace p p , , p ,metals”

Water Conservation / Guidelines & Standards
•BREEAM
•LEED (USGBC)LEED (USGBC)
•Green Globes
•Living Building Challengeg g g
•Sustainable Sites Initiative
•ASHRAE 189.1 •Being developed by ASHRAE, USGBC, IESNA
•Out in draft form, published early 2010
•First code intended commercial green building standard
•A Good Indicator of Future Direction for Water Conservation

Draft ASHRAE 189.1 - Mandatory• In Building Plumbing
• Toilets – 1.28 gpf flushometers, Tank Type meet WaterSense• Urinals - 0.5 gpf
y
gp• Public lavatory faucets - 0.5 gpm max., 0.25 gpu self closing• Lavatory faucets residential – 1.5 gpm max• Kitchen faucets residential – 2.2 gpm max• Showerheads residential 2 0 gpm max (incl rain & waterfall) for every• Showerheads residential – 2.0 gpm max (incl. rain & waterfall) for every 3,000 SI (20.8 SF) of shower area• Clothes washer residential – 6 gal/CF drum capacity• Clothes washer commercial – 7.5 gal/CF drum capacity• Dish Washer – 5.8 gal/cycle
LEED Design Case Fixture Flows
E P li A t f 1992 Fl
LEED Design Case Fixture Flows
E P li A t f 1992 FlFixtures Units
Energy Policy Act of 1992 Flow Requirement
Water Closets gpf 1.6
Urinals gpf 1
Fixtures Units Energy Policy Act of 1992 Flow
Requirement
Water Closets gpf 1.6
Urinals gpf 1
Showerheads gpm 2.5
Faucets gpm 2.5
Showerheads gpm 2.5
Faucets gpm 2.5
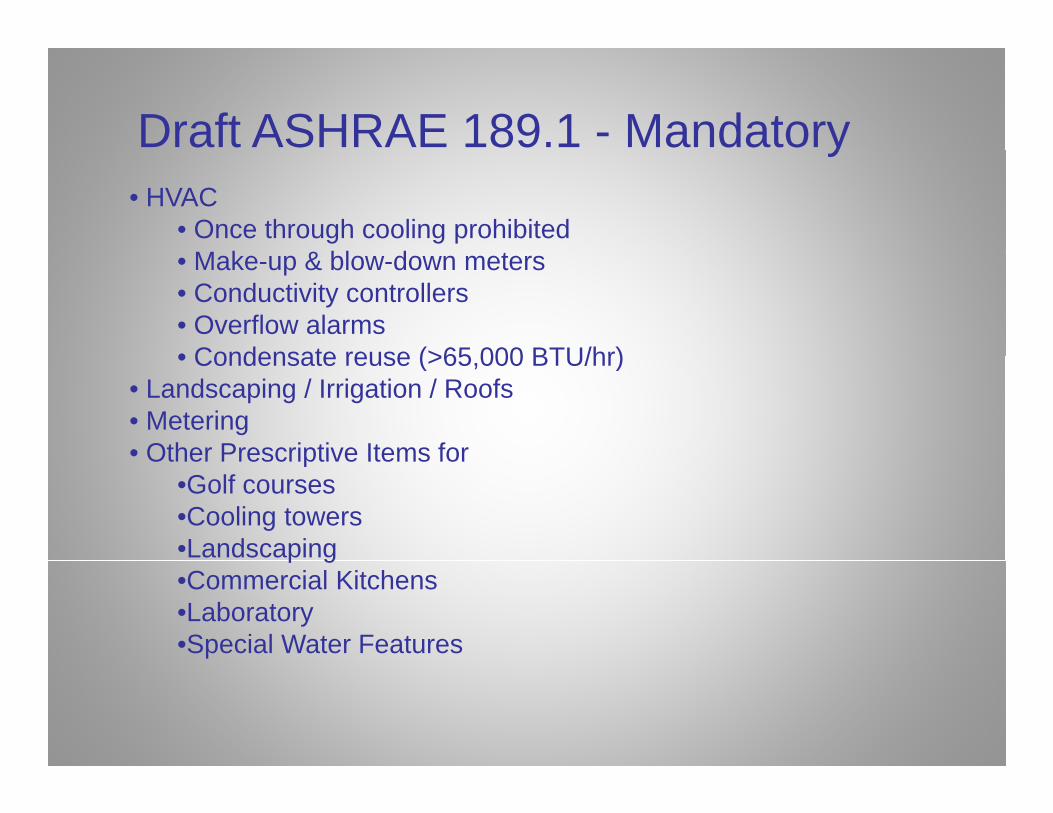
Draft ASHRAE 189.1 - Mandatoryy• HVAC
• Once through cooling prohibited M k & bl d t• Make-up & blow-down meters
• Conductivity controllers• Overflow alarms• Condensate reuse (>65 000 BTU/hr)• Condensate reuse (>65,000 BTU/hr)
• Landscaping / Irrigation / Roofs• Metering• Other Prescriptive Items forOther Prescriptive Items for
•Golf courses•Cooling towers•Landscapingp g•Commercial Kitchens•Laboratory•Special Water Features

NYC Water Consumption Trends
33% Reduction over 15 years

Avg and Median = 75 GPCDStandard Deviation = 33 GPCD

Building Type Date of 1st System Water Reuse Water Uses
Direct Reuse / Distributed Water Reuse Systems
Research 1987 95% Toilet flushing
Office 1989 95% Toilet flushing
School 1990 75% Toilet flushing
Commercial Centers 1993 70% Toilet flushing
Stadiums 1996 75% Toilet flushing
Urban Residential High Rise
2000 50% Toilet flushing, cooling, irrigation and laundry
30 Systems 20 Years 80% Reuse NonresidentialNonresidential50% Reuse Residential
3WateReuse Association estimates that 2.6x10³ Mgal/day of municipal wastewater are reclaimed and reused currently and reclaimed water on a volume basis is growing at an estimated 15% per year.

Water Reuse Performance Standards (NJ/NYC)
NJDEP Category 1 RWBR NYC Department of BuildingsNJDEP Category 1 RWBRPublic Access Systems
Parameter RWBR Requirement
Sample Type
Flow Rate Continuous
NYC Department of BuildingsPerformance Standards for Reuse
Parameter StandardpH 6.5-8
BOD <10 mg/LFlow Rate ContinuousTotal
Nitrogen<10 mg/L* Grab
Total Suspended
5 mg/L Grab
BOD <10 mg/LTotal
Suspended Solids (TSS)
<10 mg/L
Total Coliform <100 / 100 mLSuspended Solids (TSS)Fecal
Coliform14 col/100 mL
(2 2 weekly avg )Grab
Total Coliform <100 / 100 mLTurbidity <2 NTU (95%) / <5 NTU
(Max)
Coliform (2.2 weekly avg.)Turbidity 2 NTU** Continuous
Disinfection 100 mJ/cm2 (UV) / 1 mg/L (CPO)
Continuous
Notes:
• No federal regulations governing water reclamation & reuse, regulated at the state level.• 26 states with adopted regulations
Notes:* The NJDEP may impose a total nitrogen concentration limitation greater than 10 mg/L if the permittee can demonstrate that a concentration greater than 10 mg/L is protective of the environment.** A statistically significant correlation between turbidity
•16 states have guidelines• 9 states without regulations or guidelines• No states with regulations that cover all potential uses of reclaimed water. A statistically significant correlation between turbidity
and TSS shall be established prior to commencement of the RWBR program. For UV disinfection, in no case shall the level of turbidity exceed 2 NTU while still maintaining the 5 mg/L maximum level for TSS.

State Reuse Regulations & Guidelines (Unrestricted Urban Reuse)
RWBR Requirement
Parameter New Jersey California Florida Arizona Massachusetts NYC DOH Policy
BOD / CBOD NS NS 20 mg/L CBOD (annual average) NS NS 10
Total Nitrogen <10 mg/L* NS NS 10 NS
Total Suspended SolidsTotal Suspended Solids (TSS) 5 mg/L NS 5 mg/L NS 5 10
Fecal Coliform (FC) / Total Coliform (TC)
FC 14 col/100 mL (2.2 weekly avg )
TC 240 col/100 mL (max 23 col/100 mL in any 30-day period 2 2/100 mL weekly
FC 25/100 mL (75% of samples below detection FC 23/100 mL (No detection
in 4 of last 7 day samples)
14 col/100ml max (median of no
detectable fecal/100 ml <100/100mlTotal Coliform (TC) weekly avg.) period, 2.2/100 mL weekly avg.) limits over 30-day period) in 4 of last 7 day samples) over continuous 7 day
sampling)
Turbidity 2 NTU (Continuous Monitoring)** See Note 3 Limit NS, continous on-line
monitoring required2 NTU (24 hour average), 5 NTU (instantaneous max) 2 NTU < 0.5 NTU (95%) < 5
NTU MaxMonitoring) monitoring required NTU (instantaneous max) NTU Max
Disinfection100 mJ/cm2 (UV) / 1 mg/L
(CPO) - Continuous Monitoring
Required, limit not specified - Continuous monitoring 1 mg/L (CPO) NS NS
pH NS NS 6-8.5 NS NS
Notes:NS = Not Specified, some state parameters are specified on a case by case basis* The NJDEP may impose a total nitrogen concentration limitation greater than 10 mg/L if the permittee can demonstrate that a concentration greater than 10
/L i t ti f th i tmg/L is protective of the environment.** A statistically significant correlation between turbidity and TSS shall be established prior to commencement of the RWBR program. For UV disinfection, in no case shall the level of turbidity exceed 2 NTU while still maintaining the 5 mg/L maximum level for TSS.
*** Natural Soil / Filter Media: 10 NTU (2 NTU max avg. within 24 hr period, 5 NTU no more than 5% of time). Membrane: .5 NTU (.2 NTU no more than 5% of time)

Flush Water
Cooling Tower Laundry WaterCooling Water
ing
Potable Water
Wastewater
Discharge to SewersWastewater Feed Tank
Coo
liWastewater
St t fl1Transfer to treatment
Transfer to treatment
Stormwater Feed Tank
ater
Stormwater overflow
Highly variable
1
Membrane Bio ReactorMembrane Bio Reactor UV/O Di i f ti
Reu
seW
a
2
UV/Ozone Disinfection
Aerobic Membrane FiltersAnoxic
34
Reuse W t
Distributed Water Reuse System SchematicDistributed Water Reuse System Schematic 51 Wastewater collected for treatment 2 Stormwater collected for treatment where appropriate
Water Reservoir
To Irrigation pp p
Biological treatment Final polishing and disinfection Storage for nonpotable reuse 5
43

Decentralized Urban Water Reuse Battery Park City New YorkBattery Park City – New York

BackgroundBackground293 units293 units25 000 GPD WW t t t25 000 GPD WW t t t25,000 GPD WW treatment 25,000 GPD WW treatment plantplantLEEDLEED
TMTMGold CertificationGold Certification
Water Efficiency earns 5 points Water Efficiency earns 5 points under USGBC LEEDunder USGBC LEED™™ rating rating systemsystemsystem system 48% reduction in water use48% reduction in water use56% reduction in wastewater 56% reduction in wastewater di hdi hdischargedischarge

The Solaire Actual Measured Water Use
60,000
70,000y
40,000
50,000
ons
Per D
ay
R W
20,000
30,000
erag
e G
allo Reuse Water
NYC Water
-
10,000
Ave
BaseBldg
2004 2005 2006
Year

Managing micro-watersheds in urban environments – drawing reuse water from multiple sources for multiple end usesreuse water from multiple sources for multiple end uses


Key NYC Drivers for Water ReuseDiminishing water supply and need for repair to Delaware
Aqueduct Tunnel
Wastewater management systems unable to meet stringentWastewater management systems unable to meet stringent environmental protection standards – Combined Sewer Overflows
Storm ater management needs gro ing as ater q alitStormwater management needs growing as water quality protection standards advance
Green Building initiatives
United States Green Building Council’s Leadership in Energy and Environmental Design (LEED®)
B tt P k Cit A th it ’ S t i bl U bBattery Park City Authority’s Sustainable Urban Development Initiative
New York City DEP Comprehensive Water Reuse Incentives

Integrated Water Reuse Systems
Site 19B – Tribeca Green
Site 23 – 24 Millstein PropertiesSite 23 24 Millstein Properties
Site 18A and 18 B- The Solaireand The Verdesian
Site 16-17 – Riverhouse
Site 3 – Albanese Development
Site 2 – Millennium Point
The Helena – 57th Street –Durst Developmentp

The Village at Hawk PointeVillage at Hawk Pointe (Asbury Farms), Washington Twp, Warren County

New England Patriots StadiumF b M h ttFoxboro, Massachusetts
• Applications of reuse are ppgrowing in size and commercial status.68 000 S t St di• 68,000 Seat Stadium represents beneficial reuse at prime public and institutional sites.
• System provides reuse capacity to entirecapacity to entire commercial zone within Town of Foxboro.

Co-op City - Example of Water Reuse Retrofit
• Population:45,000 – 55,000
• Residential Use:Residential Use:15,000 residential units35 high-rise buildings7 townhouse clusters
• Commercial Use:3 shopping centers>40 offices40 offices
• Infrastructure & Utilities:NYC Public Water & SewerC li T / P Pl tCooling Tower / Power Plant

Co-op City: Water Usage
• Co-op City Water Usage: Riverbay Corporation
Residential Use (gpd) 3,400,000Commercial Use (gpd) 370,000
C
(gpd) 375,000Total Usage (gpd) 4,145,000
• Cooling Tower Power Plant Average Water Usage
March – June (’07) 270,000 gpdJune – September (’07) 730,000 gpdS t b D b (’07) 300 000 dSeptember – December (’07) 300,000 gpdDecember – March (’07-‘08) 250,000 gpdAnnual Average 375,000 gpd

Co-op City: Water Reuse Diagram
Greenway
50,000 gpd to Greenway
P Pl t
Wastewater Treatment &
Recycling System
100,000 gpd to CT
Power Plant Cooling Tower
150,000 gpd to WTRS
ResidentialBuildings
400 000 d400,000 gpd sewer
250,000 gpd to city sewer

EconomicsRecent NYC Water and Sewer RatesRecent NYC Water and Sewer Rates
66% Increase in user rates in five years with projections of 15% increase per year for next several years.

• Construct tanks as integral part of foundation walls to economize
Preliminary Capital Costs Projections – concrete represents
approximately 35% of costs
• $45/GPD capacity for small
Costs Projections
system of 25,000 GPD = $1 M
• $21/GPD capacity for medium system of 300,000 GPD = $6.3 M
• $16/GPD capacity for larger system of 500,000 GPD = $8 M
• Includes concrete tanks, start-upIncludes concrete tanks, start up and 6 months operations
•Other Costs Factors
Di ib i S•Distribution System
•Stormwater treatment, storage and interconnection
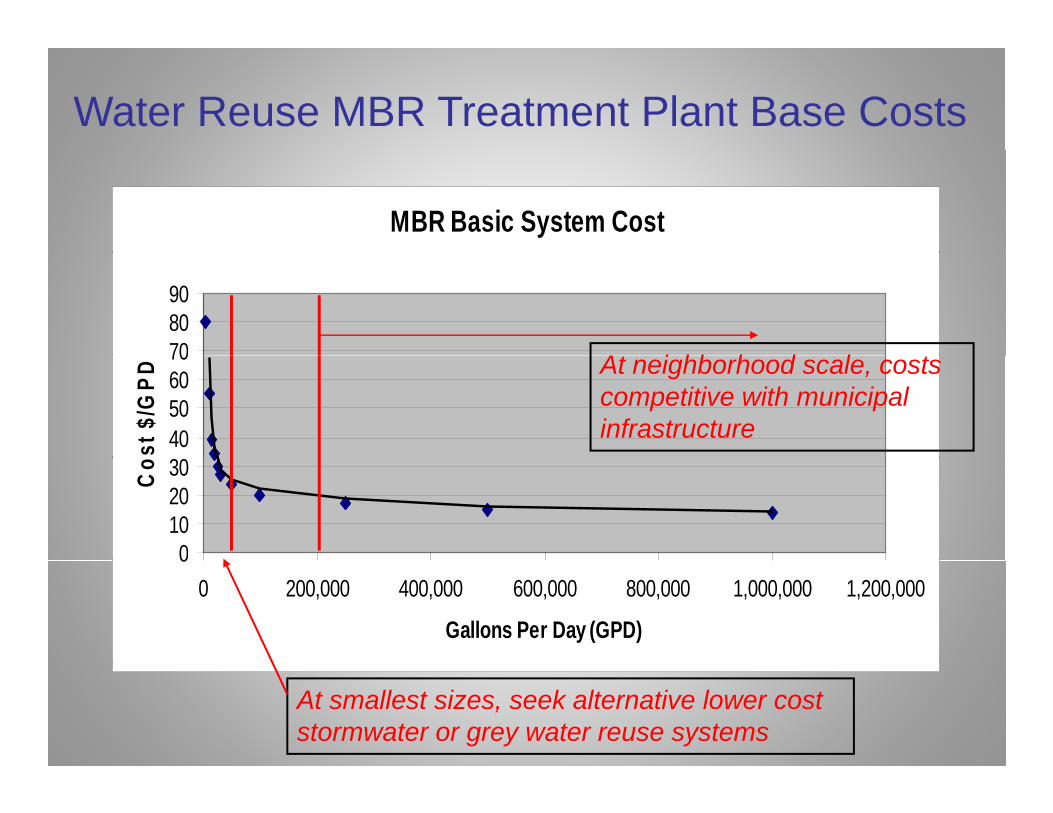
Water Reuse MBR Treatment Plant Base Costs
MBR Basic System Cost
708090
At i hb h d l t
40506070
st $
/GPD
At neighborhood scale, costs competitive with municipal infrastructure
0102030C
o
00 200,000 400,000 600,000 800,000 1,000,000 1,200,000
Gallons Per Day (GPD)
At smallest sizes, seek alternative lower cost stormwater or grey water reuse systems

Economy of Scale – Direct Operations Cost
MBR Operating Cost 2007
$10,000.00
$12,000.00
$6 000 00
$8,000.00
lion
Gal
lons
y = -2257.1Ln(x) + 31858R2 = 0.8191
$4,000.00
$6,000.00
Dol
lars
per
Mil
$4/1 000gal=$2 99/100CF
$-
$2,000.00
$4/1,000gal=$2.99/100CF
$-- 50,000 100,000 150,000 200,000 250,000 300,000 350,000
Gallons Per Day Rated Capacity

500,000 GPD Water Reuse Economics
$6 000 000
$7,000,000Base NYC Cost With NoReuse
$4 000 000
$5,000,000
$6,000,000
ng C
osts B- 25% reuse-25%
incentive
$2 000 000
$3,000,000
$4,000,000
ual O
pera
ti
$
$1,000,000
$2,000,000
Ann
$-2006 2007 2008 2009 2010 2011 2012 2013 2014 2015
Date
NYC rates increased 66% in 5 years and are projected to increase 15% per year for the next four years

Co-op City: Preliminary Economic Model

Energy Comparison Between Wastewater Treatment Alternatives– Kadlec, R.H. and Wallce, S.D., Treatment Wetlands, 2nd Edition, 2008, CRC Press
SBR + Polishing
Passive Natural
Passive Mechanical
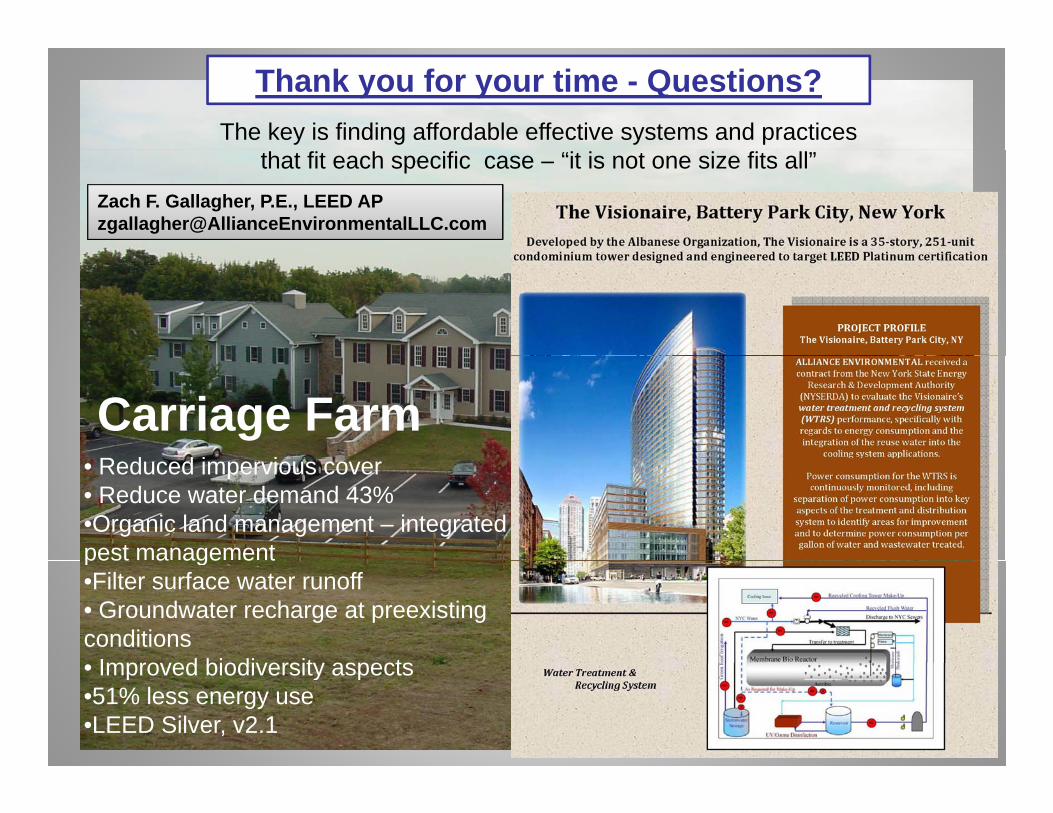
The key is finding affordable effective systems and practices
Thank you for your time - Questions?
Zach F. Gallagher, P.E., LEED [email protected]
that fit each specific case – “it is not one size fits all”
R d d i i
Carriage Farm• Reduced impervious cover• Reduce water demand 43%•Organic land management – integrated pest managementpest a age e t•Filter surface water runoff• Groundwater recharge at preexisting conditions
Improved biodiversity aspects• Improved biodiversity aspects•51% less energy use•LEED Silver, v2.1