waste-to-energy evaluation: u.s. virgin islands material recovery facilities . msw municipal solid...
TRANSCRIPT
NREL is a national laboratory of the U.S. Department of Energy, Office of Energy Efficiency & Renewable Energy, operated by the Alliance for Sustainable Energy, LLC.
Contract No. DE-AC36-08GO28308
Waste-to-Energy Evaluation: U.S. Virgin Islands Jerry Davis, Scott Haase, and Adam Warren
Technical Report NREL/TP-7A20-52308 August 2011
NREL is a national laboratory of the U.S. Department of Energy, Office of Energy Efficiency & Renewable Energy, operated by the Alliance for Sustainable Energy, LLC.
National Renewable Energy Laboratory 1617 Cole Boulevard Golden, Colorado 80401 303-275-3000 • www.nrel.gov
Contract No. DE-AC36-08GO28308
Waste-to-Energy Evaluation: U.S. Virgin Islands Jerry Davis, Scott Haase, and Adam Warren
Prepared under Task No(s). IDVI.0000 and IDVI.0032
Technical Report NREL/TP-7A20-52308 August 2011
NOTICE
This report was prepared as an account of work sponsored by an agency of the United States government. Neither the United States government nor any agency thereof, nor any of their employees, makes any warranty, express or implied, or assumes any legal liability or responsibility for the accuracy, completeness, or usefulness of any information, apparatus, product, or process disclosed, or represents that its use would not infringe privately owned rights. Reference herein to any specific commercial product, process, or service by trade name, trademark, manufacturer, or otherwise does not necessarily constitute or imply its endorsement, recommendation, or favoring by the United States government or any agency thereof. The views and opinions of authors expressed herein do not necessarily state or reflect those of the United States government or any agency thereof.
Available electronically at http://www.osti.gov/bridge
Available for a processing fee to U.S. Department of Energy and its contractors, in paper, from:
U.S. Department of Energy Office of Scientific and Technical Information P.O. Box 62 Oak Ridge, TN 37831-0062 phone: 865.576.8401 fax: 865.576.5728 email: mailto:[email protected]
Available for sale to the public, in paper, from:
U.S. Department of Commerce National Technical Information Service 5285 Port Royal Road Springfield, VA 22161 phone: 800.553.6847 fax: 703.605.6900 email: [email protected] online ordering: http://www.ntis.gov/help/ordermethods.aspx
Cover Photos: (left to right) PIX 16416, PIX 17423, PIX 16560, PIX 17613, PIX 17436, PIX 17721
Printed on paper containing at least 50% wastepaper, including 10% post consumer waste.
iii
List of Acronyms
AEG Alpine Energy Group
CAA Clean Air Act
EDIN Energy Development in Island Nations
EPA Environmental Protection Agency
FERC Federal Energy Regulatory Commission
GBB Girshman, Brickner & Bratton, Inc.
IRS Internal Revenue Service
LFGTE landfill gas to energy
MRF material recovery facilities
MSW municipal solid waste
MSW DST Municipal Solid Waste Decision Support Tool
MW megawatt
NREL National Renewable Energy Laboratory
RDF refuse-derived fuel
TEQ toxic equivalent quantity
TPD ton per day
USVI U.S. Virgin Islands
WTE waste-to-energy
iv
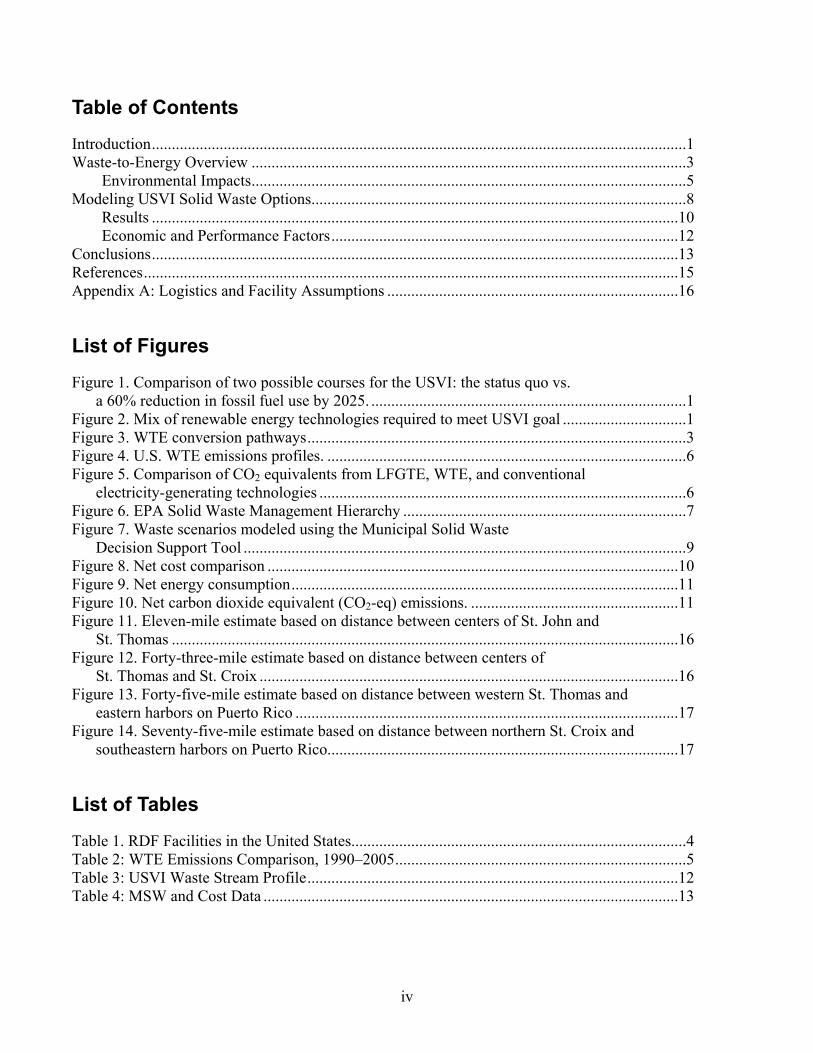
Table of Contents
Introduction ......................................................................................................................................1Waste-to-Energy Overview .............................................................................................................3
Environmental Impacts .............................................................................................................5Modeling USVI Solid Waste Options ..............................................................................................8
Results ....................................................................................................................................10Economic and Performance Factors .......................................................................................12
Conclusions ....................................................................................................................................13References ......................................................................................................................................15Appendix A: Logistics and Facility Assumptions .........................................................................16
List of Figures
Figure 1. Comparison of two possible courses for the USVI: the status quo vs. a 60% reduction in fossil fuel use by 2025. ...............................................................................1
Figure 2. Mix of renewable energy technologies required to meet USVI goal ...............................1Figure 3. WTE conversion pathways ...............................................................................................3Figure 4. U.S. WTE emissions profiles. ..........................................................................................6Figure 5. Comparison of CO2 equivalents from LFGTE, WTE, and conventional
electricity-generating technologies ............................................................................................6Figure 6. EPA Solid Waste Management Hierarchy .......................................................................7Figure 7. Waste scenarios modeled using the Municipal Solid Waste
Decision Support Tool ...............................................................................................................9Figure 8. Net cost comparison .......................................................................................................10Figure 9. Net energy consumption .................................................................................................11Figure 10. Net carbon dioxide equivalent (CO2-eq) emissions. ....................................................11Figure 11. Eleven-mile estimate based on distance between centers of St. John and
St. Thomas ...............................................................................................................................16Figure 12. Forty-three-mile estimate based on distance between centers of
St. Thomas and St. Croix .........................................................................................................16Figure 13. Forty-five-mile estimate based on distance between western St. Thomas and
eastern harbors on Puerto Rico ................................................................................................17Figure 14. Seventy-five-mile estimate based on distance between northern St. Croix and
southeastern harbors on Puerto Rico ........................................................................................17
List of Tables
Table 1. RDF Facilities in the United States ....................................................................................4Table 2: WTE Emissions Comparison, 1990–2005 .........................................................................5Table 3: USVI Waste Stream Profile .............................................................................................12Table 4: MSW and Cost Data ........................................................................................................13
1
Introduction
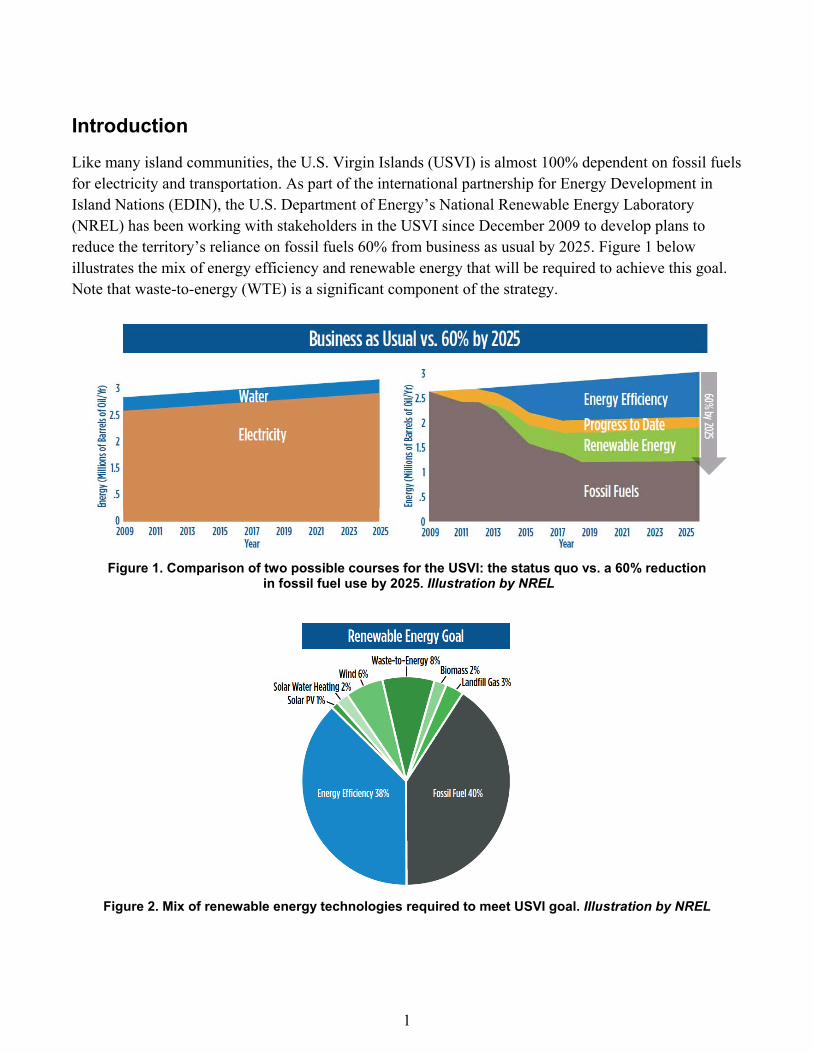
Like many island communities, the U.S. Virgin Islands (USVI) is almost 100% dependent on fossil fuels for electricity and transportation. As part of the international partnership for Energy Development in Island Nations (EDIN), the U.S. Department of Energy’s National Renewable Energy Laboratory (NREL) has been working with stakeholders in the USVI since December 2009 to develop plans to reduce the territory’s reliance on fossil fuels 60% from business as usual by 2025. Figure 1 below illustrates the mix of energy efficiency and renewable energy that will be required to achieve this goal. Note that waste-to-energy (WTE) is a significant component of the strategy.
Figure 1. Comparison of two possible courses for the USVI: the status quo vs. a 60% reduction
in fossil fuel use by 2025. Illustration by NREL
Figure 2. Mix of renewable energy technologies required to meet USVI goal. Illustration by NREL
2
Alpine Energy Group (AEG) has been developing a WTE project on the islands since 2009. The project concept encompasses the following:
1. Collection of municipal solid waste (MSW) on St. Thomas and St. Croix
2. Processing of MSW into refuse-derived fuel (RDF)
3. Consolidation of RDF at a WTE facility on St. Croix
4. Combustion of RDF for waste disposal and energy recovery
The project concept has been subjected to intense scrutiny by USVI residents. Their primary concerns are the environmental impacts and the potential financial burden USVI citizens will incur if the obligated volume of solid waste is not available for the project.
This report evaluates the environmental impact and fundamental economics of WTE technology based on available data from commercially operating WTE facilities in the United States. In particular, it considers life-cycle impacts of WTE as compared to landfill disposal and various forms of electrical generation, as well as WTE impacts on source reduction or recycling programs. In addition, the report evaluates the economics and potential environmental impact of WTE in the USVI based on existing USVI waste stream characterization data, recycling challenges unique to the USVI, and the results of cost and environmental modeling of four MSW management options. The intent of the report is to present information for the consideration of energy and solid waste stakeholders in the USVI.
3
Waste-to-Energy Overview
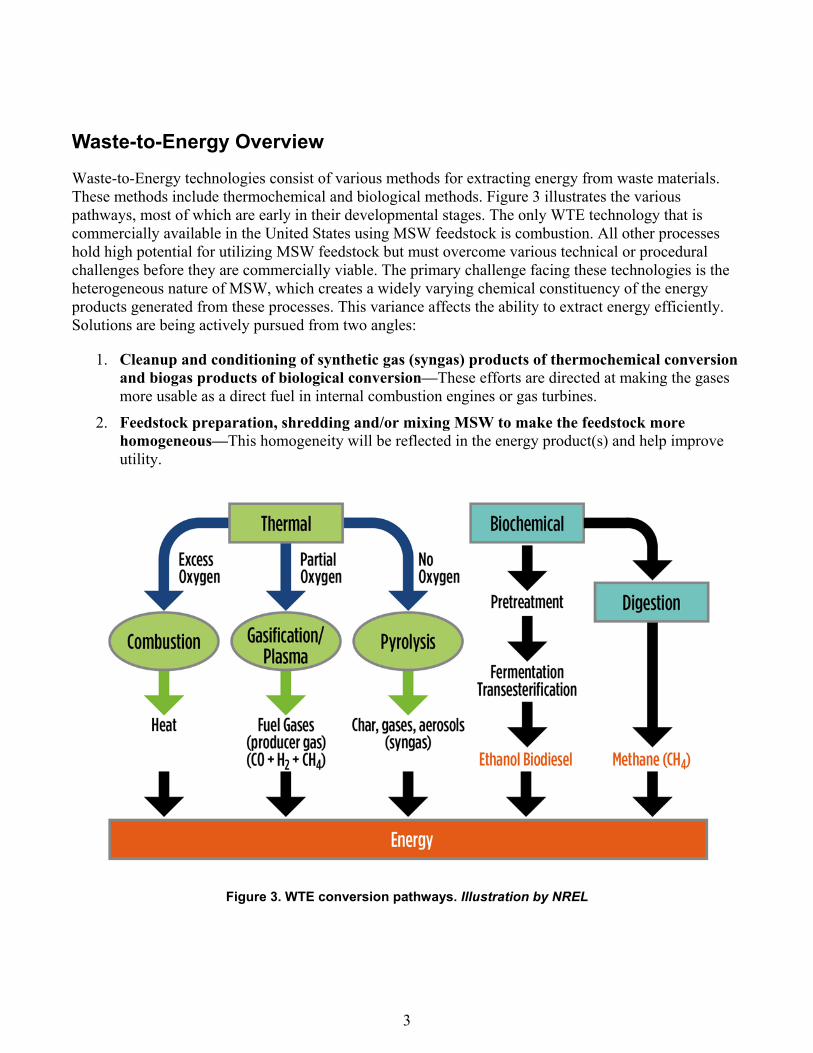
Waste-to-Energy technologies consist of various methods for extracting energy from waste materials. These methods include thermochemical and biological methods. Figure 3 illustrates the various pathways, most of which are early in their developmental stages. The only WTE technology that is commercially available in the United States using MSW feedstock is combustion. All other processes hold high potential for utilizing MSW feedstock but must overcome various technical or procedural challenges before they are commercially viable. The primary challenge facing these technologies is the heterogeneous nature of MSW, which creates a widely varying chemical constituency of the energy products generated from these processes. This variance affects the ability to extract energy efficiently. Solutions are being actively pursued from two angles:
1. Cleanup and conditioning of synthetic gas (syngas) products of thermochemical conversion and biogas products of biological conversion—These efforts are directed at making the gases more usable as a direct fuel in internal combustion engines or gas turbines.
2. Feedstock preparation, shredding and/or mixing MSW to make the feedstock more homogeneous—This homogeneity will be reflected in the energy product(s) and help improve utility.
Figure 3. WTE conversion pathways. Illustration by NREL
4
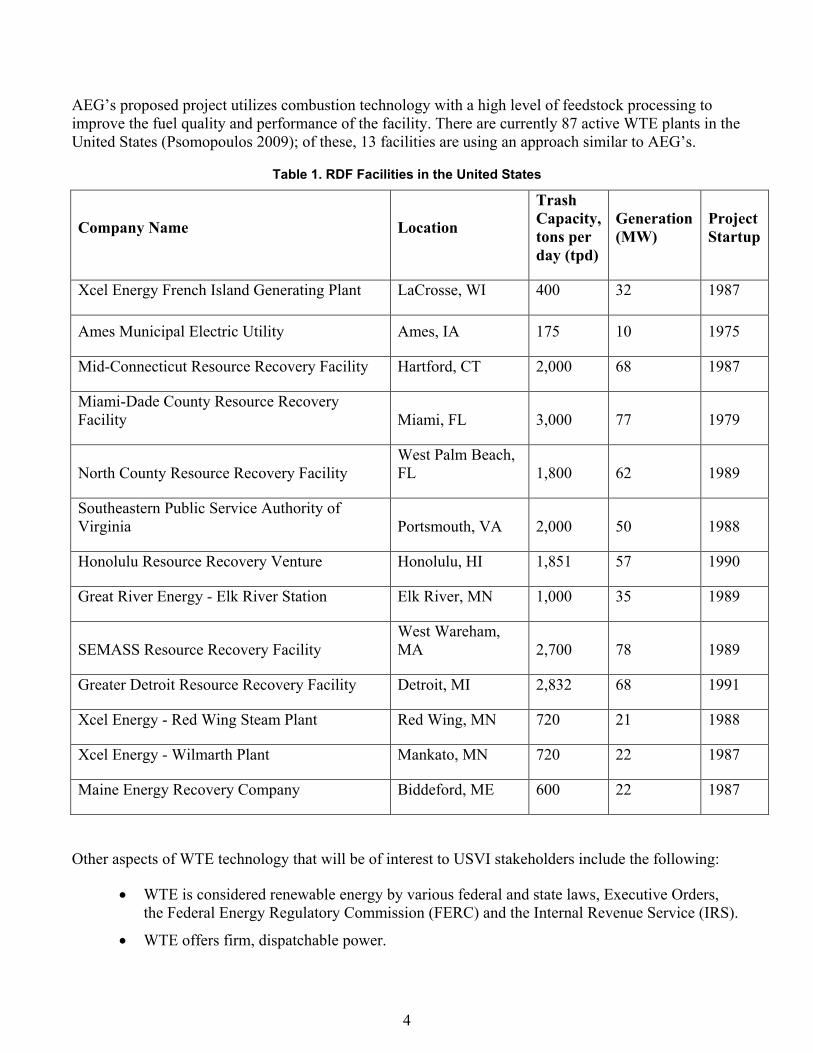
AEG’s proposed project utilizes combustion technology with a high level of feedstock processing to improve the fuel quality and performance of the facility. There are currently 87 active WTE plants in the United States (Psomopoulos 2009); of these, 13 facilities are using an approach similar to AEG’s.
Table 1. RDF Facilities in the United States
Company Name Location
Trash Capacity, tons per day (tpd)
Generation (MW)
Project Startup
Xcel Energy French Island Generating Plant LaCrosse, WI 400 32 1987
Ames Municipal Electric Utility Ames, IA 175 10 1975
Mid-Connecticut Resource Recovery Facility Hartford, CT 2,000 68 1987
Miami-Dade County Resource Recovery Facility Miami, FL 3,000 77 1979
North County Resource Recovery Facility West Palm Beach, FL 1,800 62 1989
Southeastern Public Service Authority of Virginia Portsmouth, VA 2,000 50 1988
Honolulu Resource Recovery Venture Honolulu, HI 1,851 57 1990
Great River Energy - Elk River Station Elk River, MN 1,000 35 1989
SEMASS Resource Recovery Facility West Wareham, MA 2,700 78 1989
Greater Detroit Resource Recovery Facility Detroit, MI 2,832 68 1991
Xcel Energy - Red Wing Steam Plant Red Wing, MN 720 21 1988
Xcel Energy - Wilmarth Plant Mankato, MN 720 22 1987
Maine Energy Recovery Company Biddeford, ME 600 22 1987
Other aspects of WTE technology that will be of interest to USVI stakeholders include the following:
• WTE is considered renewable energy by various federal and state laws, Executive Orders, the Federal Energy Regulatory Commission (FERC) and the Internal Revenue Service (IRS).
• WTE offers firm, dispatchable power.
5
• In general, nonenergy recycling programs require economies of scale that do not exist in island communities. The markets for these recyclables are typically off island, creating additional financial and environmental impacts resulting from the transport of these materials.
• The U.S. Environmental Protection Agency (EPA) has recently released new guidance for WTE combustion facilities, lowering emissions levels and requiring WTE facility operators to maintain rigorous pollution control equipment and procedures. The proposed AEG facility must be fully compliant with the EPA regulations and local policies.
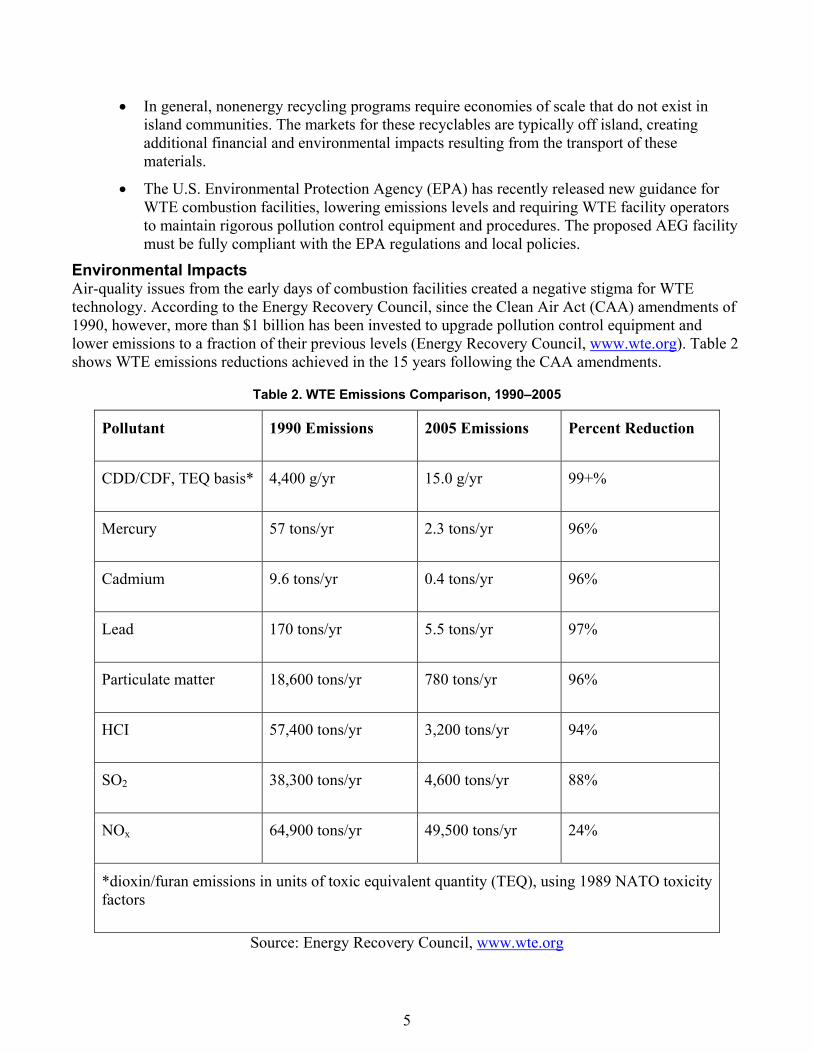
Environmental Impacts Air-quality issues from the early days of combustion facilities created a negative stigma for WTE technology. According to the Energy Recovery Council, since the Clean Air Act (CAA) amendments of 1990, however, more than $1 billion has been invested to upgrade pollution control equipment and lower emissions to a fraction of their previous levels (Energy Recovery Council, www.wte.org). Table 2 shows WTE emissions reductions achieved in the 15 years following the CAA amendments.
Table 2. WTE Emissions Comparison, 1990–2005
Pollutant 1990 Emissions 2005 Emissions Percent Reduction
CDD/CDF, TEQ basis* 4,400 g/yr 15.0 g/yr 99+%
Mercury 57 tons/yr 2.3 tons/yr 96%
Cadmium 9.6 tons/yr 0.4 tons/yr 96%
Lead 170 tons/yr 5.5 tons/yr 97%
Particulate matter 18,600 tons/yr 780 tons/yr 96%
HCI 57,400 tons/yr 3,200 tons/yr 94%
SO2 38,300 tons/yr 4,600 tons/yr 88%
NOx 64,900 tons/yr 49,500 tons/yr 24%
*dioxin/furan emissions in units of toxic equivalent quantity (TEQ), using 1989 NATO toxicity factors
Source: Energy Recovery Council, www.wte.org
6
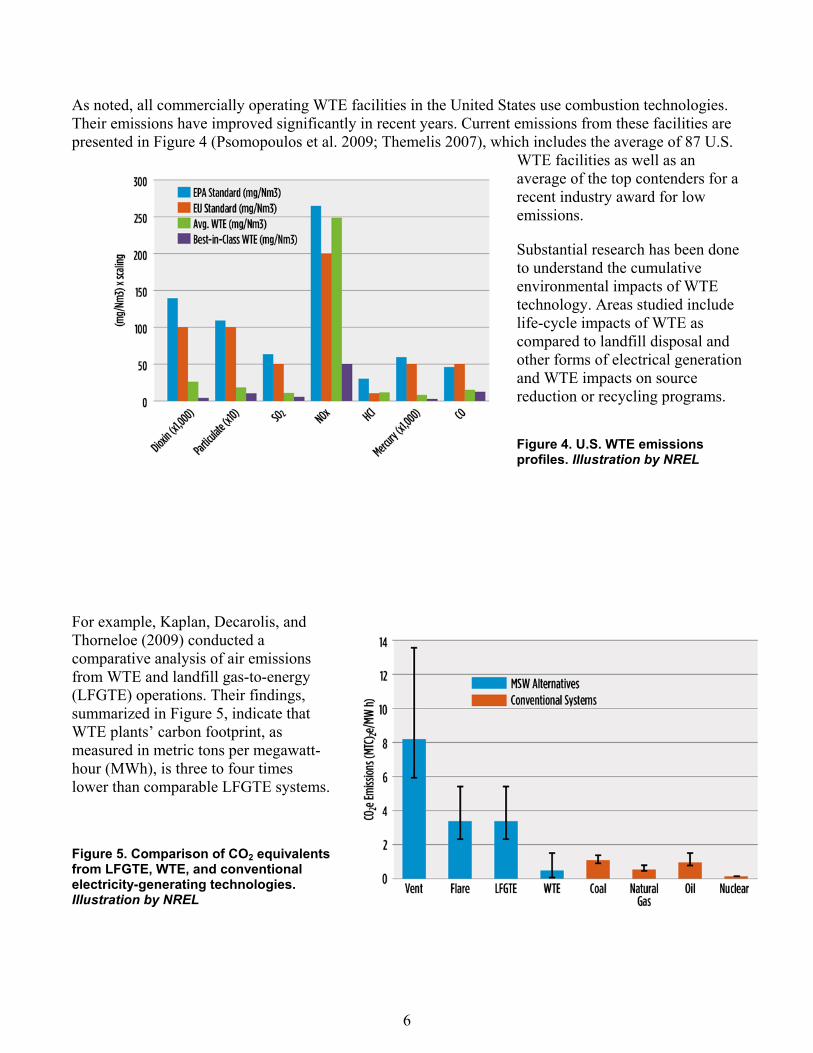
As noted, all commercially operating WTE facilities in the United States use combustion technologies. Their emissions have improved significantly in recent years. Current emissions from these facilities are presented in Figure 4 (Psomopoulos et al. 2009; Themelis 2007), which includes the average of 87 U.S.
WTE facilities as well as an average of the top contenders for a recent industry award for low emissions.
Substantial research has been done to understand the cumulative environmental impacts of WTE technology. Areas studied include life-cycle impacts of WTE as compared to landfill disposal and other forms of electrical generation and WTE impacts on source reduction or recycling programs.
Figure 4. U.S. WTE emissions profiles. Illustration by NREL
For example, Kaplan, Decarolis, and Thorneloe (2009) conducted a comparative analysis of air emissions from WTE and landfill gas-to-energy (LFGTE) operations. Their findings, summarized in Figure 5, indicate that WTE plants’ carbon footprint, as measured in metric tons per megawatt-hour (MWh), is three to four times lower than comparable LFGTE systems.
Figure 5. Comparison of CO2 equivalents from LFGTE, WTE, and conventional electricity-generating technologies. Illustration by NREL
7
Harrison, Dumas, Barlaz, and Nishtala (2000) conducted a life-cycle analysis of MSW combustion. They modeled the emissions from waste combustion, the emissions offset from avoided fossil-fuels electrical generation, and the associated emissions from manufacture and logistics of pollution control materials (lime and ammonia). In modeling a 500-ton-per-day (tpd) WTE combustion facility, they found WTE operations would lower carbon dioxide (CO2) emissions from fossil fuel sources by 42,000 metric tons annually. This is primarily the carbon savings from avoided electrical generation from fossil fuel sources and is dependent on the predominant fuel that would have been combusted to generate the equivalent amount of electricity (e.g., diesel, coal, or natural gas). Note that this does not include CO2 emissions resulting from biogenic materials in the waste stream. These materials are considered carbon neutral, since they originated from plant life that previously consumed CO2.
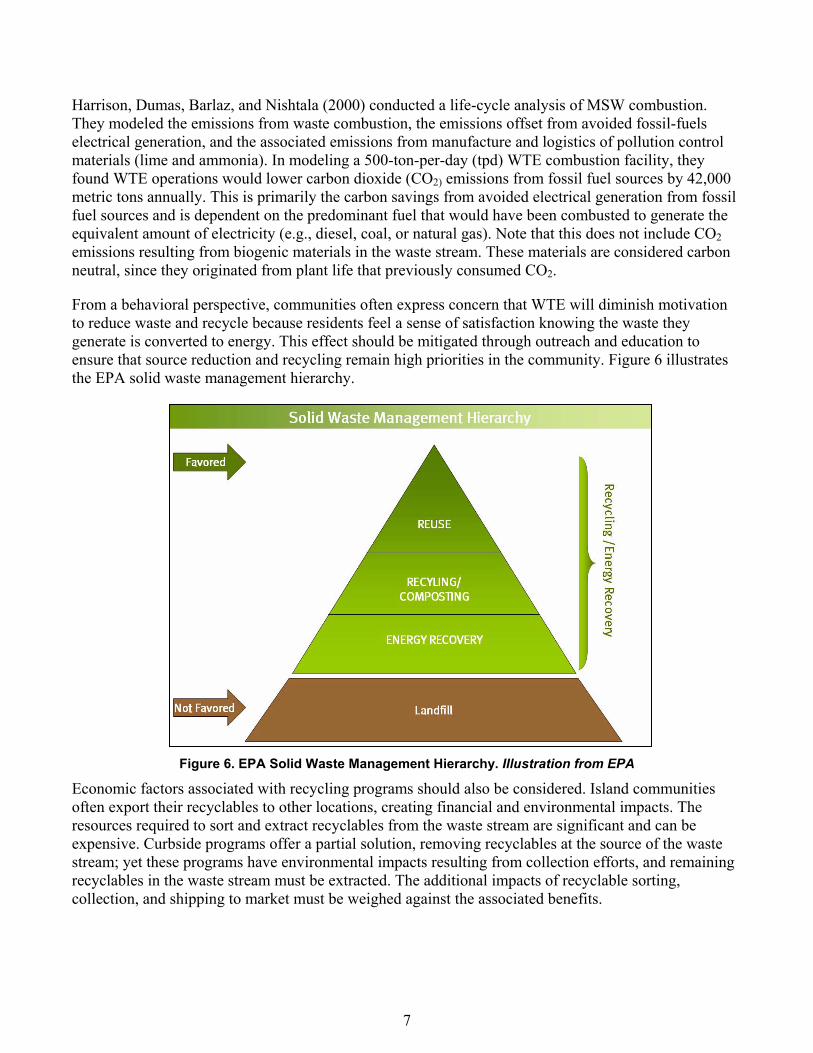
From a behavioral perspective, communities often express concern that WTE will diminish motivation to reduce waste and recycle because residents feel a sense of satisfaction knowing the waste they generate is converted to energy. This effect should be mitigated through outreach and education to ensure that source reduction and recycling remain high priorities in the community. Figure 6 illustrates the EPA solid waste management hierarchy.
Figure 6. EPA Solid Waste Management Hierarchy. Illustration from EPA
Economic factors associated with recycling programs should also be considered. Island communities often export their recyclables to other locations, creating financial and environmental impacts. The resources required to sort and extract recyclables from the waste stream are significant and can be expensive. Curbside programs offer a partial solution, removing recyclables at the source of the waste stream; yet these programs have environmental impacts resulting from collection efforts, and remaining recyclables in the waste stream must be extracted. The additional impacts of recyclable sorting, collection, and shipping to market must be weighed against the associated benefits.
8
Modeling USVI Solid Waste Options
To evaluate solid waste management options for the USVI in the context of the EPA’s recommended solid waste management hierarchy and local desire to maximize recycling, NREL partnered with Research Triangle Institute to model the scenario using the Municipal Solid Waste Decision Support Tool (MSW DST). The MSW DST was developed through a cooperative agreement between the U.S. EPA’s Office of Research and Development and RTI’s Center for Environmental Analysis to assist communities and other waste planners in conducting cost and environmental modeling of MSW management systems. Users can evaluate the numerous MSW management scenarios that are feasible within a community or region and identify the alternatives that are economically and environmentally efficient, making tradeoffs if necessary. (RTI 2011)
The MSW DST allows users to analyze existing waste management systems and proposed future systems based on user-specified information (e.g., waste generation levels, waste composition, diversion rates, and infrastructure). The current components of the MSW DST are (RTI 2011):
• Waste collection
• Transfer stations
• Material recovery facilities (MRFs)
• Mixed municipal solid wastes
• Yard waste composting
• Combustion
• Refuse-derived fuel production
• Conventional landfill
• Bioreactor landfills.
Working with RTI, NREL investigated four scenarios, outlined in Figure 7, that are of interest to stakeholders and decision makers in the USVI.

9
Figure 7. Waste scenarios modeled using the Municipal Solid Waste Decision Support Tool.
Illustration by NREL
10
In all of the MSW DST modeling, the following assumptions were made:
• Characterization of the waste stream is derived from the 2009 Waste Stream Characterization Study completed by Girshman, Brickner & Bratton, Inc. (GBB) for the USVI Waste Management Authority. Several categories of the GBB study were modified to fit categories required for the MSW DST (e.g., the GBB category of Wood Waste as a proxy for the MSW DST category of Pallets). Several similar adjustments were made for various grades of wood, paper, and plastic categorization, but these were not considered significant, as the general categories remained consistent.
• Net electrical production of the WTE facility will offset utility-provided power from 100% oil-fired generation facilities.
• General RDF processing characteristics were considered representative of the WastAway processes in considering facility costs and energy consumption.
• Retail rates for electricity on the USVI are $.42/kilowatt-hour (kWh).
• MSW is collected one time per week in the USVI.
• All recycling is completed at MRFs on St. Thomas and St. Croix. A curbside recycling program was not evaluated.
• Recovery efforts are 75% effective in removing recyclable and compostable material from the USVI waste stream.
• Assumptions relating to transportation and facility characteristics are outlined in Appendix A.
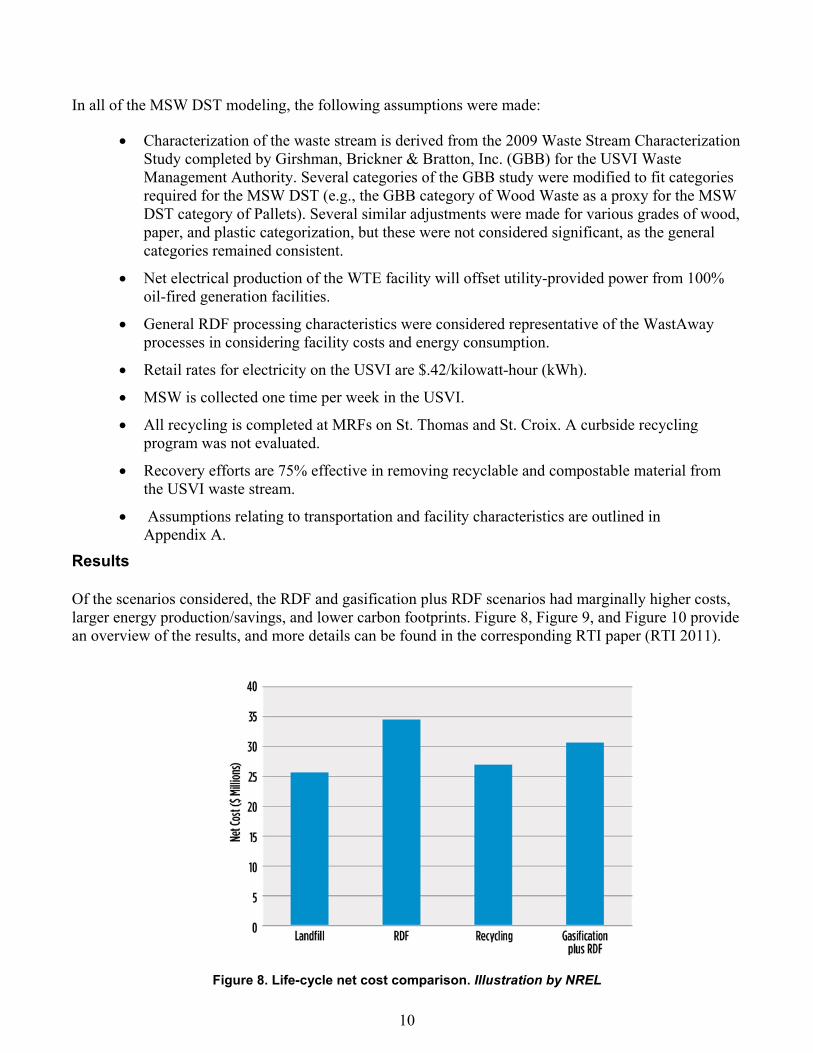
Results Of the scenarios considered, the RDF and gasification plus RDF scenarios had marginally higher costs, larger energy production/savings, and lower carbon footprints. Figure 8, Figure 9, and Figure 10 provide an overview of the results, and more details can be found in the corresponding RTI paper (RTI 2011).
Figure 8. Life-cycle net cost comparison. Illustration by NREL
11
Costs were estimated using available standard industry guidelines for capital and operating and maintenance costs for facilities capable of handling the estimated 147,000 tons per year of MSW in the USVI. Revenues from the sale of recyclable material or electricity are based on available market information for the USVI. Note that potential costs for continued noncompliance of the Bovoni and Anguilla landfills were not included in the landfill scenario, as these were outside the scope of this work.
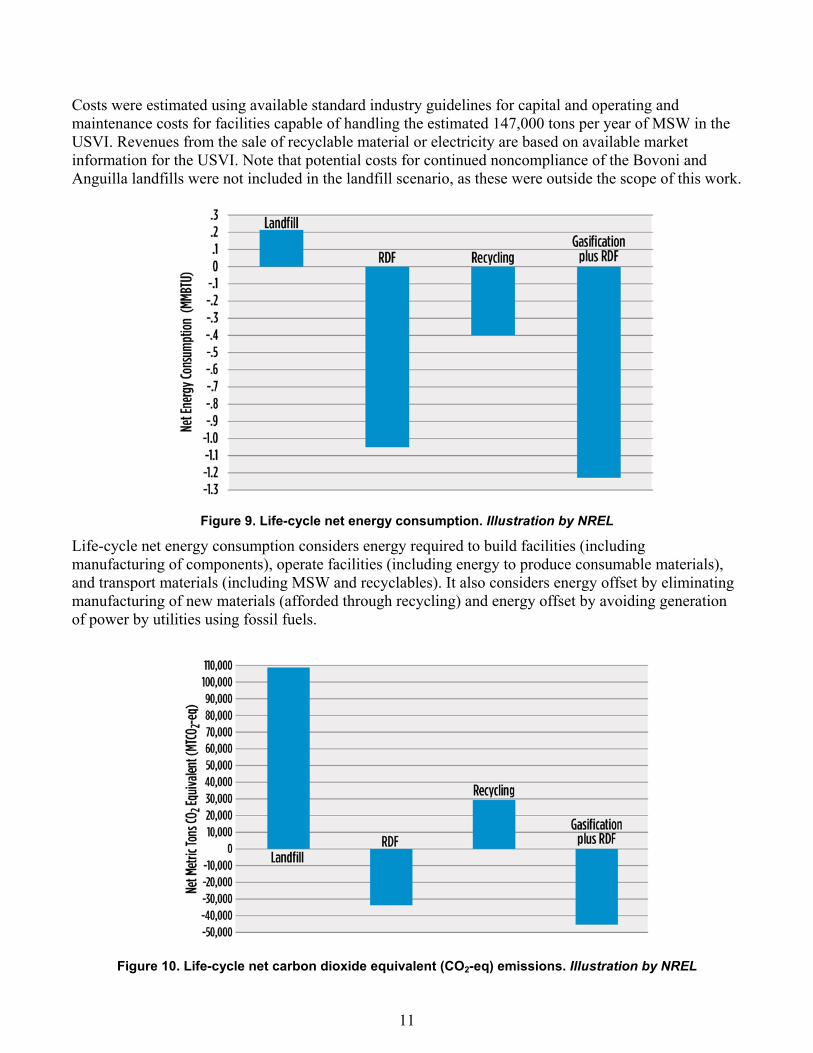
Figure 9. Life-cycle net energy consumption. Illustration by NREL
Life-cycle net energy consumption considers energy required to build facilities (including manufacturing of components), operate facilities (including energy to produce consumable materials), and transport materials (including MSW and recyclables). It also considers energy offset by eliminating manufacturing of new materials (afforded through recycling) and energy offset by avoiding generation of power by utilities using fossil fuels.
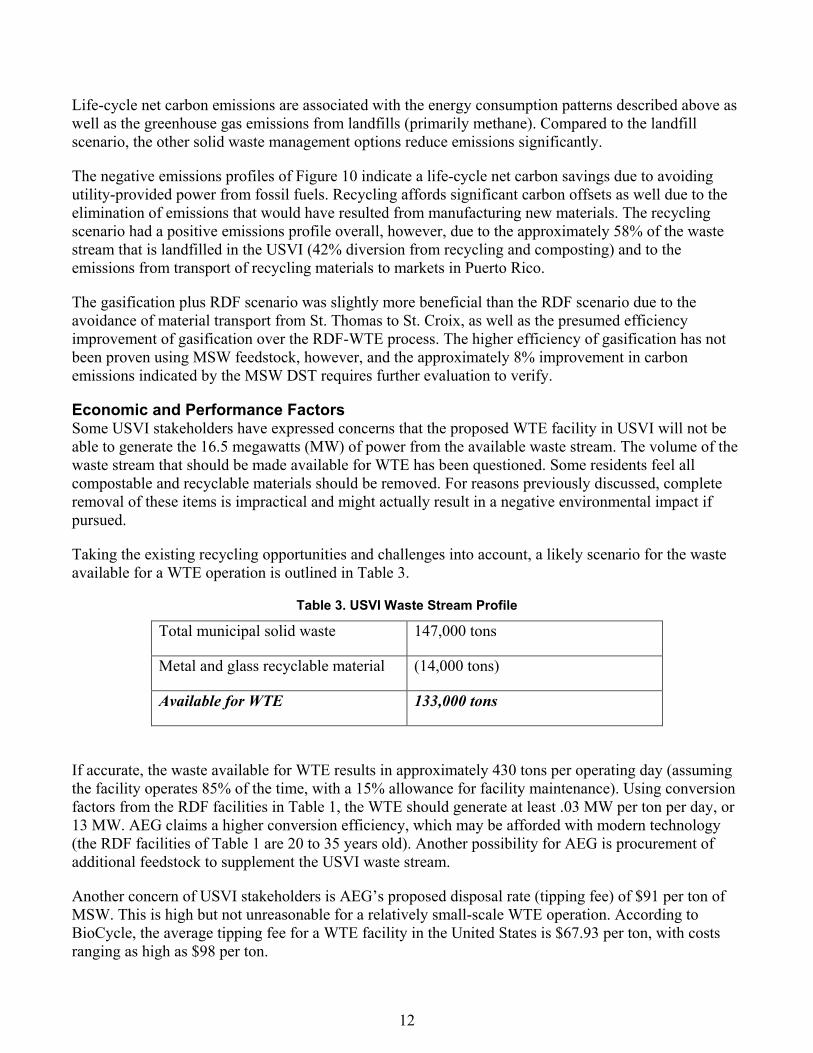
Figure 10. Life-cycle net carbon dioxide equivalent (CO2-eq) emissions. Illustration by NREL
12
Life-cycle net carbon emissions are associated with the energy consumption patterns described above as well as the greenhouse gas emissions from landfills (primarily methane). Compared to the landfill scenario, the other solid waste management options reduce emissions significantly.
The negative emissions profiles of Figure 10 indicate a life-cycle net carbon savings due to avoiding utility-provided power from fossil fuels. Recycling affords significant carbon offsets as well due to the elimination of emissions that would have resulted from manufacturing new materials. The recycling scenario had a positive emissions profile overall, however, due to the approximately 58% of the waste stream that is landfilled in the USVI (42% diversion from recycling and composting) and to the emissions from transport of recycling materials to markets in Puerto Rico.
The gasification plus RDF scenario was slightly more beneficial than the RDF scenario due to the avoidance of material transport from St. Thomas to St. Croix, as well as the presumed efficiency improvement of gasification over the RDF-WTE process. The higher efficiency of gasification has not been proven using MSW feedstock, however, and the approximately 8% improvement in carbon emissions indicated by the MSW DST requires further evaluation to verify.
Economic and Performance Factors Some USVI stakeholders have expressed concerns that the proposed WTE facility in USVI will not be able to generate the 16.5 megawatts (MW) of power from the available waste stream. The volume of the waste stream that should be made available for WTE has been questioned. Some residents feel all compostable and recyclable materials should be removed. For reasons previously discussed, complete removal of these items is impractical and might actually result in a negative environmental impact if pursued.
Taking the existing recycling opportunities and challenges into account, a likely scenario for the waste available for a WTE operation is outlined in Table 3.
Table 3. USVI Waste Stream Profile
Total municipal solid waste 147,000 tons
Metal and glass recyclable material (14,000 tons)
Available for WTE 133,000 tons
If accurate, the waste available for WTE results in approximately 430 tons per operating day (assuming the facility operates 85% of the time, with a 15% allowance for facility maintenance). Using conversion factors from the RDF facilities in Table 1, the WTE should generate at least .03 MW per ton per day, or 13 MW. AEG claims a higher conversion efficiency, which may be afforded with modern technology (the RDF facilities of Table 1 are 20 to 35 years old). Another possibility for AEG is procurement of additional feedstock to supplement the USVI waste stream.
Another concern of USVI stakeholders is AEG’s proposed disposal rate (tipping fee) of $91 per ton of MSW. This is high but not unreasonable for a relatively small-scale WTE operation. According to BioCycle, the average tipping fee for a WTE facility in the United States is $67.93 per ton, with costs ranging as high as $98 per ton.

13
Table 4. MSW and Cost Data
State Number of WTE Plants
Avg WTE Tip Fee ($/ton)
Alabama 1 $25.00
Connecticut 7 $64.00
Florida 12 $52.95
Iowa 1 $64.00
Massachusetts 7 $69.00
Minnesota 9 $55.00
New Hampshire 2 $69.00
New Jersey 5 $85.00
New York 10 $72.34
Washington 3 $98.00
Wisconsin 2 $51.00
Source: BioCycle, The State Of Garbage In America, December 2008
Conclusions
A general finding of this evaluation is that WTE operations, if implemented appropriately, serve a beneficial role in an integrated solid waste management program for a community. The appropriateness of WTE for a community must be evaluated on a case-by-case basis and should only be considered after waste reduction and responsible recycling programs are implemented.
Specific to the USVI, the proposed WTE facility appears to:
• Have economics similar to WTE facilities in the continental United States in terms of waste disposal fees and overall life-cycle costs to the community (higher costs in the USVI are expected due to lack of economies of scale)
• Offer a lower life-cycle impact on the environment (in terms of energy consumption and net greenhouse gas emissions)
• Have the potential to meet all EPA emissions standards (based on similar WTE plants in the United States).

14
This report used the best available information and considered recycling challenges unique to the USVI, particularly the energy required to transport recyclable material to reprocessing facilities. Based on this information, NREL’s recommendation for the USVI is to establish a recycling program for glass and metals, while using the remainder of MSW feedstock as fuel for a WTE facility using modern conversion technology and emissions control equipment.
15
References
Arsova, Ljupka; van Haaren Rob; Goldstein, Nora; Kaufman, Scott M.; and Themelis, Nickolas J. “The State Of Garbage In America.” BioCycle; Vol. 49, No. 12, December 2008; p. 22.
Girshman, Brickner & Bratton, Inc. 2009 USVI Waste Stream Characterization Study. Work performed for the VI Waste Management Authority, December 2009.
Kaplan, P.Ozge; Decarolis, Joseph; Thorneloe, Susan. “Is It Better To Burn or Bury Waste for Clean Electricity Generation?” Environmental Science Technology; Vol. 43, No. 6, 2009, 1711–1717.
Lauber J.D.; Morris M.E.; Ulloa P.; Hasselriis F. “Local Waste-to-Energy vs. Long Distance Disposal of Municipal Waste.” AWMA Conference, June 21, 2006, New Orleans, Louisiana.
Psomopoulos, C.S.; Bourka, A.; Themelis, N.J. “Waste-to-Energy: A Review of the Status and Benefits in the USA, Waste Management; Vol. 29, January 2009; pp. 1718–1724.
RTI International, U.S. Virgin Islands Waste to Energy Project. August 2011.
Themelis, N.J. “Thermal Treatment Review.” Waste Management World; July–August 2007; pp. 37–45.
USVI Energy Road Map: Charting the Course to a Clean Energy Future. National Renewable Energy Laboratory, BR-6A42-51541, July 2011.
16
Appendix A: Logistics and Facility Assumptions
A. MRF, transfer station, landfill, RDF, and WTE facilities are co-located near the Bovoni Landfill on St. Thomas and the Anguilla Landfill on St. Croix
B. Average distance from St. Thomas and St. Croix collection points to the MRF/transfer station/landfill: 5 miles (by truck)
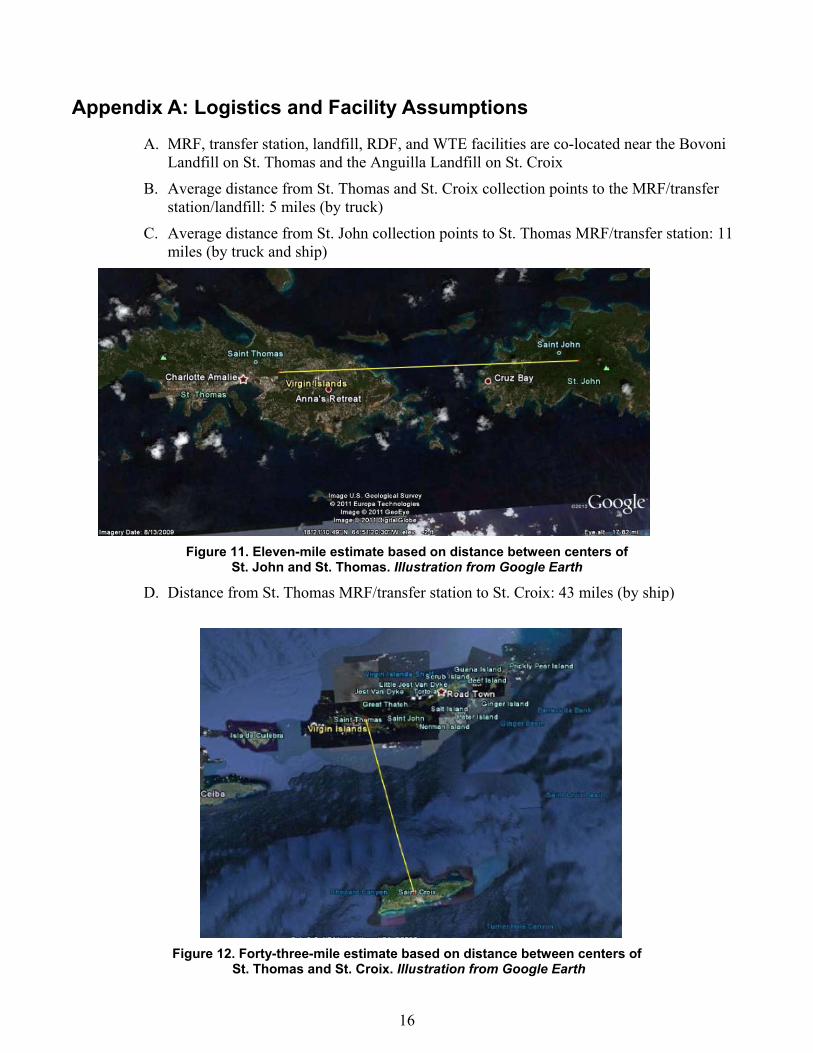
C. Average distance from St. John collection points to St. Thomas MRF/transfer station: 11 miles (by truck and ship)
Figure 11. Eleven-mile estimate based on distance between centers of St. John and St. Thomas. Illustration from Google Earth
D. Distance from St. Thomas MRF/transfer station to St. Croix: 43 miles (by ship)
Figure 12. Forty-three-mile estimate based on distance between centers of
St. Thomas and St. Croix. Illustration from Google Earth
17
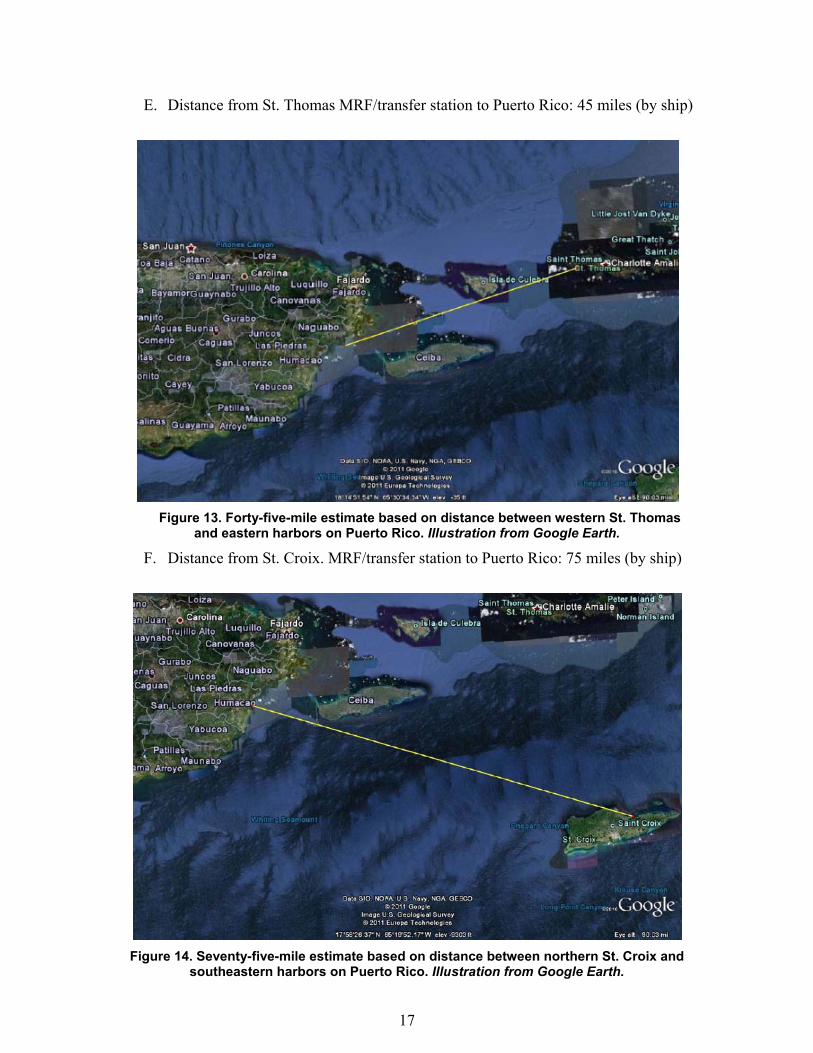
E. Distance from St. Thomas MRF/transfer station to Puerto Rico: 45 miles (by ship)
Figure 13. Forty-five-mile estimate based on distance between western St. Thomas
and eastern harbors on Puerto Rico. Illustration from Google Earth.
F. Distance from St. Croix. MRF/transfer station to Puerto Rico: 75 miles (by ship)
Figure 14. Seventy-five-mile estimate based on distance between northern St. Croix and
southeastern harbors on Puerto Rico. Illustration from Google Earth.
18
G. Local truck transportation from MRF/transfer station to shipping harbors, and from receiving harbors to recycling centers or WTE facilities, were not considered in the MSW DST model.
H. MRF/transfer stations are semiautomated facilities accepting mixed MSW.
I. The WTE plant is RDF-fueled and has a heat rate of 18,000 Btu/kWh.
J. Composting operations use windrows of mixed organics, turned over biweekly.
K. Emissions time period is 100 years.