seismic behaviour of municipal solid waste (msw)- data report … · seismic behaviour of municipal...
TRANSCRIPT
Seismic behaviour of Municipal
Solid Waste (MSW)- Data report on centrifuge tests IT02, IT03 and IT09
N.I. Thusyanthan 1 & S.P.G. Madabhushi2
CUED/D-SOILS/TR337 (2005)
1 Research Fellow, Churchill college, University of Cambridge 2 Senior Lecturer, Engineering Department, University of Cambridge

3
CONTENTS........................................................................................................................................................PG
1 INTRODUCTION ....................................................................................................................................... 5
2 MODELLING MUNICIPAL SOLID WASTE......................................................................................... 5
3 MODEL PREPARATION AND TESTING.............................................................................................. 6
3.1 MODEL IT02......................................................................................................................................... 6 3.2 MODEL IT03......................................................................................................................................... 7 3.3 MODEL IT09......................................................................................................................................... 9
4 RESULTS................................................................................................................................................... 10
4.1 DATA FROM IT02, EARTHQUAKE 1. .................................................................................................... 10 4.2 DATA FROM IT02, EARTHQUAKE 2 ..................................................................................................... 11 4.3 DATA FROM IT02, EARTHQUAKE 3 ..................................................................................................... 12 4.4 DATA FROM IT02, EARTHQUAKE 4 ..................................................................................................... 13 4.5 DATA FROM IT02, EARTHQUAKE 5 ..................................................................................................... 14 4.6 DATA FROM IT02, EARTHQUAKE 6 ..................................................................................................... 15 4.7 DATA FROM IT02, EARTHQUAKE 7 ..................................................................................................... 16
5 DATA FROM TEST IT03. ....................................................................................................................... 17
5.1 DATA FROM IT03, EARTHQUAKE 1 ..................................................................................................... 17 5.2 DATA FROM IT03, EARTHQUAKE 1 ..................................................................................................... 18 5.3 DATA FROM IT03, EARTHQUAKE 2 ..................................................................................................... 19 5.4 DATA FROM IT03, EARTHQUAKE 2 ..................................................................................................... 20 5.5 DATA FROM IT03, EARTHQUAKE 3 ..................................................................................................... 21 5.6 DATA FROM IT03, EARTHQUAKE 3 ..................................................................................................... 22 5.7 DATA FROM IT03, EARTHQUAKE 4 ..................................................................................................... 23 5.8 DATA FROM IT03, EARTHQUAKE 4 ..................................................................................................... 24 5.9 DATA FROM IT03, EARTHQUAKE 5 ..................................................................................................... 25 5.10 DATA FROM IT03, EARTHQUAKE 5 ..................................................................................................... 26 5.11 DATA FROM IT03, EARTHQUAKE 6 ..................................................................................................... 27 5.12 DATA FROM IT03, EARTHQUAKE 6 ..................................................................................................... 28 5.13 DATA FROM IT03, EARTHQUAKE 7 ..................................................................................................... 29 5.14 DATA FROM IT03, EARTHQUAKE 7 ..................................................................................................... 30
6 DATA FROM IT09 ................................................................................................................................... 31
6.1 DATA FROM IT09, EARTHQUAKE 1 (50G) ........................................................................................... 31 6.2 DATA FROM IT09, EARTHQUAKE 1 (50G) ........................................................................................... 32 6.3 DATA FROM IT09, EARTHQUAKE 2 (80G) ........................................................................................... 33 6.4 DATA FROM IT09, EARTHQUAKE 3 (80G) ........................................................................................... 35 6.5 DATA FROM IT09, EARTHQUAKE 4 (80G) ........................................................................................... 37

CUED/D-SOILS/TR337
4
6.6 DATA FROM IT09, EARTHQUAKE 5 (80G) ........................................................................................... 39 6.7 SWING UP TO 50G................................................................................................................................ 41 6.8 SWING UP TO 80G................................................................................................................................ 42
CUED/D-SOILS/TR337
5
1 Introduction
Seismic behaviour of landfills is a major concern as landfill failures can lead to ground water
contamination and other geo-environmental disasters. Study into the seismic behaviour of
waste landfills has often been limited to numerical analysis due to the difficulties associated
with dealing with real waste in experiments. Hence present understanding of seismic
behaviour of MSW landfills is mainly based on parametric studies carried out using numerical
packages (i.e SHAKE91) and few recorded earthquakes.
This report presents the development of a generic model waste which can be used in
centrifuge experiments to model both the static and dynamic behaviour of MSW. Important
physical properties of the model waste such as unit weight, compressibility, shear strength
and moisture content were tested and shown to agree well with typical values reported in the
literature for the MSW. A series of dynamic centrifuge tests were performed on the model
waste, in which the model waste was subjected to several earthquakes of varying intensity and
frequency. This model waste was then used in dynamic centrifuge tests to understand the
seismic performance of “above and below ground fill” type and “area fill” type MSW
landfills (Thusyanthan 2005).
This data report presents results from dynamic centrifuge tests IT02, IT03 and IT09. The
landfills modelled in the dynamic centrifuge test were municipal solid waste (MSW) landfills.
Detailed analysis of the data provided in this report is given in Thusyanthan (2005)- Ph.D
thesis, University of Cambridge, UK.
2 Modelling municipal solid waste
Municipal Solid Waste (MSW) is usually highly heterogeneous and variable in its content.
Thus the use of real MSW in centrifuge experiments has many concerns such as the
dependence of centrifuge test results on the source and age of the MSW and hence the
question of repeatability. A model waste, whose properties closely match to those of a typical
MSW, has been developed using a mixture of peat, E-grade kaolin clay and fraction-E fine
sand.
Preliminary development involved producing 3 mixtures (A, B & C). The ratio of peat : clay :
sand by weight in mixtures A, B and C were 2:1:1, 1:1:1 and 1:2:1 respectively. Unit weight,
CUED/D-SOILS/TR337
6
compressibility and shear strength characteristics of the mixtures were experimentally
determined. Even though all three mixtures had the potential to be used as model MSW,
consideration of easy of handling dominated the choice and mixture B was chosen as the
model MSW to be used in centrifuge experiments.
3 Model preparation and testing
3.1 Model IT02
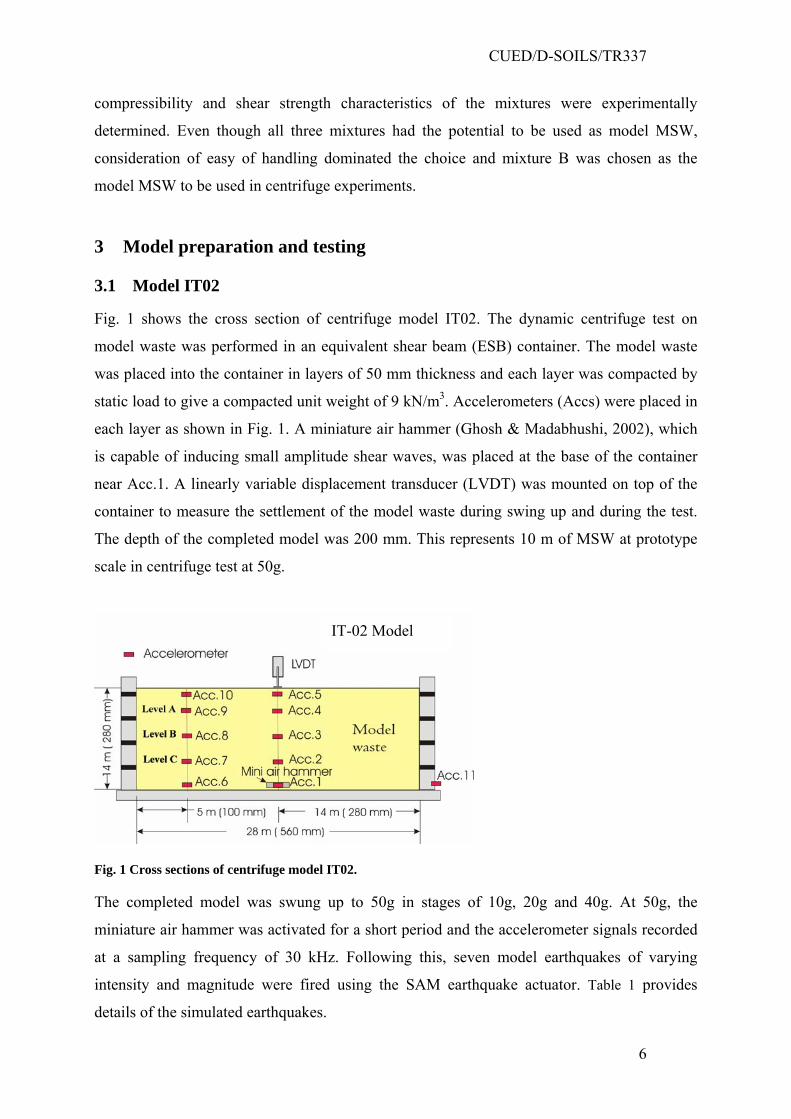
Fig. 1 shows the cross section of centrifuge model IT02. The dynamic centrifuge test on
model waste was performed in an equivalent shear beam (ESB) container. The model waste
was placed into the container in layers of 50 mm thickness and each layer was compacted by
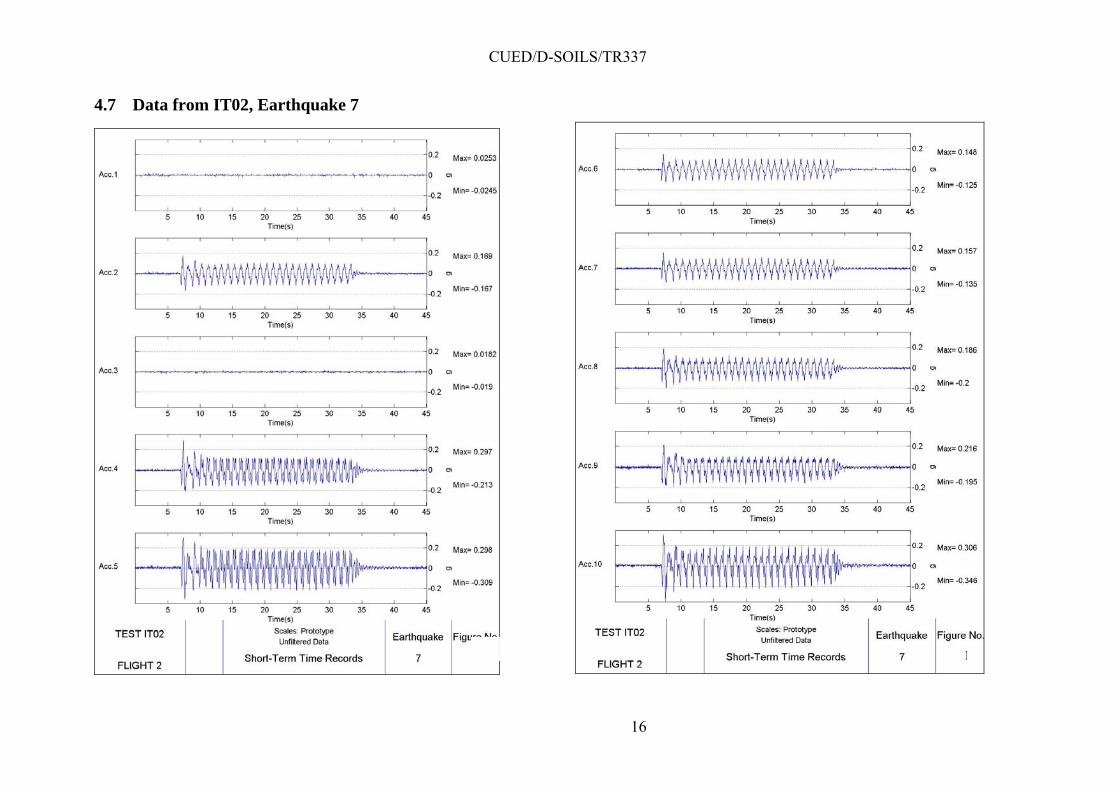
static load to give a compacted unit weight of 9 kN/m3. Accelerometers (Accs) were placed in
each layer as shown in Fig. 1. A miniature air hammer (Ghosh & Madabhushi, 2002), which
is capable of inducing small amplitude shear waves, was placed at the base of the container
near Acc.1. A linearly variable displacement transducer (LVDT) was mounted on top of the
container to measure the settlement of the model waste during swing up and during the test.
The depth of the completed model was 200 mm. This represents 10 m of MSW at prototype
scale in centrifuge test at 50g.
Fig. 1 Cross sections of centrifuge model IT02.
The completed model was swung up to 50g in stages of 10g, 20g and 40g. At 50g, the
miniature air hammer was activated for a short period and the accelerometer signals recorded
at a sampling frequency of 30 kHz. Following this, seven model earthquakes of varying
intensity and magnitude were fired using the SAM earthquake actuator. Table 1 provides
details of the simulated earthquakes.
IT-02 Model
CUED/D-SOILS/TR337
7
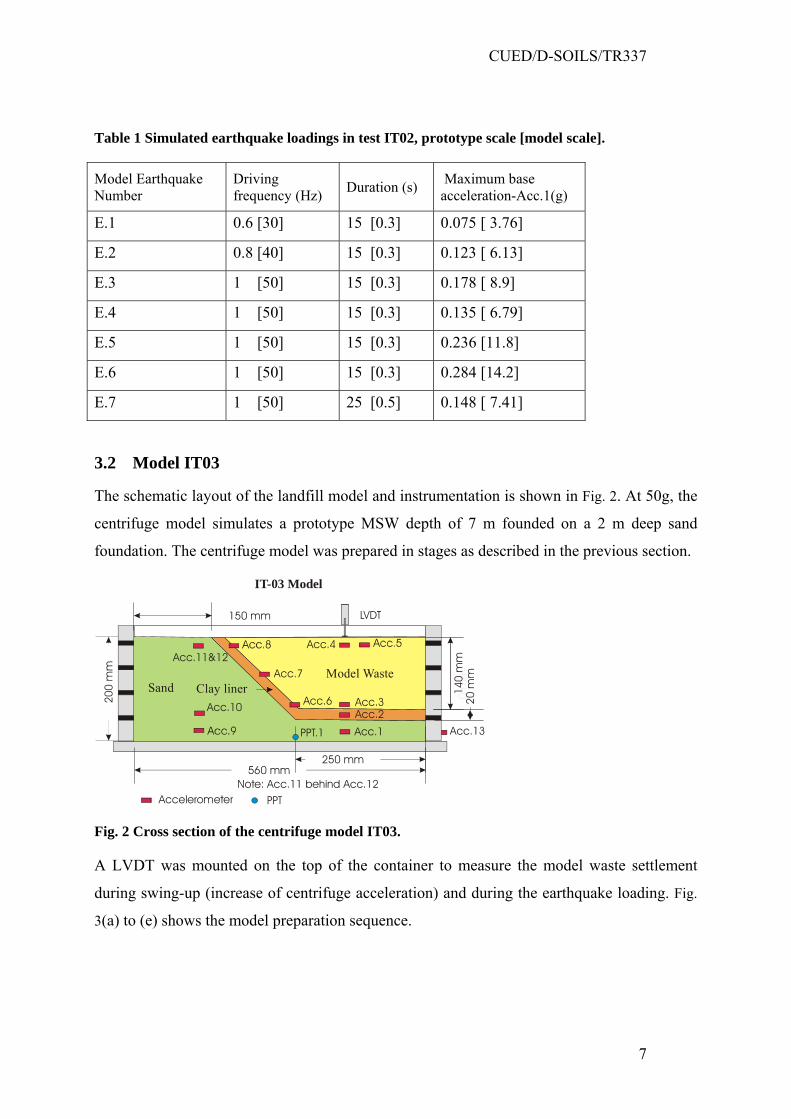
Table 1 Simulated earthquake loadings in test IT02, prototype scale [model scale].
Model Earthquake Number
Driving frequency (Hz) Duration (s) Maximum base
acceleration-Acc.1(g)
E.1 0.6 [30] 15 [0.3] 0.075 [ 3.76]
E.2 0.8 [40] 15 [0.3] 0.123 [ 6.13]
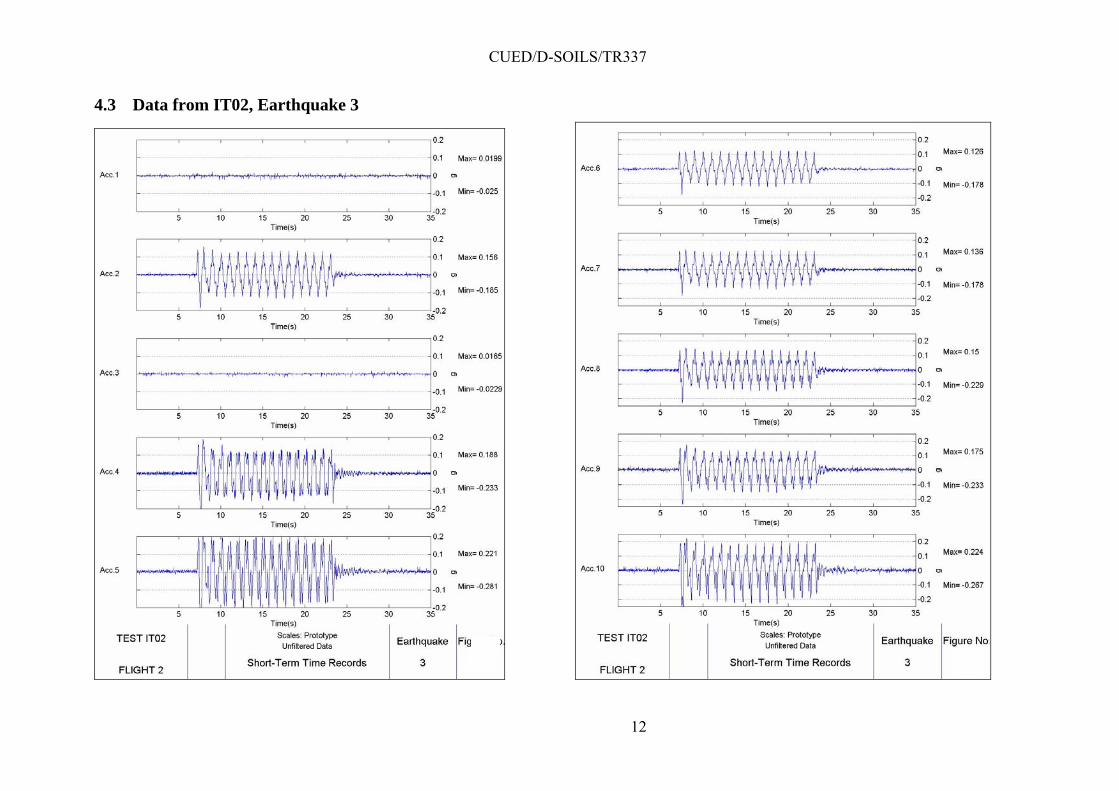
E.3 1 [50] 15 [0.3] 0.178 [ 8.9]
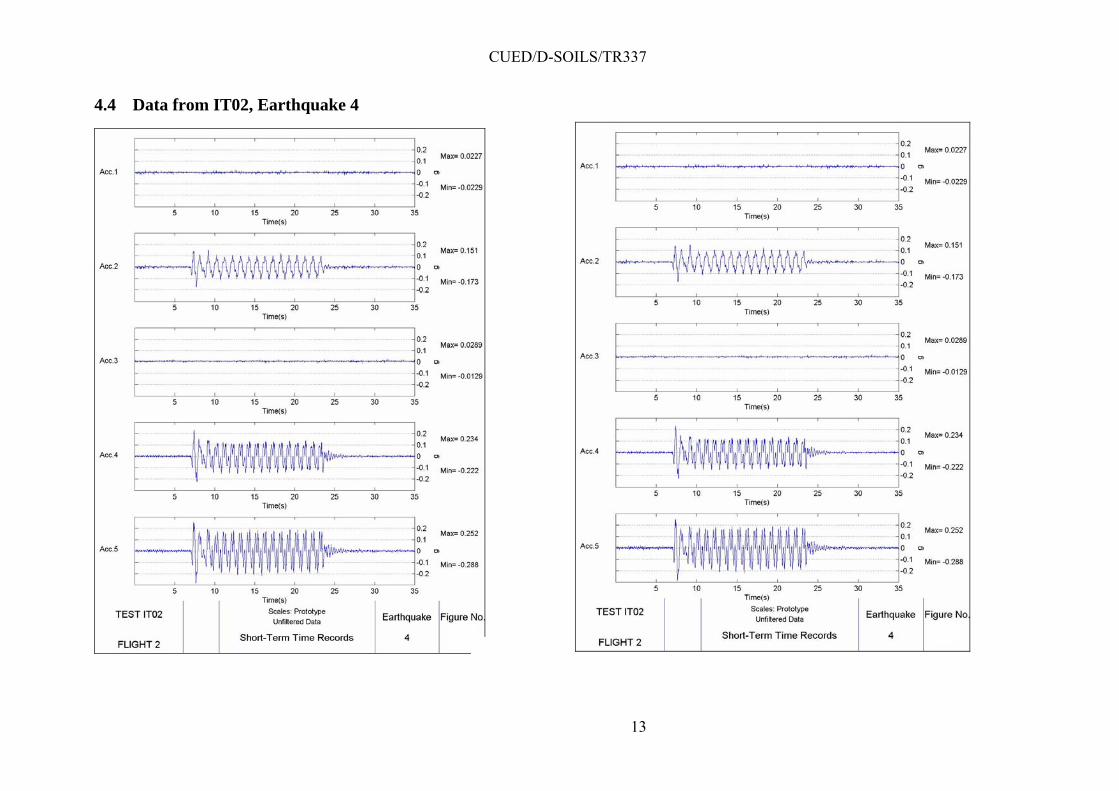
E.4 1 [50] 15 [0.3] 0.135 [ 6.79]
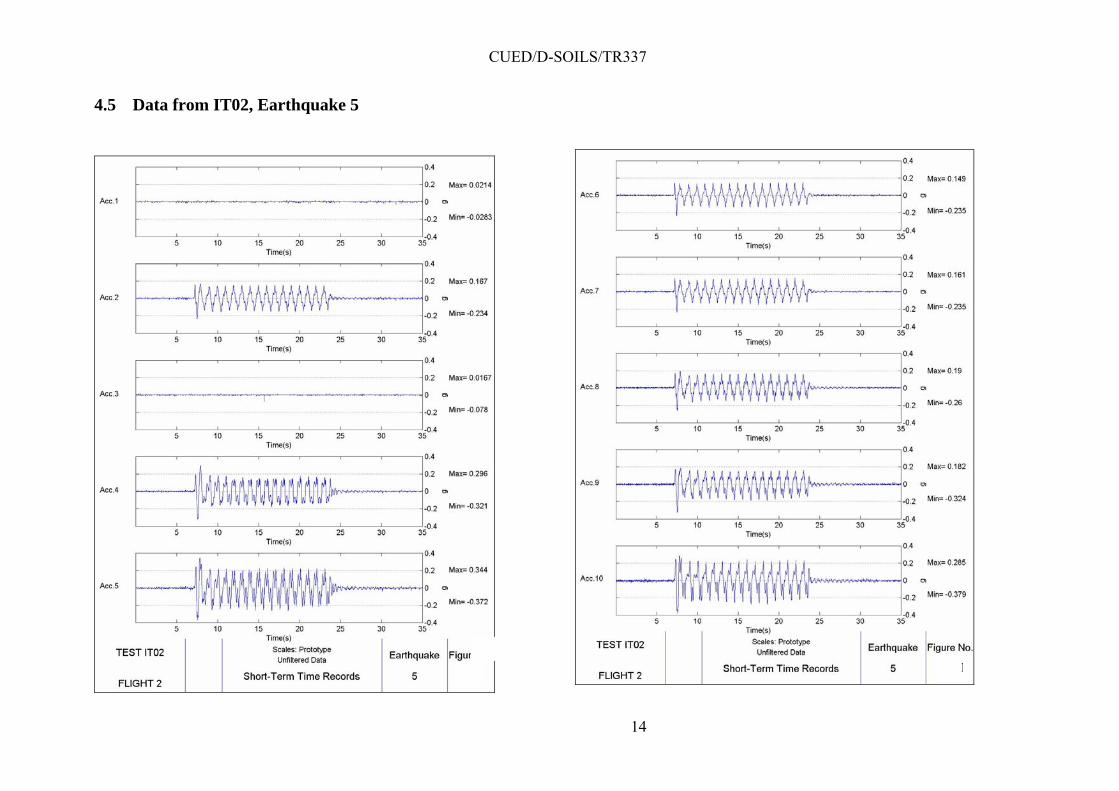
E.5 1 [50] 15 [0.3] 0.236 [11.8]
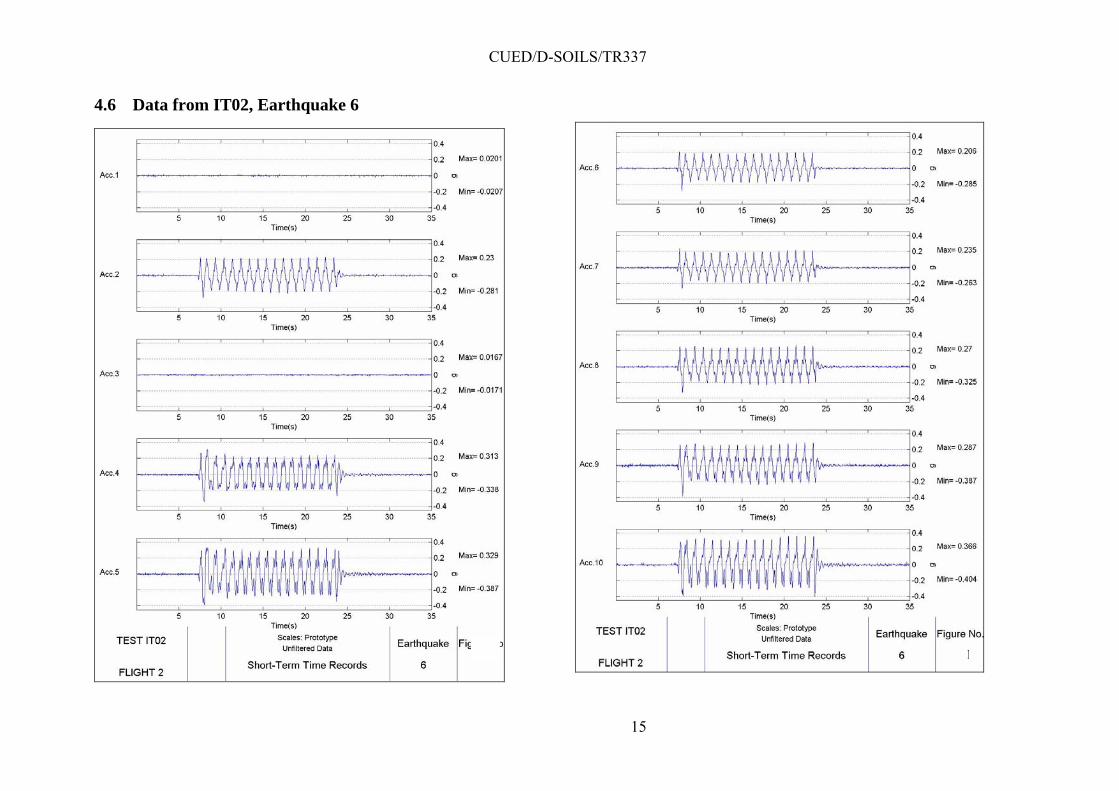
E.6 1 [50] 15 [0.3] 0.284 [14.2]
E.7 1 [50] 25 [0.5] 0.148 [ 7.41]
3.2 Model IT03
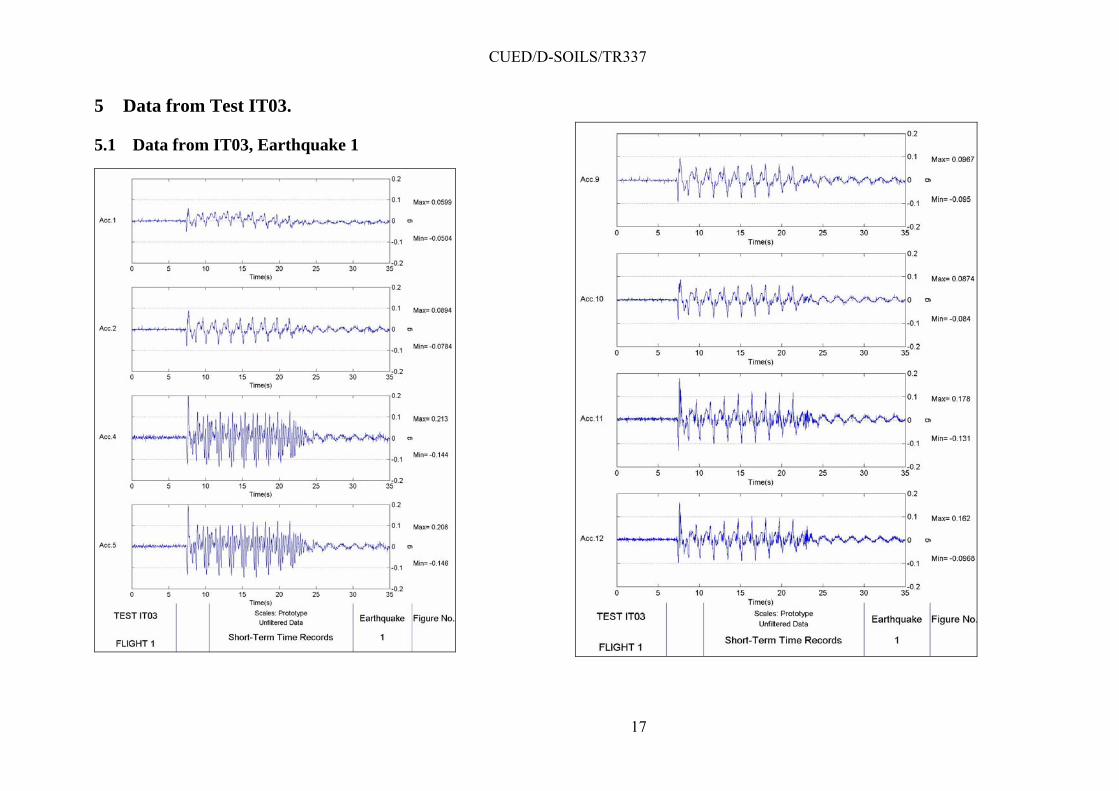
The schematic layout of the landfill model and instrumentation is shown in Fig. 2. At 50g, the
centrifuge model simulates a prototype MSW depth of 7 m founded on a 2 m deep sand
foundation. The centrifuge model was prepared in stages as described in the previous section.
200
mm
0 m
m
Accelerometer
Model WasteSand Clay liner
250 mm
LVDT
Acc.1
Acc.3Acc.2
Acc.4Acc.11&12
Acc.7
Acc.6Acc.10
Acc.13
PPT
20 m
m
Note: Acc.11 behind Acc.12
140
mm
560 mm
PPT.1
150 mm
IT-03 Model
Fig. 2 Cross section of the centrifuge model IT03.
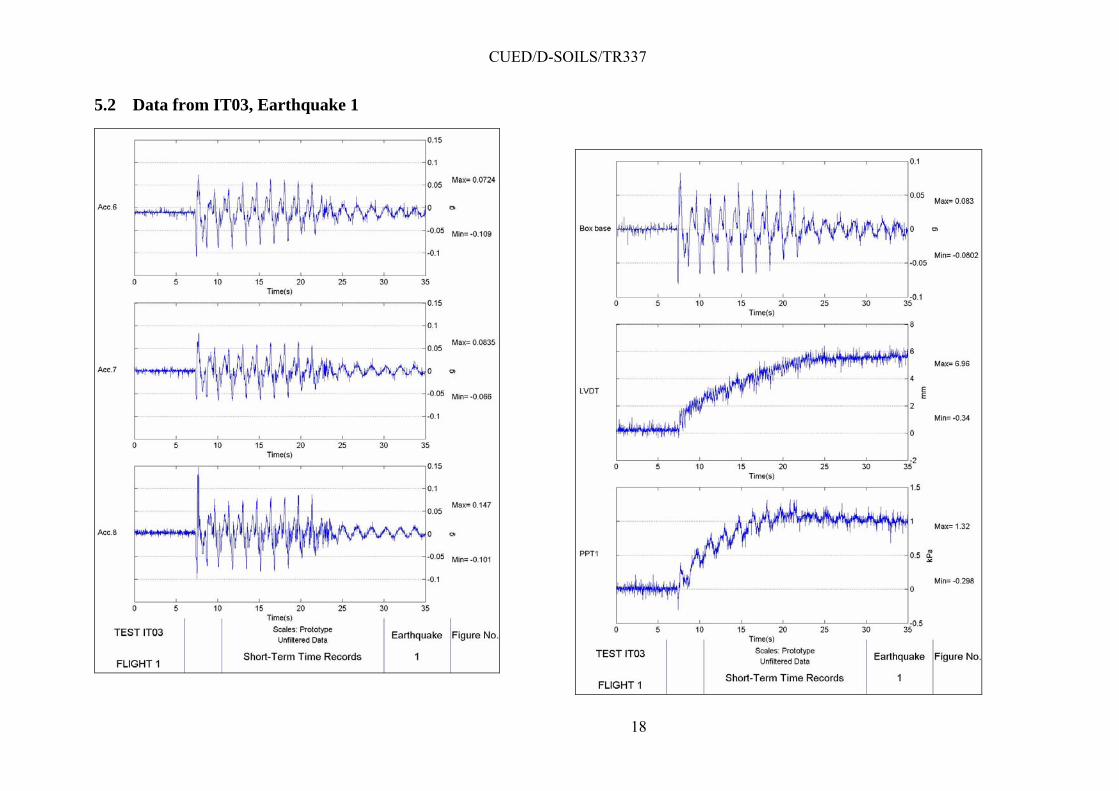
A LVDT was mounted on the top of the container to measure the model waste settlement
during swing-up (increase of centrifuge acceleration) and during the earthquake loading. Fig.
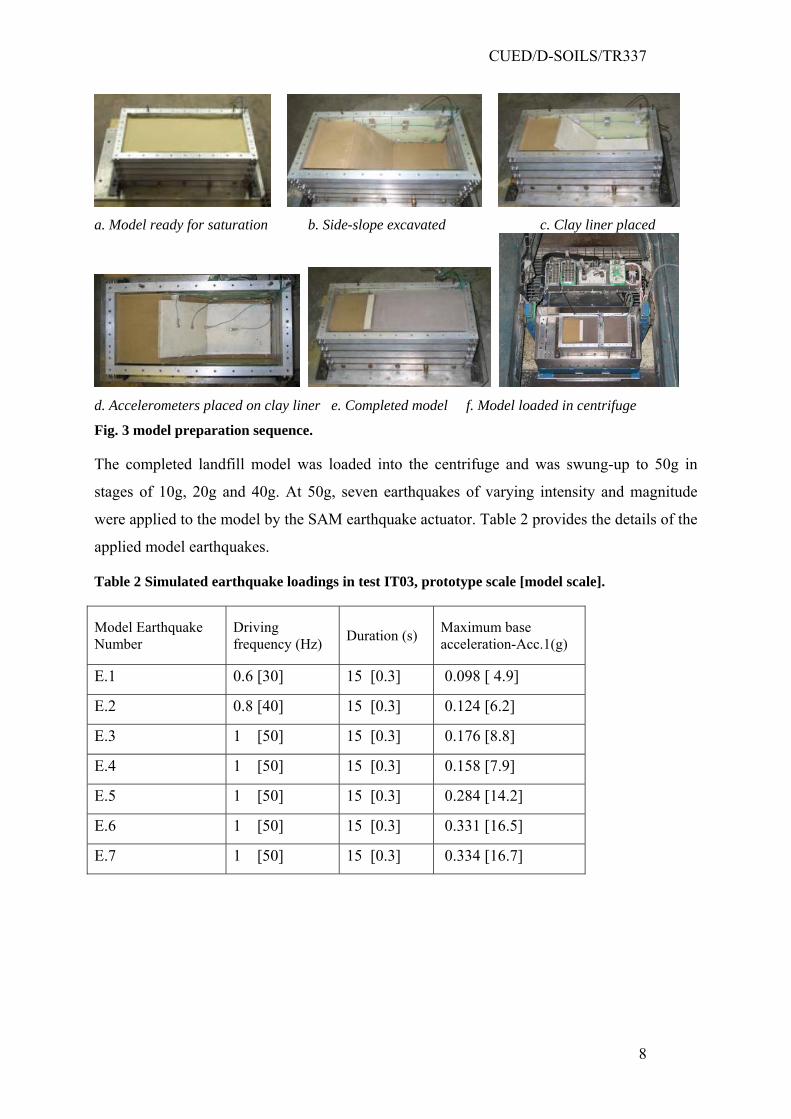
3(a) to (e) shows the model preparation sequence.
CUED/D-SOILS/TR337
8
a. Model ready for saturation b. Side-slope excavated c. Clay liner placed
d. Accelerometers placed on clay liner e. Completed model f. Model loaded in centrifuge
Fig. 3 model preparation sequence.
The completed landfill model was loaded into the centrifuge and was swung-up to 50g in
stages of 10g, 20g and 40g. At 50g, seven earthquakes of varying intensity and magnitude
were applied to the model by the SAM earthquake actuator. Table 2 provides the details of the
applied model earthquakes.
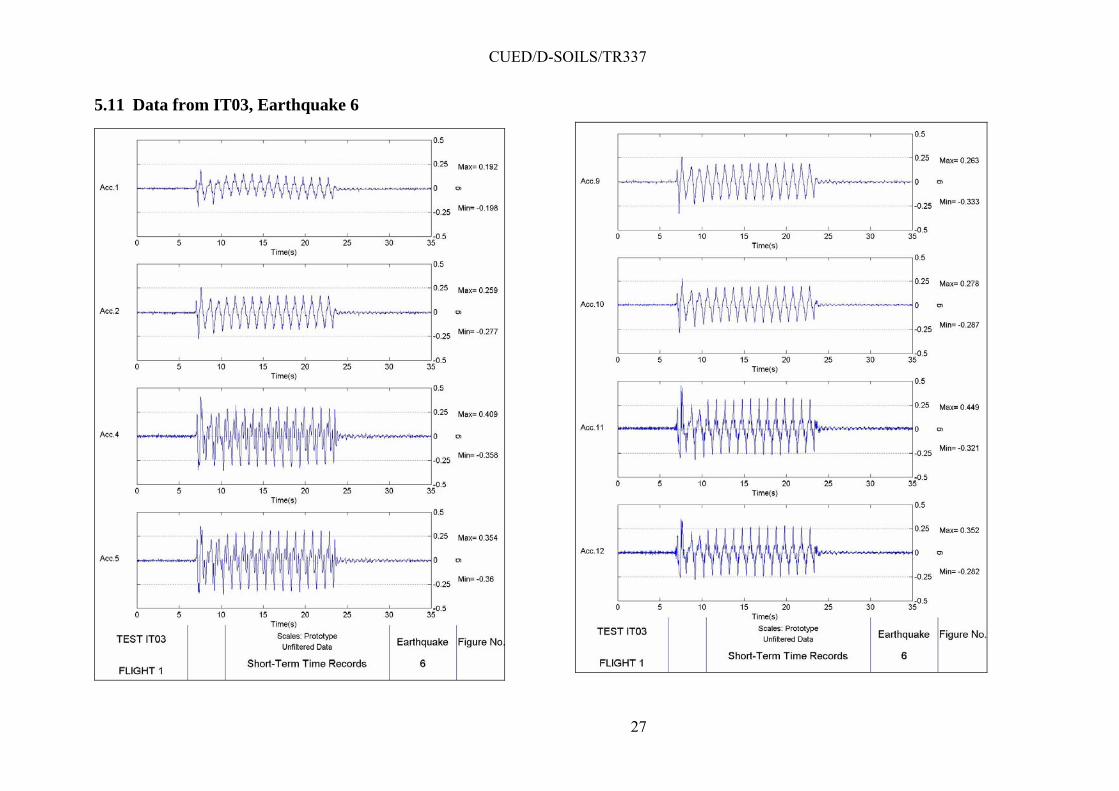
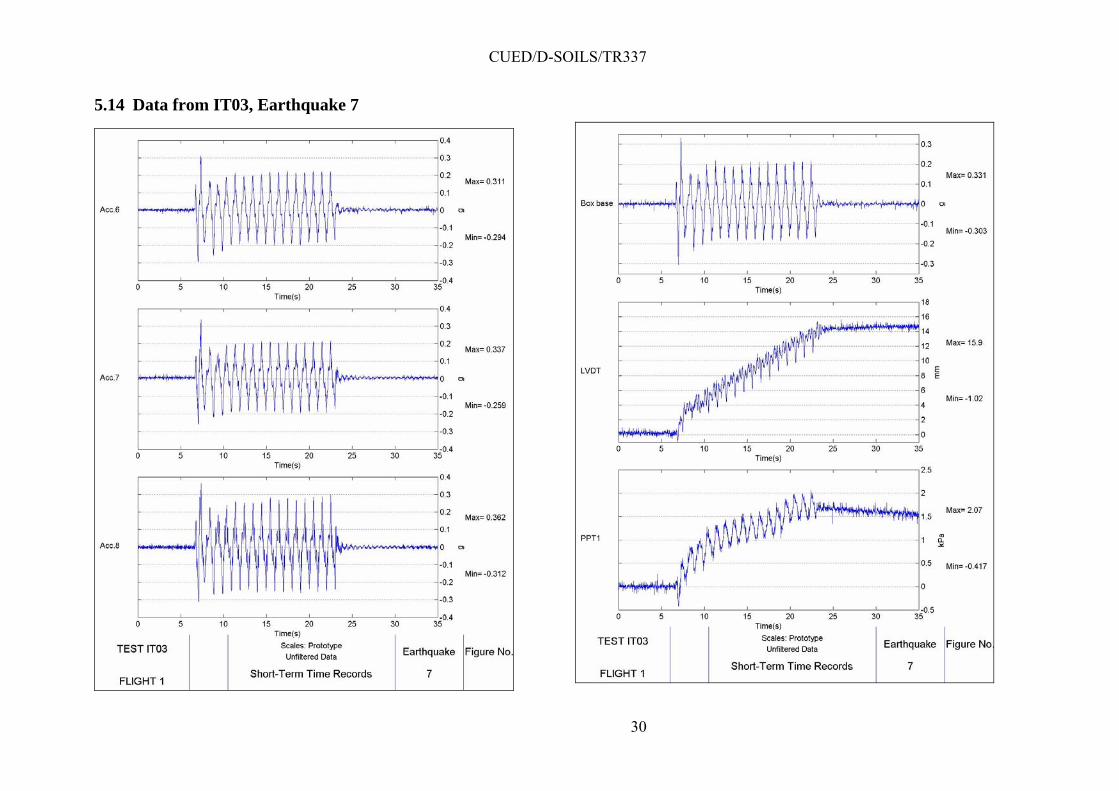
Table 2 Simulated earthquake loadings in test IT03, prototype scale [model scale].
Model Earthquake Number
Driving frequency (Hz) Duration (s) Maximum base
acceleration-Acc.1(g)
E.1 0.6 [30] 15 [0.3] 0.098 [ 4.9]
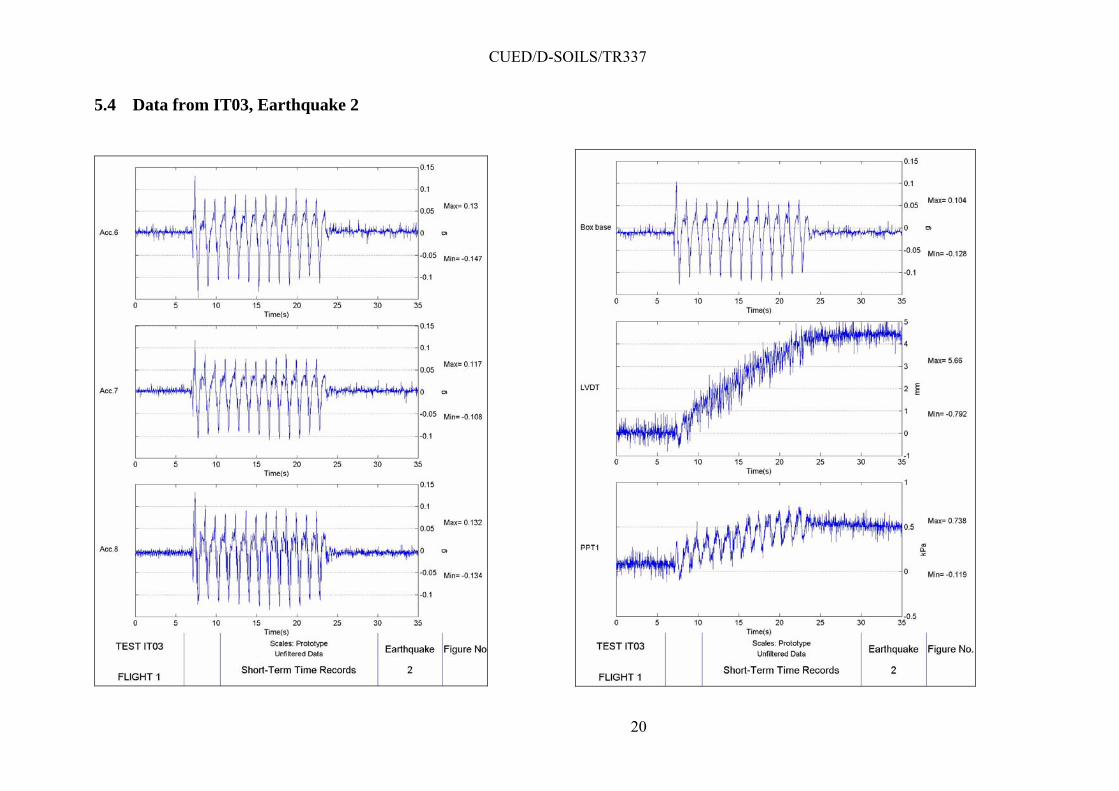
E.2 0.8 [40] 15 [0.3] 0.124 [6.2]
E.3 1 [50] 15 [0.3] 0.176 [8.8]
E.4 1 [50] 15 [0.3] 0.158 [7.9]
E.5 1 [50] 15 [0.3] 0.284 [14.2]
E.6 1 [50] 15 [0.3] 0.331 [16.5]
E.7 1 [50] 15 [0.3] 0.334 [16.7]
CUED/D-SOILS/TR337
9
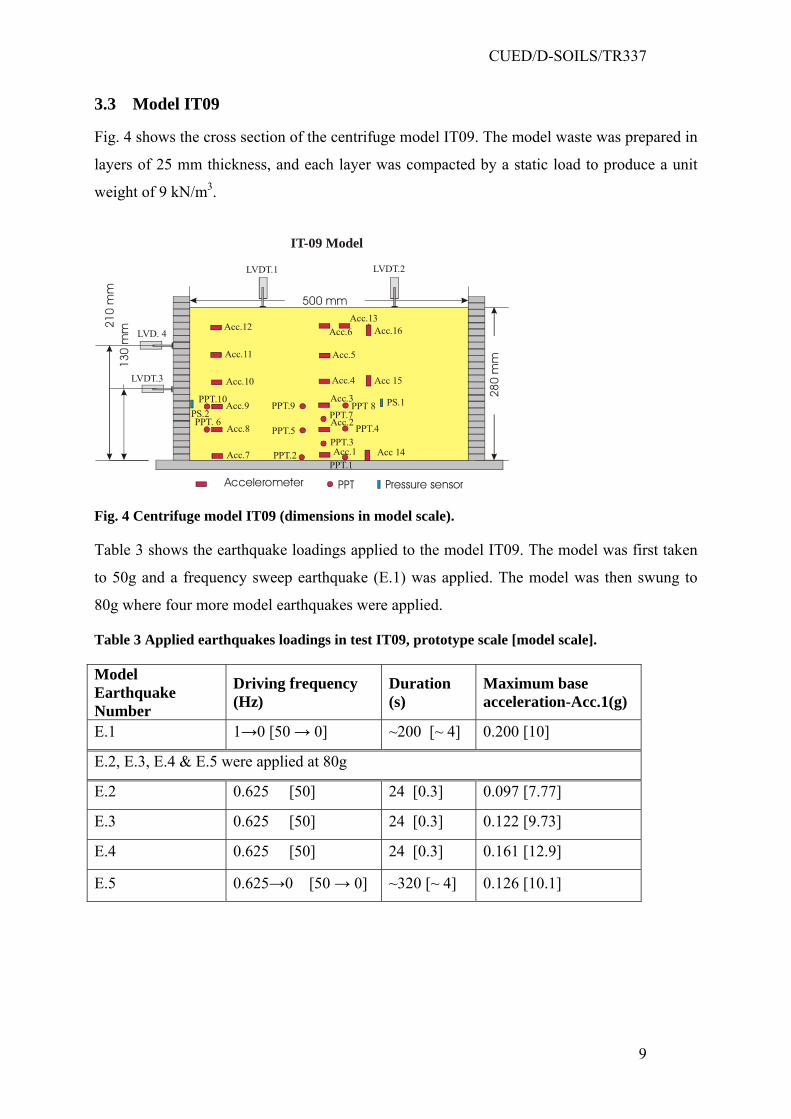
3.3 Model IT09
Fig. 4 shows the cross section of the centrifuge model IT09. The model waste was prepared in
layers of 25 mm thickness, and each layer was compacted by a static load to produce a unit
weight of 9 kN/m3.
500 mm
Acc.1
Acc.2
Acc.3
Acc.4
Acc.5
Acc.6Acc.13
Acc 14
Acc 15
Acc.16
Acc.7
Acc.8
Acc.9
Acc.10
Acc.11
Acc.12
PPT.1
PPT.3PPT.2
PPT.5 PPT.4
PPT 8PPT.7
PPT.9
PPT. 6
PPT.10
LVDT.1 LVDT.2
LVDT.3
LVD. 4
PS.1PS.2
280
mm
.210
mm
130
mm
Accelerometer PPT Pressure sensor
IT-09 Model
Fig. 4 Centrifuge model IT09 (dimensions in model scale).
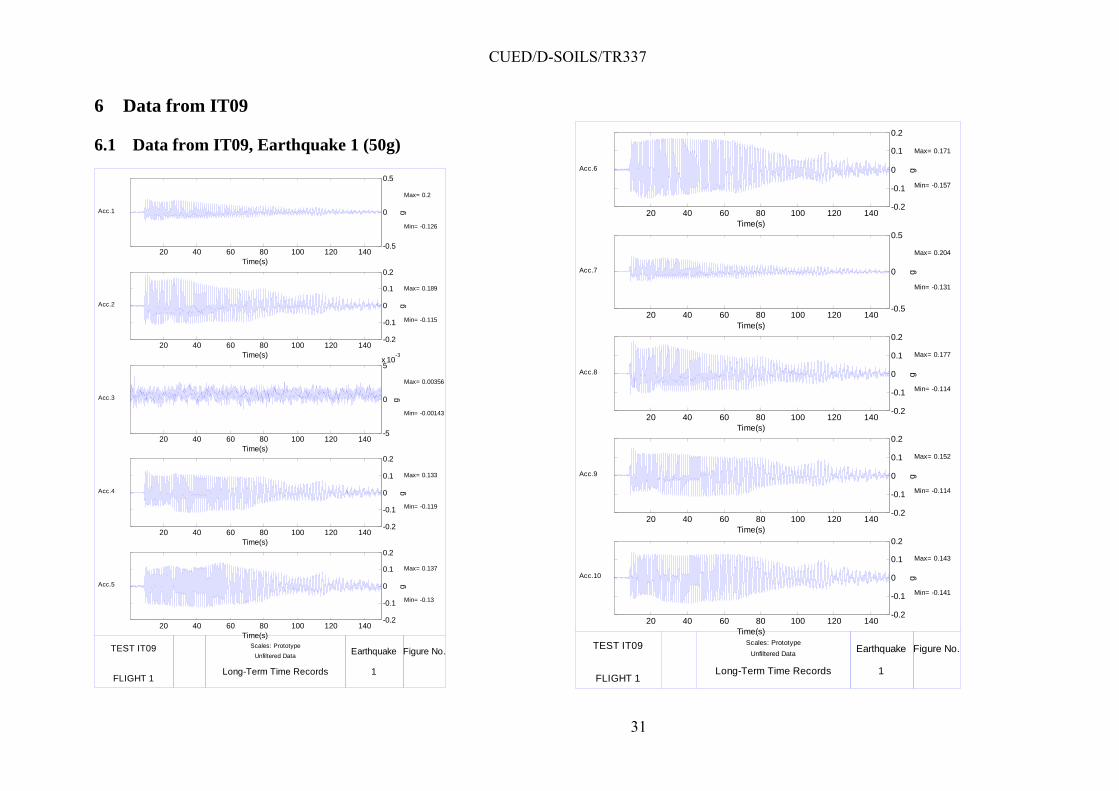
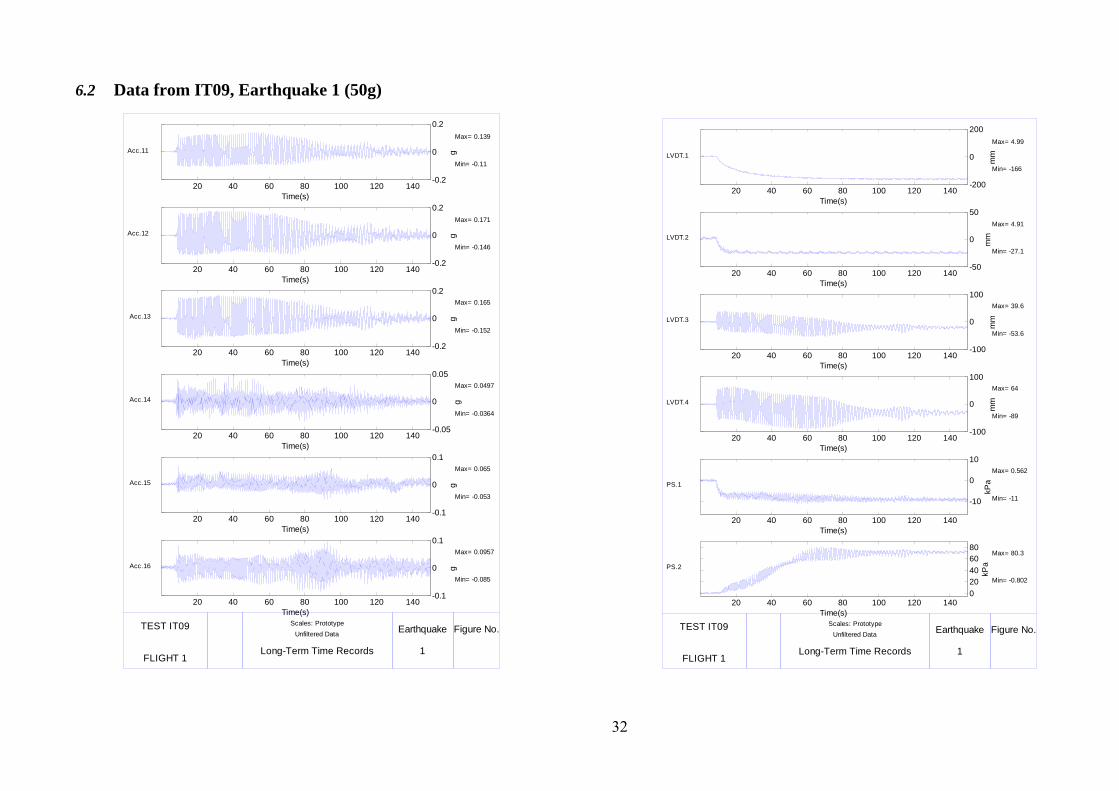
Table 3 shows the earthquake loadings applied to the model IT09. The model was first taken
to 50g and a frequency sweep earthquake (E.1) was applied. The model was then swung to
80g where four more model earthquakes were applied.
Table 3 Applied earthquakes loadings in test IT09, prototype scale [model scale].
Model Earthquake Number
Driving frequency (Hz)
Duration (s)
Maximum base acceleration-Acc.1(g)
E.1 1→0 [50 → 0] ~200 [~ 4] 0.200 [10]
E.2, E.3, E.4 & E.5 were applied at 80g
E.2 0.625 [50] 24 [0.3] 0.097 [7.77]
E.3 0.625 [50] 24 [0.3] 0.122 [9.73]
E.4 0.625 [50] 24 [0.3] 0.161 [12.9]
E.5 0.625→0 [50 → 0] ~320 [~ 4] 0.126 [10.1]

10
4 Results
4.1 Data from IT02, Earthquake 1.
CUED/D-SOILS/TR337
11
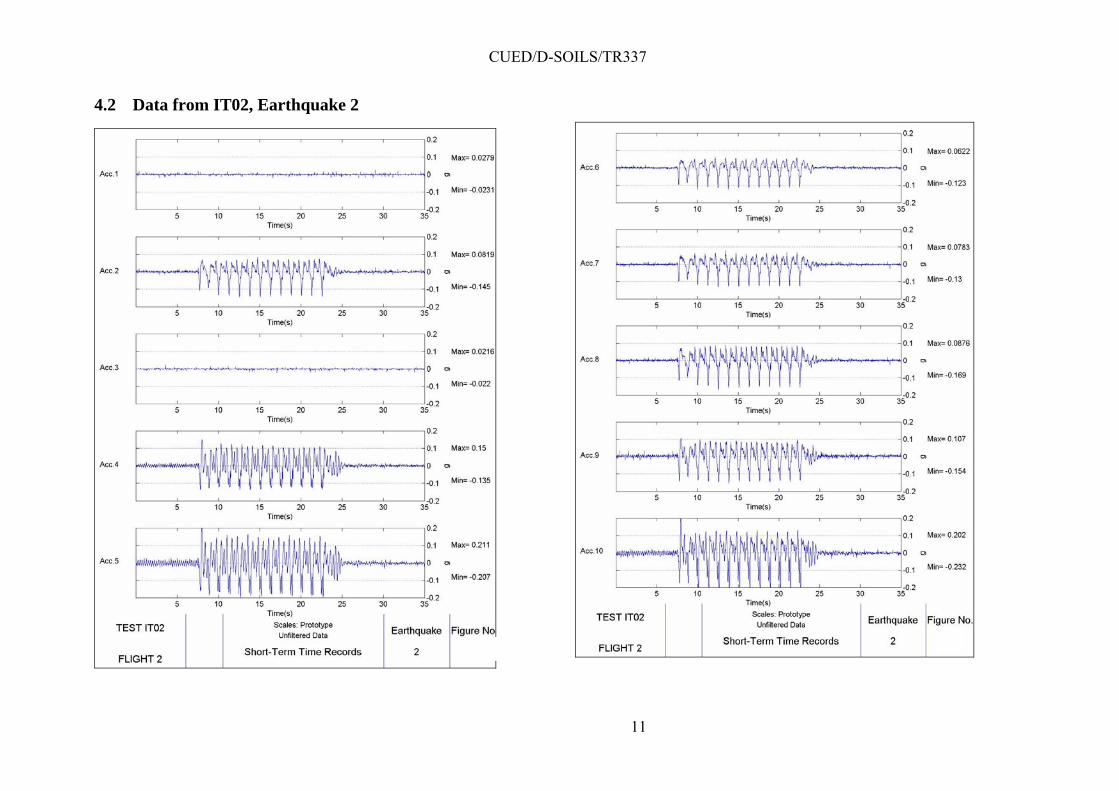
4.2 Data from IT02, Earthquake 2
CUED/D-SOILS/TR337
12
4.3 Data from IT02, Earthquake 3
CUED/D-SOILS/TR337
13
4.4 Data from IT02, Earthquake 4
CUED/D-SOILS/TR337
14
4.5 Data from IT02, Earthquake 5
1
CUED/D-SOILS/TR337
15
4.6 Data from IT02, Earthquake 6
11
CUED/D-SOILS/TR337
16
4.7 Data from IT02, Earthquake 7
1 1
CUED/D-SOILS/TR337
17
5 Data from Test IT03.
5.1 Data from IT03, Earthquake 1
CUED/D-SOILS/TR337
18
5.2 Data from IT03, Earthquake 1

CUED/D-SOILS/TR337
19
5.3 Data from IT03, Earthquake 2
CUED/D-SOILS/TR337
20
5.4 Data from IT03, Earthquake 2
CUED/D-SOILS/TR337
21
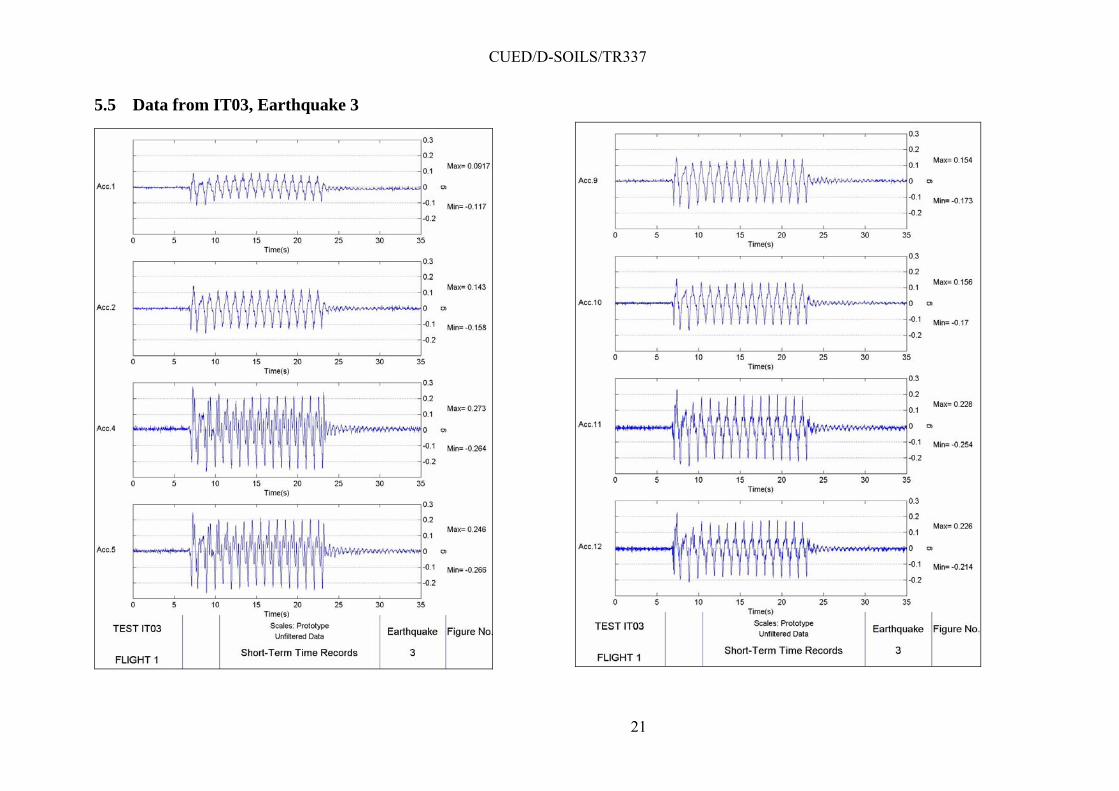
5.5 Data from IT03, Earthquake 3
CUED/D-SOILS/TR337
22
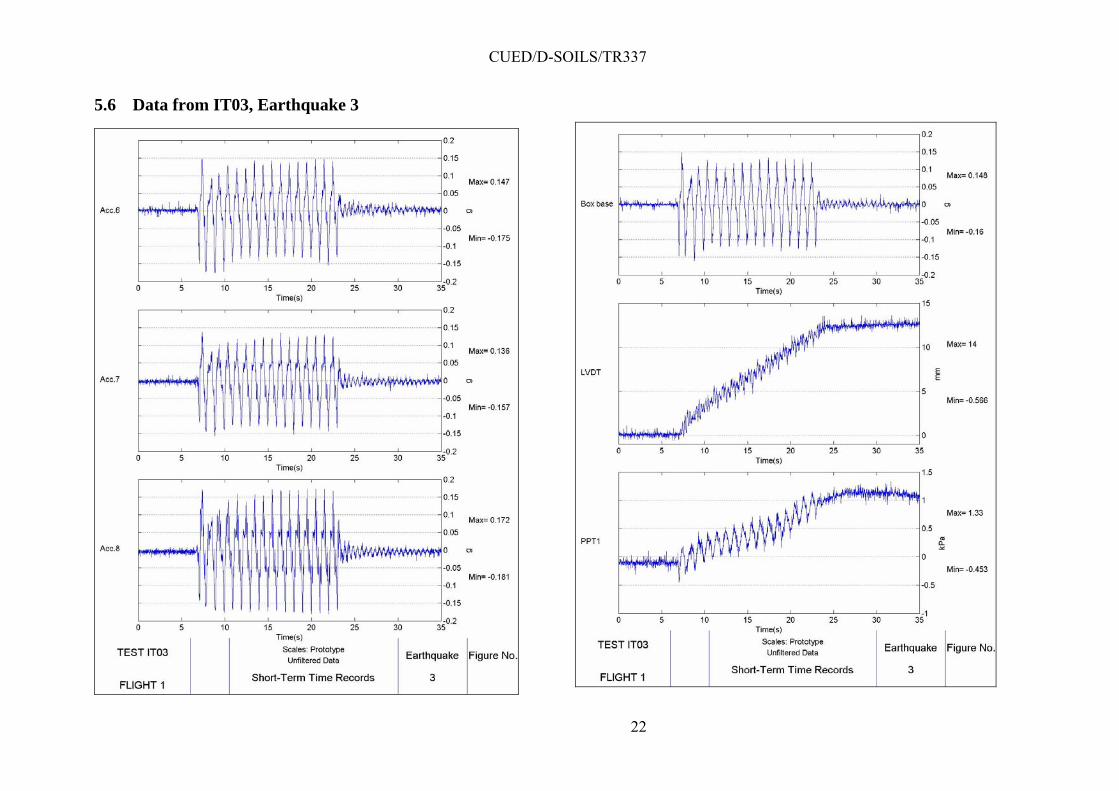
5.6 Data from IT03, Earthquake 3
CUED/D-SOILS/TR337
23
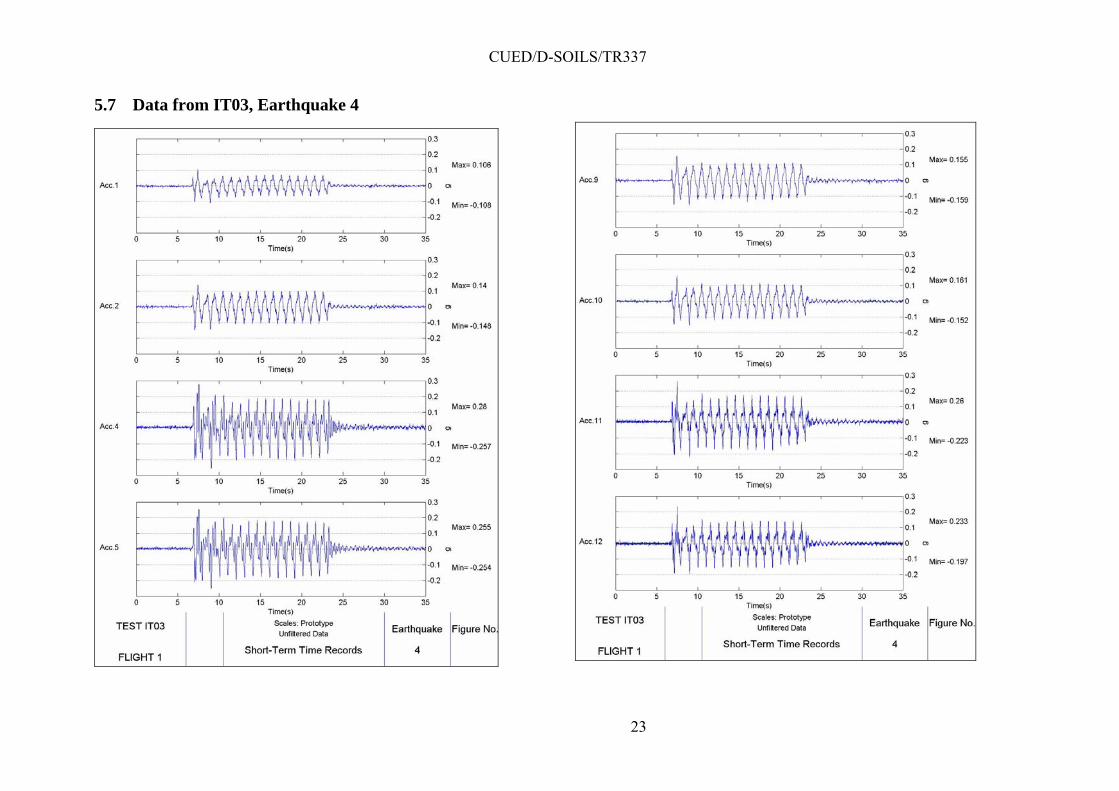
5.7 Data from IT03, Earthquake 4

CUED/D-SOILS/TR337
24
5.8 Data from IT03, Earthquake 4

CUED/D-SOILS/TR337
25
5.9 Data from IT03, Earthquake 5
CUED/D-SOILS/TR337
26
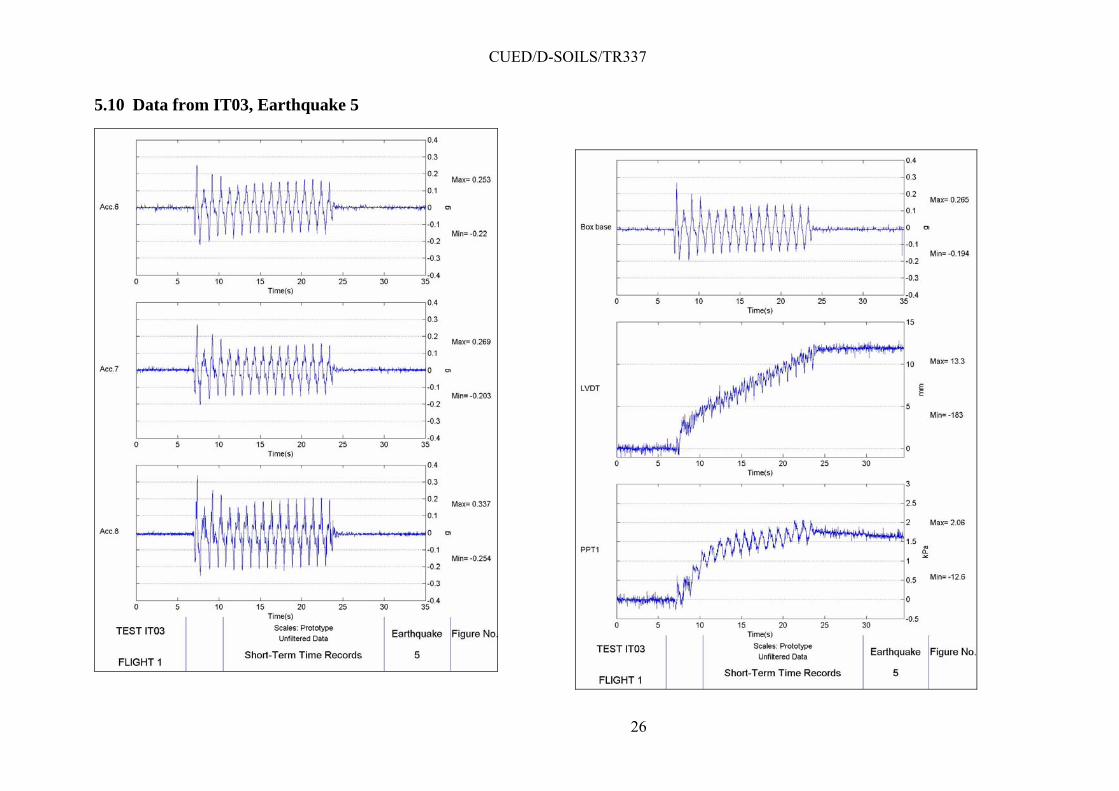
5.10 Data from IT03, Earthquake 5
CUED/D-SOILS/TR337
27
5.11 Data from IT03, Earthquake 6

CUED/D-SOILS/TR337
28
5.12 Data from IT03, Earthquake 6

CUED/D-SOILS/TR337
29
5.13 Data from IT03, Earthquake 7
CUED/D-SOILS/TR337
30
5.14 Data from IT03, Earthquake 7
CUED/D-SOILS/TR337
31
6 Data from IT09
6.1 Data from IT09, Earthquake 1 (50g)
Acc.1
Acc.2
Acc.3
Acc.4
Acc.5
Max= 0.2
Min= -0.126
Max= 0.189
Min= -0.115
Max= 0.00356
Min= -0.00143
Max= 0.133
Min= -0.119
Max= 0.137
Min= -0.13
20 40 60 80 100 120 140-0.5
0
0.5
g
Time(s)
20 40 60 80 100 120 140-0.2
-0.1
0
0.1
0.2
g
Time(s)
20 40 60 80 100 120 140-5
0
5x 10
-3
g
Time(s)
20 40 60 80 100 120 140-0.2
-0.1
0
0.1
0.2
g
Time(s)
20 40 60 80 100 120 140-0.2
-0.1
0
0.1
0.2
g
Time(s)
TEST IT09
FLIGHT 1
Scales: Prototype
Long-Term Time Records
Unfiltered Data Earthquake
1
Figure No.
Acc.6
Acc.7
Acc.8
Acc.9
Acc.10
Max= 0.171
Min= -0.157
Max= 0.204
Min= -0.131
Max= 0.177
Min= -0.114
Max= 0.152
Min= -0.114
Max= 0.143
Min= -0.141
20 40 60 80 100 120 140-0.2
-0.1
0
0.1
0.2
g
Time(s)
20 40 60 80 100 120 140-0.5
0
0.5
g
Time(s)
20 40 60 80 100 120 140-0.2
-0.1
0
0.1
0.2
g
Time(s)
20 40 60 80 100 120 140-0.2
-0.1
0
0.1
0.2
g
Time(s)
20 40 60 80 100 120 140-0.2
-0.1
0
0.1
0.2
g
Time(s)
TEST IT09
FLIGHT 1
Scales: Prototype
Long-Term Time Records
Unfiltered Data Earthquake
1
Figure No.
32
6.2 Data from IT09, Earthquake 1 (50g)
Acc.11
Acc.12
Acc.13
Acc.14
Acc.15
Acc.16
Max= 0.139
Min= -0.11
Max= 0.171
Min= -0.146
Max= 0.165
Min= -0.152
Max= 0.0497
Min= -0.0364
Max= 0.065
Min= -0.053
Max= 0.0957
Min= -0.085
20 40 60 80 100 120 140-0.2
0
0.2
g
Time(s)
20 40 60 80 100 120 140-0.2
0
0.2
g
Time(s)
20 40 60 80 100 120 140-0.2
0
0.2
g
Time(s)
20 40 60 80 100 120 140-0.05
0
0.05
gTime(s)
20 40 60 80 100 120 140-0.1
0
0.1g
Time(s)
20 40 60 80 100 120 140-0.1
0
0.1
g
Time(s)
TEST IT09
FLIGHT 1
Scales: Prototype
Long-Term Time Records
Unfiltered Data Earthquake
1
Figure No.
LVDT.1
LVDT.2
LVDT.3
LVDT.4
PS.1
PS.2
Max= 4.99
Min= -166
Max= 4.91
Min= -27.1
Max= 39.6
Min= -53.6
Max= 64
Min= -89
Max= 0.562
Min= -11
Max= 80.3
Min= -0.802
20 40 60 80 100 120 140-200
0
200
mm
Time(s)
20 40 60 80 100 120 140-50
0
50
mm
Time(s)
20 40 60 80 100 120 140-100
0
100
mm
Time(s)
20 40 60 80 100 120 140-100
0
100
mm
Time(s)
20 40 60 80 100 120 140
-10
0
10
kPa
Time(s)
20 40 60 80 100 120 140020406080
kPa
Time(s)
TEST IT09
FLIGHT 1
Scales: Prototype
Long-Term Time Records
Unfiltered Data Earthquake
1
Figure No.
CUED/D-SOILS/TR337
33
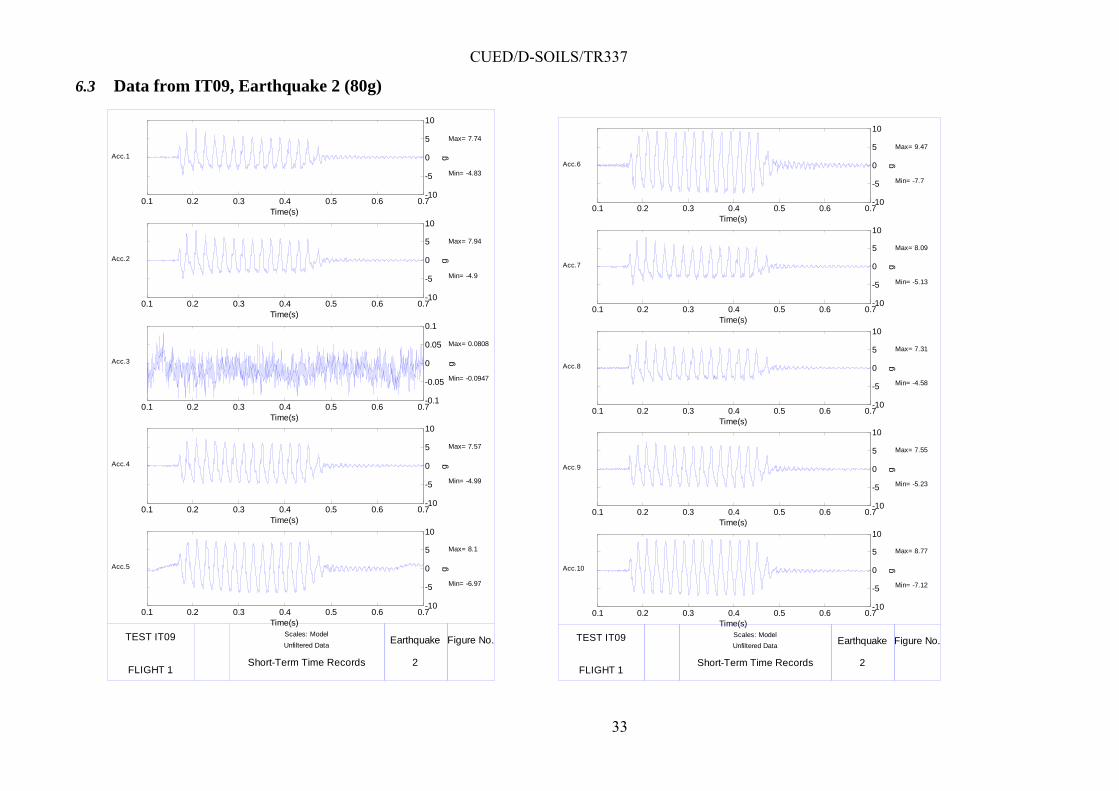
6.3 Data from IT09, Earthquake 2 (80g)
Acc.1
Acc.2
Acc.3
Acc.4
Acc.5
Max= 7.74
Min= -4.83
Max= 7.94
Min= -4.9
Max= 0.0808
Min= -0.0947
Max= 7.57
Min= -4.99
Max= 8.1
Min= -6.97
0.1 0.2 0.3 0.4 0.5 0.6 0.7-10
-5
0
5
10
g
Time(s)
0.1 0.2 0.3 0.4 0.5 0.6 0.7-10
-5
0
5
10
g
Time(s)
0.1 0.2 0.3 0.4 0.5 0.6 0.7-0.1
-0.05
0
0.05
0.1
g
Time(s)
0.1 0.2 0.3 0.4 0.5 0.6 0.7-10
-5
0
5
10
g
Time(s)
0.1 0.2 0.3 0.4 0.5 0.6 0.7-10
-5
0
5
10
g
Time(s)
TEST IT09
FLIGHT 1
Scales: Model
Short-Term Time Records
Unfiltered Data Earthquake
2
Figure No.
Acc.6
Acc.7
Acc.8
Acc.9
Acc.10
Max= 9.47
Min= -7.7
Max= 8.09
Min= -5.13
Max= 7.31
Min= -4.58
Max= 7.55
Min= -5.23
Max= 8.77
Min= -7.12
0.1 0.2 0.3 0.4 0.5 0.6 0.7-10
-5
0
5
10
g
Time(s)
0.1 0.2 0.3 0.4 0.5 0.6 0.7-10
-5
0
5
10
g
Time(s)
0.1 0.2 0.3 0.4 0.5 0.6 0.7-10
-5
0
5
10
g
Time(s)
0.1 0.2 0.3 0.4 0.5 0.6 0.7-10
-5
0
5
10
g
Time(s)
0.1 0.2 0.3 0.4 0.5 0.6 0.7-10
-5
0
5
10
g
Time(s)
TEST IT09
FLIGHT 1
Scales: Model
Short-Term Time Records
Unfiltered Data Earthquake
2
Figure No.
CUED/D-SOILS/TR337
34
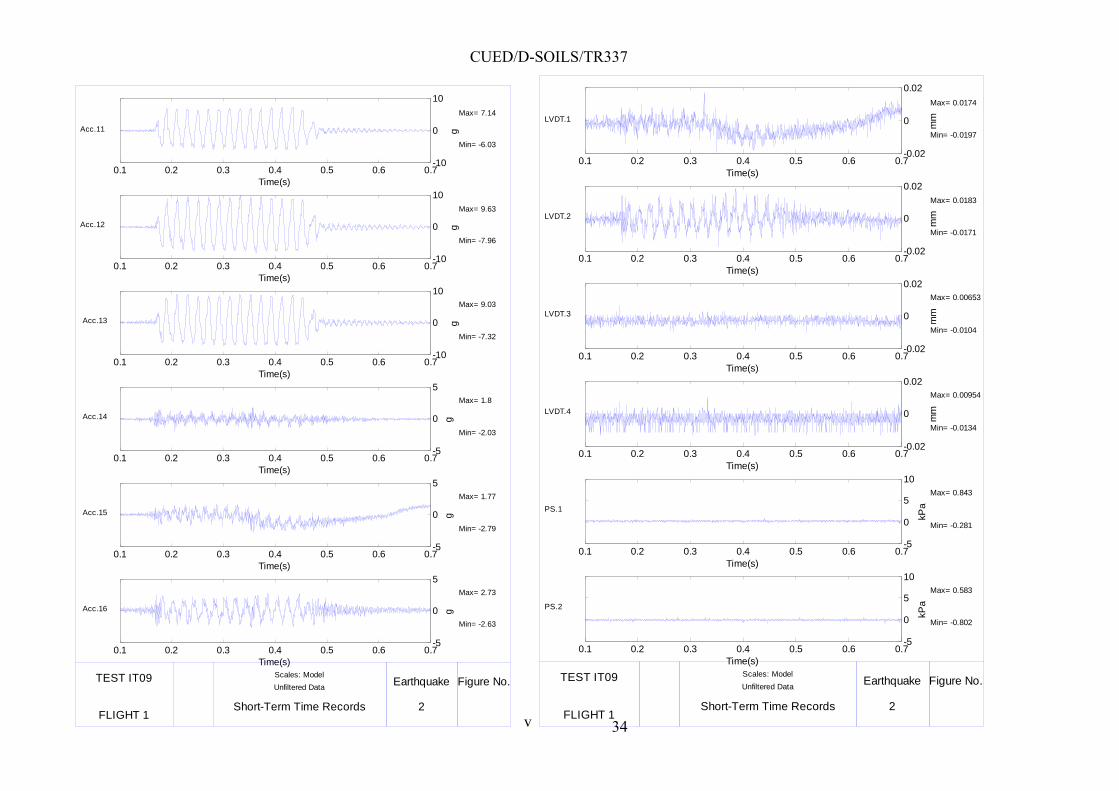
Acc.11
Acc.12
Acc.13
Acc.14
Acc.15
Acc.16
Max= 7.14
Min= -6.03
Max= 9.63
Min= -7.96
Max= 9.03
Min= -7.32
Max= 1.8
Min= -2.03
Max= 1.77
Min= -2.79
Max= 2.73
Min= -2.63
0.1 0.2 0.3 0.4 0.5 0.6 0.7-10
0
10
g
Time(s)
0.1 0.2 0.3 0.4 0.5 0.6 0.7-10
0
10
g
Time(s)
0.1 0.2 0.3 0.4 0.5 0.6 0.7-10
0
10
g
Time(s)
0.1 0.2 0.3 0.4 0.5 0.6 0.7-5
0
5
g
Time(s)
0.1 0.2 0.3 0.4 0.5 0.6 0.7-5
0
5
g
Time(s)
0.1 0.2 0.3 0.4 0.5 0.6 0.7-5
0
5
g
Time(s)
TEST IT09
FLIGHT 1
Scales: Model
Short-Term Time Records
Unfiltered Data Earthquake
2
Figure No.
v
LVDT.1
LVDT.2
LVDT.3
LVDT.4
PS.1
PS.2
Max= 0.0174
Min= -0.0197
Max= 0.0183
Min= -0.0171
Max= 0.00653
Min= -0.0104
Max= 0.00954
Min= -0.0134
Max= 0.843
Min= -0.281
Max= 0.583
Min= -0.802
0.1 0.2 0.3 0.4 0.5 0.6 0.7-0.02
0
0.02
mm
Time(s)
0.1 0.2 0.3 0.4 0.5 0.6 0.7-0.02
0
0.02
mm
Time(s)
0.1 0.2 0.3 0.4 0.5 0.6 0.7-0.02
0
0.02
mm
Time(s)
0.1 0.2 0.3 0.4 0.5 0.6 0.7-0.02
0
0.02
mm
Time(s)
0.1 0.2 0.3 0.4 0.5 0.6 0.7-5
0
5
10
kPa
Time(s)
0.1 0.2 0.3 0.4 0.5 0.6 0.7-5
0
5
10
kPa
Time(s)
TEST IT09
FLIGHT 1
Scales: Model
Short-Term Time Records
Unfiltered Data Earthquake
2
Figure No.
CUED/D-SOILS/TR337
35
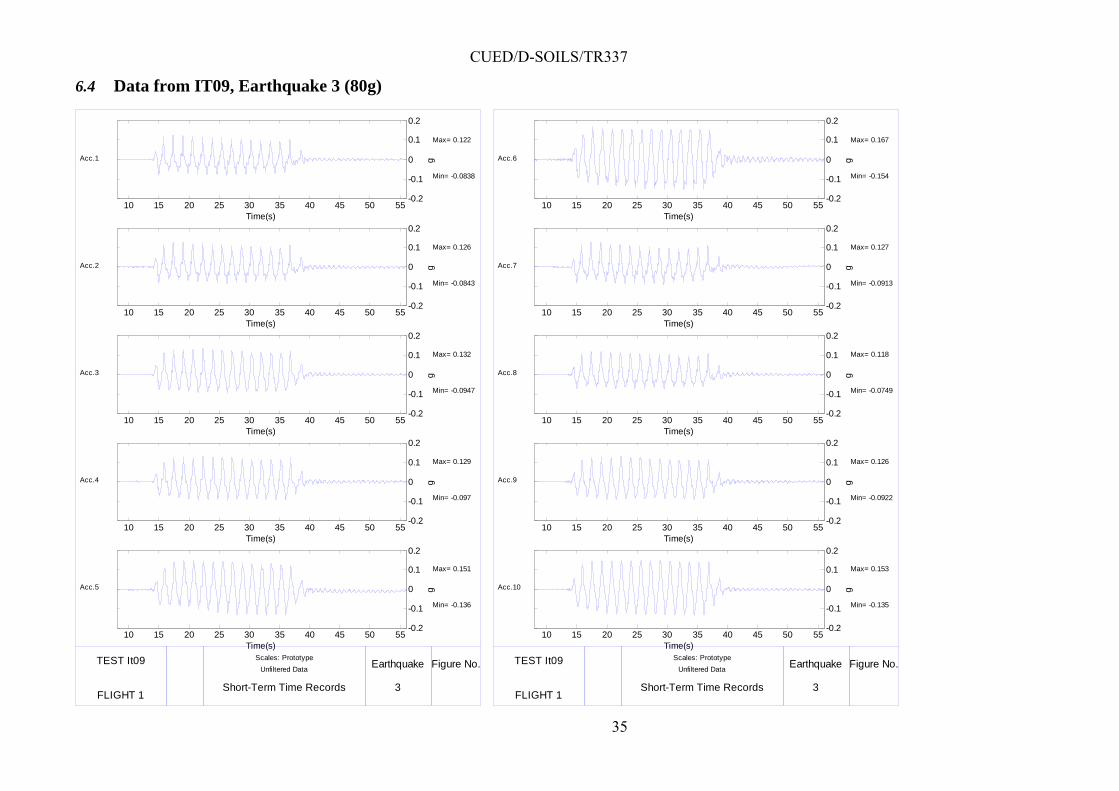
6.4 Data from IT09, Earthquake 3 (80g)
Acc.1
Acc.2
Acc.3
Acc.4
Acc.5
Max= 0.122
Min= -0.0838
Max= 0.126
Min= -0.0843
Max= 0.132
Min= -0.0947
Max= 0.129
Min= -0.097
Max= 0.151
Min= -0.136
10 15 20 25 30 35 40 45 50 55-0.2
-0.1
0
0.1
0.2
g
Time(s)
10 15 20 25 30 35 40 45 50 55-0.2
-0.1
0
0.1
0.2
g
Time(s)
10 15 20 25 30 35 40 45 50 55-0.2
-0.1
0
0.1
0.2
gTime(s)
10 15 20 25 30 35 40 45 50 55-0.2
-0.1
0
0.1
0.2g
Time(s)
10 15 20 25 30 35 40 45 50 55-0.2
-0.1
0
0.1
0.2
g
Time(s)
TEST It09
FLIGHT 1
Scales: Prototype
Short-Term Time Records
Unfiltered Data Earthquake
3
Figure No.
Acc.6
Acc.7
Acc.8
Acc.9
Acc.10
Max= 0.167
Min= -0.154
Max= 0.127
Min= -0.0913
Max= 0.118
Min= -0.0749
Max= 0.126
Min= -0.0922
Max= 0.153
Min= -0.135
10 15 20 25 30 35 40 45 50 55-0.2
-0.1
0
0.1
0.2
g
Time(s)
10 15 20 25 30 35 40 45 50 55-0.2
-0.1
0
0.1
0.2
g
Time(s)
10 15 20 25 30 35 40 45 50 55-0.2
-0.1
0
0.1
0.2
g
Time(s)
10 15 20 25 30 35 40 45 50 55-0.2
-0.1
0
0.1
0.2
g
Time(s)
10 15 20 25 30 35 40 45 50 55-0.2
-0.1
0
0.1
0.2
g
Time(s)
TEST It09
FLIGHT 1
Scales: Prototype
Short-Term Time Records
Unfiltered Data Earthquake
3
Figure No.
CUED/D-SOILS/TR337
36
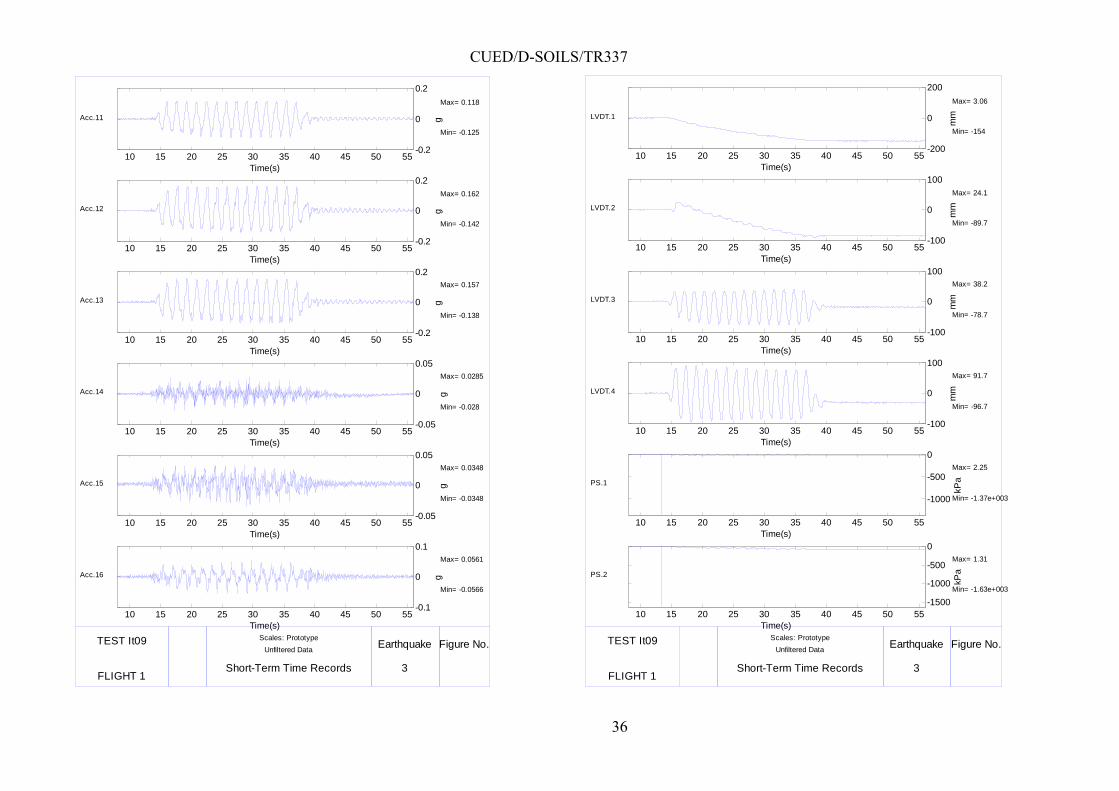
Acc.11
Acc.12
Acc.13
Acc.14
Acc.15
Acc.16
Max= 0.118
Min= -0.125
Max= 0.162
Min= -0.142
Max= 0.157
Min= -0.138
Max= 0.0285
Min= -0.028
Max= 0.0348
Min= -0.0348
Max= 0.0561
Min= -0.0566
10 15 20 25 30 35 40 45 50 55-0.2
0
0.2
g
Time(s)
10 15 20 25 30 35 40 45 50 55-0.2
0
0.2
g
Time(s)
10 15 20 25 30 35 40 45 50 55-0.2
0
0.2
g
Time(s)
10 15 20 25 30 35 40 45 50 55-0.05
0
0.05
gTime(s)
10 15 20 25 30 35 40 45 50 55-0.05
0
0.05g
Time(s)
10 15 20 25 30 35 40 45 50 55-0.1
0
0.1
g
Time(s)
TEST It09
FLIGHT 1
Scales: Prototype
Short-Term Time Records
Unfiltered Data Earthquake
3
Figure No.
LVDT.1
LVDT.2
LVDT.3
LVDT.4
PS.1
PS.2
Max= 3.06
Min= -154
Max= 24.1
Min= -89.7
Max= 38.2
Min= -78.7
Max= 91.7
Min= -96.7
Max= 2.25
Min= -1.37e+003
Max= 1.31
Min= -1.63e+003
10 15 20 25 30 35 40 45 50 55-200
0
200
mm
Time(s)
10 15 20 25 30 35 40 45 50 55-100
0
100
mm
Time(s)
10 15 20 25 30 35 40 45 50 55-100
0
100
mm
Time(s)
10 15 20 25 30 35 40 45 50 55-100
0
100
mm
Time(s)
10 15 20 25 30 35 40 45 50 55
-1000
-500
0
kPa
Time(s)
10 15 20 25 30 35 40 45 50 55-1500
-1000
-500
0
kPa
Time(s)
TEST It09
FLIGHT 1
Scales: Prototype
Short-Term Time Records
Unfiltered Data Earthquake
3
Figure No.
CUED/D-SOILS/TR337
37
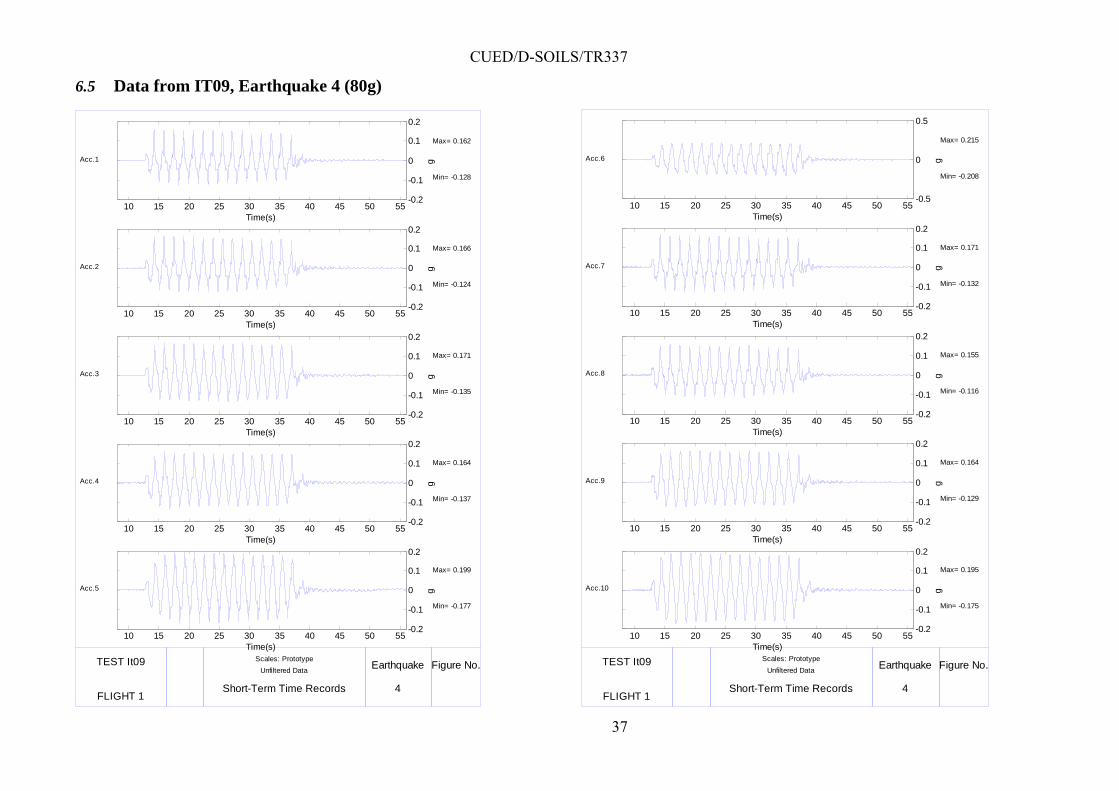
6.5 Data from IT09, Earthquake 4 (80g)
Acc.1
Acc.2
Acc.3
Acc.4
Acc.5
Max= 0.162
Min= -0.128
Max= 0.166
Min= -0.124
Max= 0.171
Min= -0.135
Max= 0.164
Min= -0.137
Max= 0.199
Min= -0.177
10 15 20 25 30 35 40 45 50 55-0.2
-0.1
0
0.1
0.2
g
Time(s)
10 15 20 25 30 35 40 45 50 55-0.2
-0.1
0
0.1
0.2
g
Time(s)
10 15 20 25 30 35 40 45 50 55-0.2
-0.1
0
0.1
0.2
gTime(s)
10 15 20 25 30 35 40 45 50 55-0.2
-0.1
0
0.1
0.2g
Time(s)
10 15 20 25 30 35 40 45 50 55-0.2
-0.1
0
0.1
0.2
g
Time(s)
TEST It09
FLIGHT 1
Scales: Prototype
Short-Term Time Records
Unfiltered Data Earthquake
4
Figure No.
Acc.6
Acc.7
Acc.8
Acc.9
Acc.10
Max= 0.215
Min= -0.208
Max= 0.171
Min= -0.132
Max= 0.155
Min= -0.116
Max= 0.164
Min= -0.129
Max= 0.195
Min= -0.175
10 15 20 25 30 35 40 45 50 55-0.5
0
0.5
g
Time(s)
10 15 20 25 30 35 40 45 50 55-0.2
-0.1
0
0.1
0.2
g
Time(s)
10 15 20 25 30 35 40 45 50 55-0.2
-0.1
0
0.1
0.2
g
Time(s)
10 15 20 25 30 35 40 45 50 55-0.2
-0.1
0
0.1
0.2
g
Time(s)
10 15 20 25 30 35 40 45 50 55-0.2
-0.1
0
0.1
0.2
g
Time(s)
TEST It09
FLIGHT 1
Scales: Prototype
Short-Term Time Records
Unfiltered Data Earthquake
4
Figure No.
CUED/D-SOILS/TR337
38
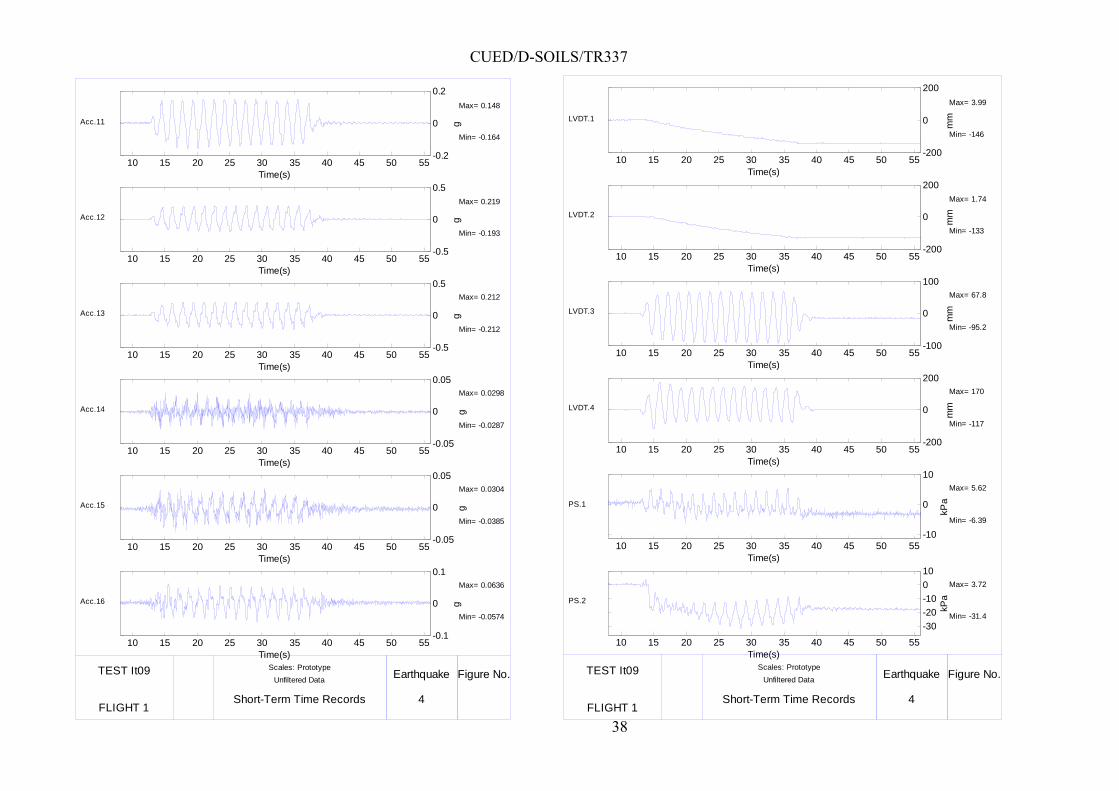
Acc.11
Acc.12
Acc.13
Acc.14
Acc.15
Acc.16
Max= 0.148
Min= -0.164
Max= 0.219
Min= -0.193
Max= 0.212
Min= -0.212
Max= 0.0298
Min= -0.0287
Max= 0.0304
Min= -0.0385
Max= 0.0636
Min= -0.0574
10 15 20 25 30 35 40 45 50 55-0.2
0
0.2
g
Time(s)
10 15 20 25 30 35 40 45 50 55-0.5
0
0.5
g
Time(s)
10 15 20 25 30 35 40 45 50 55-0.5
0
0.5
g
Time(s)
10 15 20 25 30 35 40 45 50 55-0.05
0
0.05
gTime(s)
10 15 20 25 30 35 40 45 50 55-0.05
0
0.05g
Time(s)
10 15 20 25 30 35 40 45 50 55-0.1
0
0.1
g
Time(s)
TEST It09
FLIGHT 1
Scales: Prototype
Short-Term Time Records
Unfiltered Data Earthquake
4
Figure No.
LVDT.1
LVDT.2
LVDT.3
LVDT.4
PS.1
PS.2
Max= 3.99
Min= -146
Max= 1.74
Min= -133
Max= 67.8
Min= -95.2
Max= 170
Min= -117
Max= 5.62
Min= -6.39
Max= 3.72
Min= -31.4
10 15 20 25 30 35 40 45 50 55-200
0
200
mm
Time(s)
10 15 20 25 30 35 40 45 50 55-200
0
200
mm
Time(s)
10 15 20 25 30 35 40 45 50 55-100
0
100
mm
Time(s)
10 15 20 25 30 35 40 45 50 55-200
0
200
mm
Time(s)
10 15 20 25 30 35 40 45 50 55-10
0
10
kPa
Time(s)
10 15 20 25 30 35 40 45 50 55
-30-20-10010
kPa
Time(s)
TEST It09
FLIGHT 1
Scales: Prototype
Short-Term Time Records
Unfiltered Data Earthquake
4
Figure No.
CUED/D-SOILS/TR337
39
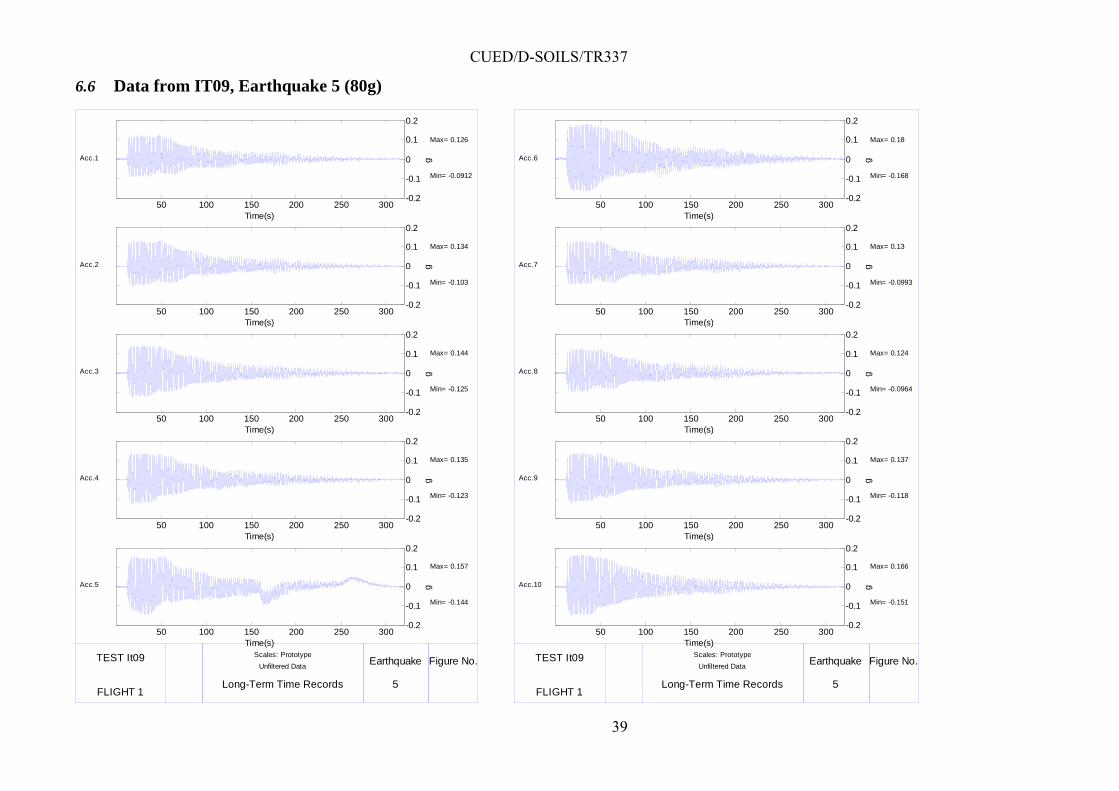
6.6 Data from IT09, Earthquake 5 (80g)
Acc.1
Acc.2
Acc.3
Acc.4
Acc.5
Max= 0.126
Min= -0.0912
Max= 0.134
Min= -0.103
Max= 0.144
Min= -0.125
Max= 0.135
Min= -0.123
Max= 0.157
Min= -0.144
50 100 150 200 250 300-0.2
-0.1
0
0.1
0.2
g
Time(s)
50 100 150 200 250 300-0.2
-0.1
0
0.1
0.2
g
Time(s)
50 100 150 200 250 300-0.2
-0.1
0
0.1
0.2
gTime(s)
50 100 150 200 250 300-0.2
-0.1
0
0.1
0.2g
Time(s)
50 100 150 200 250 300-0.2
-0.1
0
0.1
0.2
g
Time(s)
TEST It09
FLIGHT 1
Scales: Prototype
Long-Term Time Records
Unfiltered Data Earthquake
5
Figure No.
Acc.6
Acc.7
Acc.8
Acc.9
Acc.10
Max= 0.18
Min= -0.168
Max= 0.13
Min= -0.0993
Max= 0.124
Min= -0.0964
Max= 0.137
Min= -0.118
Max= 0.166
Min= -0.151
50 100 150 200 250 300-0.2
-0.1
0
0.1
0.2
g
Time(s)
50 100 150 200 250 300-0.2
-0.1
0
0.1
0.2
g
Time(s)
50 100 150 200 250 300-0.2
-0.1
0
0.1
0.2
g
Time(s)
50 100 150 200 250 300-0.2
-0.1
0
0.1
0.2
g
Time(s)
50 100 150 200 250 300-0.2
-0.1
0
0.1
0.2
g
Time(s)
TEST It09
FLIGHT 1
Scales: Prototype
Long-Term Time Records
Unfiltered Data Earthquake
5
Figure No.

CUED/D-SOILS/TR337
40
Acc.11
Acc.12
Acc.13
Acc.14
Acc.15
Acc.16
Max= 0.135
Min= -0.116
Max= 0.183
Min= -0.136
Max= 0.177
Min= -0.17
Max= 0.0303
Min= -0.0352
Max= 0.0355
Min= -0.0414
Max= 0.0518
Min= -0.067
50 100 150 200 250 300-0.2
0
0.2
g
Time(s)
50 100 150 200 250 300-0.2
0
0.2
g
Time(s)
50 100 150 200 250 300-0.2
0
0.2
g
Time(s)
50 100 150 200 250 300-0.05
0
0.05
gTime(s)
50 100 150 200 250 300-0.05
0
0.05g
Time(s)
50 100 150 200 250 300-0.1
0
0.1
g
Time(s)
TEST It09
FLIGHT 1
Scales: Prototype
Long-Term Time Records
Unfiltered Data Earthquake
5
Figure No.
LVDT.1
LVDT.2
LVDT.3
LVDT.4
PS.1
PS.2
Max= 4.45
Min= -52.5
Max= 1.37
Min= -42.1
Max= 43.8
Min= -57.5
Max= 89.7
Min= -109
Max= 9.13
Min= -3.44
Max= 7.44
Min= -11.2
50 100 150 200 250 300-100
0
100
mm
Time(s)
50 100 150 200 250 300-50
0
50
mm
Time(s)
50 100 150 200 250 300-100
0
100
mm
Time(s)
50 100 150 200 250 300-200
0
200
mm
Time(s)
50 100 150 200 250 300-5
0
5
10
kPa
Time(s)
50 100 150 200 250 300
-10
0
10
kPa
Time(s)
TEST It09
FLIGHT 1
Scales: Prototype
Long-Term Time Records
Unfiltered Data Earthquake
5
Figure No.
CUED/D-SOILS/TR337
41
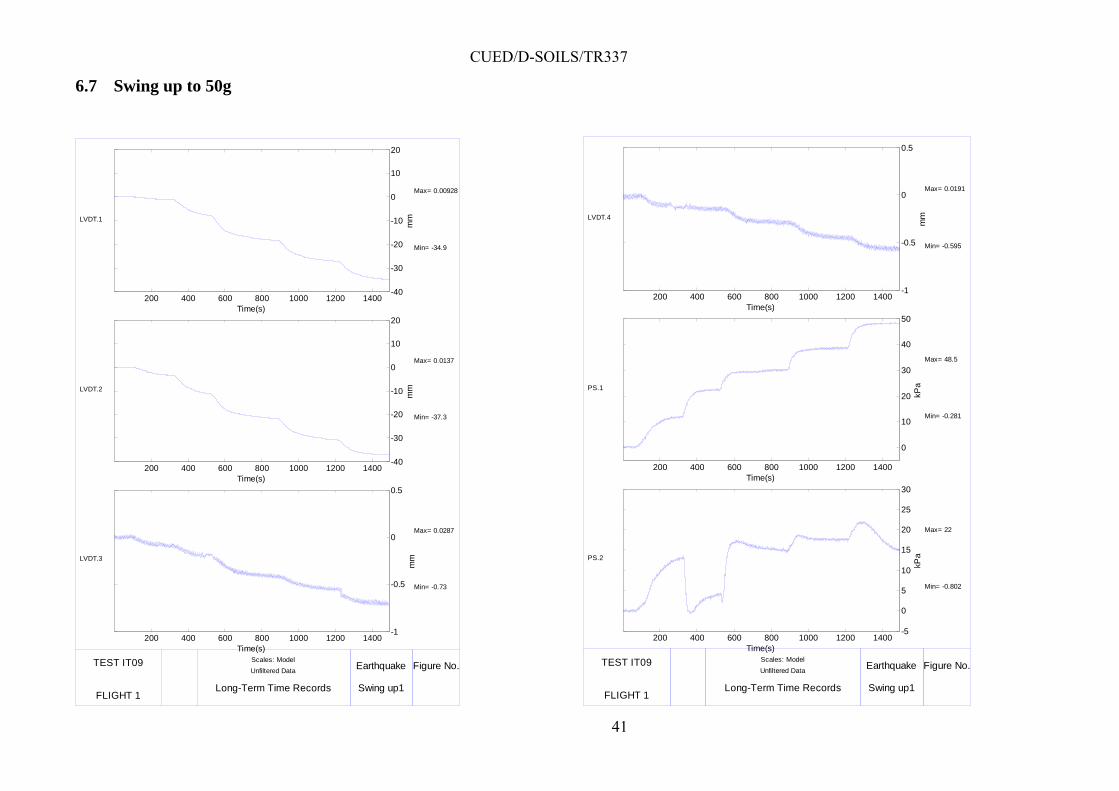
6.7 Swing up to 50g
LVDT.1
LVDT.2
LVDT.3
Max= 0.00928
Min= -34.9
Max= 0.0137
Min= -37.3
Max= 0.0287
Min= -0.73
200 400 600 800 1000 1200 1400-40
-30
-20
-10
0
10
20
mm
Time(s)
200 400 600 800 1000 1200 1400-40
-30
-20
-10
0
10
20
mm
Time(s)
200 400 600 800 1000 1200 1400-1
-0.5
0
0.5
mm
Time(s)
TEST IT09
FLIGHT 1
Scales: Model
Long-Term Time Records
Unfiltered Data Earthquake
Swing up1
Figure No.
LVDT.4
PS.1
PS.2
Max= 0.0191
Min= -0.595
Max= 48.5
Min= -0.281
Max= 22
Min= -0.802
200 400 600 800 1000 1200 1400-1
-0.5
0
0.5
mm
Time(s)
200 400 600 800 1000 1200 1400
0
10
20
30
40
50
kPa
Time(s)
200 400 600 800 1000 1200 1400-5
0
5
10
15
20
25
30
kPa
Time(s)
TEST IT09
FLIGHT 1
Scales: Model
Long-Term Time Records
Unfiltered Data Earthquake
Swing up1
Figure No.
CUED/D-SOILS/TR337
42
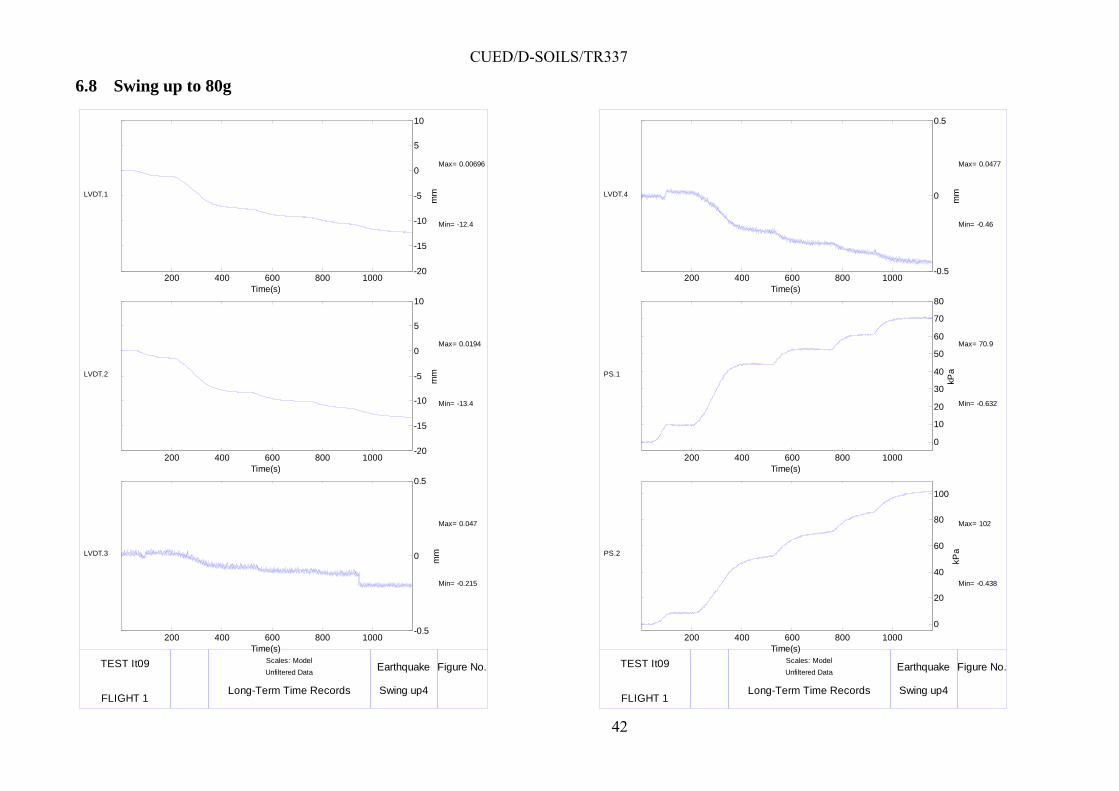
6.8 Swing up to 80g
LVDT.1
LVDT.2
LVDT.3
Max= 0.00696
Min= -12.4
Max= 0.0194
Min= -13.4
Max= 0.047
Min= -0.215
200 400 600 800 1000-20
-15
-10
-5
0
5
10
mm
Time(s)
200 400 600 800 1000-20
-15
-10
-5
0
5
10
mm
Time(s)
200 400 600 800 1000-0.5
0
0.5
mm
Time(s)
TEST It09
FLIGHT 1
Scales: Model
Long-Term Time Records
Unfiltered Data Earthquake
Swing up4
Figure No.
LVDT.4
PS.1
PS.2
Max= 0.0477
Min= -0.46
Max= 70.9
Min= -0.632
Max= 102
Min= -0.438
200 400 600 800 1000-0.5
0
0.5
mm
Time(s)
200 400 600 800 1000
0
10
20
30
40
50
60
70
80
kPa
Time(s)
200 400 600 800 10000
20
40
60
80
100
kPa
Time(s)
TEST It09
FLIGHT 1
Scales: Model
Long-Term Time Records
Unfiltered Data Earthquake
Swing up4
Figure No.