waste not, want not: the private and social costs of waste-to-energy production
TRANSCRIPT
E L S E V I E R PII:S0301-4215(97)00050-5
Energy Policy, Vol. 25, No. 6, pp. 587-600, 1997 © 1997 Published by Elsevier Science Ltd
Printed in Great Britain. All rights reserved 0301-4215/97 $17.00 + 0.00
Waste not, want not: the private and social costs of waste-to-energy production
Marie Lynn Miranda and Brack Hale Nicholas School of the Environment, Duke University, Box 90328, Durham NC27708 USA
Communities, and whole countries, are considering implementing the quickly-evolving technologies of waste-to-energy (WTE) production. Unlike other energy sources, wnste~to-energy plants have two objec- tives. In addition to generating useful energy, these plants are designed to ensure the safe and effective disposal of municipal solid waste (MSW). Energy production and solid waste management both involve complicated and large-scale production processes which generate substantial environmental impacts. Traditional analysis of the desirability of adopting WTE technology has compared its costs and benefits either to other forms of energy production or to other forms of solid waste management. Traditional analysis also tends to focus on private production costs with limited consideration of broader social environmental impacts. Using data from Germany, Sweden, the UK and the US, this paper bundles together the energy generation and waste disposal services offered by WTE and estimates the associated private production and social environmental costs. In so doing, this economic study provides insight into whether WTE plants can compete on the energy production side with fossil-fuel-fired plants and on the waste management side with landfill disposal. © 1997 Published by Elsevier Science Ltd. Keywords." Waste-to-energy production; Energy production costs; Waste disposal economics
WTE facilities
WTE technology
During the 1960s and 1970s, communities around the world began building and operating waste incinerators. These facili- ties, which for the most part did not co-generate any energy, were built before the US and Europe enacted the more stringent air quality legislation that characterizes these countries today. As a result, many of the facilities emitted high levels of both criteria and toxic air pollutants. Today's WTE plants are a far cry from their polluting predecessors. With modern combustion and pollution control technology, WTE plants are able to retrieve significant amounts of energy from waste combustion while minimizing undesirable emissions. In fact, a recent survey of new WTE facilities in the US revealed that all the plants were operating well below (20% or more) their
IThe authors, respectively Associate Professor of the Practice and Research Associate at the Nicholas School of the Environment, gratefully acknowledge research assistance provided by Stacey Miness as well as comments on an earlier version of the paper provided by Lars Astrand, Randall A. Kramer, Anders Lunnan, James N. Miller, Marian Radetzki, V. Kerry Smith, and Herman Vollebergh. All remaining errors are our own.
permit levels for particulates, SO 2, HCI, and NO x (Hilts, 1994). Those permits had been set at or lower than the federal standards. Some proponents of modern WTE technol- ogy would go so far as to claim that the plants are 'among the cleanest combustion-based power plants' (Niessen, 1993).
WTE facilities fall into two general categories: mass-burn and refuse derived fuel (RDF). Mass burn facilities typically burn waste without significant pre-processing. RDF proc- esses convert municipal solid waste into a type of fuel by removing materials with low heat values (glass, metals, organ- ics) and then shredding the remaining waste to produce a fuel with relatively uniform characteristics. The fuel can then either be burned on site, or transported to a combustion facility. Currently, mass burn technologies are more com- mon.
Several different processes are used in the combustion phase of WTE. In the US, moving grates or rotary kilns are most common. The moving grate basically consists of a grate on an incline, along which combustion takes place. As the waste tumbles through the combustion chamber, uncom- busted material is exposed (SRI International, 1992 ). Rotary kilns follow a similar process, but the waste is incinerated in a rotating chamber. In Europe, fluidized bed boilers are
588 Waste not, want not: M L Miranda and B Hale
more common (Rhyner et al., 1995). This process, which requires a uniform fuel, combusts pre-processed waste on a bed of hot sand and ash. Constant air flow from beneath the bed keeps the waste moving. This provides for more complete combustion. These combustion conditions also minimize NOx formation (Murphy, 1995). Adding limestone lowers sulfur dioxide and other acid deposition precursors. Heat is recovered both through the walls of the combustion chamber (either through a refractory or a waterwall design) as well as from the gases produced during combustion (the flue gas) (Murphy, 1995).
After heat recovery, the flue gases pass through air pollu- tion control technology - most commonly electrostatic pre- cipitators. This technology precipitates out much of the particulate matter by passing the flue gases through a series of positively and negatively charged plates. Another com- mon technology for the removal of particulate matter is a fabric (baghouse) filter. By forcing the flue gas through an alkaline substance such as lime, semi-wet and dry scrubbers help neutralize some of the acidic potential of the flue gas from SO 2 and HC1. In Europe, wet scrubbers are more popular. In this system, the flue gases pass through a liquid aerosol that reacts with the pollutants in the flue gas. Although very effective, this technique is expensive and creates wastewater requiring further treatment (Porteous, 1993). The combina- tion of fabric filters and dry scrubbers can remove 99% of the HC1, 95% of the SO2, and 90% of the mercury from flue gases (SRI International, 1992). In order to remove nitrogen oxides, an additional system is required. Selective Catalytic Reduction (SCR) adds ammonia to the flue gas to react with nitrogen oxides. While this process can remove 70% of the NO X emissions, it requires additional energy (Rhyner et al., 1995).
After combustion, the WTE process produces ash. Bot- tom ash results from the actual combustion process, whereas fly ash is the residual from the air pollution controls. In a typical WTE plant, the resulting ash represents 10% of the original MSW volume, and 24% of its original weight (SRI International, 1992a, 1992b, 1992c). European and Asian countries typically recycle WTE plant ash into such products as road aggregate, fill material, cement substitute, and land- fill cover (Barnes, 1995; Goodwin, 1993). Sweden and Germany, for example, recycle most WTE ash, while the Netherlands reprocesses over 90% of its ash. The US, on the other hand, recycles under 2% of the nine million tons of ash produced annually (Barnes, 1995). Combined bottom and fly ash typically consists of 8-12% ferrous metals and 0.5- 1.5% non-ferrous metals (Barnes, 1995). Reprocessing the ash for use as ash aggregate or landfill cover can recover these high-grade metals for recycling. Goodwin (1993) estimates that the ash can be reprocessed for an estimated $32 ton -1. If the ash is not reprocessed, it is typically land- filled in a monofill - a landfill that receives only WTE ash.
The prevalence o f W T E
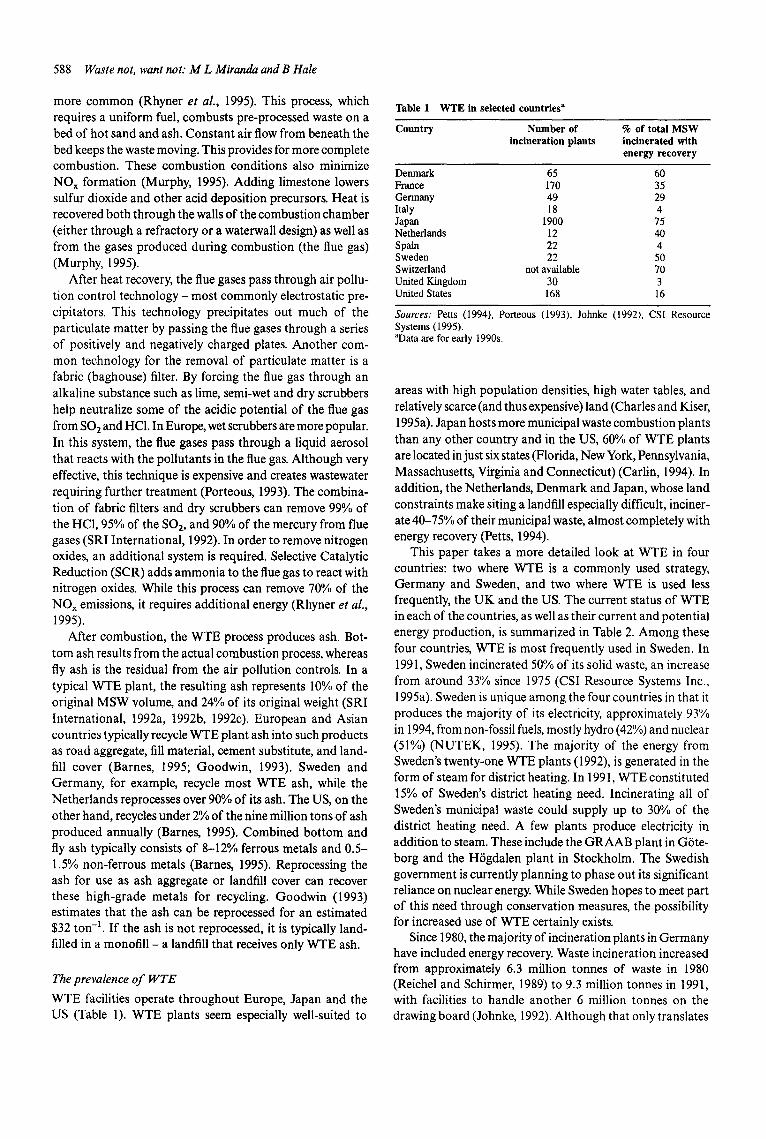
WTE facilities operate throughout Europe, Japan and the US (Table 1). WTE plants seem especially well-suited to
Table 1 WTE in selected countries"
Country Number of % of total MSW incineration plants incinerated with
energy recovery
Denmark 65 60 France 170 35 Germany 49 29 Italy 18 4 Japan 1900 75 Netherlands 12 40 Spain 22 4 Sweden 22 50 Switzerland not available 70 United Kingdom 30 3 United States 168 16
Sources: Petts (1994), Porteous (1993), Johnke (1992), CSI Systems (1995). aData are for early 1990s.
Resource
areas with high population densities, high water tables, and relatively scarce (and thus expensive) land (Charles and Kiser, 1995a). Japan hosts more municipal waste combustion plants than any other country and in the US, 60% of WTE plants are located in just six states (Florida, New York, Pennsylvania, Massachusetts, Virginia and Connecticut) (Carlin, 1994). In addition, the Netherlands, Denmark and Japan, whose land constraints make siting a landfill especially difficult, inciner- ate 40-75% of their municipal waste, almost completely with energy recovery (Petts, 1994).
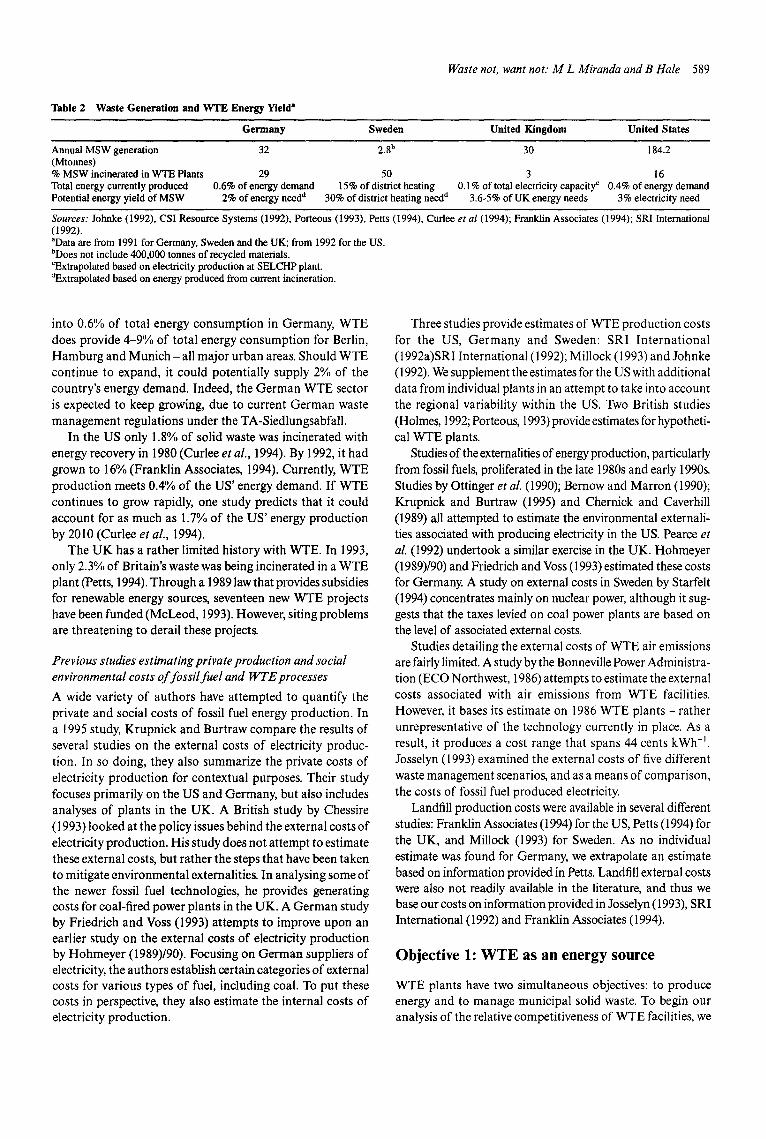
This paper takes a more detailed look at WTE in four countries: two where WTE is a commonly used strategy, Germany and Sweden, and two where WTE is used less frequently, the UK and the US. The current status of WTE in each of the countries, as well as their current and potential energy production, is summarized in Table 2. Among these four countries, WTE is most frequently used in Sweden. In 1991, Sweden incinerated 50% of its solid waste, an increase from around 33% since 1975 (CSI Resource Systems Inc., 1995a). Sweden is unique among the four countries in that it produces the majority of its electricity, approximately 93%o in 1994, from non-fossil fuels, mostly hydro (42"/'0) and nuclear (51%o) (NUTEK, 1995). The majority of the energy from Sweden's twenty-one WTE plants (1992), is generated in the form of steam for district heating. In 1991, WTE constituted 15% of Sweden's district heating need. Incinerating all of Sweden's municipal waste could supply up to 30% of the district heating need. A few plants produce electricity in addition to steam. These include the GRAAB plant in Grte- borg and the Hrgdalen plant in Stockholm. The Swedish government is currently planning to phase out its significant reliance on nuclear energy. While Sweden hopes to meet part of this need through conservation measures, the possibility for increased use of WTE certainly exists.
Since 1980, the majority of incineration plants in Germany have included energy recovery. Waste incineration increased from approximately 6.3 million tonnes of waste in 1980 (Reichel and Schirmer, 1989) to 9.3 million tonnes in 1991, with facilities to handle another 6 million tonnes on the drawing board (Johnke, 1992). Although that only translates
Waste not, want not: M L Miranda and B Hale 589
Table 2 Waste Generation and WTE Energy Yield ~
Germany Sweden United Kingdom United States
Annual MSW generation 32 2.8 b 30 184.2 (Mtonnes) % MSW incinerated in WTE Plants 29 50 3 16 Total energy currently produced 0.6% of energy demand 15% of district heating 0.1% of total electricity capacity c 0.4% of energy demand Potential energy yield of MSW 2% of energy need a 30% of district heating need a 3.6-5% of UK energy needs 3% electricity need
Sources: Johnke (1992), CSI Resource Systems (1992), Porteous (1993), Petts (1994), Curlee et al (1994); Franklin Associates (1994); SRI International (1992). aData are from 1991 for Germany. Sweden and the UK; from 1992 for the US. bDoes not include 400,000 tonnes of recycled materials. CExtrapolated based on electricity production at SELCHP plant. ~Extrapolated based on energy produced from current incineration.
into 0.6% of total energy consumption in Germany, WTE does provide 4-9% of total energy consumption for Berlin, Hamburg and Munich- all major urban areas. Should WTE continue to expand, it could potentially supply 2°/'0 of the country's energy demand. Indeed, the German WTE sector is expected to keep growing, due to current German waste management regulations under the TA-Siedlungsabfall.
In the US only 1.8% of solid waste was incinerated with energy recovery in 1980 (Curlee et al., 1994). By 1992, it had grown to 16% (Franklin Associates, 1994). Currently, WTE production meets 0.4% of the US' energy demand. If WTE continues to grow rapidly, one study predicts that it could account for as much as 1.7% of the US' energy production by 2010 (Curlee et al., 1994).
The UK has a rather limited history with WTE. In 1993, only 2.3% of Britain's waste was being incinerated in a WTE plant (Petts, 1994). Through a 1989 law that provides subsidies for renewable energy sources, seventeen new WTE projects have been funded (McLeod, 1993). However, siting problems are threatening to derail these projects.
Previous studies estimating private production and social environmental costs o f fossil fuel and W T E processes
A wide variety of authors have attempted to quantify the private and social costs of fossil fuel energy production. In a 1995 study, Krupnick and Burtraw compare the results of several studies on the external costs of electricity produc- tion. In so doing, they also summarize the private costs of electricity production for contextual purposes. Their study focuses primarily on the US and Germany, but also includes analyses of plants in the UK. A British study by Chessire (1993) looked at the policy issues behind the external costs of electricity production. His study does not attempt to estimate these external costs, but rather the steps that have been taken to mitigate environmental externalities. In analysing some of the newer fossil fuel technologies, he provides generating costs for coal-fired power plants in the UK. A German study by Friedrich and ¥oss (1993) attempts to improve upon an earlier study on the external costs of electricity production by Hohmeyer (1989)/90). Focusing on German suppliers of electricity, the authors establish certain categories of external costs for various types of fuel, including coal. To put these costs in perspective, they also estimate the internal costs of electricity production.
Three studies provide estimates of WTE production costs for the US, Germany and Sweden: SRI International (1992a)SRI International (1992); Millock (1993) and Johnke (1992). We supplement the estimates for the US with additional data from individual plants in an attempt to take into account the regional variability within the US. Two British studies (Holmes, 1992; Porteous, 1993) provide estimates for hypotheti- cal WTE plants.
Studies of the externalities of energy production, particularly from fossil fuels, proliferated in the late 1980s and early 1990s. Studies by Ottinger et aL (1990); Bernow and Marron (1990); Krupnick and Burtraw (1995) and Chernick and Caverhill (1989) all attempted to estimate the environmental externali- ties associated with producing electricity in the US. Pearce et al. (1992) undertook a similar exercise in the UK. Hohmeyer (1989)/90) and Friedrich and Voss (1993) estimated these costs for Germany. A study on external costs in Sweden by Starfelt (1994) concentrates mainly on nuclear power, although it sug- gests that the taxes levied on coal power plants are based on the level of associated external costs.
Studies detailing the external costs of WTE air emissions are fairly limited. A study by the Bonneville Power Administra- tion (ECO Northwest, 1986) attempts to estimate the external costs associated with air emissions from WTE facilities. However, it bases its estimate on 1986 WTE plants - rather unrepresentative of the technology currently in place. As a result, it produces a cost range that spans 44 cents kWh -t. Josselyn (1993) examined the external costs of five different waste management scenarios, and as a means of comparison, the costs of fossil fuel produced electricity.
Landfill production costs were available in several different studies: Franklin Associates (1994) for the US, Petts (1994) for the UK, and Millock (1993) for Sweden. As no individual estimate was found for Germany, we extrapolate an estimate based on information provided in Petts. Landfill external costs were also not readily available in the literature, and thus we base our costs on information provided in Josselyn (1993), SRI International (1992) and Franklin Associates (1994).
Object ive 1: W T E as an energy source
WTE plants have two simultaneous objectives: to produce energy and to manage municipal solid waste. To begin our analysis of the relative competitiveness of WTE facilities, we
590 Waste not, want not: M L Miranda and B Hale
first consider them simply as 'small power plants' (Niessen, 1993). Later, we will supplement this analysis by considering the solid waste management aspects of WTE facilities. If WTE plants are to compete successfully with traditional fossil fuel plants, they must offer high-quality energy products at comparable prices From a social standpoint, WTE must also be evaluated on the basis of the associated environmental impacts relative to fossil fuel production.
WTE plants can provide energy in several different forms: hot water, steam or electricity. Hot water, generally used in district heating systems, is the simplest and most efficient energy product to produce. The WTE plant in Uppsala, Sweden which generates 90% of its energy in the form of hot water yields approximately 2720 kWh tonne -l 2 of waste incinerated (/~strand, 1990). Electricity, which loses efficiency in both steam production to power turbines and the work of the turbines, is the most inefficient energy product. Steam production, generally used in either district heating or industrial processes, falls somewhere in the middle. Which form of energy is produced or in what combination depends on local variables and markets.
In Sweden, where district heating is common, WTE plants primarily produce hot water and to a lesser extent, steam. Only a few, such as the GRAAB plant in G6teborg and the H6gdalen plant in Stockholm also produce electricity. It should be noted, that in both of these cases, the amount of electricity produced is small in comparison to their heat production. WTE plants in Germany, which also has extensive district heating networks, produce both steam and electric- ity. However, electricity production in Germany appears to be somewhat more common than in Sweden. For example, the two WTE facilities in Munich produced about 6.5 GWh of electricity in 1992, compared with a heat production of 4.2 GWh. In the US, there is a noticeable trend toward electricity and away from steam production (Berenyi and Gould, 1993). This can be partly attributed to the lack of district heating infrastructure in most cities. However, some newer facilities are seeking appropriate markets to take advantage of higher energy yields from hot water and steam. For example, the BCH plant in Fayetteville, North Carolina sells steam (through a negotiated agreement) to a local chemi- cal company, and also sells electricity to the regional grid (Murphy, 1995). The UK also appears to favor electricity production in its WTE plants.
In this study, we assume a figure of 578 kwh of electric- ity produced per tonne of waste incinerated. We choose to calculate our costs based on the assumption that WTE plants produce electricity alone, as this provides the simplest, and most conservative means of cross-country comparison. This may result in a significant overestimate of WTE production costs - particularly in Sweden and Germany- making WTE appear less competitive than it otherwise might, were hot water and steam production options taken into considera- tion. This figure for electricity production (578 kWh) is one
2Throughout this study, tonne refers to a metric ton, or 1000 kilograms; ton refers to an English ton, or 2000 pounds.
fifth as efficient as the figure for hot water production (2720 kWh), and should be kept in mind when interpreting the final results.
Baseline private production costs for fossil fuel energy production
The private cost of producing electricity includes both the original capital outlay and operation and maintenance charges. The capital charge includes the costs associated with plant construction and the operation and maintenance costs include personnel, repair, maintenance, and other related costs. These private production costs vary among countries and among regions within countries as well.
To provide baseline estimates of private production costs for fossil fuel-fired energy facilities in the US, Germany and the UK, we take advantage of the work already completed by Krupnick and Burtraw (1995); Chessire (1993) and Frie- drich and Voss (1993). Each of these estimates is for electric- ity produced from coal. While unrepresentative, these figures are still probably reasonable for comparison purposes as WTE generally replaces the most polluting technology - which is coal. Because Sweden depends most heavily on nuclear and hydro power, rather than fossil fuels, calculating Swedish private production costs for fossil fuel-fired energy facilities is more difficult. We use estimates from the Krup- nick and Burtraw study, as it is meant to be a means of comparison, not only for the US, but also for the European Community.
In calculating private production costs, currencies were converted to US dollars. When necessary, each figure was also converted to cents per kilowatt-hour of electricity. Table 3 summarizes the estimated private production costs for fossil fuel energy production. Private production costs for the UK, Sweden and the US fall in a similar range (4.2-6.4 cents kWh-J). This is of course expected for the latter two as they draw from the same study. Estimated costs for Germany, however, are substantially higher (8.3- 9.6 cents kWh-l), due at least in part to the requirement that utilities use expensive domestic coal. All of these estimates compare reasonably well with the actual prices for electricity in each country, once the other infrastructure costs (cost of transmission, distribution, etc) are taken into account.
Private production costs for WTE energy production
Similar to fossil fuel private production costs, WTE private production costs include the capital cost of the WTE facil- ity, the facility's operating costs, the facility's maintenance costs, and the debt service. To calculate private production costs for WTE energy production, we rely on Johnke (1992); Millock (1993); Porteous (1993); Holmes (1992); SRI International (1992); Hilts (1994); NREL (1995a) NREL (1995b); Randall (1994); Franklin Associates (1994) and Sul- livan et al. (1993).
As the data is from a wide variety of sources, all with different methods of cost calculation, substantial manipula- tion was required in order to make the data comparable.
Waste not, want not: M L Miranda and B Hale 591
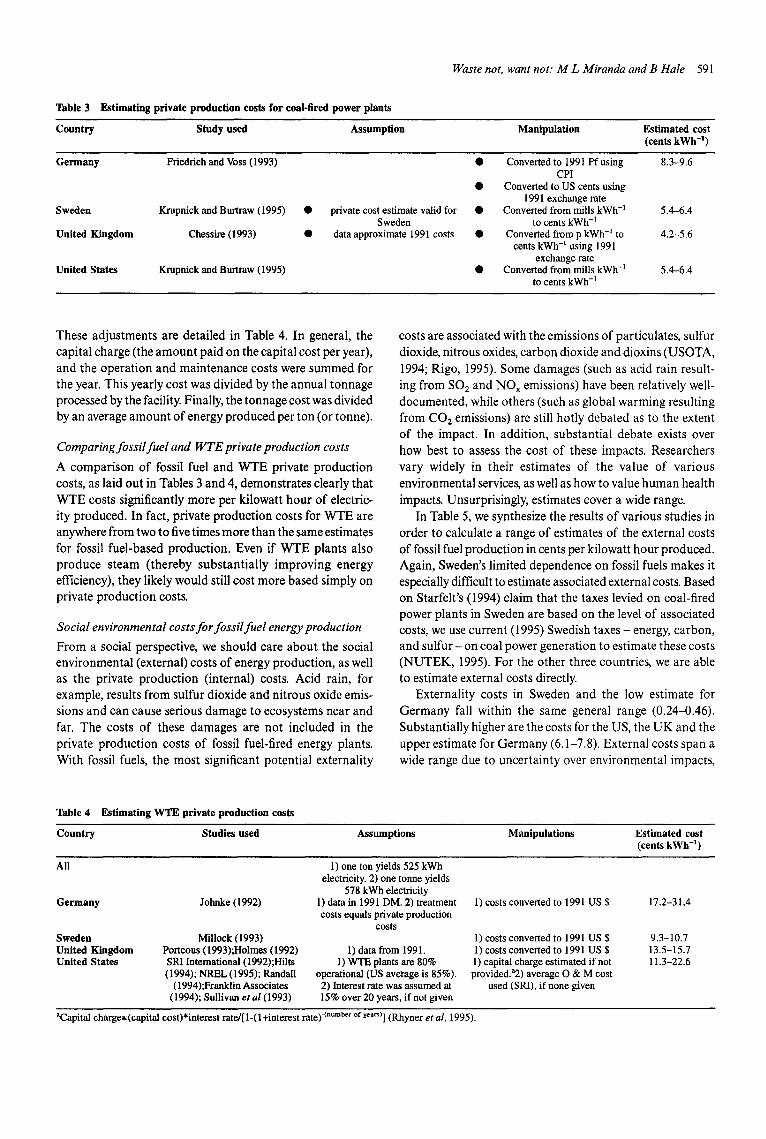
Table 3 Estimating private production costs for coal-fired power plants
Country Study used Assumption Manipulation Estimated cost (cents kWh -1)
Germany Friedrich and Voss (1993) • Converted to 1991 Pf using 8.3-9.6
Sweden
United Kingdom
United States
Krupnick and Burtraw (1995)
Chessire (1993)
Krupnick and Burtraw (1995)
CPI • Converted to US cents using
1991 exchange rate • private cost estimate valid for • Converted from mills kWh -1 5.4-6.4
Sweden to cents kWh -1 • data approximate 1991 costs • Converted from p kWh -] to 4.2-5.6
cents kWh -1 using 1991 exchange rate
• Converted from mills kWh -1 5.4-6.4 to cents kWh -~
These adjustments are detailed in Table 4. In general, the capital charge (the amount paid on the capital cost per year), and the operation and maintenance costs were summed for the year. This yearly cost was divided by the annual tonnage processed by the facility. Finally, the tonnage cost was divided by an average amount of energy produced per ton (or tonne).
Comparing fossil fuel and WTE private production costs
A comparison of fossil fuel and WTE private production costs, as laid out in Tables 3 and 4, demonstrates clearly that WTE costs significantly more per kilowatt hour of electric- ity produced. In fact, private production costs for WTE are anywhere from two to five times more than the same estimates for fossil fuel-based production. Even if WTE plants also produce steam (thereby substantially improving energy efficiency), they likely would still cost more based simply on private production costs.
Social environmental costs for fossil fuel energy production
From a social perspective, we should care about the social environmental (external) costs of energy production, as well as the private production (internal) costs. Acid rain, for example, results from sulfur dioxide and nitrous oxide emis- sions and can cause serious damage to ecosystems near and far. The costs of these damages are not included in the private production costs of fossil fuel-fired energy plants. With fossil fuels, the most significant potential externality
costs are associated with the emissions of particulates, sulfur dioxide, nitrous oxides, carbon dioxide and dioxins (USOTA, 1994; Rigo, 1995). Some damages (such as acid rain result- ing from SO2 and NO x emissions) have been relatively well- documented, while others (such as global warming resulting from CO2 emissions) are still hotly debated as to the extent of the impact. In addition, substantial debate exists over how best to assess the cost of these impacts. Researchers vary widely in their estimates of the value of various environmental services, as well as how to value human health impacts. Unsurprisingly, estimates cover a wide range.
In Table 5, we synthesize the results of various studies in order to calculate a range of estimates of the external costs of fossil fuel production in cents per kilowatt hour produced. Again, Sweden's limited dependence on fossil fuels makes it especially difficult to estimate associated external costs. Based on Starfelt's (1994) claim that the taxes levied on coal-fired power plants in Sweden are based on the level of associated costs, we use current (1995) Swedish taxes - energy, carbon, and sulfur- on coal power generation to estimate these costs (NUTEK, 1995). For the other three countries, we are able to estimate external costs directly.
Externality costs in Sweden and the low estimate for Germany fall within the same general range (0.24-0.46). Substantially higher are the costs for the US, the UK and the upper estimate for Germany (6.1-7.8). External costs span a wide range due to uncertainty over environmental impacts,
Table 4 Estimating WTE private production costs
Country Studies used Assumptions Manipulations Estimated cost (cents kWh -1)
All 1) one ton yields 525 kWh electricity. 2) one tonne yields
578 kWh electricity 1) data in 1991 DM. 2) treatment costs equals private production
costs
Germany
Sweden United Kingdom United States
Johnke (1992)
Millock (1993) Porteous (1993);Holmes (1992) SRI International ( 1992);Hilts (1994); NREL (1995); Randall
( 1994);Franklin Associates (1994); Sullivan et al (1993)
1) data from 1991. 1) WTE plants are 80%
operational (US ave'rage is 85%). 2) Interest rate was assumed at 15% over 20 years, if not given
1) costs converted to 1991 US $
1) costs converted to 1991 US $ 1) costs converted to 1991 US $ 1) capital charge estimated if not provided.a2) average O & M cost
used (SRI), if none given
17.2-31.4
9.3-10.7 13.5-15.7 11.3-22.6
~Capital charge=(capital cost)*interest rate/[ 1-(1 +interest rate) -("umb'r of y~m)] (Rhyner et al, 1995).
592 Waste not, want not: M L Miranda and B Hale
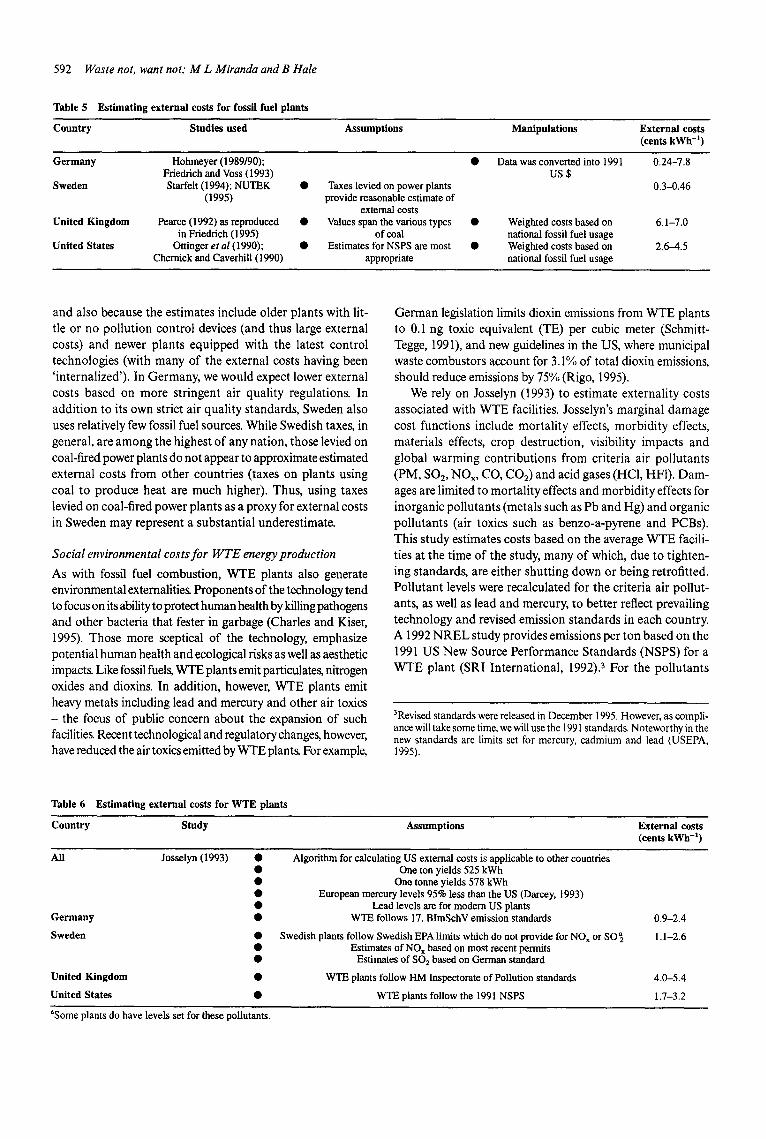
Table 5 Estimating external costs for fossil fuel plants
Country Studies used Assumptions Manipulations External costs (cents kWh -l)
Germany Hohmeyer (1989/90); • Data was converted into 1 9 9 1 0.24-7.8 Friedrich and Voss (1993) US $
Sweden Starfelt (1994); NUTEK • Taxes levied on power plants 0.3-0.46 (1995) provide reasonable estimate of
external costs United Kingdom Pearce (1992) as reproduced • Values span the various types • Weighted costs based on 6.1-7.0
in Friedrich (1995) of coal national fossil fuel usage United States Ottinger et al (1990); • Estimates for NSPS are most • Weighted costs based on 2.6--4.5
Chernick and Caverhill (1990) appropriate national fossil fuel usage
and also because the estimates include older plants with lit- tle or no pollution control devices (and thus large external costs) and newer plants equipped with the latest control technologies (with many of the external costs having been 'internalized'). In Germany, we would expect lower external costs based on more stringent air quality regulations. In addition to its own strict air quality standards, Sweden also uses relatively few fossil fuel sources. While Swedish taxes, in general, are among the highest of any nation, those levied on coal-fired power plants do not appear to approximate estimated external costs from other countries (taxes on plants using coal to produce heat are much higher). Thus, using taxes levied on coal-fired power plants as a proxy for external costs in Sweden may represent a substantial underestimate.
Social environmental costs for WTE energy production
As with fossil fuel combustion, WTE plants also generate environmental externalities` Proponents of the technology tend to focus on its ability to protect human health by killing pathogens and other bacteria that fester in garbage (Charles and Kiser, 1995). Those more sceptical of the technology, emphasize potential human health and ecological risks as well as aesthetic impacts, Like fossil fuels, WTE plants emit particulates, nitrogen oxides and dioxins. In addition, however, WTE plants emit heavy metals including lead and mercury and other air toxics - the focus of public concern about the expansion of such facilities. Recent technological and regulatory changes, however, have reduced the air toxics emitted by WTE plants For example,
German legislation limits dioxin emissions from WTE plants to 0.1 ng toxic equivalent (TE) per cubic meter (Schmitt- Tegge, 1991), and new guidelines in the US, where municipal waste combustors account for 3.1% of total dioxin emissions, should reduce emissions by 75% (Rigo, 1995).
We rely on Josselyn (1993) to estimate externality costs associated with WTE facilities. Josselyn's marginal damage cost functions include mortality effects, morbidity effects, materials effects, crop destruction, visibility impacts and global warming contributions from criteria air pollutants (PM, SO2, NOx, CO, CO2) and acid gases (HC1, HF1). Dam- ages are limited to mortality effects and morbidity effects for inorganic pollutants (metals such as Pb and Hg) and organic pollutants (air toxics such as benzo-a-pyrene and PCBs). This study estimates costs based on the average WTE facili- ties at the time of the study, many of which, due to tighten- ing standards, are either shutting down or being retrofitted. Pollutant levels were recalculated for the criteria air pollut- ants, as well as lead and mercury, to better reflect prevailing technology and revised emission standards in each country. A 1992 NREL study provides emissions per ton based on the 1991 US New Source Performance Standards (NSPS) for a WTE plant (SRI International, 1992). 3 For the pollutants
3Revised standards were released in December 1995. However, as compli- ance will take some time, we will use the 1991 standards. Noteworthy in the new standards are limits set for mercury, cadmium and lead (USEPA, 1995).
Table 6 Estimating external costs for WTE plants
Country Study Assumptions External costs (cents kWh -l )
All Josselyn (1993) • Algorithm for calculating US external costs is applicable to other countries • One ton yields 525 kWh • One tonne yields 578 kWh • European mercury levels 95% less than the US (Darcey, 1993) • Lead levels are for modern US plants • WTE follows 17. BImSchV emission standards 0.9-2.4
• Swedish plants follow Swedish EPA limits which do not provide for NOx or SO ~ 1.1-2.6 • Estimates of NO x based on most recent permits • Estimates of SO 2 based on German standard
• WTE plants follow HM Inspector'ate of Pollution standards 4.0-5.4
• WTE plants follow the 1991 NSPS 1.7-3.2
Germany
Sweden
United Kingdom
United States
aSome plants do have levels set for these pollutants.
not covered under the 1991 NSPS (lead, mercury and carbon dioxide), the study did provide mean emissions from recently constructed WTE plants. These figures were then adjusted for each country based on their emission standards. The corresponding legislation is listed in Table 6, along with other assumptions and the estimates. Germany, Sweden, and the US have relatively comparable levels of WTE external costs. The UK, on the other hand, exhibits higher costs due primarily to its high levels of permitted sulfur dioxide and nitrous oxides emissions.
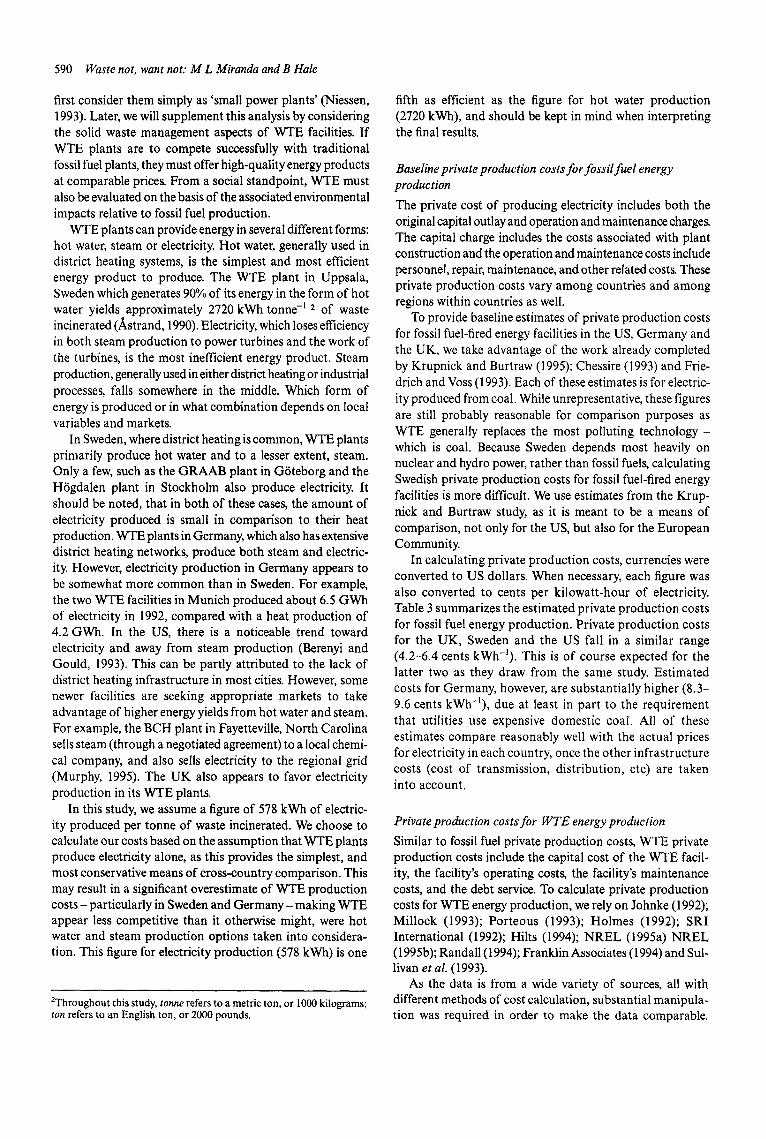
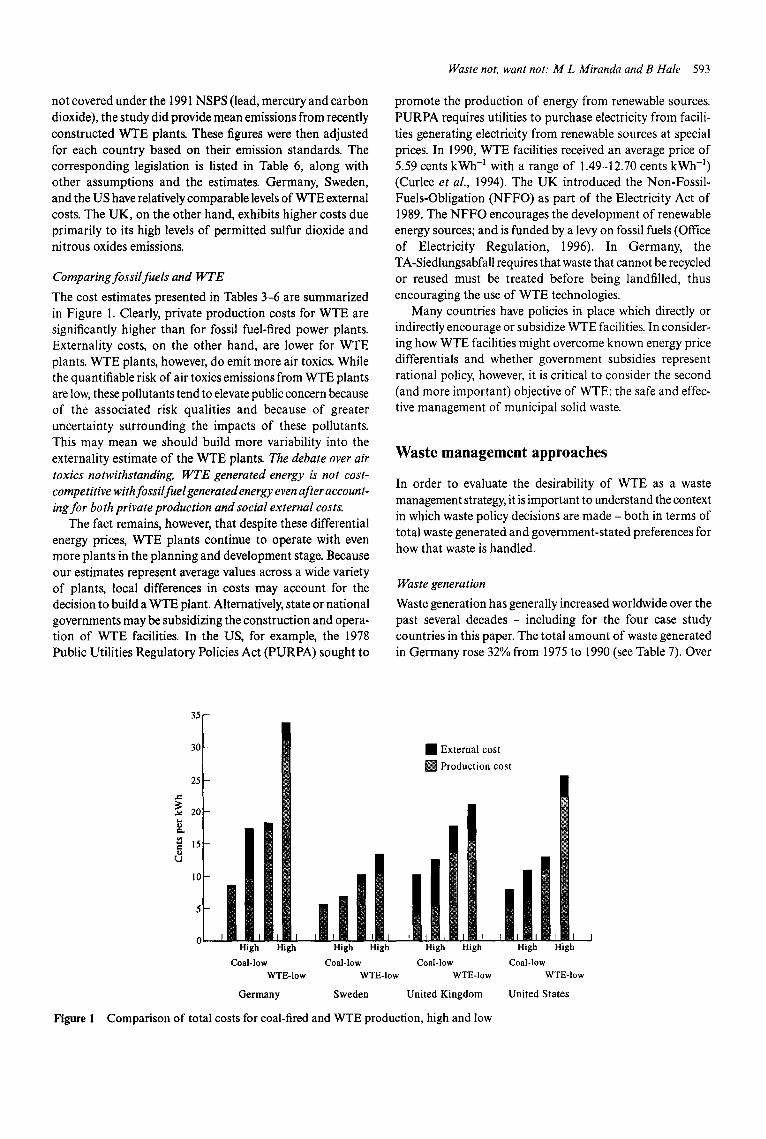
Comparing fossil fuels and WTE
The cost estimates presented in Tables 3-6 are summarized in Figure 1. Clearly, private production costs for WTE are significantly higher than for fossil fuel-fired power plants. Externality costs, on the other hand, are lower for WTE plants. WTE plants, however, do emit more air toxics. While the quantifiable risk of air toxics emissions from WTE plants are low, these pollutants tend to elevate public concern because of the associated risk qualities and because of greater uncertainty surrounding the impacts of these pollutants. This may mean we should build more variability into the externality estimate of the WTE plants. The debate over air toxics notwithstanding, WTE generated energy is not cost- competitive with fossil fuel generatedenergy even after account- ing for both private production and social external costs.
The fact remains, however, that despite these differential energy prices, WTE plants continue to operate with even more plants in the planning and development stage. Because our estimates represent average values across a wide variety of plants, local differences in costs may account for the decision to build a WTE plant. Alternatively, state or national governments may be subsidizing the construction and opera- tion of WTE facilities. In the US, for example, the 1978 Public Utilities Regulatory Policies Act (PURPA) sought to
Waste not, want not." M L Miranda and B Hale 593
promote the production of energy from renewable sources. PURPA requires utilities to purchase electricity from facili- ties generating electricity from renewable sources at special prices. In 1990, WTE facilities received an average price of 5.59 cents kWh -~ with a range of 1.49-12.70 cents kWh -1) (Curlee et al., 1994). The UK introduced the Non-Fossil- Fuels-Obligation (NFFO) as part of the Electricity Act of 1989. The NFFO encourages the development of renewable energy sources; and is funded by a levy on fossil fuels (Office of Electricity Regulation, 1996). In Germany, the TA-Siedlungsabfall requires that waste that cannot be recycled or reused must be treated before being landfilled, thus encouraging the use of WTE technologies.
Many countries have policies in place which directly or indirectly encourage or subsidize WTE facilities. In consider- ing how WTE facilities might overcome known energy price differentials and whether government subsidies represent rational policy, however, it is critical to consider the second (and more important) objective of WTE: the safe and effec- tive management of municipal solid waste.
Waste management approaches
In order to evaluate the desirability of WTE as a waste management strategy, it is important to understand the context in which waste policy decisions are made - both in terms of total waste generated and government-stated preferences for how that waste is handled.
Waste generation
Waste generation has generally increased worldwide over the past several decades - including for the four case study countries in this paper. The total amount of waste generated in Germany rose 32% from 1975 to 1990 (see Table 7). Over
35
30
25
~o e~
10
[ ] External cost [ ] Production cost
High High High High High High High High
Coal-low Coal-low Coal-low Coal-low WTE-low WTE-Iow WTE-low WTE-low
Germany Sweden United Kingdom United States
Figure 1 Comparison of total costs for coal-fired and WTE production, high and low
594 Waste not, want not: M L Miranda and B Hale
Table 7 Waste generation trends
Country MSW generation (million tonnes)
1975 1985 1991
Germany 20.40 22.50 27.0 Sweden 2.40 2.65 3.1 United Kingdom 16.00 16.4 a 20.0 United States 140.00 148.80 184.0
Sources: World Resources Institute 1988-1989, CSI Resource Systems (1995), Porteous (1993), US EPA (1995). a 1983 data.
the same time period, waste generation in Sweden increased 29%. In the UK and the US, it increased 25%o and 31%, respectively.
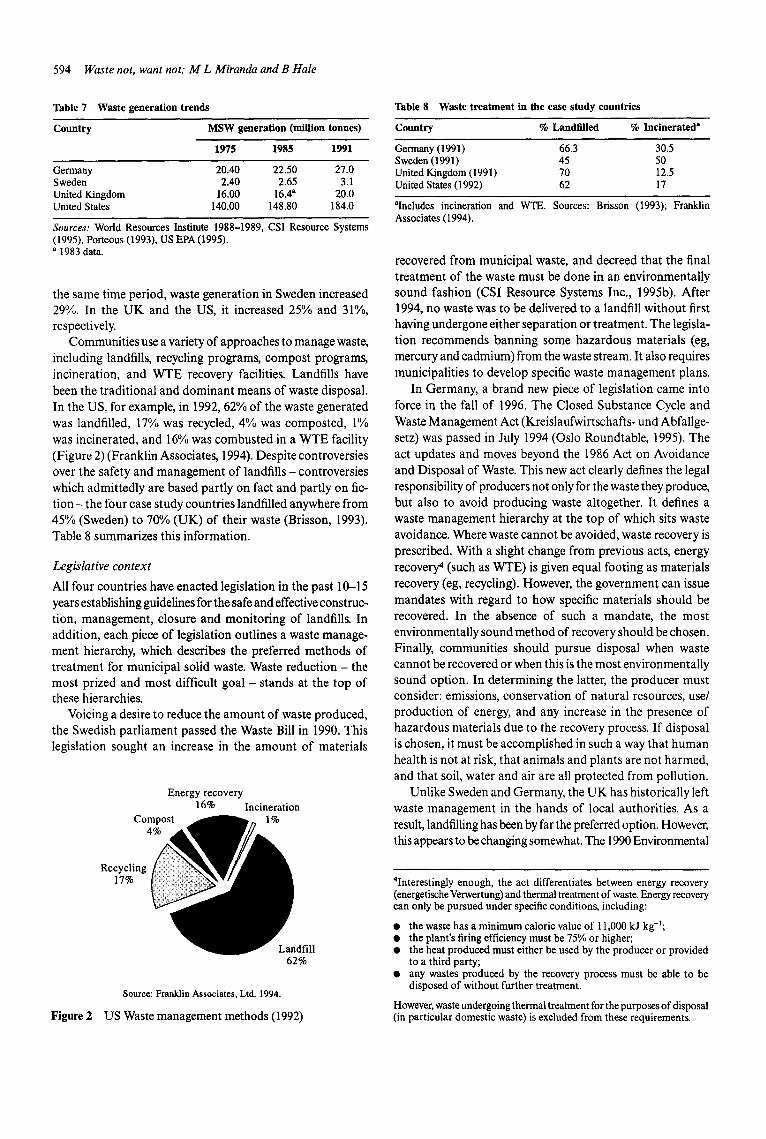
Communities use a variety of approaches to manage waste, including landfills, recycling programs, compost programs, incineration, and WTE recovery facilities. Landfills have been the traditional and dominant means of waste disposal. In the US, for example, in 1992, 62%0 of the waste generated was landfilled, 17% was recycled, 4% was composted, 1% was incinerated, and 16% was combusted in a WTE facility (Figure 2) (Franklin Associates, 1994). Despite controversies over the safety and management of landfills - controversies which admittedly are based partly on fact and partly on fic- t i on - the four case study countries landfilled anywhere from 45% (Sweden) to 70% (UK) of their waste (Brisson, 1993). Table 8 summarizes this information.
Legislative context
All four countries have enacted legislation in the past 10-15 years establishing guidelines for the safe and effective construc- tion, management, closure and monitoring of landfills. In addition, each piece of legislation outlines a waste manage- ment hierarchy, which describes the preferred methods of treatment for municipal solid waste. Waste reduction - the most prized and most difficult goal - stands at the top of these hierarchies.
Voicing a desire to reduce the amount of waste produced, the Swedish parliament passed the Waste Bill in 1990. This legislation sought an increase in the amount of materials
Energy recovery 16% Incineration
Cor 4
Recycling 17%
Figure 2
drill 62%
Source: Franklin Associates, Ltd. 1994.
US Waste management methods (I 992)
Table 8 Waste treatment in the case study countries
Country % Landlilled % Incinerated"
Germany (1991) 66.3 30.5 Sweden (1991) 45 50 United Kingdom (1991) 70 12.5 United States (1992) 62 17
alncludes incineration and WTE. Sources: Brisson (1993); Franklin Associates (1994).
recovered from municipal waste, and decreed that the final treatment of the waste must be done in an environmentally sound fashion (CSI Resource Systems Inc., 1995b). After 1994, no waste was to be delivered to a landfill without first having undergone either separation or treatment. The legisla- tion recommends banning some hazardous materials (eg, mercury and cadmium) from the waste stream. It also requires municipalities to develop specific waste management plans.
In Germany, a brand new piece of legislation came into force in the fall of 1996. The Closed Substance Cycle and Waste Management Act (Kreislaufwirtschafts- und Abfallge- setz) was passed in July 1994 (Oslo Roundtable, 1995). The act updates and moves beyond the 1986 Act on Avoidance and Disposal of Waste. This new act clearly defines the legal responsibility of producers not only for the waste they produce, but also to avoid producing waste altogether. It defines a waste management hierarchy at the top of which sits waste avoidance. Where waste cannot be avoided, waste recovery is prescribed. With a slight change from previous acts, energy recovery 4 (such as WTE) is given equal footing as materials recovery (eg, recycling). However, the government can issue mandates with regard to how specific materials should be recovered. In the absence of such a mandate, the most environmentally sound method of recovery should be chosen. Finally, communities should pursue disposal when waste cannot be recovered or when this is the most environmentally sound option. In determining the latter, the producer must consider: emissions, conservation of natural resources, use/ production of energy, and any increase in the presence of hazardous materials due to the recovery process. If disposal is chosen, it must be accomplished in such a way that human health is not at risk, that animals and plants are not harmed, and that soil, water and air are all protected from pollution.
Unlike Sweden and Germany, the UK has historically left waste management in the hands of local authorities. As a result, landfilling has been by far the preferred option. However, this appears to be changing somewhat. The 1990 Environmental
4Interestingly enough, the act differentiates between energy recovery (energetische Verwertung) and thermal treatment of waste. Energy recovery can only be pursued under specific conditions, including:
• the waste has a minimum caloric value of 11,000 kJ kg-l; • the plant's firing efficiency must be 75% or higher; • the heat produced must either be used by the producer or provided
to a third party; • any wastes produced by the recovery process must be able to be
disposed of without further treatment.
However, waste undergoing thermal treatment for the purposes of disposal (in particular domestic waste) is excluded from these requirements.
Waste not, want not." M L Miranda and B Hale 595
Protection Act focuses on pollution prevention. It tightens standards on landfills, a move which will likely increase the cost of landfill disposal substantially. The Act also requires waste regulation authorities to develop waste disposal plans. The 1995 government strategy for waste management, 'Mak- ing Waste Work' lays out the standard hierarchy (reduction, reuse, recovery, disposal). It also provides several 'primary targets' for waste management for the year 2005, including a reduction in the amount of waste going to landfills by 60%, and an increase in the amount of material being recovered by 40%. Further, the report states that environmental costs and benefits should be taken into account when making waste management decisions.
The US has a mixture of the two approaches. It set a national standard through the 1976 Resource Conservation and Recovery Act (RCRA) - revised in 1980 and 1984. At the same time, it provides the states with leeway in their waste management choices. In 1991, the Environmental Protec- tion Agency (EPA) introduced new Subtitle D standards for MSW landfills, requiring liners, collection of leachate, and monitoring of groundwater - a move which will raise land- fill costs across the board. With regard to WTE facilities, the 1984 amendments require them to take into account current and future recycling requirements of their communities (Car- lin, 1994). In addition, the federal government has been pushing a waste management hierarchy that puts source reduction at the top, followed by recycling, and finally WTE and landfilling (USEPA, 1995). Many states have moved beyond the basic federal standards for waste management. As of 1994, forty-one of the fifty states had comprehensive waste reduction/recycling laws. Many states have also undertaken bans to keep certain materials out of landfills. Forty-two states now ban car batteries and twenty states ban yard wastes from landfills (Steuteville, 1995).
Objective 2: WTE as a waste management strategy
Earlier in the paper we concluded that even after incorporat- ing differentials in externality costs, producing energy via a WTE facility is more expensive than via a fossil fuel plant. Of course, a WTE facility does more than just produce energy: it reduces the weight of waste requiring disposal by 75% (SRI International, 1992). As such, it is important to compare the private 'production' costs associated with manag- ing waste by land filling vs by combusting it for energy recovery, as well as the social environmental costs associated with each method.
Private production costs for landfills
The costs associated with landfilling waste arise from a variety of factors. As with fossil fuel and WTE plants, there is both a capital cost for landfill construction as well as operation and maintenance costs. Additionally, after a landfill closes, it must be monitored for leachate and landfill gas, both of which must be treated in some manner. Post-closure activi-
$50 $45 $40 $35 $30 $25 $20 $15 $10
$5 $0
Northeast Southeast Pacific Central Mountain
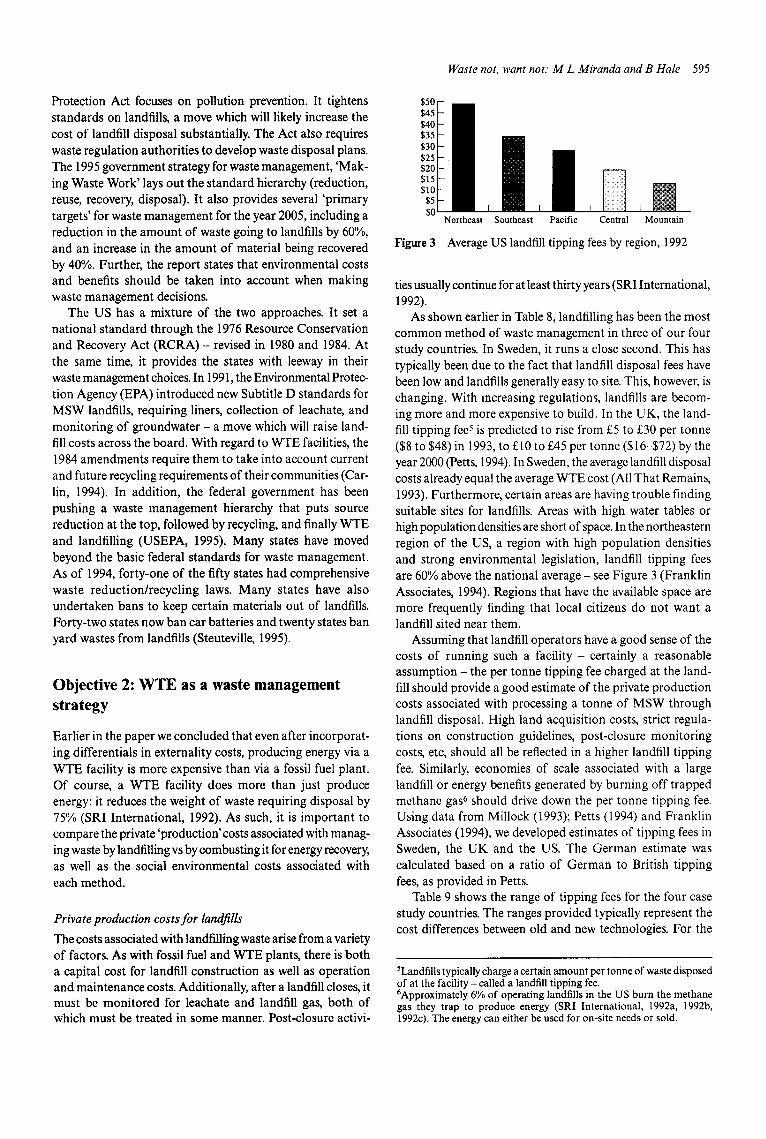
Figure 3 Average US landfill tipping fees by region, 1992
ties usually continue for at least thirty years (SRI International, 1992).
As shown earlier in Table 8, landfilling has been the most common method of waste management in three of our four study countries. In Sweden, it runs a close second. This has typically been due to the fact that landfill disposal fees have been low and landfills generally easy to site. This, however, is changing. With increasing regulations, landfills are becom- ing more and more expensive to build. In the UK, the land- fill tipping fee 5 is predicted to rise from £5 to £30 per tonne ($8 to $48) in 1993, to £10 to £45 per tonne ($16-$72) by the year 2000 (Petts, 1994). In Sweden, the average landfill disposal costs already equal the average WTE cost (All That Remains, 1993). Furthermore, certain areas are having trouble finding suitable sites for landfills. Areas with high water tables or high population densities are short of space. In the northeastern region of the US, a region with high population densities and strong environmental legislation, landfill tipping fees are 60% above the national average - see Figure 3 (Franklin Associates, 1994). Regions that have the available space are more frequently finding that local citizens do not want a landfill sited near them.
Assuming that landfill operators have a good sense of the costs of running such a facility - certainly a reasonable assumption - the per tonne tipping fee charged at the land- fill should provide a good estimate of the private production costs associated with processing a tonne of MSW through landfill disposal. High land acquisition costs, strict regula- tions on construction guidelines, post-closure monitoring costs, etc, should all be reflected in a higher landfill tipping fee. Similarly, economies of scale associated with a large landfill or energy benefits generated by burning off trapped methane gas 6 should drive down the per tonne tipping fee. Using data from Millock (1993); Petts (1994) and Franklin Associates (1994), we developed estimates of tipping fees in Sweden, the UK and the US. The German estimate was calculated based on a ratio of German to British tipping fees, as provided in Petts.
Table 9 shows the range of tipping fees for the four case study countries. The ranges provided typically represent the cost differences between old and new technologies. For the
5Landfills typically charge a certain amount per tonne of waste disposed of at the facility - called a landfill tipping fee. 6Approximately 6% of operating landfills in the US burn the methane gas they trap to produce energy (SRI International, 1992a, 1992b, 1992c). The energy can either be used for on-site needs or sold.
596 Waste not, want not: M L Miranda and B Hale
Table 9 Private production costs for landfill and WTE waste management approaches
Country Landfill tipping fees Private production cost (per tonne) of WTE a (per tonne)
Germany $ 48.39 $ 99.45-182.32 Sweden $15.38- 23.08 $ 53.85-61.54 United Kingdom $ 8.06-48.39 $ 80.40-90.91 United States $14.33- 54.01 $ 65.40-130.79
aCalculated from Table 4.
US, they also provide some insight regarding intra-country variability. It is also important to realize that these ranges are average values, and as such, tipping fees at any individual facility may be substantially higher or lower than the bounds on the range. For example, Union County, New Jersey paid $138 per ton for landfill disposal before the construction of a WTE facility, a far cry above the average tipping fee for the northeastern US of $49 (O'Connor, 1994).
Private production costs for W T E facilities
Similarly the tipping fee at a WTE facility should provide the best estimate of per tonne private production costs. Unfortunately, tipping fees were not available for all the case study countries. Instead, we converted our private produc- tion costs from earlier in the paper from cost per kilowatt hour to cost per tonne. Our private production costs estimates correspond well with known tipping fees at WTE facilities in the US and the UK. Based solely on private production costs, Table 9 demonstrates that landfilling is a cheaper waste management option on average.
External costs for landfills
Like fossil fuel combustion plants and WTE facilities, land- fills generate social environmental costs~ These externalities include both air emissions and water pollution from leach- ate. Although they do not emit gases from smokestacks, landfills do produce gas; and this gas does have an external cost. To prevent a dangerous build-up of this gas, landfills now generally collect the gas and release it safely into the atmosphere. (However, it should be noted that no collection system is able to capture 100%o of the gas produced.) The gas produced in a landfill consists mainly of methane which is a potent greenhouse gas with a warming potential twenty-five times that of carbon dioxide (Franklin Associates, 1994). To reduce the damage done by methane, some landfills have begun the practice of flaring the gas before releasing it, which essentially converts the methane to carbon dioxide. Recognizing the energy production potential of this gas, some of these landfills use it to produce electricity.
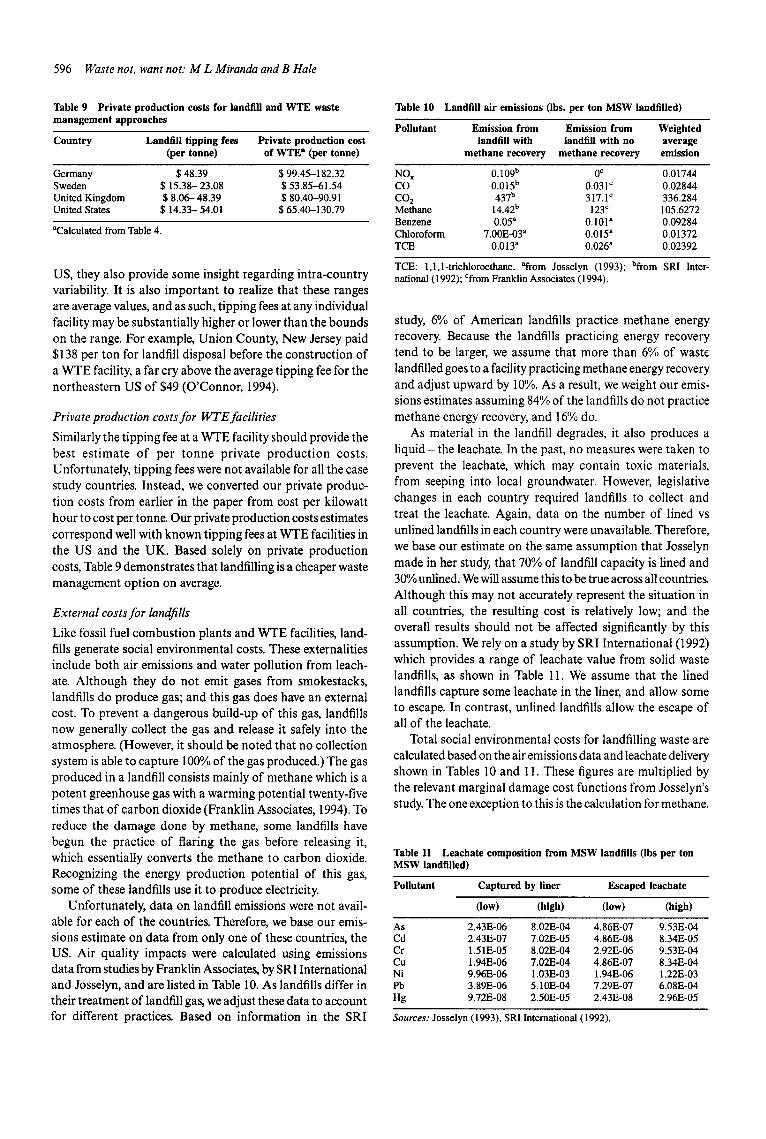
Unfortunately, data on landfill emissions were not avail- able for each of the countries. Therefore, we base our emis- sions estimate on data from only one of these countries, the US. Air quality impacts were calculated using emissions data from studies by Franklin Associates, by SRI International and Josselyn, and are listed in Table 10. As landfills differ in their treatment of landfill gas, we adjust these data to account for different practices. Based on information in the SRI
Table 10 Landfill air emissions (Ibs. per ton MSW landfilled)
Pollutant Emission from Emission from Weighted landfill with landfill with no average
methane recovery methane recovery emission
NO x 0.109 b 0 c 0.01744 CO 0.015 b 0.031 c 0.02844 CO 2 437 b 317.1c 336.284 Methane 14.42 b 123 c 105.6272 Benzene 0.05 a 0.101 a 0.09284 Chloroform 7.00E-03 a 0.015 a 0.01372 TCE 0.013 a 0.026 a 0.02392
TCE: 1,1,1-trichloroethane. ffrom Josselyn (1993); bfrom SRI Inter- national (1992); Cfrom Franklin Associates (1994).
study, 6% of American landfills practice methane energy recovery. Because the landfills practicing energy recovery tend to be larger, we assume that more than 6% of waste landfilled goes to a facility practicing methane energy recovery and adjust upward by 10%. As a result, we weight our emis- sions estimates assuming 84% of the landfills do not practice methane energy recovery, and 16% do.
As material in the landfill degrades, it also produces a liquid - the leachate. In the past, no measures were taken to prevent the leachate, which may contain toxic materials, from seeping into local groundwater. However, legislative changes in each country required landfills to collect and treat the leachate. Again, data on the number of lined vs unlined landfills in each country were unavailable. Therefore, we base our estimate on the same assumption that Josselyn made in her study, that 70% of landfill capacity is lined and 30% unlined. We will assume this to be true across all countrie~ Although this may not accurately represent the situation in all countries, the resulting cost is relatively low; and the overall results should not be affected significantly by this assumption. We rely on a study by SRI International (1992) which provides a range of leachate value from solid waste landfills, as shown in Table 11. We assume that the lined landfills capture some leachate in the liner, and allow some to escape. In contrast, unlined landfills allow the escape of all of the leachate.
Total social environmental costs for landfilling waste are calculated based on the air emissions data and leachate delivery shown in Tables 10 and 11. These figures are multiplied by the relevant marginal damage cost functions from Josselyn's study. The one exception to this is the calculation for methane.
Table 11 Leachate composition from MSW landfills (Ibs per ton MSW landfilled)
Pollutant Captured by liner Escaped leachate
(low) (high) (low) (high)
As 2.43E-06 8.02E-04 4.86E-07 9.53E-04 Cd 2.43E-07 7.02E-05 4.86E-08 8.34E-05 Cr 1.51E-05 8.02E-04 2.92E-06 9.53E-04 Cu 1.94E-06 7.02E-04 4.86E-07 8.34E-04 Ni 9.96E-06 1.03E-03 1.94E-06 1.22E-03 Pb 3.89E-06 5.10E-04 7.29E-07 6.08E-04 Hg 9.72E-08 2.50E-05 2.43E-08 2.96E-05
Sources: Josselyn (1993), SRI International (1992).
Waste not, want not." M L Miranda and B Hale 597
Table 12 Landfill external costs
Externality Cost range (per tonne MSW landfilled)
Air Emissions $ 2.42-13.16 Leachate $ 0.00-0.98 Total $ 2.42--14.14
Since Josselyn does not use an individual estimate for methane, we apply a marginal damage cost which was used in a recent study by Pearce and Brisson (1995) instead. Summing the impacts from air emissions and leachate, we arrive at a total estimated social environmental cost (Table 12). It is evident that a majority of a landfill's environmental impact arises from its air emissions.
External costs o f WTE
The external costs of WTE air emissions were covered earlier. In addition, WTE facilities must manage the toxic materials present in the ash residue. This ash is typically disposed of in a monofill. 7 Our analysis of the external costs associated with WTE ash revealed that there are no significant external costs associated with ash monofills. We based our analysis on a study completed by SRI International
7The characteristics of a monofill are different from those of a typical MSW landfill. Due to the ash's low organic content, there is no odor as associated with a MSW landfill, nor is there a food source for vermin, which are potential disease vectors. Incinerator ash does indeed contain high levels of heavy metals and other toxic materials, however leaching of these materials has not generally been shown to be a problem. Heavy metals leach typically under acidic conditions. By storing the ash in a monofill, acidic conditions are avoided, as the ash itself is typically basic. In his book on incinerator ash, Goodwin discusses the results of seven different field tests of ash monofill leachate (1993). He states that the 'actual field results prove that ash exhibits environmentally benign characteristics.' The studies show that levels of heavy metals in the lea- chate approximate the USEP?Cs primary drinking water standards Further, the results of another study presented in Goodwin indicate that the levels of heavy metals continue to drop with time, so that within a period of four years, most metals are not even above detection limits.
Table 13 Leachate Composition for an Ash monofill (Ibs per ton MSW)
Pollutant (low) (high)
As ND 3.89E-06 Cd ND 2.43E-07 Cr ND 4.86E-07 Cu ND ND Ni ND ND Pb ND 4.86E-07 Hg ND ND
Source: SRI International (1992). ND: not detected.
(1992) which looked at leachate from ash monofills. The leachate values, as summarized in Table 13, ranged from extremely low to not detectable. Using these results and Josselyn's marginal damage cost equations, we calculated external costs for ash monofills of less than 1 cent tonne- 1. This correlates well with the results listed in Goodwin (1993) (see footnote 6).
Comparing external costs for landfills and WTE
Table 14 compares the estimated social environmental costs for landfilling and WTE facilities. Since the landfill estimates are all based on the same data, there is no inter-country variation. The WTE estimates are converted to per tonne estimates from the values in Table 6. In Germany, Sweden and the US, the external costs for the two waste management options have overlapping ranges, indicating similar external costs. In the UK, WTE presents much greater external costs than landfills. This is once again due to the less stringent British air emission standards.
Comparing landfills and WTE
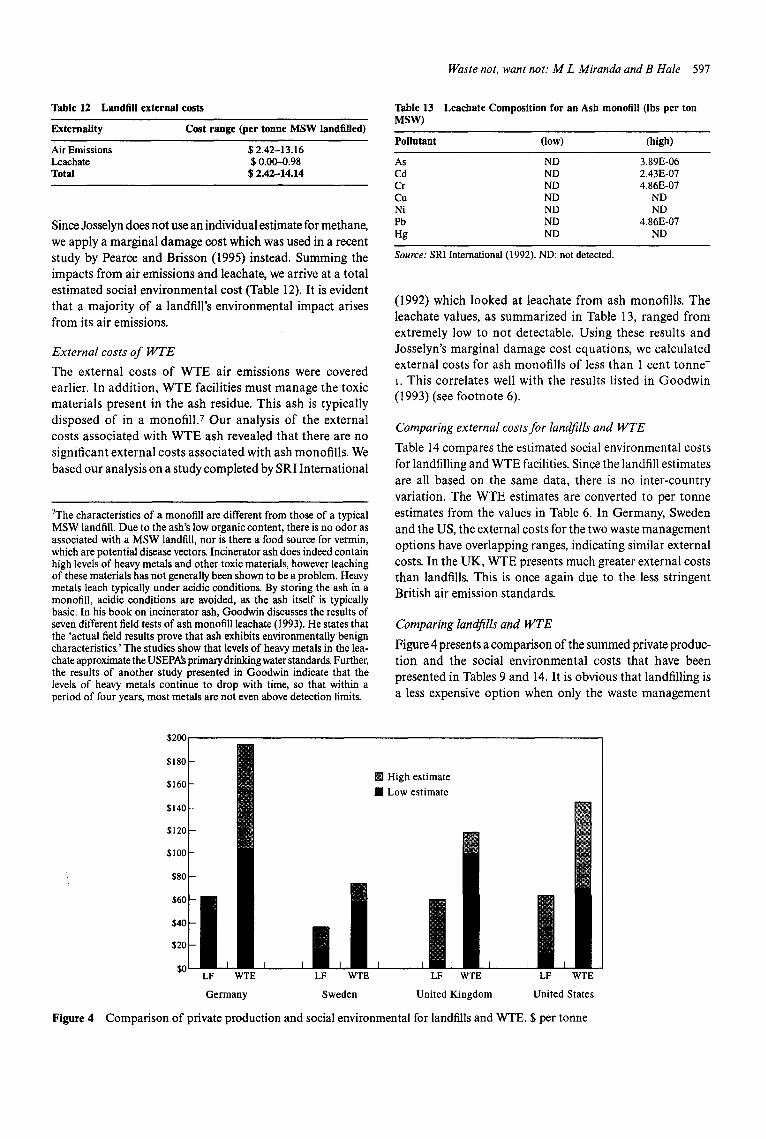
Figure 4 presents a comparison of the summed private produc- tion and the social environmental costs that have been presented in Tables 9 and 14. It is obvious that landfilling is a less expensive option when only the waste management
Figure 4
$200
$180
$160 • High estimate • Low estimate
$140
$120
$100
$80
$0 - LF WTE LF WTE LF WTE LF WTE
Germany Sweden United Kingdom United States
Comparison of private production and social environmental for landfills and WTE. $ per tonne
598 Waste not, want not: M L Miranda and B Hale
Table 14 External costs for landfill and WTE
Country Landfill (cost per tonne) WTE (cost per tonne)
Germany $ 2.42- 14.14 $ 5.17-13.73 Sweden $ 2.42- 14.14 $ 6.19-14.75 United Kingdom $ 2.42- 14.14 $ 22.94-31,50 United States $ 2.42- 14.14 $10.08-18.64
options are taken into consideration. This should come as no surprise, since landfilling, as we have already pointed out, is the more common waste management strategy. However, landfill tipping fees are expected to rise in the future. Furthermore, uncertainties about the value of external impacts, especially about the impact of methane on global climate, as well as the human health impacts from air toxics from incinera- tion, could also affect the actual costs of each option. Finally, WTE offers more than just an alternative waste manage- ment strategy. The next section of the paper bundles the waste management side with the energy production side for a more complete analysis of WTE.
Bringing the two objectives together
WTE facilities maintain two distinct objectives - producing energy and managing waste. As such, in order to fairly evalu- ate the competitiveness of the technology, both objectives must be considered simultaneously. To do this, we estimate the private production and externality costs for combusting one tonne of MSW in a WTE facility. We compare those costs to the private production and externality costs of land- filling one tonne of MSW and generating 578 kWh s of electric- ity in a fossil fuel-fired power plant.
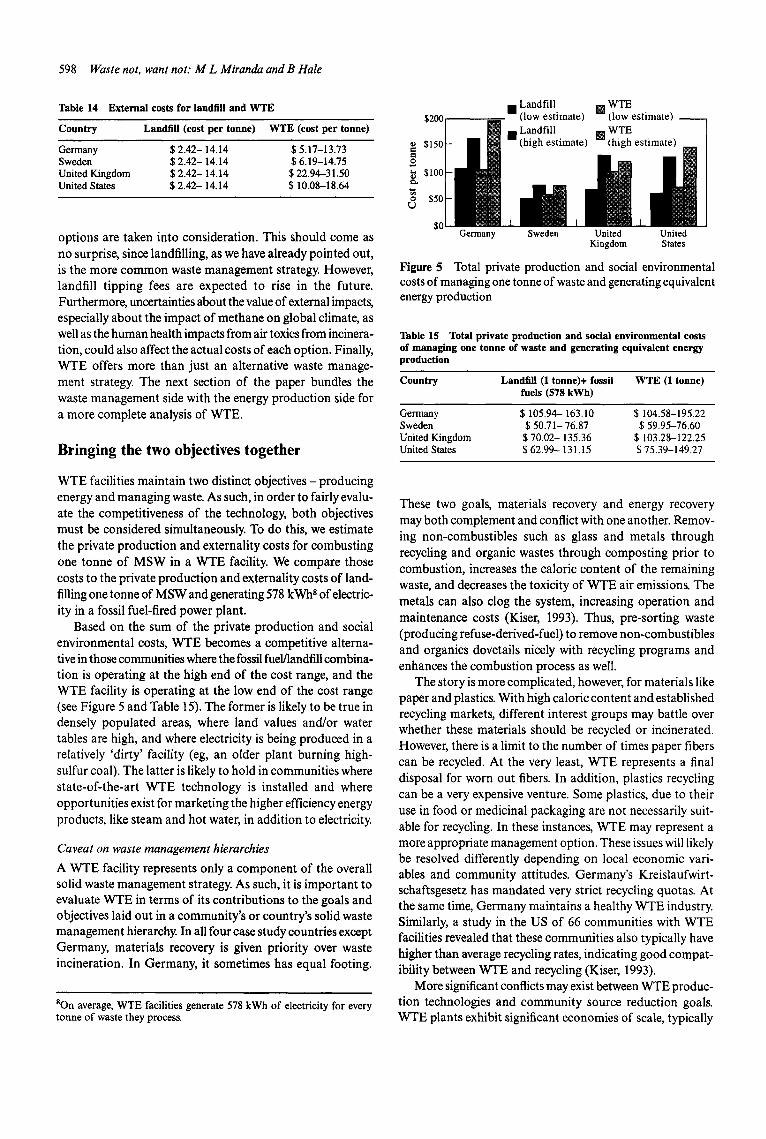
Based on the sum of the private production and social environmental costs, WTE becomes a competitive alterna- tive in those communities where the fossil fuel/landfill combina- tion is operating at the high end of the cost range, and the WTE facility is operating at the low end of the cost range (see Figure 5 and Table 15). The former is likely to be true in densely populated areas, where land values and/or water tables are high, and where electricity is being produced in a relatively 'dirty' facility (eg, an older plant burning high- sulfur coal). The latter is likely to hold in communities where state-of-the-art WTE technology is installed and where opportunities exist for marketing the higher efficiency energy products, like steam and hot water, in addition to electricity.
Caveat on waste management hierarchies
A WTE facility represents only a component of the overall solid waste management strategy. As such, it is important to evaluate WTE in terms of its contributions to the goals and objectives laid out in a community's or country's solid waste management hierarchy. In all four case study countries except Germany, materials recovery is given priority over waste incineration. In Germany, it sometimes has equal footing.
SOn average, WTE facilities generate 578 kWh of electricity for every tonne of waste they process
o r..)
$200
$150
$100
$50
so
i i Landfill [] WTE (low estimate) (low estimate)
U [] Landfill. [] WTE .
Germany Sweden United United Kingdom States
Figure 5 Total private production and social environmental costs of managing one tonne of waste and generating equivalent energy production
Table 15 Total private production and social environmental costs of managing one tonne of waste and generating equivalent energy production
Country Landfill (1 tonne)+ fossil WTE (1 tonne) fuels (578 kWh)
Germany $105.94- 163 .10 $104.58-195.22 Sweden $ 50.71- 76.87 $ 59.95-76,60 United Kingdom $ 70.02- 1 3 5 . 3 6 $103.28-122.25 United States $ 62.99- 131.15 $ 75.39-149.27
These two goals, materials recovery and energy recovery may both complement and conflict with one another. Remov- ing non-combustibles such as glass and metals through recycling and organic wastes through composting prior to combustion, increases the caloric content of the remaining waste, and decreases the toxicity of WTE air emissions. The metals can also clog the system, increasing operation and maintenance costs (Kiser, 1993). Thus, pre-sorting waste (producing refuse-derived-fuel) to remove non-combustibles and organics dovetails nicely with recycling programs and enhances the combustion process as well.
The story is more complicated, however, for materials like paper and plastics. With high caloric content and established recycling markets, different interest groups may battle over whether these materials should be recycled or incinerated. However, there is a limit to the number of times paper fibers can be recycled. At the very least, WTE represents a final disposal for worn out fibers. In addition, plastics recycling can be a very expensive venture. Some plastics, due to their use in food or medicinal packaging are not necessarily suit- able for recycling. In these instances, WTE may represent a more appropriate management option. These issues will likely be resolved differently depending on local economic vari- ables and community attitudes. Germany's Kreislaufwirt- schaftsgesetz has mandated very strict recycling quotas. At the same time, Germany maintains a healthy WTE industry. Similarly, a study in the US of 66 communities with WTE facilities revealed that these communities also typically have higher than average recycling rates, indicating good compat- ibility between WTE and recycling (Kiser, 1993).
More significant conflicts may exist between WTE produc- tion technologies and community source reduction goals. WTE plants exhibit significant economies of scale, typically
favoring large plants over small ones, and require a stable waste feedstock. This in turn requires either a large catch- ment area (and the ensuing equity concerns) or a small population generating substantial amounts of waste - run- ning counter to stated national goals of waste reduction. WTE may represent an interim opportunity to reduce the amount of waste a community landfills, while taking advantage of the resources still within the waste - mainly its caloric content. Once communities are able to achieve waste reduc- tion, the WTE plants may utilize other sources of fuel in the combustion process. Already, in Sweden, WTE plants burn not only waste, but also wood chips, coal and certain industrial wastes in times of high energy need. Considering the tighter emission standards associated with WTE facilities, this may provide a better alternative than a typical coal-fired combus- tion plant.
Conclusions
The task of evaluating the private production and social environmental costs of waste-to-energy facilities is a dif- ficult one. In order to evaluate critically the energy produc- tion and waste management objectives of waste-to-energy technologies, our analysis draws from the work of over thirty authors. Such analysis, which essentially bundles together the jointly produced products of energy production and waste management, provides a clearer picture of the relative competitiveness of waste-to-energy technologies.
In evaluating the externality impacts of fossil fuel-fired plants, landfills, and waste-to-energy plants, we were able to obtain reasonably good information on air and water qual- ity impacts, but were unable to assess aesthetic externalities associated with siting such facilities. Presumably, people would be less than enthusiastic about living near any of these sorts of facilities, but they may assign higher disamenity values to some over others. If so, we were unable to capture such dif- ferences in our analysis. We do know that large WTE plants, which take advantage of economies of scale, also require a larger catchment area. Thus, residents directly affected by the WTE plant may feel disproportionately burdened by the externalities - even more so, if the WTE plant receives waste from other communities to which nearby residents feel no loyalty. Decision-makers would be wise to address such equity concerns directly in determining whether a WTE plant is the right answer for a particular community.
In addition, much of the controversy surrounding waste combustion involves public concern regarding air toxics. This concern may result from a belief by the public that estimates of quantitative risk are flawed, that qualitative attributes of the risk (like equitability or voluntariness) are important and not being considered sufficiently well, and/or that uncertainty over potential interactive effects among chemicals should lead policy-makers to err on the side of extreme caution. All of these concerns are important, and again, are not captured well in this analysis.
These two important omissions notwithstanding, produc- ing energy from waste does not price-compete well with
Waste not, want not: M L Miranda and B Hale 599
producing energy from fossil fuels. However, communities do not choose WTE based on their energy needs. WTE plants are typically built based on a community's waste management needs. The question then becomes; do the waste management benefits gained from a WTE plant override the extra expense in producing energy to make the idea a viable option? The answer will depend on several factors. In general, WTE plants may represent a reasonable alternative, if several of the following conditions hold:
(1) Landfill private production costs are high. This typi- cally holds where land is expensive, and/or where the area is densely populated.
(2) Landfill externality costs are high. This typically holds where water tables are high and/or where landfill manag- ers are not recovering the energy available from methane emissions.
(3) Fossil fuel production and externality costs are high. This typically holds where older plants are burning dirtier fuels like coal.
(4) WTE private production costs are low. This typically holds in state-of-the-art facilities that are large enough to take advantage of the resulting economies of scale.
(5) WTE production processes are able to maximize energy efficiency. This typically holds in plants that can market either hot water or steam, in addition to electricity and where some pre-sorting has increased the per tonne caloric value of the waste.
(6) WTE externality costs are low. This typically holds where processes are in place to reuse ash, where state-of-the- art air pollution control technology has been installed and where pre-sorting minimizes the potential for air toxics release.
With an increasing supply of waste and increasing demand for energy, the markets for WTE energy products in our four case study countries are likely to grow. However, just as this paper analysed WTE within the broader context of energy production and waste management, communities must evalu- ate WTE within the context of local political, economic and environmental contexts. Goals and objectives regarding solid waste management, environmental impacts, production and consumption patterns, and the composition of energy produc- tion will all affect the suitability of waste-to-energy produc- tion technology.
References
All That Remains (1993) The Economist 29 May pp 2-18 ]~strand, L (1990). Municipal waste incineration - an environmentally
benign energy source for district heating. ASHRAE Transactions, II, 907-910.
Barnes, J (1995). Process for resolving ash issues. Solid Waste Technolo- gies. Sept~Oct, 00, 24-30.
Berenyi, E, & Gould, R (1993). Municipal waste combustion in 1993. Waste Age. Nov, 00, 51-56.
Bernow, S and Marron, D (1990) Valuation °fEnvir°nmentalExternali" ties for Energy Planning and Operations. May 1990 Update (Boston, MA: Tellus Institute, May 18)
Brisson, I (1993). Packaging waste and the environment: economics and policy. Resources, Conservation and Recycling, 8, 183-292.
600 Waste not, want not: M L Miranda and B Hale
Carlin, J (1994). The impact of flow control and tax reform on owner- ship and growth in the US Waste-to-energy industry. Monthly Energy Review. Sept, 00, xvii-xxvii.
Charles, M, & Kiser, J (1995). Waste to energy: 126 plants and still growing. MSW Management Elements, 00, 76-81.
Charles, M, & Kiser, J (1995). Waste-to-energy: benefits beyond waste disposal. Solid Waste Technologies. Industry Sourcebook, 00, 12-14.
Chernick, P and CaverhiU, E (1989) The Valuation of Externalities from Energy Production, Delivery, and Use: Fall 1989 Update A Report to the Boston Gas Co, Dee 29
Chessire, J (1993). Environmental impacts of electricity generation: some public policy dimensions, IEE Proceedings-A. Jan, 140(1), 47-52.
CSI Resource Systems, Inc (1995) Environmental Legislation And The Regulation Of Waste Management In Sweden NREL/TP-430-7976. May
CSI Resource Systems, Inc (1995) Integrated Solid Waste Management In Germany NREL/TP-430-7978. July
Curlee, T, Schexnayder, S, Vogt, D, Wolfe, A, Kelsay, M and Feldman, D (1994) Waste-to-Energy in the UnitedStates: A SocialandEconomic Assessment Quorum Books (Westport, CT)
Darcey, S (1993). NREL identifies means of reducing mercury emis- sions. World Wastes. Sept, 00, 10-11.
ECO Northwest et al (1986) 'Estimating environmental costs and benefits for five generating resources' Commissioned by Bonneville Power Administration. March
Franklin Associates, Ltd (1994) The Role Of Recycling In ISWM To The Year 2000 Keep America Beautiful, Inc. Sept
Friedrich, R, & Voss, A (1993). External costs of electricity generation. Energy Policy. Feb, 00, 114-122.
Friedrich, R, (0000) 'Externe kosten der electrizitfitserzeugung' (External costs of electricity production) Atomwirtschaft 40(2), 83-88
Goodwin, R, PhD (1993) Combustion AshlResidue Management: An Engineering Perspective (Park Ridge, New Jersey: Noyes)
Hilts, M (1994). WTE: Building a record of dependable waste disposal and environmental safety. Solid Waste Technologies. Sourcebook, 00, 12-16.
Hohmeyer, O (1989) Soziale Kosten des Energieverbrauchs (Social costs of energy use). (Berlin: Springer Verlag)
Holmes, J (1992) 'The marketing challenge facing incineration in the UK' Warmer Bulletinno 34. Aug and p 19. no 34. Aug, p 19
Kiser, J (1993). Recycling and WTE: working well together. Solid Waste and Power Sourcebook, 00, 12-20.
Johnke, B (1992). Waste incineration - an important element of the integrated waste management system in Germany. Waste Manage- ment and Research, 10, 303-315.
Josselyn, E (1993) The Environmental External Costs of Post- Consumer Recycling and WTE Combustion of Municipal Solid Waste Master's Thesis, Colorado School of Mines, Aug 23
Krupnick, A and Burtraw, D (1995) 'The social costs of electricity: do the numbers add up?' Sixty-fifth Annual Conference of the Southern Economic Association. New Orleans, LA Nov 18-20, Nov 18-20
McLeod, R (1993). Slow progress for power from renewables. Petroleum Review. May, 00, 217
Millock, K (1993). Packaging waste management in Sweden: a product charge. Resources, Conservation and Recycling, 10, 349-375.
Murphy, M (1995). Using fluidized bed boilers for burning refuse- driven fuel. Solid Waste Technologies. Sept/Oct, 00, 32-40.
Niessen, W (1993). Municipal waste combustors: environmentally sound power plants. Solid Waste and Power Jan~Feb, 00, 12-16.
NREL (1995) Integrated Solid Waste Management of Springfield, MA NREL/TP-430-8137. November
NREL (1995) Integrated Solid Waste Management of Minneapolis, MN NREL/TP-430-20473. November
NUTEK (1995) Energy in Sweden O'Connor, J (1994). Building a truly integrated waste management
system. Solid Waste Technologies. JullAug, 00, $2-S 10. Office of electricity regulation (1996) Fossil Fuel Levy Reduced R34/96.
16 July Oslo Roundtable (1995) 'The environment policy concept of the closed
substance cycle and Waste Management Act (1995): a German Presenta- tion' Oslo Roundtable Conference on Sustainable Production and Consumption. Feb http:llwww.statkart.nolmdlhtmlltysk.htm
Ottinger, R et al (1990) Environmental Costs of Electricity Pace University Center for Environmental Legal Studies (New York: Oceana Publica- tions)
Pearce, D, Bann, C and Georgiou, S (1992) The Social Costs of Fuel Cycles CSERGE. London
Pearce, D W, Brisson, I (1995) 'The economics of waste management' Waste Treatment and Disposal lssues in Environmental Science and Technology Vol 3, pp 131-152. Royal Society of Chemistry. Cambridge, UK
Petts, J (1994) 'Incineration as a waste management option' Waste Incinera- tion and the Environment. Issues in Environmental Science and Technol- ogy Vol 2, pp 1-25. Royal Society of Chemistry. Cambridge, UK
Porteous, A (1993). Developments in and environmental impacts of electricity generation from MSW and landfill gas combustion, lEE Proceedings-A, 140(1), 86-93.
Randall, D (1994) An Evaluation of the Cost of Incinerating Wastes Containing PVC ASME-CRTD Vol 31
Reichel, H, & Schirmer, U (1989). Waste incineration plants in the FRG. Werkstoffe und Korrosion. Mar, 00, 135-141.
Rhyner, C, Schwartz, L, Wenger, R and Kohrell, M (1995) Waste Manage- ment and Resource Recovery Boca Raton, Florida. CRC Press
Rigo, H (1995). Sources of dioxin in the environment. Solid Waste Technologies. Jan/Feb, 00, 36--39.
Schmitt-Tegge, J (1991). Stellenwert der mfillverbrennung (value of waste incineration). VGB Kraftwerktechnik, 71(8), 772-775.
SRI International (1992) 'Data summary of MSW management alterna- tives' Vol I. Report Text. NREL/TP-431-4988A. Oct
Starfelt, N (1994), External Costs of Electricity Generation in Sweden Uranium and Nuclear Energy." Proceedings of the International Symposium held by the Uranium Institute Vol 19, pp 152-159
Steuteville, R (1995). The state of garbage in America. Biocycle. May, 00, 30--41.
Sullivan, P, Hallenbeck, W and Brenniman, G (1993) Municipal Solid Waste Combustion University of Illinois at Chicago. Aug
US Congress (1994) Office of Technology Assessment Studies of the Environmental Costs of Electricity OTA-ETI-134, U.S. Government Printing Office. Washington DC. Sept
United States Environmental Protection Agency (1995) 'Characterization of municipal solid waste in the United States: Update' http:llwww.epa.govl docslOSWRCRAlnon-hwlmuncpYMSWrpt951msw95.txt.html
World Resources Institute and the International Institute for Environ- ment and Development. (1988) World Resources 1988-89 (New York: Basic Books), p 314