waste need assessment
TRANSCRIPT

Waste Need Assessment
London Borough of Barking and Dagenham
Be First
June 2021

Waste Need Assessment
Prepared for: Be First
AECOM
Quality information
Prepared by Checked by Verified by Approved by
Emma Copley
Resources & Waste
Consultant
Rebecca Maskrey Senior Resources &
Waste Consultant
Mike Bains
Technical Practice Lead,
Resources, Materials and
Waste
Mike Bains
Technical Practice Lead,
Resources, Materials and
Waste
Revision History
Revision Revision date Details Authorized Name Position
P01 12.02.2021 First Draft 12.02.2021 Mike Bains Technical Practice
Lead
P02 16.06.2021 Final Issue 16.06.2021 Kat Lees Associate Director
Distribution List
# Hard Copies PDF Required Association / Company Name
0 Provided Be First
Waste Need Assessment
Prepared for: Be First
AECOM
Prepared for:
Be First
Prepared by:
Emma Copley
Resource and Waste Management Consultant
AECOM Limited
Sunley House
4 Bedford Park, Surrey
Croydon CRO 2AP
United Kingdom
T: +44 20 8639 3500
aecom.com
© 2021 AECOM Limited. All Rights Reserved.
This document has been prepared by AECOM Limited (“AECOM”) for sole use of our client (the “Client”) in
accordance with generally accepted consultancy principles, the budget for fees and the terms of reference
agreed between AECOM and the Client. Any information provided by third parties and referred to herein has not
been checked or verified by AECOM, unless otherwise expressly stated in the document. No third party may rely
upon this document without the prior and express written agreement of AECOM.

Waste Need Assessment
Prepared for: Be First
AECOM
Table of Contents
Glossary of Terms ...................................................................................................... 1
Table of Abbreviations ................................................................................................ 3
1. Introduction ...................................................................................................... 4
Context ............................................................................................................................................... 4
Scope and Aims .................................................................................................................................. 4
Structure ............................................................................................................................................. 4
2. Policy Context.................................................................................................. 5
Introduction ......................................................................................................................................... 5
EU Legislation ..................................................................................................................................... 5
2.2.1 Waste Framework Directive (2008) ...................................................................................................... 5
2.2.2 Landfill Directive (1999) ....................................................................................................................... 6
2.2.3 Circular Economy Package (2020) ....................................................................................................... 6
National Policy .................................................................................................................................... 7
2.3.1 National Planning Policy for Waste (NPPW) (2014) .............................................................................. 7
2.3.2 National Planning Policy Framework (NPPF) (2019) ............................................................................. 8
2.3.3 National Planning Practice Guidance: Waste (NPPG) (2015) ................................................................ 8
2.3.4 The UK Industrial Strategy White Paper: Building a Britain Fit for the Future (2017)............................... 9
2.3.5 Our Waste, Our Resources: A Strategy for England (2018) ................................................................... 9
2.3.6 A Green Future: Our 25 Year Plan to Improve the Environment (2018) ................................................ 10
2.3.7 Waste Management Plan for England (2021) ..................................................................................... 10
Regional Policy ................................................................................................................................. 10
2.4.1 The Publication London Plan (2020) .................................................................................................. 10
Local Policy ...................................................................................................................................... 11
2.5.1 Barking and Dagenham Local Plan (2010) ......................................................................................... 11
2.5.2 The Joint Waste Development Plan Document (2012) ........................................................................ 12
2.5.3 The emerging Barking and Dagenham Local Plan (2020) ................................................................... 13
Summary .......................................................................................................................................... 14
3. Forecasting Waste Arisings ........................................................................... 16
Introduction ....................................................................................................................................... 16
Household, Industrial and Commercial Waste .................................................................................... 17
3.2.1 Context ............................................................................................................................................. 17
3.2.2 Current Arisings ................................................................................................................................ 17
3.2.3 Future Arisings .................................................................................................................................. 17
Construction, Demolition and Excavation Waste ................................................................................. 19
3.3.1 Context ............................................................................................................................................. 19
3.3.2 Current Arisings ................................................................................................................................ 19
3.3.3 Future Arisings .................................................................................................................................. 19
Other waste streams ......................................................................................................................... 20
3.4.1 Hazardous Waste .............................................................................................................................. 20
3.4.2 Agricultural Waste ............................................................................................................................. 21
3.4.3 Wastewater ....................................................................................................................................... 21
3.4.4 Low Level Radioactive Waste ............................................................................................................ 22
4. Waste Capacity Assessment ......................................................................... 23
Waste Activities and Facilities ............................................................................................................ 23
Current Capacity ............................................................................................................................... 24
4.2.1 Methodology ..................................................................................................................................... 24
4.2.1.1 Waste Management Facility Capacity ............................................................................................. 24
4.2.1.2 Waste Transfer Station Capacity .................................................................................................... 24
4.2.1.3 Permit Exempt Sites ...................................................................................................................... 24
Waste Need Assessment
Prepared for: Be First
AECOM
4.2.2 Results ............................................................................................................................................. 25
4.2.2.1 HIC Apportionment ........................................................................................................................ 25
CD&E Waste .................................................................................................................................................. 27
Future Capacity................................................................................................................................. 28
4.3.1 Safeguarded Sites............................................................................................................................. 28
4.3.2 Safeguarded Land............................................................................................................................. 30
4.3.3 Capacity to be Determined ................................................................................................................ 30
Future Need for Waste Management Facilities ................................................................................... 33
4.4.1 HIC Waste ........................................................................................................................................ 33
4.4.2 CD&E Waste ..................................................................................................................................... 33
5. Imports and Exports ...................................................................................... 34
Introduction ....................................................................................................................................... 34
Imports ............................................................................................................................................. 34
5.2.1 Methodology ..................................................................................................................................... 34
5.2.2 Results ............................................................................................................................................. 34
Exports ............................................................................................................................................. 36
5.3.1 Results ............................................................................................................................................. 36
Imports and Exports Summary ........................................................................................................... 37
6. Conclusions and Recommendations ............................................................. 38
The Need for Future Waste Capacity ................................................................................................. 38
6.1.1 HIC Waste ........................................................................................................................................ 38
6.1.2 CD&E Waste ..................................................................................................................................... 38
6.1.3 Other Waste Streams ........................................................................................................................ 38
6.1.4 Imports and Exports .......................................................................................................................... 38
7. Future Trends and Potential Impacts ............................................................. 39
8. References .................................................................................................... 41
Appendix A Additional Legislation and Policies ...................................................... 44
Barking and Dagenham Local Plan (2010) ....................................................................................................... 44
London Plan (2016) ........................................................................................................................................ 44
Appendix B Description of European Waste Code (EWC) Categories ................... 46
Appendix C Full List of Permitted Waste Management Facilities and their Capacity 47
Appendix D Full List of Exempt Waste Management Facilities and their Capacity 52
Appendix E Full methodology ................................................................................ 54
Figures
Figure 2.1 The Waste Hierarchy ....................................................................................................................... 5 Figure 3.1 Forecasted Apportionment Tonnages ............................................................................................. 18 Figure 3.2 Forecasted CD&E Arisings ............................................................................................................. 20 Figure 4.1 Current HIC Waste Management Capacity in LBBD ........................................................................ 26 Figure 4.2 Current CD&E Management Capacity in LBBD ............................................................................... 27 Figure 4.3 Safeguarded Land within LBBD for the Development of Waste Management Facilities .................... 31 Figure 5.1 Origin Regions of Waste Imported to Waste Management Facilities in LBBD between 2015 and 2019
...................................................................................................................................................................... 35 Figure 5.2 Type of Waste Imported into Waste Management Facilities in LBBD between 2015 and 2019 .......... 35 Figure 5.3 Destination Regions of Waste Exported from Waste Management Facilities in LBBD between 2015
and 2019 ........................................................................................................................................................ 36 Figure 5.4 Type of Waste Exported from Waste Management Facilities in LBBD between 2015 and 2019......... 37

Waste Need Assessment
Prepared for: Be First
AECOM
Tables
Table 2.1 Relevant Articles provided within the WFD ......................................................................................... 5 Table 2.2 Paragraphs of the NPPW relevant to this Assessment ........................................................................ 7 Table 2.3 Relevant Paragraphs provided within the NPPG................................................................................. 8 Table 2.4 Publication London Plan Policies Relevant to this Assessment ......................................................... 11 Table 2.5 Key Objectives, Policies and Justification Paragraphs in the LBBD Core Strategy ............................. 12 Table 2.6 ELWA Anticipated Capacity Surplus and Deficits .............................................................................. 13 Table 2.7 Relevant Policies found within the Joint Waste DPD ......................................................................... 13 Table 2.8 GLA Draft Local Plan Consultation Response................................................................................... 14 Table 2.9. Draft Paragraphs and Policies of the Reg 19 Draft LBBD Local Plan Applicable to this Assessment .. 14 Table 3.1 Forecast Arisings and Apportionment Tonnages for HIC Waste taken from the Publication London Plan
...................................................................................................................................................................... 17 Table 3.2 Apportionment Tonnages for 2021 to 2026 ....................................................................................... 17 Table 3.3 CD&E Waste Arising from LBBD over the Past 5 Years (Tonnes) ...................................................... 19 Table 3.4 Forecasted CD&E Waste Arising from LBBD in the Period 2020 to 2026 ........................................... 20 Table 3.5 Significant Planned Developments in LBBD between 2021 and 2025 ................................................ 20 Table 3.6 Current and Forecasted Hazardous Waste Arising from LBBD in the period 2020 to 2026 ................. 21 Table 3.7 Agricultural Waste Arisings Recorded within LBBD over the Past 5 Years (Tonnes) ........................... 21 Table 3.8 Description of the Categories for Radioactive Waste ........................................................................ 22 Table 4.1 Description of Waste Management Activities within London ............................................................... 23 Table 4.2 Current HIC Waste Management Capacity in LBBD ......................................................................... 25 Table 4.3 Current CD&E Management Capacity in LBBD ................................................................................ 27 Table 4.4 Safeguarded Waste Management Facilities within LBBD .................................................................. 29 Table 4.5 Safeguarded Land within LBBD to be used for the Development of New Waste Management Facilities
...................................................................................................................................................................... 30 Table 4.6 Planning Applications for Waste Development in LBBD ..................................................................... 32 Table 4.7 Summary of Capacity Available for 2026 HIC Apportionment compared to the Apportionment Target . 33 Table 4.8 Summary of 2026 Capacity Available for CD&E Waste compared to the Forecasted Arisings ............. 33 Table 5.1. Split between the Origin of Waste Received by Waste Management Facilities in LBBD between 2015
and 2019 ........................................................................................................................................................ 34 Table 5.2 Split between the Destination of the Waste Exported by Waste Management Facilities in LBBD
between 2015 and 2019 .................................................................................................................................. 36 Table 8.1 Description of Recovery and Disposal (R&D) Codes ........................................................................ 55

Prepared for: Be First
AECOM 1
Glossary of Terms Term Definition
Aggregates Coarse material used in construction (can include sand, gravel, crushed stone and
recycled concrete).
Agricultural Waste Waste from premises used for agriculture within the meaning of the Agricultural Act
1947.
Anaerobic Digestion Anaerobic digestion is the process of using microorganisms to break down organic waste (e.g. food waste) in the absence of oxygen to produce biogas and fertilising
material.
Apportionment Targets The amount of waste that each London Borough needs to be prepared to manage in
future years as set by the Mayor of London within the London Plan.
Biodegradable Waste Any waste organic matter than can be broken down into carbon dioxide, water,
methane or other simple organic molecules by microorganisms.
Bulky Waste Waste that is too large to be accepted by regular waste collection (i.e. white goods,
mattresses etc.).
Circular Economy An economic system of closed loops in which products lose as little of their value as possible. In contrast to the take-make-dispose linear model, a circular economy is
regenerative by design and aims to gradually decouple growth from the
consumption of finite resources.
Clinical Waste Waste produced from healthcare and similar activities that may pose a risk of
infection (for example, swabs, bandages and dressings).
Commercial and Industrial (C&I)
Waste
Waste generated by retail units, offices, and any other business, trade or factory use. Some C&I waste is collected by local authorities, however the majority is
collected by private waste collection companies.
Construction, Demolition and
Excavation (CD&E) Waste
Waste produced by construction, demolition or excavation activities.
Courtauld Commitments Series of 10-year voluntary agreements aimed at identifying priorities, developing solutions and implementing changes to cut the carbon and waste associated within food and drink. The first commitment was launched in 2005, with the most recent
commitment running up to 2025.
Deposit Return Scheme (DRS) A small deposit will be added to the price of a drinks container brought to a store. Once the container has been used, the consumer will dispose of it in a reverse
vending machine and the deposit will be returned to the consumer.
East London Waste Authority (ELWA) Statutory waste disposal authority (WDA) responsible for the disposal of waste collected by the London Boroughs of Barking and Dagenham, Havering, Newham
and Redbridge.
Energy Recovery / Energy from
Waste (EfW)
Any type of process which generates either heat or power from the combustion of
waste.
European Waste Catalogue (EWC) A standard coding system used to identify the type of waste stream. EWC codes
have been transposed into UK legislation through the List of Wastes Regulations.
Evidence Base Includes a number of studies, assessments and background documents that inform
the development of a new Local Plan.
Extended Producer Responsibility
(EPR)
A policy approach through which a producer’s responsibility for a product is extended to the post-use stage. This incentivises producers to design their products
to make it easier for them to be reused, dismantled and/or recycled at end of life.
Food Waste Any food, and inedible parts of food removed from the food supply chain to be
recovered or disposed.
Garden Waste Waste generated from the garden (for example grass clippings, branches and
weeds).
Hazardous Waste Waste is generally considered hazardous if it (or the material or substances it contains) are harmful to humans or the environment. This can be determined on
the basis of either a) the source of waste (some types of waste are always deemed
to be hazardous) or b) the concentration of hazardous substances within the waste.
Household Waste Waste from domestic properties including waste from residual refuse collections, material collected for recycling and composting, plus waste from educational
establishments, nursing and residential homes and street cleansing waste.

Prepared for: Be First
AECOM 2
Term Definition
Local Authority Collected Waste
(LACW)
Household and commercial and industrial waste collected by the local authority. Includes waste streams such as recyclable materials, food waste and residual
waste as well as clinical waste, garden waste and bulky waste items (i.e. mattresses
or white goods).
Municipal Waste Household waste and waste similar in nature and composition to household waste.
Proximity Principle Waste should be disposed of as close to its place of origin as possible. The proximity principle is defined within the EU Waste Framework Directive
(2008/98/EC).
Radioactive Waste Waste which falls within the scope of the Radioactive Substances Act 1993.
Recovery and Disposal Code Coding system used to describe a treatment or disposal option. Recovery and
disposal codes are defined within the EU Waste Framework Directive (2008/98/EC).
Recyclable Waste Materials that can be processed and used to create new products.
Refuse Derived Fuel (RDF) Consists of residual waste that is subject to a contract with an end-user for use as a fuel in an energy from waste facility. The contract must include the end-user’s technical specifications relating as a minimum to the calorific value, the moisture
content, the form and quantity of the RDF.
Regulation 19 Stage Regulation 19 Stage is the second stage of the consultation process when forming a Local Plan. This stage of the consultation process provides local communities, businesses and other interested stakeholders with a chance to comment on the
draft policy content of the new Local Plan.
Residual Waste The remaining part of the waste stream excluding any source-segregated materials
(also known as non-recyclable waste/general waste).
Safeguarded Sites Areas and sites which may be required to serve development needs in the long
term.
Secondary Materials Wastes which have been recovered to the point where they are no longer waste, or by-products from a manufacturing process, which can be used in place of virgin raw
materials.
Self-Sufficiency Principle Requires that most waste should be treated or disposed of within the region it was produced. The self-sufficiency principle is defined within the EU Waste Framework
Directive (2008/98/EC).
Site Waste Management Plan (SWMP) / Construction Resource
Management Plan (CRMP)
A plan which details the amount and type of waste that will be generated as a result of construction, demolition and excavation activities. The plan will also include
details on the management of the waste that is generated.
Waste Capacity The volume of waste each facility or region can process.
Waste Hierarchy The waste hierarchy ranks waste management practices according to what is best
for the environment i.e. Prevention, Re-use, Recycling, Recovery, Disposal.
Waste Management Facility Any site used to store, treat, recover, process or dispose of waste.
Waste Needs Assessment Identifies the waste management capacity that will be needed during a certain period of time as well as assessing the existing facilities available to manage this
waste. A Waste Needs Assessment also considers the needs for additional facilities
to manage the forecast requirements.
Waste Planning Authorities The local authority responsible for waste development, planning and control. The role of waste planning authority is held by county councils, unitary authorities and
national park authorities.
Wastewater Water that has been contaminated by use in the home, business or as part of an
industrial process.

Prepared for: Be First
AECOM 3
Table of Abbreviations Abbreviation Term
AD Anaerobic Digestion
C&I Commercial and Industrial
CD&E Construction, Demolition and Excavation
Defra Department for Environment, Food and Rural Affairs
DPD Development Plan Document
DRS Deposit Return Scheme
EA Environment Agency
EfW Energy from Waste
ELWA East London Waste Authority
ELWP East London Waste Plan
EPR Extended Producer Responsibility
EU European Union
EWC European Waste Code
GBq Giga-becquerel
GLA Greater London Authority
HIC Household, Industrial and Commercial
HLW High Level Waste
ILW Intermediate Level Waste
IVC In Vessel Composting
LACW Local Authority Collected Waste
LBBD London Borough of Barking and Dagenham
LDF Local Development Framework
LLW Low Level Waste
MRF Material Recycling Facility
MSW Municipal Solid Waste
NPPF National Planning Policy Framework
NPPG National Planning Practice Guidance
NPPW National Planning Policy for Waste
R&D Code Recovery and Disposal Code
RDF Refuse Derived Fuel
Reg Regulation
SRF Solid Recovered Fuel
tpa Tonnes per annum
UK United Kingdom
VLLW Very Low Level Waste
WDI Waste Data Interrogator
WFD Waste Framework Directive
WMP Waste Management Plan
WPA Waste Planning Authority
WTS Waste Transfer Station

Prepared for: Be First
AECOM 4
1. Introduction
Context
Scope and Aims 1.1 This assessment is intended to update London Borough of Barking and Dagenham’s (LBBD’s) waste
needs assessment in order to supplement the evidence base of the Barking and Dagenham Draft Local
Plan 2019-37, which is currently at Regulation 19 stage (Ref 1).
1.2 The 2012 Joint Waste Development Plan Document (DPD) for the East London Authority Boroughs,
generally referred to as the East London Waste Plan (ELWP) covers the management of waste in the
ELWA up until 2021. The review of the ELWP is currently at an early stage and it is anticipated that it will
be adopted in the next two - three years. As part of the preparation of the draft ELWP, the four East
London waste authorities responsible for preparing the Plan – LBBD, LB Newham, LB Havering and LB
Redbridge – will prepare a comprehensive evidence base which will demonstrate that each borough can
meet the apportionment targets and tonnages set out in the Publication Plan. This assessment will
therefore also form the basis of LBBD’s input into the draft ELWP.
1.3 Additionally, this assessment identifies existing capacity within the borough for all waste streams with a
focus in particular upon whether there is current and future capacity to meet the Greater London
Authority’s (GLA) apportionment targets and tonnages for household, commercial and industrial (HIC)
waste set out in the Publication London Plan (Ref 2), published in December 2020. Further to this, the
assessment also provides clarification of whether any of the waste management facilities listed within the
ELWP 2012 (Ref 3) have been lost and identifies what (if any) waste management sites are likely to be
delivered in the short term period to 2026.
1.4 The waste needs assessment therefore covers an interim period between now and when the revised
ELWP is adopted (no later than 2026).
Structure 1.5 The remainder of this report is structured as follows:
• A review of the relevant European Union (EU), national, regional and local waste legislation and
policy;
• Calculation of the current and future HIC, CD&E, radioactive, agricultural and hazardous waste
arisings;
• Assessment of the current capacity provided by the existing waste management facilities in LBBD;
• Identification of any future waste management facilities to be built within LBBD;
• Identification of any waste management capacity gaps and if there is a need for any additional waste
management facilities in LBBD;
• Calculation of the amount of waste being imported and exported from waste management facilities in
LBBD; and
• A summary of the findings, recommendations and future trends.

Prepared for: Be First
AECOM 5
2. Policy Context
Introduction 2.1 The evidence base for the Barking and Dagenham Draft Local Plan and the ELWP must comply with the
relevant EU, national, regional and local planning and waste policy, described within this section.
EU Legislation
2.2.1 Waste Framework Directive (2008)
2.2 Historically waste management in the United Kingdom (UK) has been significantly driven by EU policy.
The Waste Framework Directive (2008/98/EC) (WFD) [75/442/EEC] (Ref 4) is the principal EU legislation
for waste, setting out the basic concepts and definitions related to waste management.
2.3 The WFD is underpinned by a key principle, known as the waste hierarchy (as set out in Article 4 of the
WFD and shown on Figure 2.1), which requires that member states manage waste as near to the top of
the hierarchy (i.e. waste prevention) as possible, with disposal of waste being the last resort. Article 4
states that the waste hierarchy shall apply as a priority order in waste prevention and management
legislation and policy, and that member states shall take measures to encourage the options that deliver
the best overall environmental outcome.
Figure 2.1 The Waste Hierarchy
2.4 Table 2.1 provides a description of the other relevant articles provided within the WFD.
Table 2.1 Relevant Articles provided within the WFD
Article Description
Article 13: Protection of Human Health and the
Environment
Requires that waste be managed by means which do not endanger human health or the environment – in particular, without risk to water, air, soil, plants or animals, without causing a nuisance through noise or odours, and without adversely affecting the countryside or places of
special interest.
Article 16: Principles of Proximity and Self-
Sufficiency
• Requires that appropriate measures are taken to “establish an integrated and adequate network of waste disposal installations and of installations for the recovery of mixed municipal waste collected from private households, including where such collection also
covers such waste from other producers, taking into account best available techniques.”

Prepared for: Be First
AECOM 6
• States that this network shall be designed to enable the community as a whole to become
self-sufficient in waste disposal.
Article 28: Waste
Management Plans
• Requires authorities to produce Waste Management Plans, which “set out an analysis of the current waste management situation in the geographical entity concerned, as well as the measures to be taken to improve environmentally sound preparing for re-use, recycling, recovery and disposal of waste and an evaluation of how the plan will support
the implementation of the objectives and provisions of this Directive”.
• States that the Waste Management Plans must contain:
─ The type, quantity and source of waste generated within the territory, the waste likely to be shipped from or to the national territory, and an evaluation of the development of
waste streams in the future;
─ Existing waste collection schemes and major disposal and recovery installations, including any special arrangements for waste oils, hazardous waste or waste streams
addressed by specific community legislation;
─ An assessment of the need for new collection schemes, the closure of existing waste installations, additional waste installation infrastructure in accordance with Article 16,
and, if necessary, the investments related thereto;
─ Sufficient information on the location criteria for site identification and on the capacity
of future disposal or major recovery installations, if necessary; and
─ General waste management policies, including planned waste management technologies and methods, or policies for waste posing specific management
problems.
2.5 Directive (EU) 2018/851 (Ref 5) amends the Waste Framework Directive and, amongst other measures,
requires that Member States must implement measures to increase the reuse and recycling rate for
municipal waste; which must be a minimum of 55% by weight by 2025, 60% by 2030, and 65% by 2035.
2.2.2 Landfill Directive (1999)
2.6 The Landfill Directive (1999/31/EC) (Ref 6) (brought into force in 1999 and implemented in 2001),
regulates waste management of landfills in the EU. The Directive’s primary objective is to prevent or
minimise as far as possible, the negative effects on the environment from the landfilling of waste, in
particular on surface water, groundwater, soil, air, and human health, by introducing stringent technical
requirements for waste and landfills (relating to their location, design, construction and operation).
2.7 Directive (EU) 2018/850 (Ref 7) amends the Landfill Directive and requires Member States to significantly
reduce waste disposal by landfilling. This will prevent detrimental consequences for human health and the
environment, and ensure that economically valuable waste materials are recovered through proper waste
management and in line with the waste hierarchy. Member States will be required to ensure that, as of
2030, waste suitable for recycling or other recovery, in particular that which is contained in municipal
waste, will not be permitted to be disposed of to landfill. Use of landfills should remain exceptional rather
than the norm. Furthermore, the Member States must take the necessary measures to ensure that by
2035, the amount of municipal waste disposed of in landfills is reduced to 10% or less of the total amount
of municipal waste generated by 2035.
2.2.3 Circular Economy Package (2020)
2.8 The Circular Economy Package (CEP) (2020) is a revised legislative framework on the circular economy
which identifies steps for reducing the amount of waste generated and establishes a long-term path for the
management of waste and increasing the recycling rate. The measures introduced in the 2020 CEP have
been transposed into UK legislation.
2.9 The CEP makes significant changes to the following Directives:
• Directive 2008/98/EC on waste (Waste Framework Directive (WFD)) – amended by Directive (EU)
2018/851;
• Directive 94/62/EC on Packaging and Packaging Waste (PPWD) (Ref 8) – amended by Directive
(EU) 2018/852 (Ref 9); and
• Directive 1999/31/EC on the Landfill of Waste (LFD) – amended by Directive (EU) 2018/850;
2.10 The following Directives have also been amended by Directive (EU) 2018/849 (Ref 10) but the changes
are relatively minor and have therefore not been transposed into UK legislation.
• Directive 2000/53/EC on End-of-Life Vehicles (ELV) (Ref 11);

Prepared for: Be First
AECOM 7
• Directive 2006/66/EC on Batteries and Accumulators and Waste Batteries and Accumulators
(BAWBA) (Ref 12); and
• Directive 2012/19/EU on Waste Electrical and Electronic Equipment (WEEE) (Ref 13)
2.11 Also as part of the CEP, the EU has implemented a new Action Plan (Ref 14) in March 2020. The new
Action Plan contains initiatives to promote circular economy processes along the whole life-cycle of
products, and aims to keep resources in the economy for as long as possible. The following measures are
also included in the new Action Plan:
• Making sustainable products the norm in the EU;
• Empowering consumers and public-buyers;
• Focusing on sectors which use the most resources and have a high potential for circularity (i.e. IT,
construction, batteries and vehicles);
• Generating less waste and more value;
• Making circularity work for people, regions and cities; and
• Leading global efforts on circular economy.
National Policy
2.3.1 National Planning Policy for Waste (NPPW) (2014)
2.12 The National Planning Policy for Waste (NPPW) (Ref 15), published in October 2014, sets out the
government's detailed waste planning policies. The NPPW outlines the approach to be taken with regard
to:
• using a proportionate evidence base in preparing Local Plans;
• identifying the need for waste management facilities in preparing Local Plans;
• identifying suitable sites and areas in preparing Local Plans;
• determining planning applications; and
• monitoring and reporting, to inform Local Plan preparation and planning application determination.
2.13 Table 2.2 describes the information contained in each paragraph of the NPPW relevant to this
assessment.
Table 2.2 Paragraphs of the NPPW relevant to this Assessment
Paragraph Description
Paragraph 2: Using a proportionate
evidence base
Requires that waste planning authorities:
• Ensure that the planned provision of new capacity and its spatial distribution is based on robust analysis of best available data and information, and an appraisal of options, avoiding spurious
precision;
• Work jointly and collaboratively with other planning authorities to collect and share data and
information on waste arisings, and take account of:
─ Waste arisings across neighbouring waste planning authority areas; and
─ Any waste management requirement identified nationally, including the Government’s latest
advice on forecasts of waste arisings and the proportion of waste that can be recycled; and
• Ensure that the need for waste management facilities is considered alongside other spatial planning concerns, recognising the positive contribution that waste management can bring to the
development of sustainable communities.
Paragraph 3: Identify need for waste management
facilities
• States that “Waste planning authorities should prepare Local Plans which identify sufficient
opportunities to meet the identified needs of their area for the management of waste streams”.
• States that waste planning authorities should consider the need for additional waste management capacity of more than local significance, and consider the extent to which the capacity of existing
operational facilities would satisfy any identified needs.
• Highlights the requirement to work collaboratively with other waste planning authorities, and to
have regard to their apportionments as set out in the London Plan (Ref 16).
Paragraph 4: Identifying suitable
sites and areas
• States that waste planning authorities should identify in their Local Plans, sites and/or areas for
new or enhanced waste management facilities in appropriate locations.
• States that in preparing their Local Plans, the authorities should:

Prepared for: Be First
AECOM 8
─ “Identify the broad type or types of waste management facility that would be appropriately located on the allocated site or in the allocated area in line with the waste hierarchy, taking
care to avoid stifling innovation (Appendix A);
─ Plan for the disposal of waste and the recovery of mixed municipal waste in line with the proximity principle, recognising that new facilities will need to serve catchment areas large
enough to secure the economic viability of the plant;
─ Consider opportunities for on-site management of waste where it arises;
─ Consider a broad range of locations including industrial sites, looking for opportunities to co-locate waste management facilities together and with complementary activities. Where a low carbon energy recovery facility is considered as an appropriate type of development, waste planning authorities should consider the suitable siting of such facilities to enable the
utilisation of the heat produced as an energy source in close proximity to suitable potential
heat customers; and
─ Give priority to the re-use of previously-developed land, sites identified for employment uses,
and redundant agricultural and forestry buildings and their curtilages.”
2.3.2 National Planning Policy Framework (NPPF) (2019)
2.14 A revised and updated National Planning Policy Framework (NPPF) (Ref 17) was published in February
2019. This sets out the Government’s planning policies for England and is a material planning
consideration in the determination of planning applications.
2.15 With regard to Local Plan preparation, Paragraph 31 of the NPPF states that “the preparation and review
of all policies should be underpinned by relevant and up-to-date evidence. This should be adequate and
proportionate, focused tightly on supporting and justifying the policies concerned, and take into account
relevant market signals.” Paragraph 35 of the NPPF outlines the criteria against which Local Plans are
assessed. Plans are ‘sound’ if they meet the following requirements:
• “Positively prepared – providing a strategy which, as a minimum, seeks to meet the area’s
objectively assessed needs; and is informed by agreements with other authorities, so that unmet
need from neighbouring areas is accommodated where it is practical to do so and is consistent with
achieving sustainable development;
• Justified – an appropriate strategy, taking into account the reasonable alternatives, and based on
proportionate evidence;
• Effective – deliverable over the plan period, and based on effective joint working on cross-boundary
strategic matters that have been dealt with rather than deferred, as evidenced by the statement of
common ground; and
• Consistent with national policy – enabling the delivery of sustainable development in accordance
with the policies in this Framework.”
2.3.3 National Planning Practice Guidance: Waste (NPPG) (2015)
2.16 The National Planning Practice Guidance (NPPG): Waste (Ref 18) was published in October 2015, and
the relevant paragraphs of the NPPG have been provided Table 2.3.
Table 2.3 Relevant Paragraphs provided within the NPPG
Paragraph Description
Paragraph 004 States that waste planning authorities play a role in implementing the following Articles of the EU Waste
Framework Directive (2008/98/EC):
• Article 4: Waste Hierarchy;
• Article 13: Protection of human health and the environment;
• Article 16: Principles of proximity and self-sufficiency;
• Article 28: Waste Management Plans; and
• Article 34: Periodic Inspections.
Paragraph 011 States:
“The Local Plan relating to waste should identify sufficient opportunities to meet the identified needs of an area for the management of waste, aiming to drive waste management up the Waste Hierarchy. It should ensure that suitable sites and areas for the provision of waste management facilities are identified in
appropriate locations.”
Paragraph 043 • Addresses how waste planning authorities in London should identify gaps in management capacity.

Prepared for: Be First
AECOM 9
• States that London waste planning authorities need to plan for the delivery of sites and areas suitable for waste management, in order to fill the gap between existing and required waste management
capacity, and that the need for replacement capacity should reflect that:
─ “Apportionments provide high-level benchmarks for local planning, and are subject to annual
monitoring and regular review;
─ Existing facilities may close sooner or later than predicted;
─ Capacity may be developed at a slower or faster rate than predicted.”
Paragraph 044 • Addresses the way in which waste planning authorities should plan for London’s waste, stating that given London’s unique waste needs, “there is likely to be a need for waste planning authorities surrounding London to take some of London’s waste. The Mayor and waste planning authorities in London should engage constructively, actively and on an ongoing basis with other authorities, under
the duty to cooperate, to help manage London’s waste.”
2.3.4 The UK Industrial Strategy White Paper: Building a Britain Fit for the Future (2017)
2.17 The UK Industrial Strategy White Paper (Ref 19), published in 2017 and updated in 2018, sets out an
approach to building upon the UK’s strengths, whilst also addressing its weaknesses, with a focus upon
strengthening productivity.
2.18 It states a commitment to “moving towards a more circular economy – to raising productivity by using
resources more efficiently, to increasing resilience by contributing to a healthier environment, and to
supporting long-term growth by regenerating our natural capital.” It suggests a number of measures to be
taken to achieve this commitment, including:
• raising the resource productivity of businesses, including through the promotion of recycling and
strong secondary materials markets;
• working with businesses through the Courtauld Commitment to deliver a 20% per capita reduction in
food waste by 2025; and
• continually strengthening policies in line with our national ambitions of zero avoidable waste, and a
doubling of resource productivity by 2050.
2.3.5 Our Waste, Our Resources: A Strategy for England (2018)
2.19 Our Waste, Our Resources: A Strategy for England (Ref 20), published in December 2018, sets out how
the Government plans to double resource productivity and eliminate avoidable waste of all kinds, including
plastic waste, by 2050, building on “A Green Future: Our 25 Year Plan to Improve the Environment”
(January 2018) (Ref 21). The Strategy outlines how it will:
• “preserve our stock of material resources by minimising waste, promoting resource efficiency and
moving towards a circular economy;
• minimise the damage caused to our natural environment by reducing and managing waste safely
and carefully; and
• deal with waste crime.”
2.20 The Strategy states it’s aims to prolong the lives of the materials and goods that we use, moving away
from the inefficient ‘linear’ economic model of ‘take, make, use, throw’ and moving towards a more circular
economy. The Strategy commits to the following policy instruments and sets out dates for their production:
Extended Producer Responsibility
• The Extended Producer Responsibility (EPR) is “a policy approach through which a producer’s
responsibility for a product is extended to the post-use stage. This incentivises producers to design
their products to make it easier for them to be reused, dismantled and/or recycled at end of life”.
Deposit Return Scheme
• In a Deposit Return Scheme (DRS), a small deposit will be added to the price of a drinks container
brought to a store. Once the container has been used, the consumer will dispose of it in a reverse
vending machine and the deposit will be returned to the consumer.
Consistent Collections
Prepared for: Be First
AECOM 10
• Subject to consultation, legislation enforcing the government to “specify a core set of materials to be
collected by all local authorities and waste operators” will be introduced. It is envisioned that
specifying a consistent set of dry recyclable materials to be collected from all households and
businesses will improve England’s recycling rate.
2.21 At the current time, these policy instruments are out for consultation and (subject to proposals) will be
rolled out from 2023.
2.3.6 A Green Future: Our 25 Year Plan to Improve the Environment (2018)
2.22 In 2018, the Government published A Green Future: Our 25 Year Plan to Improve the Environment. This
Plan sets out the Government actions to help the natural world regain and retain good health. It aims to
deliver cleaner air and water, protect threatened species and provide richer environment. One of the
measures set out in Chapter 4 of this Plan is to decrease pressure on the environment by minimising the
generation of waste. This will be done by:
• “Meeting all existing waster targets – including those on landfill, reuse and recycling – and
developing ambitious future targets and milestones; and
• Working towards our ambition of zero avoidable waste by 2050.”
2.3.7 Waste Management Plan for England (2021)
2.23 The Waste Management Plan (WMP) for England (2021) (Ref 22) (which supersedes the Waste
Management Plan for England (2013) (Ref 23)) was formally adopted on 27 January 2021.
2.24 The WMP is a high level document which provides an analysis of waste management in England, bringing
current and planned waste management policies together in one place, and evaluates how it will support
implementation of the objectives and provisions of the Waste (England and Wales) Regulations (2011)
(Ref 24). Whilst Our Waste, Our Resources: A Strategy for England (2018) outlines the vision of a more
circular economy and policies to support the move towards it, the Waste Management Plan for England
(2021) focuses upon waste arisings and their management.
2.25 The WMP does not introduce new waste management policies, or change the landscape of how waste is
managed in England, but brings current waste management policies under the umbrella of one national
plan, making reference to the following documents:
• Clean Growth Strategy (2017) (Ref 25);
• Industrial Strategy (2017);
• Litter Strategy (2017) (Ref 26);
• UK Plan for Shipments of Wastes (2012) (Ref 27); and
• National Policy Statements for Hazardous Waste (2013) (Ref 28) and for Renewable Energy
Infrastructure (2011) (Ref 29) (in so far as it relates to energy from waste (EfW)).
2.26 The WMP states that waste planning authorities are responsible for producing local waste management
plans which cover the land use planning aspect of waste management for their areas, and that they
should have regard to the Waste Management Plan for England, as well as national planning policy on
waste and the NPPF, when drawing up or revising their management plans.
Regional Policy
2.4.1 The London Plan (2021)
2.27 The London plan (Ref 30) covers the period from 2019 to 2041, and replace all previous versions. The
plan includes revised targets for waste which reflect and build on those set out in the London Environment
Strategy (Ref 31). The policies applicable to this assessment have been set out in Table 2.4.

Prepared for: Be First
AECOM 11
Table 2.4 Publication London Plan Policies Relevant to this Assessment
Policy Description
Policy SI 7: Reducing Waste and Supporting
the Circular Economy
• Sets the following targets:
─ “Resource conservation, waste reduction, increases in material re-use and recycling, and reductions in waste going for disposal will be achieved by the Mayor, waste planning
authorities and industry working in collaboration to:
▪ Promote a more circular economy that improves resource efficiency and innovation to
keep products and materials at their highest use for as long as possible;
▪ Encourage waste minimisation and waste prevention through the reuse of materials
and using fewer resources in the production and distribution of products;
▪ Ensure that there is zero biodegradable or recyclable waste to landfill by 2026;
▪ Meet or exceed the municipal waste recycling target of 65 per cent by 2030;
▪ Meet or exceed the targets for each of the following waste and material streams:
- Construction and demolition – 95 per cent reuse/recycling/recovery
- Excavation – 95 per cent beneficial use”.
• States that “Development Plans that apply circular economy principles and set local lower thresholds for the application of Circular Economy Statements for development proposals are
supported.”
Policy SI 8: Waste Capacity and Net
Waste Self-Sufficiency
• States that “In order to manage London’s waste sustainably:
─ The equivalent of 100 per cent of London’s waste should be managed within London (i.e.
net self-sufficiency) by 2026 ;
─ Existing waste management sites should be safeguarded (see Policy SI 9 Safeguarded
waste sites);
─ The waste management capacity of existing sites should be optimised;
─ New waste management sites should be provided where required; and
─ Environmental, social and economic benefits from waste and secondary materials
management should be created.”
• States that “Development Plans should:
─ Plan for identified waste needs;
─ Identify how waste will be reduced, in line with the principles of the Circular Economy and
how remaining quantums of waste will be managed;
─ Allocate sufficient sites, identify suitable areas, and identify waste management facilities to provide the capacity to manage the apportioned tonnages of waste, as set out in Table
9.2 (boroughs are encouraged to collaborate by pooling their apportionment
requirements); and
─ Identify the following as suitable locations to manage borough waste apportionments:
▪ Existing waste and secondary material sites/land, particularly waste transfer facilities,
with a view to maximising their capacity;
▪ Strategic Industrial Locations and Locally Significant Industrial Sites; and
▪ Safeguarded wharves with an existing or future potential for waste and secondary
material management.”
2.28 Policy SI 8, which relates to waste capacity and net waste self-sufficiency, sets The Plan includes new
apportionment targets for each borough in order to meet the net self-sufficiency targets, as referenced in
Policy SI 8, above. The Plan’s apportionment target of 6.1% for LBBD is equivalent to 505,000 tonnes per
annum (tpa) by 2021 and 537,000 tpa by 2041.
Local Policy
2.5.1 Barking and Dagenham Local Plan (2010)
2.29 The Barking and Dagenham Local Plan (2010) consists of a series of Development Plan Documents
(DPDs). The Core Strategy DPD (2010) (Ref 32) is the most important; its strategic objectives are
supported by:
• the Borough Wide Development Policies DPD (2011) (Ref 33);
• the Site-Specific Allocations DPD (2010) (Ref 34);
• Barking Town Centre Area Action Plan DPD (2011) (Ref 35); and
• the Proposals Map DPD (2012) (Ref 36).
2.30 The Core Strategy sets out the council’s long-term vision, spatial strategy and core policies for shaping
the future development of Barking and Dagenham up to 2025. The document was adopted by LBBD in

Prepared for: Be First
AECOM 12
July 2010, and superseded the Unitary Development Plan (1995). The key objectives, policies and
justification paragraphs relevant to this assessment have been provided in Table 2.5.
Table 2.5 Key Objectives, Policies and Justification Paragraphs in the LBBD Core Strategy
Objective/Policy/Paragraph Description
Strategic Objective SO.9 Rise to the challenge of climate change and maintain the Council’s pioneering work in this area by demanding high levels of sustainable design and construction, especially in relation
to water and waste management, resource efficiency and emission control.
Policy CR3: Sustainable
Waste Management
States:
• “To protect human health and the environment the Borough will seek to manage waste in a sustainable way and to help achieve national recycling and composting targets.
This will be done by prioritising waste reduction, re-use, recycling and composting, new and emerging recovery technologies and conventional incineration over landfill, which
will only be considered acceptable as a last resort.
• To meet the needs of our growing population, and to meet the Waste Apportionment requirements set out in the London Plan (Consolidated with Alterations since 2004), appropriate existing waste management capacity will be safeguarded and preferred sites for new facilities identified. The specifics of what capacity will be safeguarded and
what sites are preferred for new waste management facilities will be set out in the Joint Waste DPD which the Council is developing with the neighbouring boroughs of
Havering, Newham and Redbridge.”
• The justification behind Policy CR3 has been provided in Appendix A.
2.5.2 The Joint Waste Development Plan Document (2012)
2.31 The four East London Waste Authority (ELWA) boroughs of Barking and Dagenham, Havering, Newham
and Redbridge formally adopted the Joint Waste DPD on 27th February 2012. The Joint Waste DPD forms
part of the LDF for each borough, setting waste management targets and allocating sites suitable for
waste development for implementation across all of the four of the boroughs.
2.32 The Joint Waste DPD for East London sets out a planning strategy for sustainable waste management. It
enables the adequate provision of waste management facilities (including disposal) in appropriate
locations for:
• municipal waste;
• commercial and industrial waste;
• construction and demolition waste; and
• hazardous waste.
2.33 The Strategic Objectives contained within the Joint Waste DPD are:
• “Deliver sustainable development by driving waste management up the waste hierarchy, addressing
waste as a resource and looking to disposal as the last option, while recognising that disposal must
be adequately catered for;
• Work towards meeting targets set out in the Waste Strategy for England 2007, and the London Plan;
• Enable the provision of a range of waste technologies;
• Enable the provision of facilities to allow for net self-sufficiency in the ELWA boroughs in accordance
with the London Plan;
• Enable waste to be managed in one of the nearest appropriate installations without endangering
health or harming the environment;
• Integrate waste planning with other spatial concerns, including regeneration plans;
• Reverse the historical trend of the ELWA area being the dumping ground for London’s waste; and
• Encourage our communities to take more responsibility for their waste.”
2.34 Section 4 of the Joint Waste DPD provides information on the current and future waste management
facilities in ELWA. Based on the anticipated tonnages for ELWA in 2021 (HIC waste – 1.573 million
tonnes, CD&E waste – 1.267 million tonnes, Hazardous waste- 0.095 million tonnes), and the list of
existing waste management facilities provided within the Joint Waste DPD, the report concludes that the
capacity surplus and deficits provided in Table 2.6 are anticipated to apply to ELWA.

Prepared for: Be First
AECOM 13
Table 2.6 ELWA Anticipated Capacity Surplus and Deficits
Waste Management Route Capacity Required
2011 2016 2021
Recycling (HIC) 786,203 tpa 674,313 tpa 415,428 tpa
Composting (HIC) -47,440 tpa -109,170 tpa -320,255 tpa
Recovery (all facilities) -262,710 tpa -256,090 tpa -269,370 tpa
Numbers in italics are surplus capacity and numbers in bold (with minus sign in front) are deficit.
2.35 The Joint Waste DPD is in conformity with borough Core Strategy policies, including LBBD Policy CR3
(Sustainable Waste Management). The relevant policies found within the Joint Waste DPD are listed in
Table 2.7.
Table 2.7 Relevant Policies found within the Joint Waste DPD
Strategic Policy Description
Policy W1: Sustainable Waste
Management
• States: “The boroughs will aim to drive waste management up the waste hierarchy by promoting waste minimisation, materials reuse, recycling & recovery of resources and help the delivery of
national and regional targets for recycling and composting set out in the Waste Strategy for
England 2007 and the London Plan by:
─ Working in partnership with the general public and the business community in the ELWA area
to provide information and advice and raise awareness;
─ Working in partnership with local community and voluntary groups and social enterprises to
encourage waste minimisation, materials reuse, recycling and recovery of resources;
─ Ensuring that developers and contractors design new housing, commercial and other developments to maximise opportunities for future occupiers to minimise, reuse, recycle and
recover resources from waste, by providing adequate space and facilities for storage and
handling of segregated waste; and
─ Require the reuse of construction, excavation and demolition waste during new developments, such as the Thames Gateway, with on-site recycling and use of recycled
aggregate wherever possible and encourage use of sustainable transport modes where the
movement of waste is necessary.”
• The agreed targets for the Joint Waste DPD (for recycling and composting of municipal solid waste (MSW), recovery of MSW, recycling and composting of commercial and industrial (C&I),
and recycling and reuse of construction, demolition and excavation waste (C,D & E)) are
consistent with that of the Waste Strategy for England (2007) and the London Plan (2011).
Policy W2: Waste Management Capacity,
Apportionment & Site
Allocation
States: “The London Plan identifies the amount of municipal and commercial waste to be managed by the ELWA boroughs as 1,228,000 tonnes at 2011; 1,395,000 tonnes at 2016 and 1,573,000 tonnes at
2021. The ELWA boroughs will meet this apportionment by:
• Safeguarding the capacity of existing waste management facilities listed in Schedule 1 and encouraging increased processing of waste at these facilities, to run at a higher figure towards the
licensed capacity; and
• Approving strategic waste management facilities where it will contribute to the ELWA boroughs
meeting the London Plan apportionment on sites within the locations listed in Schedule 2.”
2.5.3 The emerging Barking and Dagenham Local Plan (2020)
2.36 LBBD Council are currently preparing a new Local Plan, which will set out the future of planning in the
borough between 2019 and 2037, in order to be consistent with the draft emerging London Plan.
2.37 The existing Local Plan (formally the LDF, discussed at Section 2.7.1) will continue to form the
Development Plan alongside the London Plan and the Joint Waste DPD (2012) (see Section 2.7.3) until
the new Local Plan is adopted by the Council. Once it has been adopted, the Development Plan will
consist of the new Local Plan, the London Plan and the Joint Waste DPD.
2.38 The Council previously consulted on the Issues and Options document between October 2015 and
January 2016. Regulation 18 draft Local Plan consultation was carried out between November 2019 and
February 2020.
2.39 The Reg 18 draft Local Plan consultation response issued by the GLA in February 2020 has been
provided in Table 2.8.

Prepared for: Be First
AECOM 14
Table 2.8 GLA Draft Local Plan Consultation Response
Regulation GLA Consultation Response
Reg 18 • States that “the draft Local Plan does not adequately demonstrate LBBDs ability to meet its waste apportionment targets for household, commercial and industrial waste as set out in Table 9.2 of the Intend to Publish London Plan… Guidance set out in Policy SI8 of the Intend to Publish London Plan should be followed and reflected in the draft Local Plan in order to deliver the Mayor’s ambition that 100% of
London’s waste is managed in London by 2026.”
• The consultation response acknowledges that a review of the East London Joint Waste DPD is at a very early stage of development, and that the Major would therefore “like to see a commitment from LBBD about how its apportionment needs will be met and how they are planning to meet waste needs beyond those apportioned over the plan period. Following on from this, the draft policy should seek to clearly
protect waste sites until the joint waste plan is completed at which point it will form part of LBBD’s development plan…”. The response makes clear that the Reg 18 draft Local Plan is not in conformity with
the London Plan.
2.40 The Regulation 19 draft Local Plan (September 2020) and associated documents are now available to
view on LBBD’s website. According to LBBD’s Local Development Scheme (2020), the emerging Local
Plan is scheduled for adoption in Q3 (October-December) 2021. The draft paragraphs and policies of the
Reg 19 draft Local Plan relevant to this assessment have been provided in Table 2.9.
Table 2.9. Draft Paragraphs and Policies of the Reg 19 Draft LBBD Local Plan Applicable to this
Assessment
Paragraph/Policy Description
Draft Paragraph 9.1 States that: “We support the targets set out in Policy SI 8 of the draft New London Plan Intend to Publish version in order to manage London’s waste sustainably and self-sufficiently and deliver the Mayor’s ambition for London to manage 100% of its own waste by 2026. This includes the borough-
level apportionment of 6.1% for the London Borough of Barking and Dagenham (LBBD) for all household, commercial and industrial waste between 2021 and 2041 (505,000 tonnes by 2021 and
537,000 tonnes by 2041).”
Draft Strategic Policy SP 7: Securing a Clean, Green and Sustainable
Borough
States that LBBD Council will:
• “…Safeguard all waste sites within the borough and review the approach until the new Joint
Waste Plan is adopted; and
• Minimise waste production by promoting sustainable waste management, the principles of circular
economy and the use of sustainable materials…”
Draft Development Management Policy DMSI 8: Waste
Sites
States that: “Development proposals will be supported where they:
• “Comply with the policies set out in the latest East London Waste Authority Plan and consult with
the council on the emerging plans currently being updated;
• Safeguard the existing permitted capacity at the waste sites within the borough to meet the Council’s apportionment requirements set out in Policy SI 8 of the draft New London Plan Intend
to Publish version; and
• Seek to maximise the efficiency and capacity of waste facilities within the borough…”
Draft Development Management Policy
DMSI 9: Demolition, Construction and
Operational Waste
States: “Prior to demolition and construction, major development proposals will be expected to:
• Develop an appropriate construction waste management plan in order to reduce , reuse and recover waste and to mitigate environmental impact in accordance with the targets set out in
Policy SI 7 of the draft New London Plan Intend to Publish version;
• Adopt the principles of circular economy in the design of the development, using sustainable materials and aiming to achieve net zero-waste. A circular economy statement should be submitted with all major planning applications, in line with requirements of Policy SI 7 of the draft
New London Plan Intend to Publish version and associated guidance…”
Summary 2.41 In summary, the relevant EU, national, regional and local policy outlines the following key points and
themes:
• The emerging LBBD Local Plan must demonstrate that LBBD is able to meet the waste
apportionment targets for HIC waste, as set out in the emerging London Plan (2020). This
apportionment equates to 6.1% of the share of waste to be managed in London;
• In order to achieve this, LBBD should identify existing waste management capacity within the
borough, which already contributes towards waste apportionment targets, and identify opportunities
for introducing new waste capacity; sufficient land and facilities should be allocated to provide
capacity to manage the tonnages of waste apportioned;

Prepared for: Be First
AECOM 15
• The evidence base of the emerging LBBD Local Plan (which should demonstrate that LBBD can
meet its apportionment targets, and which this assessment is intended to supplement) should be
proportionate, based on robust analysis of best available data and information, and produced
collaboratively with neighbouring waste planning authorities, taking account of their waste arisings;
• LBBD must support the Publication London Plan’s vision to manage as much of London’s waste
within London boroughs as practicable, working towards the equivalent of 100% of London’s waste
being managed within London by 2026 (i.e. net self-sufficiency);
• LBBD should promote waste minimisation, resource conservation and material recycling, and
endeavour to reduce waste to landfill and move towards a more circular economy, supporting the
targets of the emerging London Plan (such as that to ensure that there is zero biodegradable or
recyclable waste to landfill by 2026);
• LBBD must engage and cooperate constructively with the Mayor, the GLA and the other ELWA
boroughs, in order to help manage London’s waste sustainably.

Prepared for: Be First
AECOM 16
3. Forecasting Waste Arisings
Introduction 3.1 This assessment focuses in particular upon whether LBBD has current and future capacity to meet the
GLA apportionment target for HIC waste set out in the Publication London Plan and also demonstrate how
they are planning to meet waste needs beyond those apportioned over the plan period. The Publication
London Plan has apportioned LBBD 6.1% of the total amount of HIC waste generated within London.
3.2 The Publication Plan also states that waste planning authorities are encouraged to identify suitable
additional capacity for waste where practicable, including those waste streams not apportioned by the
London Plan, such as construction, demolition and excavation (CD&E) waste. Therefore, this assessment
will also look at CD&E arisings and LBBD’s capacity to manage this waste stream.
3.3 In addition to the HIC and CD&E waste streams and as required by the National Planning Practice
Guidance (NPPG) for waste (paragraph 13), this assessment will also plan for the sustainable
management of the following waste types:
• Hazardous waste
• Agricultural waste;
• Wastewater; and
• Low level radioactive waste.

Prepared for: Be First
AECOM 17
Household, Industrial and Commercial Waste
3.2.1 Context
3.4 The Publication London Plan has set a target to send zero biodegradable or recyclable waste to landfill by
2026 and to recycle at least 65% of municipal waste by 2030.
3.5 The London Plan uses Defra’s 2011 definition of municipal waste as ‘household waste or waste similar in
composition to household waste’ (Ref 37). In other words, municipal waste is largely comprised of
household waste and C&I waste similar in composition to household waste. The London Plan’s
apportionment targets therefore take this definition into account, and apportion each borough for
household, industrial and commercial waste arisings.
3.2.2 Current Arisings
3.6 The forecast arisings of HIC waste and the apportionment tonnages for LBBD taken from the Publication
London Plan for 2021 and 2041 can be seen in Table 3.1.
Table 3.1 Forecast Arisings and Apportionment Tonnages for HIC Waste taken from the Publication
London Plan
Borough Forecast Arisings (tpa) Apportionment Tonnages (tpa)
2021 2041 2021 2041
London Borough of Barking
and Dagenham 214,000 230,000 505,000 537,000
Source: Publication London Plan
3.2.3 Future Arisings
3.7 In calculating HIC waste arisings, the London Plan’s evidence base uses in-house forecasting which has
been independently reviewed (Ref 38). The Publication London Plan has been through several formal
consultations before reaching this stage, including an Examination in Public and review by the Secretary
of State. Therefore, this assessment assumes that the evidence base used to determine the
apportionment targets for HIC waste contained within the Publication London Plan is a robust analysis.
3.8 The methodology for this assessment therefore uses the GLA apportionment targets and tonnages for HIC
waste (as set out in the Publication London Plan) to determine if LBBD has sufficient current and future
waste management capacity available within the borough. Forecasted waste arisings for LBBD are lower
than the apportionment tonnages, therefore the apportionment tonnages have been used to calculate the
required future waste capacity, in order to be compliant with the London Plan.
3.9 As this assessment only covers the interim period between now and when the revised ELWP is adopted
(i.e. no later than 2026), the apportionment tonnages for the next five years have been calculated, up to
2026 (as shown in Table 3.2 and Figure 3.1).
Table 3.2 Apportionment Tonnages for 2021 to 2026
Borough Apportionment
Target
Apportionment Tonnages
2021 2022 2023 2024 2025 2026
London Borough of Barking and
Dagenham
6.1% 505,000 506,600 508,200 509,800 511,400 513,000
Source: Publication London Plan. Apportionment tonnages have been calculated by estimating the annual growth rate between
the 2021 and 2026 waste arisings for London and applying the LBBD apportionment target. A linear growth rate per annum has
been assumed.

Prepared for: Be First
AECOM 18
Figure 3.1 Forecasted Apportionment Tonnages
0
100,000
200,000
300,000
400,000
500,000
2021 2022 2023 2024 2025 2026
Apport
ionm
ent
Tonnag
es
Year

Prepared for: Be First
AECOM 19
Construction, Demolition and Excavation Waste
3.3.1 Context
3.10 Historically LBBD has been an area closely linked with the construction sector; playing host to the likes of
Cemex and Hansons. Working in symbiosis, the borough also hosts a significant number of construction,
demolition & excavation (CD&E) waste reprocessors and transfer stations.
3.11 The National Planning Practice Guidance (NPPG) requires waste planning authorities to plan for the
management of CD&E waste. In addition, the Publication London Plan encourages waste planning
authorities identify suitable additional capacity for CD&E waste. The Publication London Plan also states
that as the reliability of CD&E waste data is low, apportionments for this waste stream are not set out.
3.3.2 Current Arisings
3.12 The current CD&E waste arisings have been sourced using the Environment Agency’s (EA) Waste Data
Interrogator (WDI) (Ref 39). The CD&E waste arisings have been identified within the WDI under the
European Waste Code (EWC) Chapter 17 (Construction and Demolition) (please see Appendix B for a
description of EWC chapters). The CD&E waste arisings recorded with an origin of LBBD over the past
five years have been provided in Table 3.3.
3.13 Uncontaminated soils excavated during the construction of a development which are to be reused on the
same site for the purposes of construction, are not considered to be a waste and will therefore not be
given an EWC code. If the soil is to be exported from the site (even to be reused as fill on another site),
the soil must be classified using an EWC code. Hence, there may be some excavation waste generated
from LBBD which is not received by waste management facilities and will therefore not be included in
Table 3.3.
Table 3.3 CD&E Waste Arising from LBBD over the Past 5 Years (Tonnes)
Waste Stream 2015 2016 2017 2018 2019
Total CD&E Waste 352,248 199,634 244,020 207,538 605,573
Recycled Aggregate* 14,875 14,875 14,875 14,875 14,875
CD&E waste received by exempt
facilities* 600 600 600 600 600
* These waste arisings are not included within this capacity assessment, further information is provided Appendix E.
Source: EA WDI
3.3.3 Future Arisings
3.14 CD&E waste arisings have been projected by using the GLA’s London labour market projections (Ref 40).
The projections are broken down into sectors and boroughs. To calculate CD&E forecasted arisings for
this assessment, the projections from the construction sector and the London Borough of Barking and
Dagenham were chosen (a link to the full datasets can be found in Ref 41).
3.15 The growth rate per annum for the construction sector employment projection and the LBBD borough
employment projection was calculated and then combined to form a final growth rate. The final growth rate
was applied to the 2019 CD&E waste arisings (shown in Table 3.3) to forecast the CD&E waste arisings in
a linear fashion for the following seven years, until 2026. It has been assumed that the 2019 to 2020
growth rate is the same as the calculated 2020 to 2021 growth rate. The resulting forecasted CD&E waste
arisings can be found in Table 3.4 and
3.16 Figure 3.2.

Prepared for: Be First
AECOM 20
Table 3.4 Forecasted CD&E Waste Arising from LBBD in the Period 2020 to 2026
Waste Stream 2020 2021 2022 2023 2024 2025 2026
Total CD&E
Waste 610,452 615,332 620,212 625,092 629,972 634,852 639,732
Figure 3.2 Forecasted CD&E Arisings
3.17 The generation of CD&E waste is expected to fluctuate around the values that have been forecasted and
shown in Figure 3.2. This is because CD&E waste arisings are not likely to grow in a linear fashion, they
are dependent on the number and size of construction projects happening in LBBD.
3.18 To give an indication of possible CD&E waste producers, Table 3.5 provides a list of significant planned
developments in LBBD which are likely to progress within the period between now and 2026. It is
expected that the management of waste arising as a result of a development has been planned for as part
of the project, therefore the waste arising from the developments described within Table 3.5 has not been
specifically considered when forecasting CD&E waste arisings in LBBD.
Table 3.5 Significant Planned Developments in LBBD between 2021 and 2025
Name of Project Details Expected Construction Dates
Consolidation of the City of
London Markets
Wholesale food market totalling a
maximum of 237,946 m2 GEA.
Planning application submitted June 2020 –
Completion 2025
Made in Dagenham Studios
Six sound stages (totalling ~140,000 ft2, flexible
accommodation, conversion of
two buildings into workshops and
a landmark office building.
Planning granted July 2020 – Operational by 2023
Barking Riverside
10,800 residential units, facilities for healthcare, shopping,
community and leisure, and new
public transport links.
Comprises several phases to be built over a
number of years.
Planning granted in 2007 – no estimated
completion date for the full masterplan.
Other waste streams
3.4.1 Hazardous Waste
3.19 Waste is considered hazardous when it contains substances that are harmful to humans or the
environment. Hazardous waste can include certain chemicals, batteries, asbestos and pesticides: for a full
list of wastes that are classified as hazardous, please refer to the List of Wastes (England) Regulations
2005 (Ref 42). Due to the harmful nature of hazardous waste, specialist collection, treatment and disposal
0
100,000
200,000
300,000
400,000
500,000
600,000
2019 2021 2022 2023 2024 2025 2026 2027
Year

Prepared for: Be First
AECOM 21
methods should be adopted so as to minimise the potential impacts on human health and the
environment.
3.20 The Publication London Plan states that London sends approximately 3% of the national total of
hazardous waste to landfill outside of London. As the amount of hazardous waste has continued to grow,
waste planning authorities should continue to identify hazardous waste capacity, and work with
neighbouring authorities to consider the necessary facilities when planning for hazardous waste.
3.21 The current hazardous waste arisings have been sourced using the EA Hazardous WDI (Ref 43) as it is
considered to be the most robust data source for hazardous waste arisings.
3.22 Hazardous waste arisings have been forecast using the growth rate indicated by the projected C&I waste
arisings found within the GLA’s ‘Waste Forecasts and Apportionments – Task 1’. There is no growth of the
projected C&I waste arisings in LBBD between 2021 and 2031, therefore a growth rate of zero has also
been applied to the forecasted hazardous waste arisings. The resulting forecasted hazardous waste
arisings are shown in Table 3.6.
3.23 Although it is important to show how the hazardous waste arisings generated by LBBD might change in
the future, there is no specific separate hazardous waste apportionment within the London Plan.
Hazardous waste has already been included within the HIC apportionment tonnages listed within the
Publication London Plan (as shown in Table 3.1) and CD&E waste arisings forecasted in this assessment
(shown in Table 3.4) and therefore to avoid double counting, the hazardous waste arisings shown in Table
3.6 should not be added to the HIC apportionment tonnages or CD&E waste arisings.
Table 3.6 Current and Forecasted Hazardous Waste Arising from LBBD in the period 2020 to 2026
Waste Stream 2020 2021 2022 2023 2024 2025 2026
Hazardous Waste 5,111 5,111 5,111 5,111 5,111 5,111 5,111
Source: EA Hazardous WDI
3.4.2 Agricultural Waste
3.24 Agricultural waste is defined as ‘waste from premises used for agriculture within the meaning of the
Agricultural Act 1947’ (Ref 44). Agricultural waste is now covered under the Waste Management (England
and Wales) Regulations 2006 (Ref 45), therefore meaning that legislation requires farmers to either send
their waste for disposal at a licensed facility, or to apply for a permit to dispose of their waste on their farm.
3.25 The agricultural waste arising from LBBD over the last 5 years have been sourced using the EA WDI
(EWC code 02 01) and are shown in Table 3.7.
Table 3.7 Agricultural Waste Arisings Recorded within LBBD over the Past 5 Years (Tonnes)
Waste Stream 2015 2016 2017 2018 2019
Agricultural Waste 70 11 36 31 0
Source: EA WDI
3.26 It can be seen from Table 3.7 that only a small amount of agricultural waste was generated from LBBD
over the past five years (less than 0.02% of LBBD’s apportionment target), therefore it can be determined
that there is no need to consider specific future waste management capacity for agricultural waste within
LBBD.
3.4.3 Wastewater
3.27 Wastewater is defined as water that has been contaminated by use in the home, business or as part of an
industrial process. Wastewater can also contain substances such as human waste, food scraps, oils,
soaps and traces of chemicals.
3.28 Thames Water is responsible for treating wastewater generated within LBBD. Thames Water is the largest
water and wastewater services company with over 15 million customers. Thames Water supplies 2.6
billion litres of drinking water each day and treats 4.4 billion litres of wastewater per day (Ref 46).
3.29 It is not possible to calculate wastewater arisings with the available datasets from the EA. Moreover, the
management of wastewater primarily falls under the jurisdiction of the regulated water utility companies.

Prepared for: Be First
AECOM 22
The provision of treatment facilities is usually considered on a case-by-case basis in discussion with
developers. Consequently, it is not considered necessary to make strategic provision for such facilities.
3.4.4 Low Level Radioactive Waste
3.30 Radioactive waste is described as any waste which falls within the scope of the Radioactive Substances
Act 1993 (Ref 47). Radioactive waste will either contain radioactive material or has been contaminated by
radioactivity. In the UK, radioactive waste can be classed as one of four categories according to the type
and amount of radioactivity it contains and the amount of heat it could generate (Ref 48), as shown in
Table 3.8.
Table 3.8 Description of the Categories for Radioactive Waste
Category Description
High Level Waste
(HLW)
High Level Waste (HLW) accounts for less than 1% of all radioactive waste and is produced as a by-product of reprocessing spent nuclear reactor fuel. The temperature of HLW may rise
significantly and therefore has to be stored and disposed of carefully.
Intermediate Level
Waste (ILW)
Intermediate Level Waste (IWL) accounts for around 6% of all radioactive waste and is mainly composed of components from nuclear reactors and sludges from the treatment of radioactive
waste. ILW does not generate significant amounts of heat, however it contains larger amounts of
radioactivity than Low Level Waste (LLW).
Low Level Waste
(LLW)
Low Level Waste (LLW) accounts for the vast majority of radioactive waste (around 94%). Most LLW is generated by the decommissioning of nuclear plants and can contain items such as waste paper, clothing and contaminated tools. As well as generating minimal amounts of heat, LLW also
contains low levels of radioactivity, not exceeding 4 giga-becquerel (GBq) per tonne of alpha
radiation or 12 GBq per tonne of beta/gamma radiation.
Very Low Level
Waste (VLLW)
Very Low Level Waste (VLLW) has specific limits it needs to comply with. VLLW can contain rubble or soil arising from the decommissioning and demolition of nuclear plants. VLLW can be disposed of
at permitted landfill facilities.
3.31 There are no nuclear power plants operating within LBBD. In addition, the EA holds a public register:
Environmental Permitting Regulations – Radioactive Substances (Ref 49) containing details of any non-
nuclear organisations keeping/using radioactive waste and disposing of radioactive waste. There are no
non-nuclear organisations located within LBBD that appear on the public register, therefore it can be
determined that there is no requirement for LBBD to provide waste management infrastructure for the
treatment of low level radioactive waste.
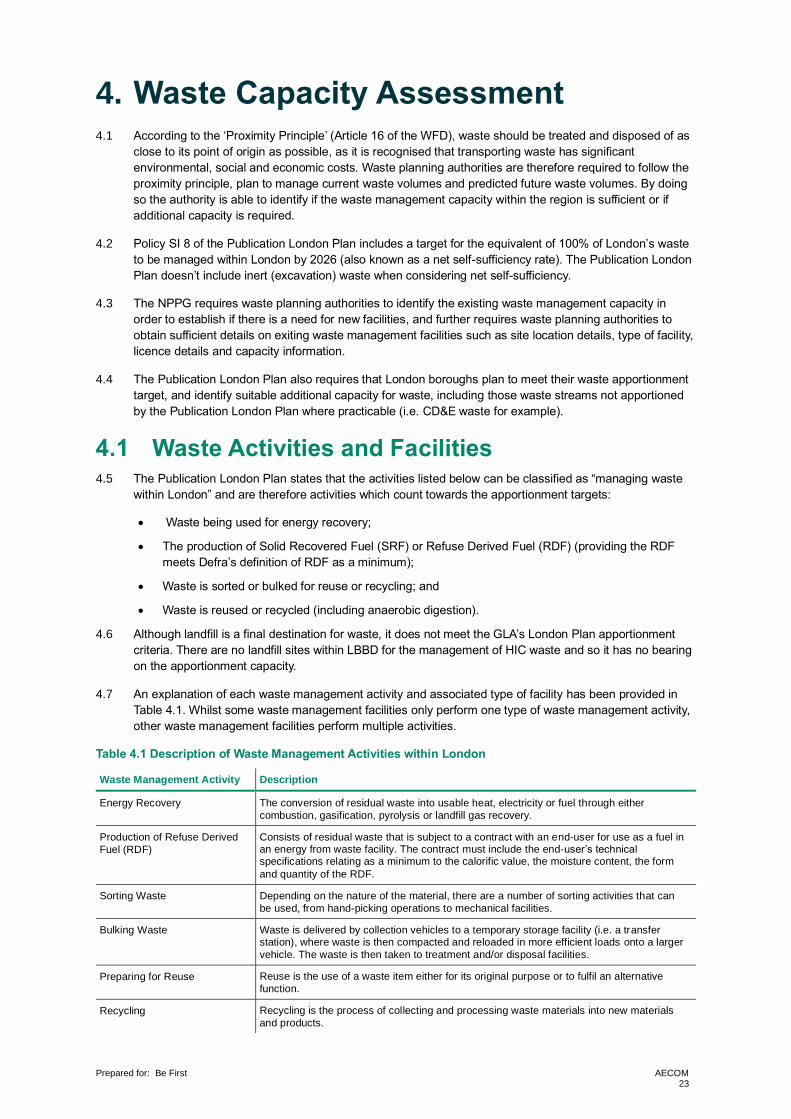
Prepared for: Be First
AECOM 23
4. Waste Capacity Assessment 4.1 According to the ‘Proximity Principle’ (Article 16 of the WFD), waste should be treated and disposed of as
close to its point of origin as possible, as it is recognised that transporting waste has significant
environmental, social and economic costs. Waste planning authorities are therefore required to follow the
proximity principle, plan to manage current waste volumes and predicted future waste volumes. By doing
so the authority is able to identify if the waste management capacity within the region is sufficient or if
additional capacity is required.
4.2 Policy SI 8 of the Publication London Plan includes a target for the equivalent of 100% of London’s waste
to be managed within London by 2026 (also known as a net self-sufficiency rate). The Publication London
Plan doesn’t include inert (excavation) waste when considering net self-sufficiency.
4.3 The NPPG requires waste planning authorities to identify the existing waste management capacity in
order to establish if there is a need for new facilities, and further requires waste planning authorities to
obtain sufficient details on exiting waste management facilities such as site location details, type of facility,
licence details and capacity information.
4.4 The Publication London Plan also requires that London boroughs plan to meet their waste apportionment
target, and identify suitable additional capacity for waste, including those waste streams not apportioned
by the Publication London Plan where practicable (i.e. CD&E waste for example).
Waste Activities and Facilities 4.5 The Publication London Plan states that the activities listed below can be classified as “managing waste
within London” and are therefore activities which count towards the apportionment targets:
• Waste being used for energy recovery;
• The production of Solid Recovered Fuel (SRF) or Refuse Derived Fuel (RDF) (providing the RDF
meets Defra’s definition of RDF as a minimum);
• Waste is sorted or bulked for reuse or recycling; and
• Waste is reused or recycled (including anaerobic digestion).
4.6 Although landfill is a final destination for waste, it does not meet the GLA’s London Plan apportionment
criteria. There are no landfill sites within LBBD for the management of HIC waste and so it has no bearing
on the apportionment capacity.
4.7 An explanation of each waste management activity and associated type of facility has been provided in
Table 4.1. Whilst some waste management facilities only perform one type of waste management activity,
other waste management facilities perform multiple activities.
Table 4.1 Description of Waste Management Activities within London
Waste Management Activity Description
Energy Recovery The conversion of residual waste into usable heat, electricity or fuel through either
combustion, gasification, pyrolysis or landfill gas recovery.
Production of Refuse Derived
Fuel (RDF)
Consists of residual waste that is subject to a contract with an end-user for use as a fuel in an energy from waste facility. The contract must include the end-user’s technical specifications relating as a minimum to the calorific value, the moisture content, the form
and quantity of the RDF.
Sorting Waste Depending on the nature of the material, there are a number of sorting activities that can
be used, from hand-picking operations to mechanical facilities.
Bulking Waste Waste is delivered by collection vehicles to a temporary storage facility (i.e. a transfer station), where waste is then compacted and reloaded in more efficient loads onto a larger
vehicle. The waste is then taken to treatment and/or disposal facilities.
Preparing for Reuse Reuse is the use of a waste item either for its original purpose or to fulfil an alternative
function.
Recycling Recycling is the process of collecting and processing waste materials into new materials
and products.

Prepared for: Be First
AECOM 24
Waste Management Activity Description
Anaerobic Digestion (AD) Anaerobic digestion is the process of using microorganisms to break down organic waste
(e.g. food waste) in the absence of oxygen to produce biogas and fertilising material.
4.8 Due to the nature of the activities carried out at waste management facilities, there is a possibility that the
facilities could cause harm to human health or the health of the environment. Therefore, the Environment
Agency regulates waste management facilities by requiring them to hold an environmental permit, and
waste management facilities requiring a permit are known as a ‘permitted facilities’.
4.9 There are also a number of facilities within LBBD which perform smaller scale waste activities, most often
these activities require a permit exemption. Although it is recognised that permit exempt waste sites have
an important role to play, they are far smaller in scale and related output and so it has been recognised
that their operation will not be a determining factor in the strategic planning and need for waste facilities,
more information is provided in paragraph 4.2.1.3. Information on both permitted facilities and exempt
facilities can be found online on the EA’s Public Register website (Ref 50)
Current Capacity
4.2.1 Methodology
4.2.1.1 Waste Management Facility Capacity
4.10 In order to understand LBBD’s capacity in meeting their waste apportionment target, the current waste
management capacity within the borough has been calculated based on data from the Environment
Agency. Data on the waste received by permitted waste management facilities in LBBD has been
examined through the EA’s WDI for the years 2015 – 2019, a detailed methodology is provided in
Appendix E.
4.11 Using the GLA’s guidance, the operational capacity of each facility has been assessed, and the
percentage of HIC and CD&E waste handled by each facility obtained to ascertain the capacity of the
facilities which counts towards the Publication London Plan apportionment target for LBBD.
4.2.1.2 Waste Transfer Station Capacity
4.12 Waste transfer stations play an important role in waste management. Although the main purpose of waste
transfer stations is the bulking of waste before sending it on for recovery/treatment/disposal, they can also
undertake the sorting of wastes and the production of RDF. As shown in Table 4.1 the bulking and sorting
of waste, as well as production of RDF are attributable to the GLA’s apportionment targets.
4.13 The recyclable outputs of waste transfer stations, (as well as RDF production) have therefore been taken
into consideration when looking at the amount of capacity available for GLA apportionment. This has been
done via establishing an “apportionment rate” for each WTS which includes all waste activities as advised
through the GLA’s guidance on criteria for waste activities. A detailed methodology is provided in
Appendix E of this Assessment.
4.2.1.3 Permit Exempt Sites
4.14 There are a number of sites located within LBBD which perform smaller scale waste activities, most often
these sites only require a permit exemption. Waste management facilities must meet certain criteria to be
exempt from requiring an environmental permit.
4.15 Waste exemptions can be classified using the following four categories:
• U1 to U16 – Using Waste (e.g. using waste in construction or burning it as fuel);
• D1 to D8 – Disposing of Waste (e.g. Disposing sanitary waste or agricultural waste);
• T1 to T33 – Treating Waste (e.g. treating waste wood); and
• S1 to S3 – Storing Waste (e.g. storing certain waste materials in secure containers).

Prepared for: Be First
AECOM 25
4.16 Information on the exempt sites located within LBBD was obtained from the EA Public Register: Register
of Waste Exemptions (Ref 52) and has been included in Appendix D.
4.17 An exemption is limited to three years from the date of registration, however there is no requirement to
remove the exemption from the register once it has been completed within the three-year period. In
addition, waste processed at certain exempt sites (for example S1 to S3 exempt sites) will go on to be
managed further at a permitted waste management facility; including these exempt sites would result in
double counting waste management capacity. It is also important to note that there is no cost to register
an exempt site, and therefore some registrations may be on a precautionary basis and end up not being
used.
4.18 In conclusion, although it is acknowledged that exempt sites have an important role to play in the
management of waste, they have not been included when estimating the waste management capacity in
this Assessment.
4.2.2 Results
4.19 By following the methodology described in Section 4.2.1, the current capacity for each waste management
facility has been calculated. To see a full list of capacities for each waste management facility, please see
Appendix C and Appendix D.
4.20 The following types of waste management facilities have been excluded when calculating operational
capacity:
• Waste management facilities that are now closed – excluded as these facilities are no longer able to
process waste material.
4.2.2.1 HIC Apportionment
4.21 Table 4.2 and Figure 4.1 show the capacity available to manage apportioned HIC waste in LBBD,
categorised by facility type.
4.22 Waste transfer stations provide the majority of the available capacity, excluding clinical waste transfer
stations which only provide a small proportion of the total capacity. Metal recycling and anaerobic
digestion facilities also provide a significant amount of the available capacity. The total capacity available
to managed HIC waste in LBBD is 629,654 tonnes per annum.
Table 4.2 Current HIC Waste Management Capacity in LBBD
Type of Facility Capacity available for HIC Apportionment (tpa)
Waste Transfer Station 358,858
Anaerobic Digestion 131,434
Metal Recycling 129,115
Material Recycling Facility 7,426
Physical Treatment 2,818
Clinical Waste Transfer Station 4
Total Capacity 629,654

Prepared for: Be First
AECOM 26
Figure 4.1 Current HIC Waste Management Capacity in LBBD
57%21%
21%
1% 0%0%
Waste Transfer Station
Anaerobic Digestion
Metal Recycling
Material Recycling Facility
Physical Treatment
Clinical Waste Transfer Station

Prepared for: Be First
AECOM 27
CD&E Waste
4.23 Table 4.3 and Figure 4.2 show the capacity available to manage CD&E waste in LBBD split by type of
facility.
4.24 Although the throughput for the only landfill site in LBBD (for the disposal of inert waste) is 126,035 tpa,
the remaining capacity has been calculated using the EA 2019 Remaining Landfill Capacity dataset (Ref
54). According this dataset, the landfill site has no more remaining capacity.
4.25 In addition, according to the EA’s Standard rules SR2015 No.39 on the use of waste in a deposit for
recovery operation (Ref 55), the maximum storage of waste at any one time is limited to 60,000 m3.
However, it has been assumed that the stored waste is likely to be removed for use and more waste will
therefore be received by the development. Taking this into account, the throughput has been used to
calculate the capacity for the only deposit to land recovery site located within LBBD.
4.26 Table 4.3 and Figure 4.2 show that, similar to HIC apportionment, waste transfer stations provide the
majority of the capacity available to manage CD&E waste in LBBD, closely followed by deposit to land
recovery operations. The type of waste facilities providing the next two largest amounts of capacity
available for managing CD&E waste in LBBD are inert waste transfer stations and physical treatment
facilities. This is expected as there are a number of construction manufacturing plants in LBBD which will
make use of the products generated by the physical treatment plants. Table 4.3 shows the total capacity
available for managing CD&E waste as 902,441 tonnes per annum.
Table 4.3 Current CD&E Management Capacity in LBBD
Type of Facility Capacity available for CD&E waste
Waste Transfer Station 357,782
Deposit to Land Recovery Operation 271,523
Physical Treatment 148,768
Metal Recycling 59,403
Inert Waste Transfer/Treatment 53,476
Material Recycling Facility 11,459
Total Capacity 902,411
Figure 4.2 Current CD&E Management Capacity in LBBD
40%
30%
16%
7%
6%
1%
Waste Transfer Station
Deposit of waste to land (recovery)
Physical Treatment
Metal Recycling
Inert waste Transfer/Treatment
Material Recycling Facility
Prepared for: Be First
AECOM 28
Future Capacity 4.27 In order to understand the future capacity, first the existing waste management facilities that have been
safeguarded for the future have been identified, and any land that has been safeguarded for the
development of waste management facilities has also been listed. Following on from this, the potential
future waste capacity has been determined through identifying any planning applications that have been
submitted for the development of future waste management facilities. The option of expanding the
capacity of existing waste management facilities within LBBD has also been explored in this section.
4.3.1 Safeguarded Sites
4.28 Sufficient waste management infrastructure is essential to support a modern economy. Therefore, it is
important to safeguard existing waste management facilities and land to accommodate future waste
capacity. The Publication London Plan refers to this in Policy SI 9 where it states that existing waste
management sites should be safeguarded unless provision is made elsewhere for an equivalent capacity.
4.29 The ELWA Joint Waste DPD (2012) provides a list of the waste management facilities that have been
safeguarded by ELWA. A list of the safeguarded waste management facilities located within LBBD has
been provided in Table 4.4. The Joint Waste DPD was prepared in 2012 and therefore information on
some of the safeguarded waste management facilities is likely to be out of date. As a result, the current
status of the LBBD waste management facilities safeguarded in the Joint Waste DPD has been
established and included within Table 4.4, as well as any additional notes that have been deemed
important to include.
4.30 Table 4.4 shows that three of the safeguarded LBBD waste management facilities are still currently
operational. However, four of the facilities have been difficult to trace and it is likely that the facilities may
have either changed owner or may have ceased to operate.

Prepared for: Be First
AECOM 29
Table 4.4 Safeguarded Waste Management Facilities within LBBD
Reference in Joint
Waste DPD Facility Name Process Facility Type Annual Permitted
Tonnage
Current
Status Additional Notes
80105 Frizlands Lane Reuse &
Recycling Centre
Recycling A13 – Household Waste
Amenity Site
80,000 Operational Operated by Renewi.
- White Mountain Roadstone
Ltd
Recycling A15 – Material Recycling
Treatment Facility
12,000 Unconfirmed White Mountain Roadstone Ltd changed their name to Lagan 108 in the 2000s and are now based in
Cheshire, Warrington.
This Site may now be owned by Eurovia Roadstone
and/or HKS metals/Hanson.
80759 Closed Loop Recycling Recycling A15 – Material Recycling
Treatment Facility 25,000 Operational Operated by Veolia Dagenham.
The capacity has been increased to 75,000 tonnes.
80759 SITA UK Ltd, Barking Recycling A15 – Material Recycling
Treatment Facility
75,000 Operational Inputs showed a significant reduction to 6 tonnes for the MRF in 2019, whilst the transfer station
processed >140,000 tonnes.
80120 Reuse Collection Limited Recycling A14 – Transfer Station taking
Non-Biodegradable Waste
260,000 Unconfirmed Reuse Collection Limited changed their name to URM and are now based in Tilbury. Inputs under the
original name can be seen until 2017.
This Site may now be operated by Edwards
Recycling.
80091 Jewometals (UK) Ltd Recycling A20 – Metal Recycling (mixed
MRSs) 24,000 Unconfirmed Unable to trace Jewometals (UK) Ltd.
80620 Hunts Wharf Recovery A16 – Physical Treatment
Facility
150,000 Unconfirmed Inputs were received for this Site up until 2017.
This Site may have merged with HKS Recycling.

Prepared for: Be First
AECOM 30
4.3.2 Safeguarded Land
4.31 As well as safeguarding the waste management facilities shown in Table 4.4, ELWA also safeguarded the land listed within Table 4.5 within the ELWA Joint Waste DPD with the
intention that the land will be used to develop new waste management facilities. A plan showing the safeguarded land has been taken from the Joint Waste DPD and is shown in
Figure 4.3.
4.32 The medium scale AD plant (run by Refood UK Limited) and the small scale IVC plant (run by East London Biogas Opco Limited) listed within Table 4.5 are now operational. A
planning application has been submitted for the medium scale recovery plant, construction began in 2018 but has since been halted and an application has been submitted for a
variation of conditions (see Table 4.6 for more details).
Table 4.5 Safeguarded Land within LBBD to be used for the Development of New Waste Management Facilities
Area Scale of Planned
Facilities Type Existing
Use Landowner Timescale Current
Status Additional Notes
Dagenham Dock Sustainable
Industries Park
1 Medium Scale
Recovery Strategic Industrial
Location
London Thames Gateway Urban Development
Corporation
2010-2020 To be
determined
Application has been submitted in 2010 by Thames Gateway Power for the development of an energy generation facility to generate low carbon renewable combined heat and power. This development would utilise 120,000 tonnes of non-recyclable waste
using 3.34 hectares of land in the northern part of the Sustainable Industries Park. (Application references: 13/01134/FUL,
18/01501/FUL).
1 Medium Scale
AD Operational Operated by Refood UK Limited.
1 Small Scale IVC Operational Operated by East London Biogas Opco Limited.
4.3.3 Capacity to be Determined
4.33 Table 4.4 and Table 4.5 show the existing and planned waste management facilities which has been safeguarded for the future. Table 4.6 identifies planning applications for future
waste management facilities within LBBD and therefore potential future waste capacity for LBBD.
4.34 Table 4.6 shows that there have been two planning applications submitted for waste management developments in LBBD that are yet to be constructed. One application for the
development of an energy from waste facility at 75-77 Chequers Lane is still being determined, but if this development is approved it will provide an additional 57,600 tonnes of
waste capacity for LBBD. Construction has begun on the gasification plant on North Choats Road listed in the second planning application, however construction has since ceased,
and an application has been submitted for a variation of conditions. If the plant is fully built, it will provide an additional 200,000 tonnes of waste capacity for LBBD.

Prepared for: Be First
AECOM 31
Figure 4.3 Safeguarded Land within LBBD for the Development of Waste Management Facilities
Source: ELWA Joint Waste DPD

Prepared for: Be First
AECOM 32
Table 4.6 Planning Applications for Waste Development in LBBD
Date Status Application
Reference Location Applicant Description of Development Type Processing
Capacity Additional Notes
2020: Planning
application submitted
Being Determined (Application stage 5 –
Consultation
complete)
20/00331/CTY Connect Waste Ltd, 75-77 Chequers Lane, Dagenham,
RM9 6QJ
Mr Neil Richardson (Riverside
Energy Limited)
Development of an energy from waste facility and associate infrastructure based on the processing of non-hazardous fuels
at 75-77 Chequers Lane, Dagenham.
- 57,600
tonnes
-
November 2014: Planning application
approved
December 2018:
Construction began
August 2019: Application submitted for variation of
conditions (and
approved)
Construction started but
halted
13/01134/FUL
18/01501/FUL
Plot 2, North Choats Road, Barking, RM9
6LF
Thames Gateway Waste
to Energy Ltd
Construction to date: foundations and
drainage infrastructure.
Variation of conditions: 2 (plan numbers), 3
(maximum waste throughput of 200,000),
20 (hard landscaping) and 21 (car parking).
Gasification 200,000
tonnes
Google maps satellite imaging shows the site as overgrown and no
construction activities
appear to be taking place.
Source: LBBD Planning Portal (Ref 56)

Waste Need Assessment
Prepared for: Be First
AECOM 33
Future Need for Waste Management Facilities 4.35 The NPPG requires waste planning authorities to identify any waste capacity gaps in total and for each
waste stream. By identifying if there are any waste capacity gaps, waste planning authorities can assess
whether there is a need for additional waste management facilities in the future.
4.36 As this assessment is only to cover the interim period between now and when the revised ELWP is
adopted, the waste capacity gap has only been assessed for the next five years (i.e. until 2026).
4.37 Overall LBBD will be required to manage 1,154,758 tonnes of waste in 2026 and will have a capacity to
manage 1,532,065 tonnes. Therefore, it can be seen that LBBD currently has enough capacity to manage
the HIC apportionment target (with a surplus of 116,654 tonnes) and the CD&E waste (with a surplus of
262,679 tonnes) generated from the borough and will have a total surplus capacity of 687,417 tonnes .
However, it is recognised that waste is a cross-boundary issue and LBBD imports and exports significant
amounts of both HIC and CD&E waste; for more information on imports and exports please see Section 5.
4.4.1 HIC Waste
4.38 The HIC apportionment targets have been compared to the current capacity within existing waste
management facilities in LBBD.
4.39 The apportionment target for 2026 and the total waste capacity available is shown in Table 4.7. It can be
seen that the capacity within LBBD available for the HIC apportionment is sufficient and that there is
additional capacity of 116,654 tonnes per annum.
Table 4.7 Summary of Capacity Available for 2026 HIC Apportionment compared to the Apportionment
Target
Apportionment Target (tpa) Total Capacity Available for HIC
Apportionment (tpa) Surplus Capacity (tpa)
513,000 629,654 116,654
4.4.2 CD&E Waste
4.40 The forecasted CD&E waste arisings have been compared to the current capacity within existing waste
management facilities in LBBD for managing CD&E waste.
4.41 The forecasted CD&E waste arising for 2026 and the total waste capacity available for managing CD&E
waste are shown in Table 4.8. Therefore, it can be seen that the capacity available for managing CD&E
waste generated from LBBD is sufficient and that there is additional capacity of 262,679 tonnes per
annum for managing CD&E waste.
Table 4.8 Summary of 2026 Capacity Available for CD&E Waste compared to the Forecasted Arisings
Forecasted CD&E Waste Arising (tpa) Total Capacity Available for CD&E
Waste (tpa) Surplus Capacity (tpa)
639,732 902,411 262,679

Waste Need Assessment
Prepared for: Be First
AECOM 34
5. Imports and Exports
Introduction 5.1 Although it is understood that waste should be treated in line with the proximity principle (treated and
disposed of as close to its origin as possible) and waste planning regions should aim to be self-sufficient,
there are a number of reasons why waste materials may be sent across borders to be treated in waste
management facilities located within other waste planning regions. As well as some waste streams
requiring specialist treatment facilities located outside of the waste planning region and some local
authorities being unable to provide space for waste management facilities (such as the City of London), it
is also understood that some waste management companies have long-term contractual obligations which
means that waste flows across borders.
5.2 The Localism Act (introduced in 2011) (Ref 57) places a legal duty on local planning authorities, county
councils and other prescribed bodies to engage constructively and actively on an ongoing basis in relation
to strategic matters. This is known as the ‘Duty to Co-operate’. The NPPF includes the following as a
strategic matter that should be covered:
• The provision of infrastructure for transport, telecommunications, waste management, water supply,
wastewater, flood risk and the provision of minerals and energy (including heat).
5.3 According to the Publication London Plan, in 2015 London managed 7.5 million tonnes (mt) of its own
waste, exported 11.4 mt of waste and imported 3.6 mt of waste, giving London a net self-sufficiency rate of
~60%.
5.4 The Mayor of London is planning to work with London boroughs and regional technical advisory bodies to
address the issue of cross-boundary waste flows. In order to understand how self-sufficient LBBD is as a
whole is important to recognise the amount of waste imported and exported from LBBD.
Imports
5.2.1 Methodology
5.5 The EA’s WDI was used in order to calculate the amount of waste imported into LBBD and data was taken
for the years 2015-2019. A full methodology for imports and exports is provided in Appendix E.
5.2.2 Results
5.6 Table 5.1 shows that on average only 5% of waste received by waste management facilities in LBBD
originates from Barking and Dagenham. The majority of the waste (on average 53%) comes from London
(excluding LBBD) and the rest (on average 42%) comes from other areas outside of London. The split
between the origin of the waste received in LBBD waste management facilities over the years 2015 to
2019 appears to have stayed reasonably consistent.
Table 5.1. Split between the Origin of Waste Received by Waste Management Facilities in LBBD between
2015 and 2019
Year LBBD London Other Areas Total
Tonnes % Tonnes % Tonnes % Tonnes %
2019 118,591 5% 1,295,887 54% 987,127 41% 2,401,605 100%
2018 74,299 4% 918,054 52% 790,677 44% 1,783,030 100%
2017 49,712 3% 713,134 46% 792,090 51% 1,554,936 100%
2016 106,465 6% 921,202 53% 701,141 41% 1,728,808 100%
2015 92,566 6% 993,390 61% 526,239 33% 1,612,195 100%
Total 441,633 - 4,841,667 - 3,797,274 - 9,080,574 -
Average 88,327 5% 968,333 53% 759,455 42% 1,816,115 100%
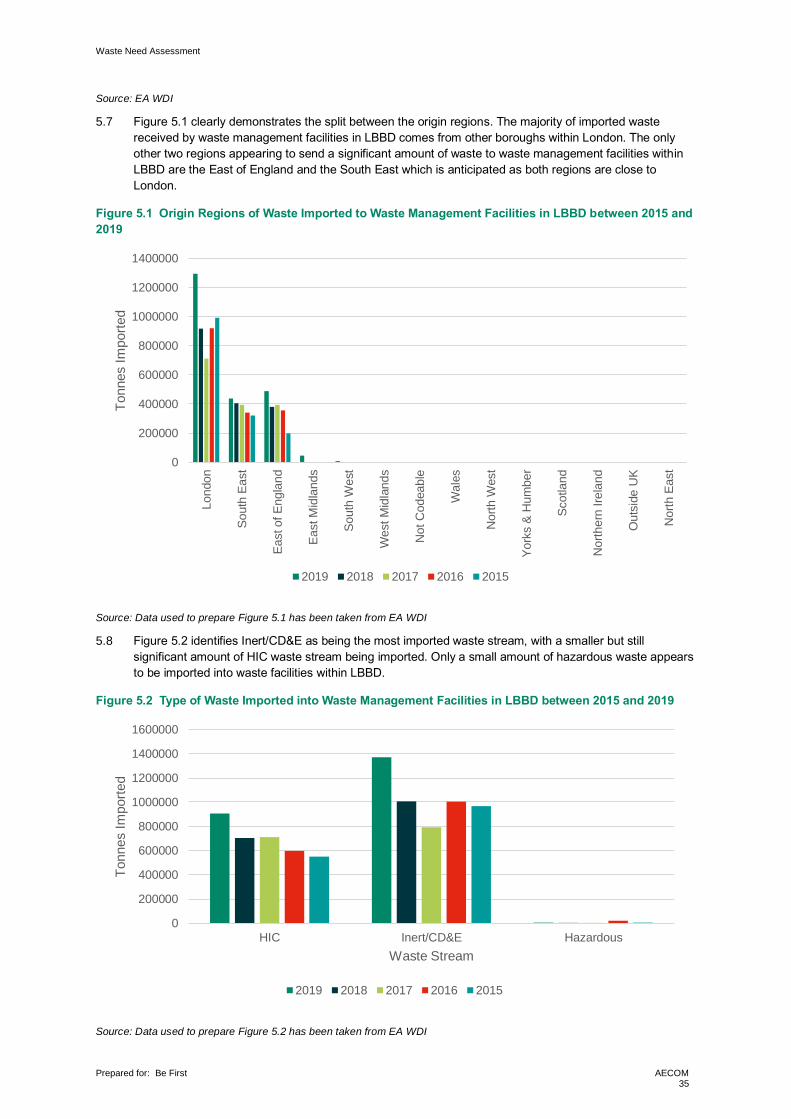
Waste Need Assessment
Prepared for: Be First
AECOM 35
Source: EA WDI
5.7 Figure 5.1 clearly demonstrates the split between the origin regions. The majority of imported waste
received by waste management facilities in LBBD comes from other boroughs within London. The only
other two regions appearing to send a significant amount of waste to waste management facilities within
LBBD are the East of England and the South East which is anticipated as both regions are close to
London.
Figure 5.1 Origin Regions of Waste Imported to Waste Management Facilities in LBBD between 2015 and
2019
Source: Data used to prepare Figure 5.1 has been taken from EA WDI
5.8 Figure 5.2 identifies Inert/CD&E as being the most imported waste stream, with a smaller but still
significant amount of HIC waste stream being imported. Only a small amount of hazardous waste appears
to be imported into waste facilities within LBBD.
Figure 5.2 Type of Waste Imported into Waste Management Facilities in LBBD between 2015 and 2019
Source: Data used to prepare Figure 5.2 has been taken from EA WDI
0
200000
400000
600000
800000
1000000
1200000
1400000
Lon
do
n
South
East
East of E
ngla
nd
East M
idla
nds
South
West
West M
idla
nds
Not C
odeable
Wale
s
Nort
h W
est
York
s &
Hum
ber
Scotland
Nort
hern
Ire
land
Outs
ide U
K
Nort
h E
ast
Tonnes I
mport
ed
2019 2018 2017 2016 2015
0
200000
400000
600000
800000
1000000
1200000
1400000
1600000
HIC Inert/CD&E Hazardous
Tonnes I
mport
ed
Waste Stream
2019 2018 2017 2016 2015

Waste Need Assessment
Prepared for: Be First
AECOM 36
Exports
5.3.1 Results
5.9 Table 5.2 shows that the majority of the waste removed from waste management facilities in LBBD was
sent to areas outside of London (on average 88%), only 10% on average was sent to waste management
facilities located in other London boroughs. Table 5.2 also shows internal movements of waste within
LBBD. On average, around 2% of waste exported from waste management facilities in LBBD will be sent
to another facility also located within LBBD.
Table 5.2 Split between the Destination of the Waste Exported by Waste Management Facilities in LBBD
between 2015 and 2019
Year LBBD London Other Areas Total
Tonnes % Tonnes % Tonnes % Tonnes %
2019 94,352 6% 143,023 9% 1,329,183 85% 1,566,558 100%
2018 35,308 3% 188,551 14% 1,108,161 83% 1,332,020 100%
2017 15,097 1% 171,850 13% 1,120,304 86% 1,307,251 100%
2016 11,943 1% 101,538 8% 1,124,288 91% 1,237,769 100%
2015 22,552 2% 45,087 4% 1,113,810 94% 1,181,449 100%
Total 179,252 - 650,049 - 5,795,746 - 6,625,047 -
Average 35,850 2% 130,010 10% 1,159,149 88% 1,325,009 100%
Source: EA WDI
5.10 It can be seen from Figure 5.3 that, on average, the majority of waste exported from waste management
facilities in LBBD is sent to the East of England. Significant amounts of waste are also sent to facilities in
the South East of England, and also sent to countries outside of the UK. This corresponds to the data
published in the Publication London Plan, which states that in 2015, approximately 5 mt (49%) of waste
exported from London went to the East of England and 4.2 mt (42%) went to the South East, with 1.5 mt
being sent overseas.
5.11 Figure 5.3 also shows that a reasonable amount of waste is also sent from facilities in LBBD to other
London boroughs.
Figure 5.3 Destination Regions of Waste Exported from Waste Management Facilities in LBBD between
2015 and 2019
0
100000
200000
300000
400000
500000
600000
East of E
ngla
nd
Outs
ide U
K
South
East
London
East M
idla
nds
York
s &
Hum
ber
Not C
odeable
South
West
Nort
h W
est
Scotland
West M
idla
nds
Wale
s
Nort
h E
ast
Nort
hern
Ire
land
Tonnes E
xport
ed
2019 2018 2017 2016 2015

Waste Need Assessment
Prepared for: Be First
AECOM 37
Source: Data used to prepare Figure 5.3 has been taken from EA WDI
5.12 Figure 5.4 identifies HIC as being the most exported waste stream from waste management facilities in
LBBD. This is different to the trends highlighted within the Publication London Plan, which identifies that
the bulk of the waste exported from London as a whole is CD&E waste.
5.13 Similar to imported waste into LBBD facilities, only a small amount of hazardous waste appears to be
exported from LBBD.
Figure 5.4 Type of Waste Exported from Waste Management Facilities in LBBD between 2015 and 2019
Source: Data used to prepare Figure 5.4 has been taken from EA WDI
5.14 The reliability of the EA WDI data used to calculate the amount of waste imported into and exported from
LBBD is reliant on the accuracy with which the operators report the waste movements. It can be seen in
both Figure 5.1 and Figure 5.3 that there is a certain proportion of the waste which has an origin of “non
codable”. This is because waste operators are not required to provide the origin or destination of the
waste received/removed. In addition, the origin code of waste can be lost as it is processed through a
facility and mixed with other wastes, and there is no regulatory impetus for waste importers to state the
origin of wastes they receive. Therefore, it should be taken into consideration that there are some
limitations on the accuracy of the recorded amount of waste imported into and exported from LBBD.
Imports and Exports Summary
5.15 On average 1,727,788 tonnes of waste per annum were imported into waste management facilities in
LBBD from regions outside of Barking and Dagenham. The biggest source of imported waste was
London, with the East of England and the South East being the only two other significant sources of
imported waste. Inert/CD&E waste was the most imported type of waste to facilities in LBBD.
5.16 On average 1,289,159 tonnes of waste per annum were exported from waste management facilities in
LBBD to regions outside of Barking and Dagenham. The majority of exported waste was sent to the East
of England, with significant amount of waste also sent to the South East of England and outside of the UK.
HIC waste w as the most exported type of waste from waste management facilities in LBBD.
5.17 Overall, the waste management facilities within LBBD import more waste than is exported.
0
200000
400000
600000
800000
1000000
1200000
HIC Inert/CD&E Hazardous
Tonnes E
xport
ed
Waste Stream
2019 2018 2017 2016 2015

Waste Need Assessment
Prepared for: Be First
AECOM 38
6. Conclusions and Recommendations
The Need for Future Waste Capacity
6.1.1 HIC Waste
6.1 As described within Section 3.2, this assessment uses the GLA apportionment targets and tonnages for
HIC waste (as set out in the Publication London Plan) to determine if LBBD has sufficient waste
management capacity available within the borough. The waste management capacity currently available
within LBBD and any potential future capacity has been determined in Section 4.
6.2 To summarise, the GLA apportionment target for HIC waste in 2026 is 513,000 tonnes and the total waste
capacity currently available within LBBD for the HIC apportionment is 629,654 tonnes. Therefore, there is
a surplus of 116,654 tonnes of capacity available within LBBD.
6.3 In conclusion, the waste management capacity within LBBD available for HIC apportionment is sufficient.
6.1.2 CD&E Waste
6.4 The Publication London Plan does not provide apportionment targets for CD&E waste, therefore CD&E
waste arisings have been forecasted using the GLA’s London labour market projections. The forecasted
CD&E waste arisings can be found in Section 3.3.
6.5 The forecasted CD&E arising for 2026 is 639,732 tonnes, and LBBD has a total capacity of 902,411
tonnes available to manage CD&E waste. This leaves a surplus capacity of 262,679 tonnes per annum.
6.1.3 Other Waste Streams
6.6 As required by the NPPG, this assessment has also considered hazardous waste, agricultural waste,
wastewater and low-level radioactive waste.
6.7 Hazardous waste arisings have been included within the HIC apportionments and CD&E waste arisings
and therefore the hazardous waste arisings should not be added to the total capacity.
6.8 Only a small amount of agricultural waste was generated in LBBD over the past five years (less than
0.02% of LBBD’s apportionment target), therefore it can be concluded that there is no need to consider
specific future waste management capacity for agricultural waste in LBBD.
6.9 It is not possible to calculate wastewater arisings with the available datasets from the EA. Moreover, the
management of wastewater primarily falls under the jurisdiction of Thames Water. The provision of
treatment facilities is usually considered on a case-by-case basis in discussion with developers, and
consequently, it has not been considered necessary to make strategic provision for such facilities over the
assessment period.
6.10 There are no nuclear power plants operating within LBBD, and there are no non-nuclear organisations
located within LBBD appearing on the public register as keeping/using or disposing of radioactive waste.
Therefore, it can be concluded that there is no requirement for LBBD to provide waste management
infrastructure for the treatment of low-level radioactive waste.
6.1.4 Imports and Exports
6.11 On average 1,727,788 tonnes of waste per annum were imported into waste management facilities within
LBBD from regions outside of Barking and Dagenham. Around 53% of the waste received by waste
management facilities in LBBD originated from other London boroughs. Of the 42% of waste received
from other areas outside of London, the two regions sending significant amount of waste to LBBD are the
East of England and the South East of England.
6.12 On average 1,289,159 tonnes of waste per annum were exported from waste management facilities in
LBBD to regions outside of Barking and Dagenham. The majority of the waste removed from waste
management facilities in LBBD (88%) was exported to regions outside of London, and only 10% was sent
Waste Need Assessment
Prepared for: Be First
AECOM 39
to other London boroughs. The majority of the waste was sent to the East of England, with significant
amounts of waste also exported to the South East of England and also to countries outside of the UK.
Around 2% of the waste exported from waste management facilities in LBBD was sent to other facilities
also located within Barking and Dagenham.
6.13 Overall, more waste is imported into than is exported from waste management facilities in LBBD.
7. Future Trends and Potential Impacts 7.1 Through the Environment Bill (Ref 58), resource and waste policy instruments are due to be rolled out
from the early 2020s. As described in Section 2, policy such as consistent collections, digital waste
tracking, extended producer responsibility and improved labelling on household consumable products may
see a change in the composition of household, industrial and commercial wastes received by facilities in
the borough and an increase in recycling rates; with both MRFs and waste transfer stations able to
produce a higher output of recyclable material as a result. Conversely, should EPR act as a strong
incentive for producers to design products which last longer and/or are repairable then the overall
tonnages of HIC waste received within LBBD could be reduced.
7.2 Dependent on the nature of its roll out, a national deposit return scheme for on the go drinks containers
could also impact the ELWA’s revenue stream; as materials such as PET plastic bottles (which provide an
important source of income for local authorities) may be managed and collected independently of the
authority. With a potentially significant decrease in materials such as aluminium, plastic bottles and glass,
for MRFs (and waste transfer stations with an element of sorting) within LBBD, there may also be a need
for changes or recalibration of MRF operations to capture separate recycling streams, and an overall
change to the funding profiles of these facilities. There are two MRFs in LBBD which receive HIC waste;
Veolia E S (UK) Limited, and Suez Recycling and Recovery UK Ltd, both companies have a national
presence across the waste industry and are well positioned to accommodate changes to waste
compositions in the future.
7.3 Following in Scotland’s footsteps, legislation mandating the separate collections of food waste for England
is due to be rolled out from 2023. LBBD is home to two anaerobic digestion installations, ReFoods Ltd and
East London Biogas Ltd and so it may be that tonnages received by these facilities increase with the
introduction.
7.4 The GLA’s Circular Economy Statements require referable developments to provide details of how their
building will be designed in accordance with circular economy principles and may in turn also reduce the
amount of CD&E waste produced and influence how it is managed. The UK’s ratification of the EU’s
Circular Economy Package, and its associated targets may further influence future waste arisings for
LBBD. For example, indicative studies suggest that prevention efforts in commerce and industry may also
reduce rates of waste generation per employee. In particular, with increasing servitisation (the
replacement of purchasing goods by hiring them instead, goods may be leased by customers, and
subsequently returned to producers for re-manufacturing, rather than entering the waste stream. Reductions from circular economy initiatives have indicated that a high uptake of urban analytic systems,
leased assets, and exchange/sharing platforms could significantly reduce commercial and industrial waste
production by up to 45% by 2031 (Ref 59).
7.5 There are a number of events to consider when looking ahead to the future of recycling and waste within
the Borough of Barking and Dagenham. The ongoing COVID-19 crisis has seen a significant shift in
behaviours, which have in turn impacted the UK’s recyclate and waste markets. Whilst the long-term
impacts of the COVID-19 pandemic are unknown, it may be that a reduction in paper usage has been
further sped up via a prioritisation of reduced hand and personal contact. Improvements in data security
and storage with increasing reliance on information technology could further lead to a reduction in the
long-term; conservative estimates based on household consumption behaviours suggest that this could
equate to a 20% reduction in use of newspapers, magazines and other papers (Ref 60). However, It is
impossible to determine whether these trends are permanent at the time of writing, and whether the policy
interventions expected in the early 2020s will have the same impact.

Waste Need Assessment
Prepared for: Be First
AECOM 40
7.6 Moreover, consideration of the neighbouring boroughs, and planning applications currently being
determined will also need to be considered in relation to the impact on the capacity requirements of LBBD.
LBBD is a part of the ELWA and it is recognised that the borough will need to work with its neighbours
either through the Duty To Cooperate, or as part of joint working on a joint plan.

Waste Need Assessment
Prepared for: Be First
AECOM 41
8. References Ref 1. London Borough of Barking and Dagenham (LBBD), (2020); Draft Local Plan, Regulation 19
Consultation Version.
Ref 2. Greater London Authority (GLA), (2020); Publication London Plan.
Ref 3. East London Waste Authority (ELWA), (2012); Joint Waste Development Plan Document.
Ref 4. Directive 2008/98/EC of the European Parliament and of the Council of 19 November 2008 on waste and
repealing certain Directives.
Ref 5. Directive (EU) 2018/851 of the European Parliament and of the Council of 30 May 2018 amending
Directive 2008/98/EC on waste.
Ref 6. Council Directive 1999/31/EC of 26 April 1999 on the landfill of waste.
Ref 7. Directive (EU) 2018/850 of the European Parliament and of the Council of 30 May 2018 amending
Directive 1999/31/EC on the landfill of waste.
Ref 8. European Parliament and Council Directive 94/62/EC of 20 December 1994 on packaging and
packaging waste.
Ref 9. Directive (EU) 2018/852 of the European Parliament and of the Council of 30 May 2018 amending
Directive 94/62/EC on packaging and packaging waste.
Ref 10. Directive (EU) 2018/849 of the European Parliament and of the Council of 30 May 2018 amending
Directives 2000/53/EC on end-of-life vehicles, 2006/66/EC on batteries and accumulators and waste
batteries and accumulators, and 2012/19/EU on waste electrical and electronic equipment.
Ref 11. Directive 2000/53/EC of the European Parliament and of the Council of 18 September 2000 on end-of
life vehicles.
Ref 12. Directive 2006/66/EC of the European Parliament and of the Council of 6 September 2006 on batteries
and accumulators and waste batteries and accumulators and repealing Directive 91/157/EEC.
Ref 13. Directive 2012/19/EU of the European Parliament and of the Council of 4 July 2012 on waste electrical
and electronic equipment (WEEE).
Ref 14. European Commission, (2020); Communication from the Commission to the European Parliament, the
Council, the European Economic and Social Committee and the Committee of the Regions, A new
Circular Economy Action Plan, COM(2020) 98 Final.
Ref 15. Department for Communities and Local Government (DCLG), (2014); National Planning Policy for
Waste.
Ref 16. GLA, (2016); The London Plan, Spatial Development Strategy for London, Consolidation with Alterations
since 2011.
Ref 17. Ministry of Housing, Communities and Local Government (MHCLG), (2019); National Planning Policy
Framework (NPPF).
Ref 18. DCLG, (2015); National Planning Practice Guidance: Waste [available online]
http://planningguidance.planningportal.gov.uk/blog/guidance/waste
Ref 19. Her Majesty’s Stationary Office (HMSO), (2017); Industrial Strategy, Building a Britain fit for the future.
Ref 20. HMSO, (2018); Our Waste, Our Resources: A Strategy for England.
Ref 21. HMSO, (2018); A Green Future: Our 25 Year Plan to Improve the Environment.
Ref 22. Department for Environment, Food and Rural Affairs (Defra), (2021); Waste Management Plan for
England.
Ref 23. Defra, (2013); Waste Management Plan for England.
Ref 24. HMSO, (2011); The Waste (England and Wales) (Amendment) Regulations 2014.
Ref 25. HMSO, (2017); The Clean Growth Strategy, Leading the way to a low carbon future.
Ref 26. HMSO, (2017); Litter Strategy for England.

Waste Need Assessment
Prepared for: Be First
AECOM 42
Ref 27. Defra, (2012); UK Plan for Shipments of Waste.
Ref 28. Defra, (2013); National Policy Statement for Hazardous Waste: A framework document for planning
decisions on nationally significant hazardous waste infrastructure.
Ref 29. Department of Energy and Climate Change (DECC), (2011); National Policy Statement for Renewable
Energy Infrastructure (EN-3).
Ref 30. GLA, (2021); London Plan.
Ref 31. GLA, (2018); London Environment Strategy.
Ref 32. LBBD, (2010); Planning for the future of Barking and Dagenham, Core Strategy, Local Development
Framework.
Ref 33. LBBD, (2011); Planning for the future of Barking and Dagenham, Borough Wide Development Policies,
Development Plan Document (DPD), Local Development Framework.
Ref 34. LBBD, (2010); Planning for the future of Barking and Dagenham, Site Specific Allocations, Development
Plan Document (DPD), Local Development Framework.
Ref 35. LBBD, (2011); Planning for the future of Barking and Dagenham, Barking Town Centre Area Action Plan,
Local Development Framework.
Ref 36. LBBD, (2012); Local Development Framework Proposals Map.
Ref 37. Defra, (2011); Local authority collected waste – definition of terms [accessed online 10/02/2021]
https://www.gov.uk/guidance/local-authority-collected-waste-definition-of-
terms#:~:text=In%20fact%20the%20definition%20of,not%20collected%20by%20Local%20Authorities
Ref 38. SLR Consulting, (2017); London Plan Waste Forecasts and Apportionments, Task 1 – GLA Waste
Arisings, Model Critical Friend Review (prepared for the GLA).
Ref 39. Environment Agency (EA), (2020); Waste Data Interrogator (2015, 2016, 2017, 2018 and 2019).
Ref 40. GLA, (2017); London labour market projection 2017.
Ref 41. GLA, (2017); London Datastore, London Long Term Labour Market Projections [accessed online
21/01/2021] https://data.london.gov.uk/dataset/long-term-labour-market-projections
Ref 42. HMSO, (2005); List of Wastes (England) Regulations 2005.
Ref 43. EA, (2020); Hazardous Waste Data Interrogator (2019).
Ref 44. Environmental Association for University and Colleges (EAUC), (2021); Agricultural Waste – More Detail
[accessed online 21/01/2021] https://www.sustainabilityexchange.ac.uk/agricultural_waste_-
_more_detail#:~:text=Agricultural%20waste%20is%20defined%20as,Horticulture
Ref 45. HMSO, (2006); The Waste Management (England and Wales) Regulations 2006.
Ref 46. Thames Water Utilities Limited, (2021); About Us [accessed online 21/01/2021]
https://www.thameswater.co.uk/about-us
Ref 47. HMSO, (1993); Radioactive Substances Act 1993.
Ref 48. Nuclear Decommissioning Authority (NDA), (2021); About radioactive waste [accessed online
21/01/2021] https://ukinventory.nda.gov.uk/about-radioactive-waste/what-is-radioactivity/what-are-the-
main-waste-categories/
Ref 49. EA, (2021); Environmental Permitting Regulations – Radioactive Substances [accessed online
21/01/2021] https://environment.data.gov.uk/public-register/view/search-radioactive-substances-permits
Ref 50. EA, (2021); Public Registers [accessed online 22/01/2021] https://environment.data.gov.uk/public-
register/view/index
Ref 51. Consolidated text: Directive 2008/98/EC of the European Parliament and of the Council of 19 November
2008 on waste and repealing certain Directives (Text with EEA relevance).
Ref 52. EA, (2021); Register of Waste Exemptions [accessed online 26/01/2021]
https://environment.data.gov.uk/public-register/view/search-waste-exemptions
Ref 53. Jacobs, (2014); New Methodology to Estimate Waste Generation by the Commercial and Industrial
Sector in England, Project Report (prepared for Defra).

Waste Need Assessment
Prepared for: Be First
AECOM 43
Ref 54. EA, (2020); 2019 Remaining Landfill Capacity.
Ref 55. EA, (2016); Standard Rules SR2015 No.39, Use of waste in a deposit for recovery operation
(Construction, reclamation, restoration or improvement of land other than by mobile plant).
Ref 56. LBBD, (2021); Planning Portal [accessed online 02/02/2021] https://online-
befirst.lbbd.gov.uk/planning/index.html
Ref 57. HMSO, (2011); The Localism Act 2011.
Ref 58. House of Commons, (2020); Environment Bill, as amended in committee.
Ref 59. London Recycling and Waste Board (LWARB), (2017); Circular Economy Effects on Waste Production in
London.
Ref 60. GLA, (2017); SLR - London Plan Waste Forecasts and Apportionments
Ref 61. GLA (2018) London Local Aggregates Assessment

Waste Need Assessment
Prepared for: Be First
AECOM 44
Appendix A Additional Legislation and Policies
Barking and Dagenham Local Plan (2010) i. The justification for Policy CR3 is provided in Paragraph 5.3.1 in the Barking and Dagenham Local Plan.
ii. Paragraph 5.3.1 states that “the Council is committed to help the delivery of national and regional targets
for recycling and composting as set out in the Waste Strategy for England 2007 and the London Plan.” A
summary of the targets for recycling and composting have been provided in Table A.
Table A. Recycling and Composting Targets
Recycling and Composting Targets 2010 2015 2020
Municipal Waste 40% 45% 50%
Commercial & Industrial Waste - - 70%
Construction & Demolition Waste - - 95%
iii. Paragraph 5.3.1 also states the following in relation to the targets provided in Table A:
• “To ensure London meets its responsibility to help achieve these targets, the London Plan sets out
‘Waste Apportionments’ for each London Borough to meet by 2020. Building on the Council’s good
working relationship established through the East London Waste Authority (ELWA), and in order to
plan for waste strategically, the Council is working with the London Boroughs of Havering, Newham
and Redbridge on a Joint Waste DPD. This document will identify existing waste management
capacity within the four Boroughs which already contribute towards meeting the joint waste
apportionment and which will therefore be safeguarded. It will also clarify our preferred locations for
the additional facilities necessary to fully meet the Borough’s apportionment, and set out criteria
based policies to be used in assessing planning applications for waste management facilities. This
will ensure the ELWA boroughs fulfil their duty to help meet the challenging targets which the London
Plan sets out to ensure there are sufficient facilities available within the region to manage the
majority of waste arising within London by 2020.
• The Joint Waste DPD will assist the Borough in meeting its own ambitious aspirations for sustainable
waste management, as set out in the London Borough of Barking and Dagenham Waste Strategy,
which seeks to ensure Barking and Dagenham:
o Has the cleanest streets in London.
o Has the greatest waste reduction and highest recycling and composting rates in London.
o Delivers effective, efficient and customer focused services that demonstrates value for money.”
London Plan (2016) iv. The London Plan (2016) is the overall strategic plan for London, setting out an integrated economic,
environmental, transport and social framework for the development of London over the next 20–25 years.
It provides a London-wide policy context within which boroughs should set their detailed local planning
policies. The aim of the Plan’s waste policies is to achieve net self-sufficiency for household and
commercial waste by 2026.
v. The current plan supersedes the previous London Plan (2011). The relevant policies and paragraphs of the
London Plan have been provided within Table B.

Waste Need Assessment
Prepared for: Be First
AECOM 45
Table B. Policies and Paragraphs within the London Plan which are relevant to this Assessment
Policy/Paragraph Description
Paragraph 5.65 States inter alia that:
“The Mayor is committed to a policy framework for waste management which starts from the position the best approach is to reduce the amount of waste that arises in the first place. Where this is not possible, he supports an approach based on the waste hierarchy that emphasises re-use, and
then recycling and composting, before energy recovery and disposal… The Mayor believes that making better use of waste has a major role to play in tackling climate change and that London’s waste is a valuable resource that should be exploited for London’s benefit, and not solely a disposal
problem.”
Paragraph 5.67 States that:
“London should manage as much of the capital’s waste within its boundaries as practicable, enabling London and Londoners to receive environmental and economic benefits from its
management. The Mayor acknowledges that waste contracts do not recognise administrative boundaries and that waste flows across borders. Consequently the aim of his waste policies is to
achieve net self-sufficiency for household and commercial waste by 2026.”
Policy 5.16: Waste
Net Self-Sufficiency
• States that the Mayor will work with London boroughs and waste authorities and others to manage as much of London’s waste within London as practicable, working towards managing
the equivalent of 100% of London’s waste within London by 2026.
• States that this will be achieved by:
─ Minimising waste;
─ Encouraging the reuse of and reduction in the use of materials;
─ Exceeding recycling/composting levels in local authority collected waste (LACW) of 45% by
2015, 50% by 2020 and aspiring to achieve 60% by 2031;
─ Exceeding recycling/composting levels in commercial and industrial waste of 70% by 2020;
─ Exceeding recycling and reuse levels in construction, demolition and excavation (CD&E)
waste of 95% by 2020;
─ Improving London’s net self-sufficiency through reducing the proportion of waste exported
from the capital over time; and
─ Working with neighbouring regional and district authorities to coordinate strategic waste
management across the greater south east of England.
Policy 5.17: Waste
Capacity
• States that the Mayor supports the need to increase waste processing capacity in London, and that he will work with London boroughs and waste authorities to identify opportunities for introducing new waste capacity, including strategically important sites for waste management and treatment, and resource recovery parks/consolidation centres, where recycling, recovery
and manufacturing activities can co-locate.
• Sets out the criteria against which proposals for waste management should be evaluated against, and states with regard to Local Development Framework (LDF) preparation that “boroughs must allocate sufficient land and identify waste management facilities to provide
capacity to manage the tonnages of waste apportioned in this Plan”, noting that boroughs may
wish to collaborate by pooling their apportionment requirements.
• The Plan’s apportionment target for the LBBD is 404,000 tonnes per annum (tpa) by 2021, and
502,000 tpa by 2036 (6.1% of share of waste to be managed in London).
Policy 5.18: Construction,
Excavation and
Demolition Waste
• States inter alia with regard to planning decisions that new CD&E waste management facilities should be encouraged at existing waste sites, and that waste should be removed from
construction sites, and materials brought to the site, by water or rail transport wherever that is
practicable.
• States that “LDFs should require developers to produce site waste management plans to
arrange for the efficient handling of CD&E waste and materials.”
Policy 5.19:
Hazardous Waste
• States that development proposals that would result in the loss of existing sites for the treatment and/or disposal of hazardous waste should not be permitted unless compensatory hazardous
waste site provision has been secured.
• States that LDFs should:
─ “Make provision for hazardous waste treatment plants to achieve, at regional level, the
necessary waste management requirements;
─ As part of meeting waste apportionment identify suitable sites for the storage, treatment and
reprocessing of relevant or a range of hazardous waste streams; and
─ Identify sites for the temporary storage, treatment and remediation of contaminated soils
and demolition waste during major developments.”
Policy 5.20:
Aggregates
• Encourages the “re-use and recycling of construction, demolition and excavation waste within
London”.
• States that the Mayor will work with strategic partners to achieve targets of 95% recycling/re-use of construction, demolition and excavation waste by 2020, and 80% recycling of that waste as
aggregates by 2020.

Waste Need Assessment
Prepared for: Be First
AECOM 46
Appendix B Description of European Waste Code (EWC) Categories
EWC Chapter Description
01 Wastes resulting from exploration, mining, quarrying, and physical and chemical treatment
of minerals
02 Waste from agriculture, horticulture, aquaculture, forestry, hunting and fishing, food
preparation and processing
03 Wastes from wood processing and the production of panels and furniture, pulp, paper and
cardboard
04 Wastes from the leather, fur and textile industries
05 Wastes from petroleum refining, natural gas purification and pyrolytic treatment of coal
06 Wastes from inorganic chemical processes
07 Wastes from organic chemical processes
08 Wastes from the manufacture, formulation, supply and use (MFSU) of coatings (paints,
varnishes and vitreous enamels), adhesives, sealants and printing inks
09 Wastes from the photographic industry
10 Waste from thermal processes
11 Wastes from chemical surface treatment and coating of metals and other materials; non-
ferrous hydrometallurgy
12 Wastes from shaping and physical and mechanical surface treatment of metals and plastics
13 Oil wastes and wastes of liquid fuels (except edible oils and those in chapters 05,12 and
19)
14 Waste organic solvents, refrigerants and propellants (except those found in chapters 07
and 08)
15 Waste packaging, absorbents, wiping cloths, filter materials and protective clothing not
otherwise specified
16 Wastes not otherwise specified in the list
17 Construction and demolition wastes (including excavated soil from contaminated sites)
18 Wastes from human or animal health care and/or related research (except kitchen and
restaurant wastes not arising from immediate health care)
19 Waste from waste management facilities, off-site wastewater treatment plants and the
preparation of water intended for human consumption and water for industrial use
20 Municipal wastes (household waste and similar commercial, industrial and institutional
wastes) including separately collected fractions
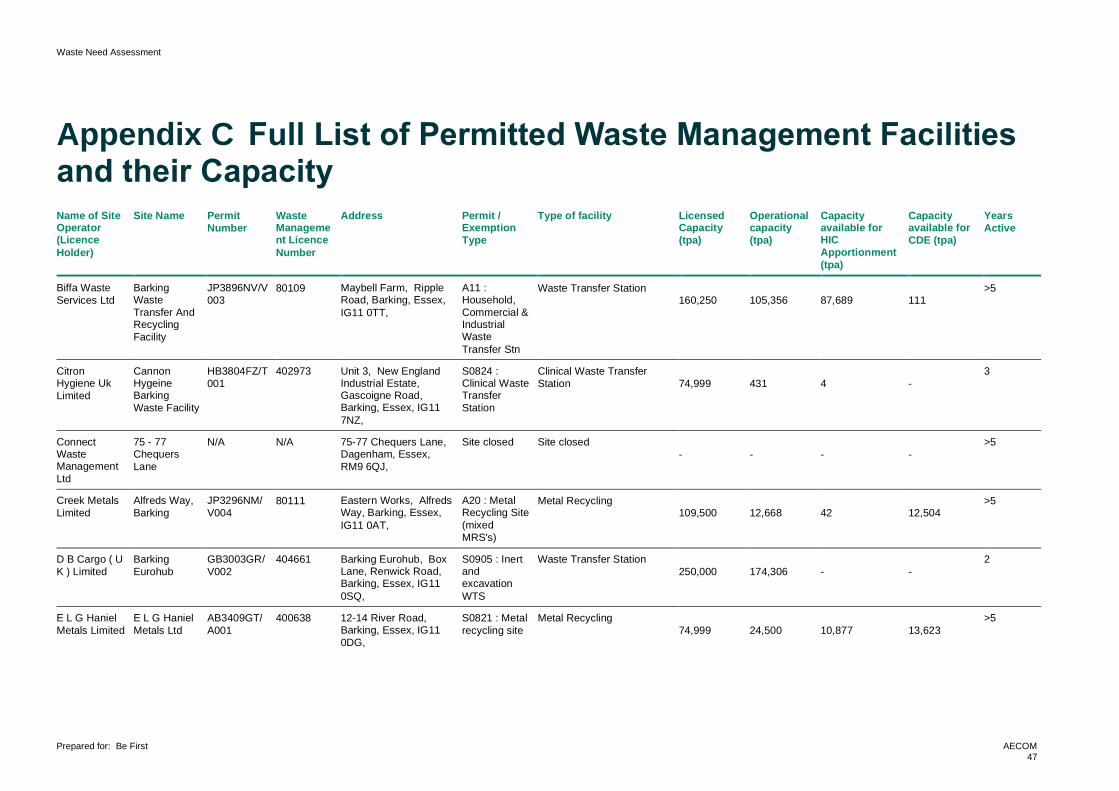
Waste Need Assessment
Prepared for: Be First
AECOM 47
Appendix C Full List of Permitted Waste Management Facilities and their Capacity Name of Site Operator (Licence
Holder)
Site Name Permit
Number
Waste Management Licence
Number
Address Permit / Exemption
Type
Type of facility Licensed Capacity
(tpa)
Operational capacity
(tpa)
Capacity available for HIC
Apportionment
(tpa)
Capacity available for
CDE (tpa)
Years
Active
Biffa Waste
Services Ltd
Barking Waste
Transfer And Recycling
Facility
JP3896NV/V
003 80109 Maybell Farm, Ripple
Road, Barking, Essex,
IG11 0TT,
A11 : Household,
Commercial & Industrial Waste
Transfer Stn
Waste Transfer Station
160,250
105,356
87,689
111 >5
Citron Hygiene Uk
Limited
Cannon Hygeine Barking
Waste Facility
HB3804FZ/T
001
402973 Unit 3, New England Industrial Estate, Gascoigne Road, Barking, Essex, IG11
7NZ,
S0824 : Clinical Waste Transfer
Station
Clinical Waste Transfer
Station
74,999
431
4
-
3
Connect Waste Management
Ltd
75 - 77 Chequers
Lane
N/A N/A 75-77 Chequers Lane, Dagenham, Essex,
RM9 6QJ,
Site closed Site closed
-
-
-
-
>5
Creek Metals
Limited
Alfreds Way,
Barking
JP3296NM/
V004 80111 Eastern Works, Alfreds
Way, Barking, Essex,
IG11 0AT,
A20 : Metal Recycling Site
(mixed
MRS's)
Metal Recycling
109,500
12,668
42
12,504 >5
D B Cargo ( U
K ) Limited
Barking
Eurohub
GB3003GR/
V002
404661 Barking Eurohub, Box Lane, Renwick Road, Barking, Essex, IG11
0SQ,
S0905 : Inert and excavation
WTS
Waste Transfer Station
250,000
174,306
-
-
2
E L G Haniel
Metals Limited
E L G Haniel
Metals Ltd
AB3409GT/
A001
400638 12-14 River Road, Barking, Essex, IG11
0DG,
S0821 : Metal
recycling site
Metal Recycling
74,999
24,500
10,877
13,623
>5

Waste Need Assessment
Prepared for: Be First
AECOM 48
East London Biogas Opco
limited
Organic Waste
Treatment Facility EPR/PP3437
WR
PP3437WR Waste
Installation
London Sustainable Industries Park,
Halyard Street, Dagenham Dock,
Dagenham, RM9 6LF,
T02 : AD
installation Anaerobic Digestion
999,999
38,804
38,804
- 3
Edwards
Recycling Ltd
Edwards
Recycling Ltd
CB3507KZ/
A001
402132 Perry Road, Off Chequers Lane, Dagenham, Essex,
RM9 6QD,
S0803 : HCI Waste TS +
treatment
Waste Transfer Station
74,999
7,881
-
-
1
Edwards Waste Paper
Ltd
LP3693EQ/
V002
80765 The Recycling Centre, Gallions Close, Off Thames Road, Barking,
Essex, IG11 0JD,
A11 : Household, Commercial & Industrial
Waste
Transfer Stn
Waste Transfer Station
74,999
68,035
17,553
-
>5
G & S Tyre
Services Ltd
G & S Tyre
Services Ltd
VP3299VX/
A001
102554 G & S Tyre Services Ltd, Kingsbridge Road, Barking, Essex, IG11
0BD,
S0803 : HCI Waste TS +
treatment
Waste Transfer Station
74,999
1,518
1,518
-
>5
Hanson Quarry Products
Europe Ltd
Dagenham Dock Aggregate Recycling
Facility
BB3005TG/
A001
401033 Dagenham Dock Aggregate Recycling Facility, Land On Breach Lane,
Dagenham, London,
RM9 6QD,
A15 : Material Recycling Treatment
Facility
Material Recycling Facility
249,999
11,459
-
11,459
>5
HKS Dagenham
Limited
HKS Dagenham
Ltd
RP3539QY Waste
Installation
Dagenham Docks, Perry Road,
Dagenham, RM9 6QD,
TM1 : Metal Recycling
installation
Metal Recycling
150,000
39,445
39,434
11
2
Ingrebourne
Valley Ltd
Marks Warren Quarry
Landfill
CP3190VE/
T001
210001 Marks Warren Quarry Landfill, Whalebone Lane North, Romford,
Essex, RM6 6RB,
L05 : Inert LF Inert LF
244,000
126,085
-
-
>5
Jac Skip Hire
Limited Jac Skip Hire FB3109HT/
A001 404048 11 Atcost Road,
Barking, Essex, IG11
0EQ,
S1506 No 6: 75kte HCI
Waste TS +
treatment
Waste Transfer Station
74,999
7,484
-
5,675 2
London Recycling Services
Limited
Media Park FB3900CS/
T001
403475 Media Park, 40 A & B River Road, Barking,
Essex, IG11 0DW,
S1506 No 6: 75kte HCI Waste TS +
treatment
Waste Transfer Station
75,000
9,851
-
7,860
3

Waste Need Assessment
Prepared for: Be First
AECOM 49
M M S Supplies
Limited
M M S
Recycling
FB3805CH/
A001 404533 2 Chequers Lane,
Dagenham, Essex,
RM9 6QJ,
S1506 No 6: 75kte HCI
Waste TS +
treatment
Waste Transfer Station
99,999,999
13,892
-
13,892 2
Manns Waste Management
Ltd
Manns Waste Management
Ltd
HP3098VH/
V002 101645 Old Bus Depot, Perry
Road, Chequers Lane,
Dagenham, Essex,
RM9 6QD,
S0803 : HCI Waste TS +
treatment
Waste Transfer Station
74,999
48,627
8,992
35,500 >5
Mc Grath Brothers ( Waste
Control)
Limited
Mc Grath Bros ( Waste
Control) Ltd
TP3697NP/
V009
80535 54 - 60 River Road, Barking, Essex, IG11
0DS,
A11 : Household, Commercial &
Industrial Waste
Transfer Stn
Waste Transfer Station
480,000
315,544
123,021
191,600
>5
Muckit Recycling
Limited (Purchased by
SRC Group)
Barking Riverside
Development
Park
XP3095VD/
A001
Waste
Carrier
Barking Riverside Recycling Park, River
Road, Barking, Essex,
IG11 0XF,
S0906 : Inert and
excavation WTS with
treatment
Inert Waste Transfer /
Treatment
249,999
53,476
-
53,476 4
Multi Services
Kent Limited
Docklands Wharf
Transfer
Station
KP3797NW/
V004 80525 Docklands Wharf
Transfer Station, 72 -
76 River Road, Barking,
Essex, IG11 0DY,
A9 : Special Waste
Transfer
Station
Waste Transfer Station
414,700
80,000
1,495
74,502 >5
N/A Thames Gateway Waste to
Energy Ltd
(Applicant)
N/A N/A Plot 2, North Choats
Road (Proposed) Thermal
treatment
200,000 N/A N/A N/A N/A
N/A Riverside Energy
Limited
(Applicant)
N/A N/A 75 - 77 Chequers Lane, Dagenham, Barking
And Dagenham
(Proposed) Thermal
treatment
57,600 N/A N/A N/A N/A
Neptune Contract Services
Limited
Thunderer
Road
DB3806UM/
A001
403070 Thunderer Road, Chequers Lane, Dagenham, Essex,
RM9 6QD,
A16 : Physical Treatment
Facility
Physical Treatment
175,000
107,809
2,818
100,890
4
Plasterzone
Ltd
0 EB3403XA/
V003
403490 11 Atcost Road, Barking, London, IG11
0EG,
Site closed Site closed
74,999
20,727
-
-
4

Waste Need Assessment
Prepared for: Be First
AECOM 50
R White Waste
Management
Ltd
75 - 77 Chequers
Lane
DD3307GX/
V002 80583 75-77 Chequers Lane,
Dagenham, Essex,
RM9 6QJ,
A9 : Special Waste
Transfer
Station
Waste Transfer Station
170,256
39,107
3,963
21,380 >5
ReFood UK
Limited
Hitch Street AD Plant
EPR/QP3735
DL
QP3735DL Waste
Installation
ReFood UK, 1 Hitch Street, Dagenham,
Essex, RM9 6FA,
T02 : AD
installation Anaerobic Digestion
160,000
92,642
92,630
- 3
Renewi U K Services
Limited
Frizlands Lane Reuse & Recycling
Centre
GB3003MB/
T001
80105 Frizlands Depot, Rainham Road North, Dagenham, Essex,
RM10 7HX,
A11 : Household, Commercial &
Industrial Waste
Transfer Stn
Waste Transfer Station
80,000
19,400
13,307
1,037
3
S Norton & Co
Ltd
S Norton &
Co Ltd
CB3807HV/
V002 103643 72-76 River Road,
Barking, Essex, IG11
0DS,
S0821 : Metal
recycling site Metal Recycling
200,000
112,038
78,761
33,266 >5
S U C Exc U
K Ltd
S U C Exc Uk
Ltd
GB3438RL/
V002
104126 Unit 2, Choats Road, Dagenham, London,
RM9 6RJ,
SR2010 No12 : Treatment of waste to produce soil
<75,000 tpy
Physical Treatment
74,999
47,878
-
47,878
>5
Suez Recycling & Recovery South East
Ltd
Barking Transfer
Station
AB3507MZ/
V003
80572 New Free Trade Wharf, 40 River Road, Barking,
Essex, IG11 0DW,
A11 : Household, Commercial & Industrial
Waste
Transfer Stn
Waste Transfer Station
182,500
124,673
98,162
397
>5
Suez Recycling And
Recovery U K
Ltd
Barking Materials
Recycling
Facility
JP3596EB/V
002 101756 Docklands Wharf, 72-
76 River Road, Barking,
London, IG11 0DS,
S0814 : Materials
Recycling
Facility
Material Recycling Facility
74,999
6
6
- 1
T. E. Scudder
Limited
Dagenham Stamping & Tooling
Operations
CBDU12052
9
Waste Carrier/brok
er
Chequers Lane, Dagenham, Essex,
RM9 6SA,
A25 : Deposit of waste to land as a
recovery
operation
Deposit of waste to land
(recovery)
230,000
271,523
-
271,523
2
Titan Waste
Solutions Ltd
Titan Waste Solutions
Limited
HB3202MM/
A001
406084 Box Lane, Barking,
London, IG11 0SQ,
S1506 No 6: 75kte HCI Waste TS +
treatment
Waste Transfer Station
75,000
5,971
-
5,795
1

Waste Need Assessment
Prepared for: Be First
AECOM 51
Veolia E S ( U
K ) Limited
Materials Recovery
Facility
CB3106GQ/
V002 80759 Materials Recovery
Facility, Choats Road,
Dagenham Dock, Dagenham, Essex,
RM9 6LF,
S0814 : Materials
Recycling
Facility
Material Recycling Facility
75,000
7,420
7,420
- 4
Wastecare Wastecare -
London
EP3494VG/V004
RP3539QY
101134 Units 4 - 10, Atcost Road, Barking, Essex,
IG11 0EQ,
A11 : Household, Commercial & Industrial
Waste T Stn, Also have temp storage
of haz waste
Waste Transfer Station
25,000
6,785
3,158
34
3

Waste Need Assessment
Prepared for: Be First
AECOM 52
Appendix D Full List of Exempt Waste Management Facilities and their Capacity Name of Site
Operator (Licence
Holder)
Site Name Permit
Number
Waste Management
Licence
Number
Address Postcode Permit / Exemption
Type
Type of facility Licensed Capacity (tpa) Operational capacity
(tpa)
Capacity available for
HIC Apportionmen
t (tpa)
Capacity available for
CDE (tpa)
A M Forktrucks
Ltd
A M Forktrucks
Ltd
Exempt
Site
Not Applicable UNIT 1-4, RIVERSIDE INDUSTRIAL ESTATE, THAMES
ROAD, BARKING,
IG11 0ND
IG11 0ND D7|D6 Permit Exempt Site 5 5
-
-
construction london
limited
cc construction london
limited
Exempt
Site
Not Applicable RIPPLE ROAD,
BARKING, IG11 0SN
IG11 0SN S2|T4|S1|U1|T10|D7|T1
2
Permit Exempt Site 150,000 5,000
-
-
cc construction london
limited
cc construction london
limited
Exempt
Site
Not Applicable RIPPLE ROAD,
BARKING, IG11 0SN
IG11 0SN T10 Permit Exempt Site 520 520
-
-
cc construction london
limited
cc construction london
limited
Exempt
Site
Not Applicable RIPPLE ROAD,
BARKING, IG11 0SN
IG11 0SN T12 Permit Exempt Site 60 60
-
-
Techmedia
(uk) Ltd
Techmedia
(uk) Ltd
Exempt
Site Not Applicable 9 Muirhead Quay,
Freshwharf Estate,
Barking, Essex, IG11
7BW
IG11 7BW T11 Permit Exempt Site 1,000 500
-
-
S Norton &
Co Ltd
S Norton &
Co Ltd
Exempt
Site
Not Applicable 72-76, River Road,
Barking, IG11 0DS
IG11 0DS T11 Permit Exempt Site 1,000 500
-
-
GOODCARE DUSKS
LTD
GOODCARE DUSKS
LTD
Exempt
Site
Not Applicable 279, HEATHWAY, DAGENHAM, RM9
5AQ
RM9 5AQ T12 Permit Exempt Site 60 60
-
-

Waste Need Assessment
Prepared for: Be First
AECOM 53
Edwards Recycling
Ltd
Edwards Recycling
Ltd
Exempt
Site Not Applicable GALLIONS CLOSE,
BARKING, IG11 0JD IG11 0JD T4 Permit Exempt Site 150,000 5,000
-
-
MSK Waste Management &
Recycling
Ltd.
MSK Waste Management &
Recycling
Ltd.
Exempt
Site
Not Applicable 72-76, RIVER ROAD,
BARKING, IG11 0DS
IG11 0DS T4 Permit Exempt Site 150,000 5,000
-
-
CSM Haulage Contractors
Ltd
CSM Haulage Contractors
Ltd
Exempt
Site
Not Applicable CHEQUERS LANE, DAGENHAM, RM9
6PR
RM9 6PR T4 Permit Exempt Site 150,000 5,000
-
-
Veolia ES
(Uk) Ltd
Veolia ES
(Uk) Ltd
Exempt
Site
Not Applicable 16, CHOATS ROAD, DAGENHAM, RM9
6LF
RM9 6LF T4 Permit Exempt Site 150,000 5,000
-
-
Ford Motor Company
Ltd
Ford Motor Company
Ltd
Exempt
Site
Not Applicable DAGENHAM, RM9
6SA
RM9 6SA T4 Permit Exempt Site 150,000 5,000
-
-
Ford Motor Company
Ltd
Ford Motor Company
Ltd
Exempt
Site
Not Applicable DAGENHAM, RM9
6SA
RM9 6SA U11|T23 Permit Exempt Site 400 400
-
-

Waste Need Assessment
Prepared for: Be First
AECOM 54
Appendix E Full methodology Construction, Demolition and Excavation waste
• Information on the quantity of waste considered suitable for recycled aggregates has been extracted
from the most recent London local aggregate assessment (2018) (Ref 61). This has been divided by
32 (32 London Boroughs - with an assumption that each borough produces the same amount of
recycled aggregate) and then a ratio of recycled aggregate (hard inert) to recycled soils has been
applied.
• No data on recycled aggregates was provided for the year 2019, so it has been assumed that the
amount of recycled aggregates in 2019 will be congruent with 2018. As CD&E waste received by
permitted facilities has already been considered when calculating the CD&E waste arisings, a decision
has been made to exclude recycled aggregate from the CD&E waste arisings and instead provide a
separate commentary, in order to avoid double counting.
• It is understood that most CD&E waste will be managed by U1 exemptions (Use of Waste in
Construction), so only U1 exemptions have been considered. A list of exempt sites located within the
plan area has been extracted from the EA Waste Exemptions dataset. As there are no requirements to
report on the amount of waste disposed of under exemptions, 600 tonnes of waste have been
estimated to be managed at each U1 exempt site (Ref 53).
• There is considerable uncertainty when estimating the amount of CD&E waste received by each
exempt site. In addition, the purpose of this assessment is to assess the need for additional planned
waste management capacity; it is unlikely that waste managed by exempt sites will require planned
provision in the future. Therefore, as with recycled aggregate, a decision has been made to exclude
waste received by exempt sites from the CD&E waste arisings and instead provide a separate
commentary.
Waste Management Facility Capacity
• In order to understand if LBBD has sufficient capacity to meet their waste apportionment target, the
current waste management capacity within the borough has been calculated based on data from the
Environment Agency. This has been done for permitted waste management facilities as follows:
• Data on the waste received by permitted waste management facilities was downloaded from the EA’s
WDI for the years 2015 - 2019.
• The data was filtered to only include waste received by facilities in LBBD.
• The GLA advise against using permitted capacity in order to assess the operational capacity of a
facility. This is because the EA permits are often banded thresholds and therefore not necessarily a
true reflection of what the facility is able to process. In order to provide a robust estimate on available
capacity, data on the operational throughput from the last five years (i.e. 2015 to 2019) was used to
calculate an average operational capacity for each facility.
• As some facilities handle both HIC and CD&E waste, the data was further distinguished by
establishing each facility’s proportion of hazardous, HIC and CD&E wastes received (through its basic
high level waste categorisation).
• The percentage of HIC waste handled for facilities was then applied to the total operational waste
capacity of each facility, to ascertain the capacity of the facilities which counts towards the Publication
London Plan apportionment target for LBBD. This is listed under “Capacity available for HIC
Apportionment”.
Waste Transfer Station Capacity
• Waste transfer stations play an important role in waste management. Although the main purpose of
waste transfer stations is the bulking of waste before sending it on for recovery/treatment/disposal,
they can also undertake the sorting of wastes and the production of RDF. As shown in Table 4.1 the

Waste Need Assessment
Prepared for: Be First
AECOM 55
bulking and sorting of waste, as well as production of RDF are attributable to the GLA’s apportionment
targets.
• The recyclable outputs of waste transfer stations, (as well as RDF production) have therefore been
taken into consideration when looking at the amount of capacity available for GLA apportionment. This
has been done via establishing an “apportionment rate” for each WTS.
• Data on “Wastes removed” from LBBD active sites is available from the EA WDI. The waste removed
tonnages can be determined as either non-recyclable or recyclable waste, by examining the Recovery
and Disposal code (R&D code) (Ref 51) of the tonnage. The relevant R&D codes and whether they
have been considered in establishing the apportionment rate are listed in Table 8.1 Description of
Recovery and Disposal (R&D) Codes.
• Firstly, the quantity of recyclable materials is then applied to the total amount of waste removed, to
produce a “recycling rate” for each waste transfer station. As the data on “wastes removed” from the
Environment Agency only included the R&D codes for facilities from 2017 onwards, the recycling rate
for waste transfer facilities has been developed using an average from 2017-19.1
• The recycling rate is then applied to the operational capacity of the waste transfer station.
• The GLA’s criteria for waste activities also includes the production of RDF, as classified by DEFRA
definition:
• Refuse derived fuel (RDF) consists of residual waste that is subject to a contract with an end-user for
use as a fuel in an energy from waste facility. The contract must include the end-user’s technical
specifications relating as a minimum to the calorific value, the moisture content, the form and quantity
of the RDF.
• RDF can be identified in the EA WDI through the EWC code 19 12 10 – combustible waste (refuse
derived fuel). RDF produced has been calculated by looking at the wastes removed and filtering by
the 19 12 10 EWC code to ascertain if any of the waste transfer stations are producing RDF (noting
that whilst MRFs also produce RDF we have already assumed that all of their capacity is
apportionable).
• We then include that proportion of RDF within the sites “recycling rate %” to produce an overall
apportionment rate for the waste transfer sites.
Table 8.1 Description of Recovery and Disposal (R&D) Codes
R&D Code End Process Classified as Recycling (Yes/No)
D01 Landfill No
D05 Landfill No
D08 Mechanical and/or Biological Treatment No
D09 Physio-chemical Treatment No
D10 Incineration No
D13 Transfer
(transfer/treatment of waste to enable its disposal) No
D14 Transfer
(repackaging prior to submission to operations D1 to D13) No
D15 Transfer
(storage of waste pending operations D1 to D14) No
R01 Energy from Waste No
R03 Recycling/Recovery
(of organic substances not used as solvents) Yes
R04 Recycling/Recovery Yes
1 *Whilst the “waste fate” (meaning the fate of the waste .e.g. landfill, incineration, recovery, treatment or transfer) of wastes removed is available for years prior to 2017 in the WDI, the categories of “recovery, treatment, and transfer” are broad and both
recyclable and non-recyclable R&D codes fall under each category. It is therefore recognised that the data from 2017 onwards defined by Recovery and Disposal code, is more detailed than previous years, and by utilising it to ascertain a recycling rate for waste transfer stations, will avoid potential exaggeration/underestimate in recycling rates for facilities by simply using the
“waste fate” of tonnages.

Waste Need Assessment
Prepared for: Be First
AECOM 56
R&D Code End Process Classified as Recycling (Yes/No)
(of metals and metal compounds)
R05 Recycling/Recovery
(of other inorganic materials) Yes
R09 Recovery
(oil re-refining or other reuses of oil) Yes
R10 Land Treatment
(resulting in benefit to agriculture or ecology) Yes
R12 Recovery
(exchange of waste for submission to operations R1 to R12) Yes
R13 Transfer
(storage of waste pending operations R1 to R12) Yes
Source: Waste Framework Directive
Exports and imports
• In order to calculate the amount of waste imported into LBBD, data was taken for the years 2015 to
2019 from the EA WDI ‘waste received’ and filtered to only show receiving waste facilities located in
LBBD. The data for each year was then organised to show the total amount of waste received from
each recorded origin (including Barking and Dagenham).
• To calculate the split between the type of waste imported into waste management facilities in LBBD,
the total amount of waste received has been filtered by the basic waste categories (‘Hazardous’,
‘Household/Industrial/Commercial’ and ‘Inert/C+D’), and waste with a recorded origin of Barking and
Dagenham has been excluded.
• In order to calculate the amount of waste exported from LBBD, data was taken for the years 2015 to
2019 from the EA WDI ‘waste removed’ and filtered to only show waste facilities located in LBBD. The
data for each year was then organised to show the total amount of waste sent to each recorded
destination (including Barking and Dagenham).
• To calculate the split between the type of waste exported from waste management facilities in LBBD,
the total amount of waste removed has been filtered by the basic waste categories (‘Hazardous’,
‘Household/Industrial/Commercial’ and ‘Inert/C+D’), and waste with a recorded destination of Barking
and Dagenham has been excluded.

Waste Need Assessment
Prepared for: Be First
AECOM 57