waste mapping: lean techniques applied in a healthcare setting
TRANSCRIPT

1
Waste MappingLean Techniques Applied in Healthcare
October 3, 2013

2
Speakers• Millie Calistri-Yeh, PhD
– Senior Staff Engineer, Becton Dickinson– Leader, Technical Working Group, Healthcare Plastics
Recycling Council• Timothy Eng, PE, CIE
– Project Manager, Kaiser Permanente

3
What is HPRC?
HPRC is a private, technical coalition of industry peers across healthcare, recycling and waste management industries seeking to improve recyclability of plastic products within healthcare.
HPRC Members
Mission
To inspire and enable the healthcare community to implement sustainable, cost-effective recycling solutions for plastic products and materials used in the delivery of healthcare.
Value Chain Approach
HPRC is unique in its focus on identification of plastics recycling barriers and solution development along the entire value chain.
HPRC is seeking to affect plastics recycling from healthcare product design and manufacturing through product use, disposal and recycle.
© 2013 HPRC

4
37 Hospitals 568 Medical Office Buildings 336 Administrative locations Over 56 million square feet of real estate 9 million members 173,300 technical, administrative, and
clerical employees and caregivers 16,658 physicians representing all
specialties
14 Medical Centers 198 Medical Offices 3.5 million members 70,000 technical and clerical
employees and caregivers 5,700 SCPMG physicians Los Angeles County's largest
private employer
Southern California

5
Outline• Introduction
– Waste Issues & their Costs in Healthcare– Lean Principles
• Kaiser Permanente Story– Understanding Baseline & Metrics Development– Value Stream Mapping as a Tool to Ideate, Propose, Communicate,
and Drive Change
• Waste Exercise• Conclusions• Questions

6
INTRODUCTIONWASTE & LEAN

7
Here’s the Situation…

8
Waste Issues• Healthcare facilities in the United States generate 6,6001 –
14,2002-3 tons of waste per day, most of which is being disposed of in landfills or by incineration.
• It is estimated that between 20 and 25 percent can be attributed to plastic packaging and plastic products.4
• In addition, 85 percent of the hospital waste generated is non-hazardous, meaning free from patient contact and contamination.5
1. 6,600 tons - American Plastics Council, Hospital Plastics Characterization and Recycling Feasibility Study (1999).2. 30.9 pounds waste/bed/day – Practice Greenhealth Benchmark Report (2013).3. 924,333 staffed beds in US hospitals. American Hospital Association Fast Facts (http://www.aha.org/research/rc/stat-studies/fast-facts.shtml 2013). 4. Lee, B., M. Ellenbecker, and R. Moure-Eraso. “Analyses of the Recycling Potential of Medical Plastic Wastes.” Waste Management (2002): 461-4705. Grogan, Terry. “Solid Waste Reduction in US Hospitals.” Hospital Engineering & Facilities Management (2003): 88‐91.
© 2012-2013 HPRC

9
Waste CharacterizationWaste study conducted by the City of Los Angeles:
Services: Medical / Health•Other Organic – 37.8%•Paper – 27.8%*•Plastic – 24.3%•Metal – 9.4%
*Paper recycling through Goodwill

CleanMed 2013_Less Waste using LEAN principles_April 25, 2013 © 2013 Partners Sustainable Initiatives
10
Waste Characterization
Paper, 25.8%
Plastics, 14.0%
Metals, 5.5%
Glass, 2.2%
Organic Materials, 20.6%
Construction and Demolition, 13.9%
Household Hazardous Waste, 3.2%
Electronics, 3.3%
Other Materials, 11.3%
Other Miscellaneous, 1.9%
Commonwealth of Massachusetts

11
Cost of Waste• Average healthcare provider spent ~$98 million on supply
chain functions.1
• Estimated $10 billion/year in disposal costs for US health care industry.2
Average Costs of Waste Streams for PGH Award Winners:3
1 Nachtmann, H; and Pohl, E. State of Healthcare Logistics: Cost and Quality Improvement Opportunities, Center for Innovation in Healthcare Logistics, University of Arkansas (2009).2 American Hospital Association. “Sustainability Roadmap for Hospitals – Waste” (downloaded 3/4/2013).3 Practice Greenhealth Benchmark Report, 2013 (21)
Waste Stream Solid Waste Cost per Ton
Recycled Cost per Ton
RMW Cost per Ton
Hazardous Waste Cost per Pound
Average, 2011 $126 $90 $1015 $3.1
Average, 2012 $105 $113 for hospitals reporting costs
$109 for hospitals reporting savings
$905 $3.2
© 2012-2013 HPRC

CleanMed 2013_Less Waste using LEAN principles_April 25, 2013 © 2013 Partners Sustainable Initiatives
12
Complexity of Waste
OR
ER
Med Surg
IsolationPharmacyLab
Research
Engineering
Administration
Dietary
MSW RMW C&D Recycle Sharps Trace Chemo
Path HIPAA Universal Compost E-waste Rx Haz
WASTE
Partners System (and HHI) Waste Goals Reduce RMW to less than 10% Achieve a 15% recycling rate compared to total waste

13
Lean Essentials
Creating a Lean Culture, David Mann, CRC Press, 2010Lean Healthcare: Get Your Facility in Shape, Sarah Cottington & Shawna Forst, HCPro, 2010
1. Cross Functional: expedite decision
making
2. Focused amount of time – reach
consensus & avoid future rework
3. Co-develop the plan – ideas come
from team
4. Clear metrics & goals – shared by
team
5. Anticipate and recognize problems
6. Interactive process of continuous improvement –
Plan, Do, Check, Adjust
7. Changes are Embraced

14

15
Actual Operations
16

17

18
Integrated Waste Management Hierarchy
http://www.epa.gov/osw/homeland/hierarchy.htm

19
Waste Characterization Studyfor Zero Waste PlanningConducted by E. Tseng and Associates for City of Los Angeles 2009

20
Three-Year Project• Contractor establishes initial “Reference Baseline”
– Develop basic correlative environmental metrics– Conduct on-site “Functional Assessments”– Develop a tracking/monitoring database
• KP/Contractor conducts joint assessment of progress and update metrics (training)
• KP conducts assessment / metrics under supervision of contractor

21
Goals / Objectives of Solid Waste Baseline Study
1. Compliance with the Kaiser Permanente National Waste Minimization (NWM) policy of make a significant effort to reduce the amount of waste that is generated by implementing waste reduction and recycling programs.
2. Promote the overall Kaiser Permanente environmental sustainability strategy which also promotes individual and community health, environmental stewardship, cost savings and legal compliance by reducing the amount of waste generated in Kaiser Permanente buildings and establishing waste minimization as part of it operational thinking.
3. Create a standardized comparative quantitative basis with legally and technically defensible environmental metrics which can be used to be compare against other medical centers, cites, and other organizations/entities.
4. Create an institutionalized Kaiser Permanente infrastructure with trained personnel which can quantitatively monitor, evaluate, track the progress of the implemented waste reduction and recycling programs and the disposal at each medical center with legally and technically defensible environmental metrics.
5. Create an award-winning Kaiser Permanente solid waste reduction and recycling program which will be a UCLA “Best Management Practices” (BMP) reference teaching model at and peer match model for the medical services industry.
22
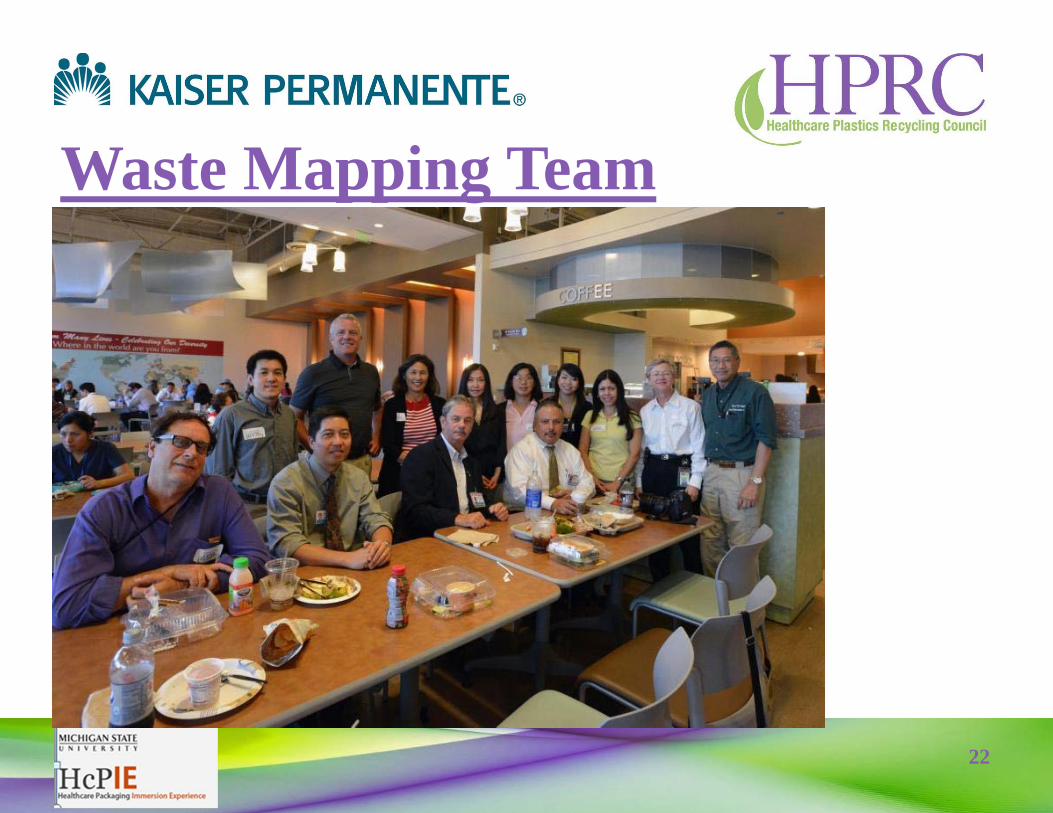
Waste Mapping Team

23
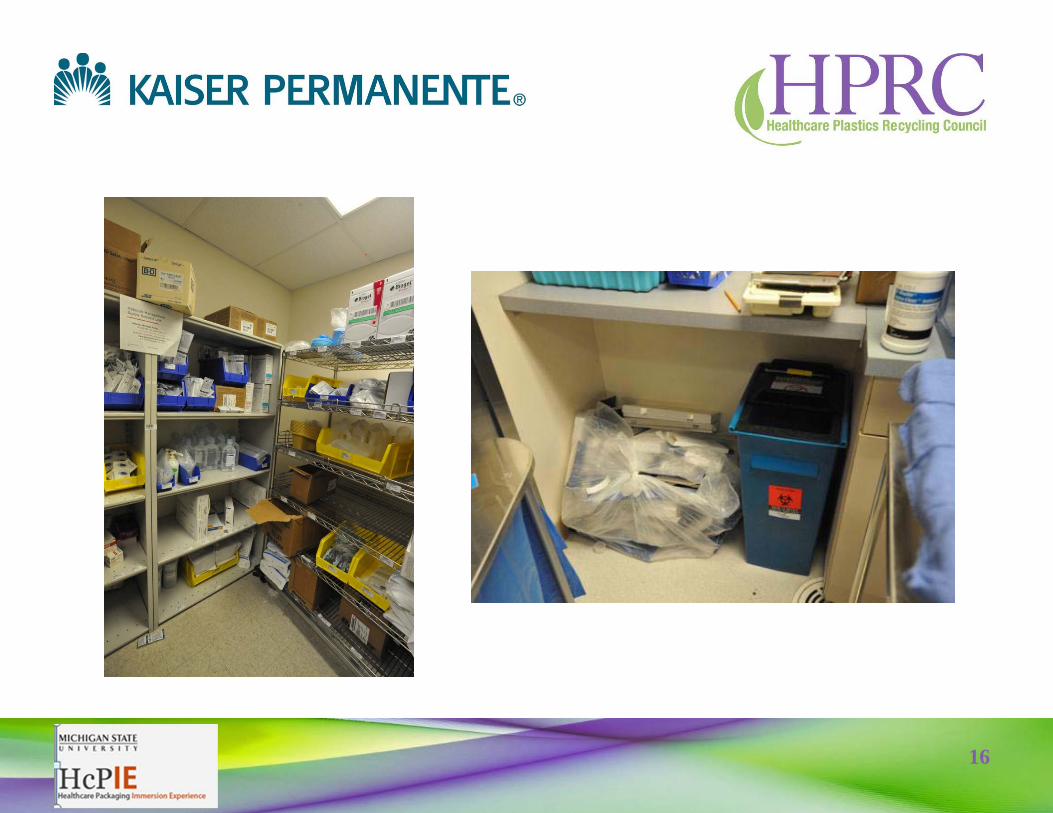
Conduct Detailed On-site “Functional Assessment”

24
Identify Existing Programs

25
Identify Opportunities for Reducing Disposal and Increasing Recycling
Shrink Wrap / Cardboard Recycling
Pallet and Metal Recovery/Recycling

26
Opportunities for Improvement, Communication, and/or Education

27
Learning to See

28
Joining efforts at the Los Angeles Medical Center

29
Loading Dock / Materials Management

30
Emergency Department

31
Oncology

32
Regional Waste Profile 2012
Highlights•Panorama City at Zero Landfill at year-end•Increases in recyclable tonnage
Solid Waste Medical Waste Hazardous Waste
Cost by Category
201020112012
2010 2011 2012
Waste Disposal Costs
14% 12% Increase
Solid Waste (lbs) Recyclables (lbs) Medical Waste(lbs)
Hazardous Waste(lbs)
Waste Totals
201020112012
-6%, 15%
0, 14%-34%,

33
Waste Map / Exercise

34
Conclusions
34
• Waste is a Big Deal!• Effective management of waste streams is Essential
• Hospital• Product & packaging design & reduction
• Space optimized for inventory & waste & disposal• Reduce cost for hospital • Ease of waste stream optimization
• Opportunities for Suppliers to make impact!
35
Questions?

36
Environmental Purchasing Program (EPP)
37
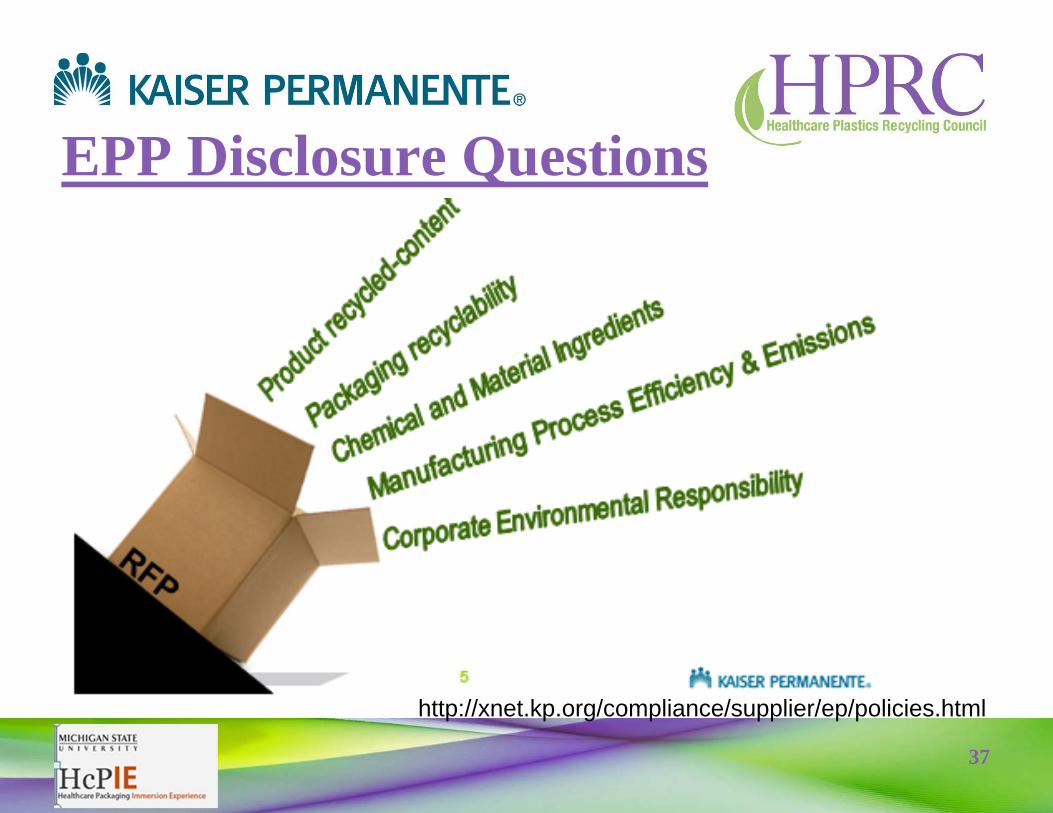
EPP Disclosure Questions
http://xnet.kp.org/compliance/supplier/ep/policies.html

38

39
Additional Questions?
• Contact Information:–Millie Calistri-Yeh,
[email protected]–Tim Eng, [email protected]