waste composition study summary of 2013-2014 results · waste composition study summary of...
TRANSCRIPT

Waste Composi t ion S tudy Summary of 2013-2014 Resul ts
Presented to:
Prince William County, Virginia Solid Waste Division
5 County Complex Court, Suite 250 Prince William, VA 22192
(703) 792-6254
Presented by:
S C S E N G I N E E R S 11260 Roger Bacon Dr, Suite 300
Reston, Virginia 20190 (703) 471-6150
July 11, 2014 File No. 02212052.08
Offices Nationwide www.scsengineers.com

W a s t e C o m p o s i t i o n S t u d y , 2 0 1 3 - 2 0 1 4 R e s u l t s P r i n c e W i l l i a m C o u n t y , V i r g i n i a
i
T a b l e o f C o n t e n t s Section Page 1 Introduction .............................................................................................................................................. 1 2 Methods ................................................................................................................................................... 2
Waste Sampling ..................................................................................................................................... 2 Number of Samples ................................................................................................................................ 2 Waste Sorting ......................................................................................................................................... 3
3 Summary of Results ................................................................................................................................ 6 MSW Composition .................................................................................................................................. 6
Overall ........................................................................................................................................... 6 Residential ..................................................................................................................................... 8 Commercial ................................................................................................................................ 10 Multi-Family ............................................................................................................................... 12
4 Diversion Opportunities ...................................................................................................................... 15 5 Comparison to Previous Studies ........................................................................................................ 17
L i s t o f E x h i b i t s No. Page Exhibit 1. Description of Waste Categories ............................................................................................ 4 Exhibit 2. Overall Waste Composition ..................................................................................................... 7 Exhibit 3. Residential Waste Composition ............................................................................................... 9 Exhibit 4. Commercial Waste Composition ............................................................................................ 11 Exhibit 5. Multi-Family Waste Composition ........................................................................................... 13 Exhibit 6. Compostable, Recyclable, and Trash Classifications for Waste Materials ................... 15 Exhibit 7. Recyclable Diversion Opportunities....................................................................................... 16 Exhibit 8. Compostable Diversion Opportunities .................................................................................. 16 Exhibit 9. Comparison of Overall Waste Compositions 1992 and 2014 ...................................... 17 Exhibit 10. Comparison of Waste Component Proportions 1992 and 2014 ................................... 18 A p p e n d i c e s Appendix A Data Recording Forms Appendix B Health & Safety Plan

W a s t e C o m p o s i t i o n S t u d y , 2 0 1 3 - 2 0 1 4 R e s u l t s P r i n c e W i l l i a m C o u n t y , V i r g i n i a
1
1 INTRODUCT ION
In April 2013, Prince William County of Virginia contracted with SCS Engineers (SCS) conduct a two-season composition analysis of residential and commercial waste generated and collected in Prince William County, Virginia. The primary objectives of the study are to estimate types and quantities of recyclable and compostable waste components in the residential waste stream.
The basis for this waste characterization consists of two week-long sampling events: the first was conducted in the Fall (November 2013) and the second was conducted in the Spring (May 2014). The data will be used by the County to develop long-term waste management strategies and to evaluate the effectiveness of current recycling programs.
The remaining sections of this report are organized as follows:
Section 2 describes field classification and sampling methods.
Section 3 presents project data and results gathered from the study.
Section 4 provides a breakdown of the most prevalent recyclable and compostable materials in the waste stream.
Appendix A contains forms used to record data and Appendix B presents the Health and Safety Plan that was in effect during field activities. This report presents the results of the field efforts for the both seasons.

W a s t e C o m p o s i t i o n S t u d y , 2 0 1 3 - 2 0 1 4 R e s u l t s P r i n c e W i l l i a m C o u n t y , V i r g i n i a
2
2 METHODS
This section summarizes methods used to characterize the waste stream disposed of at the Prince William County Landfill (PWCLF). Fall sampling was conducted from November 4 through November 8, 2013 and Spring sampling was conducted from May 5 to May 9. Waste characterization activities were performed by manually sorting samples from municipal solid waste (MSW) into distinct waste categories.
W A S T E S A M P L I N G
Waste sorting was performed at the Prince William County Landfill during the operating hours of the facility. Each day the drivers of trash collection vehicles were interviewed to determine the load’s contents and suitability for sampling. If the load was selected for sampling, drivers were directed to dump their waste loads into a designated area at the working face. A front-end loader supplied by the County randomly gathered a sample from each target load (approximately 200 pounds) for classification (sorting). Two important procedural factors were considered:
The target vehicle selected for sampling contained MSW that was representative of the type of waste typically generated in that sector (commercial, residential, or multi-family); and
The process of acquiring the waste sample did not, in itself, alter the apparent MSW composition.
Given the limited size of the data set (10 samples sorted per day), it was important that simple random sampling and the potential for unrepresentative data were avoided. Unrepresentative data includes commercial waste or community events that generate atypical or seasonal waste. The driver was directed to discharge the load in a designated area at the working face. The sort sample was subsequently obtained via a front-end loader as follows:
1. The refuse vehicle dumped its load onto the designated area at the working face. This area had sufficient room to allow the front-end loader to grab a sample from the refuse.
2. A front-end loader grabbed a refuse sample from a random section of the dumped load.
3. The front-end loader carried the sample to the area near sort crew and deposited it into 30-gallon trash cans. The trash cans were weighed and set aside until 200 lbs had been selected for characterization.
One sample was visually characterized (the contents were estimated visually rather than manually weighing the categories) because of the bulky items contained. This sample was a commercial load that was nearly 100% carpet and carpet padding.
N U M B E R O F S A M P L E S
50 samples were collected and characterized during each of the two seasonal field activities. A total of 50 commercial samples, 40 residential samples, and 10 multi-family samples were

W a s t e C o m p o s i t i o n S t u d y , 2 0 1 3 - 2 0 1 4 R e s u l t s P r i n c e W i l l i a m C o u n t y , V i r g i n i a
3
collected and characterized (100 samples total). The number of samples for each sector was based on estimates of waste tonnages from each sector.
W A S T E S O R T I N G
The sorting and weighing program for samples entailed the use of one sorting crew and an SCS Crew Supervisor. During each day of fieldwork, waste loads were screened by interviewing the driver. The basic procedures and objectives for sorting (as described below) were identical for each sample, each day. Sorting was performed as follows:
1. The sort crew transferred the refuse sample onto the sorting table until it was full and began sort activities. Large or heavy waste items, such as bags of yard waste, were torn open, examined and then placed directly into the appropriate waste container for subsequent weighing.
2. Plastic bags of refuse were opened and sort crew members manually segregated each item of waste, according to categories defined in Exhibit 1 and placed it in the appropriate waste container. These steps were repeated until the whole sample was sorted.
3. At the completion of sorting, the waste containers were moved to the scale where a representative of SCS weighed each category and recorded the net weight on the Sort Data Sheet (Appendix A). Measurements were made to the nearest 0.05 pounds.
4. After each waste category had been recorded, the trash was disposed of in a roll-off container provided by the County. The recyclables were diverted to a separate recycling trailer, also provided by the County.
This four-step process was repeated until all of the day's samples taken at the site were characterized. Waste samples were maintained in as-disposed conditions (or as close to this as possible). Proper site layout and close supervision of sampling was maintained to avoid the need to repeatedly handle sampled wastes.
Members of the sorting crew were fully equipped with, high visibility vests, puncture resistant gloves, and other safety equipment. The Health and Safety Plan is presented in Appendix B.
Consistent with good practice in such sampling programs, efforts were made to minimize sampling bias or other impacts on the integrity of the database. To this end, field sampling had been coordinated to avoid holidays and other out of ordinary events.
Due to the County’s expressed objective for this study to evaluate recycling programs, waste sorting activities targeted recyclable materials. Exhibit 1 details the material categories for the waste sorting activities.

W a s t e C o m p o s i t i o n S t u d y , 2 0 1 3 - 2 0 1 4 R e s u l t s P r i n c e W i l l i a m C o u n t y , V i r g i n i a
4
E x h i b i t 1 . D e s c r i p t i o n o f W a s t e C a t e g o r i e s
Major Waste Types
Waste Component Categories
Examples
Paper
Recyclable Corrugated Cardboard Packing/shipping boxes
Paperboard Cereal/Soda Boxes
Newspaper/Print Daily, weekly newspapers
White Office Paper High grade white copy paper or letterhead
Glossy/Magazines Magazines periodicals, journals
Phone Books Phone number listings
Other Recyclable Paper Junk mail, notebook paper, colored copy paper
Aseptic/Polycoated Milk/Juice Boxes/Cartons, wax coated boxes
Non-Recyclable Paper Tissues, napkins, any paper not categorized
Plastic
HDPE (#2) Bottles Milk, Detergent
PET (#1) Bottles Soda, Water Bottles
Tubs/Trays/Flower Pots #1, #2, #5 Tubs and Trays
Rigid Plastics Plastic toys, items without a #
Film Garbage bags
Plastic Shopping Bags Grocery bags
Plastic Bottle (#3-#7) #3 through #7 bottles, excluding #6
Polystyrene (#6) Expanded and non expanded polystyrene
Metal
Bi-Metal/Steel Cans Ferrous cans generally used to contain food
Other Ferrous Ferrous metals, not otherwise classified
Aluminum Cans Soda, beer cans
Other Aluminum Aluminum tins and foils
Other Non-Ferrous Non-Ferrous scrap metals
Organic
Vegetative Food Celery, orange/banana peels, plant based food
Other Food Non-plant based food
Pet Waste Kitty litter, dog cleanup bags
Fines Items less than ¼” by ¼”
Wood Lumber, treated and untreated
Pallets Wooden shipping pallets
Other Organics Organic items not otherwise classified
Other
Carpet Carpet rolls and padding
Mattresses Box springs and mattresses
Diapers Adult and child diapers
Textiles Textiles Clothing, rugs, blankets

W a s t e C o m p o s i t i o n S t u d y , 2 0 1 3 - 2 0 1 4 R e s u l t s P r i n c e W i l l i a m C o u n t y , V i r g i n i a
5
Major Waste Types
Waste Component Categories
Examples
Glass Glass Bottles and Jars Containers used for food/beverages, any color
Yard Waste
Grass Grass clippings
Leaves Leaves, pine needles
Brush Small sticks and hedge trimmings
Other Yard Waste Potting soil, dirt, stumps
Electronics Electronics Electronic appliances, e-waste
C&D Debris C&D Debris Concrete, drywall, roofing, etc.
Vinyl siding Vinyl building siding boards
Household Hazardous Waste
Paint Oil based paints
Automotive Fluids Oil, antifreeze, brake fluid
Batteries Lead-acid, lithium, rechargeable batteries
Other HHW HHW not characterized above
Other Miscellaneous Other Materials Non-recyclable materials not otherwise categorized

W a s t e C o m p o s i t i o n S t u d y , 2 0 1 3 - 2 0 1 4 R e s u l t s P r i n c e W i l l i a m C o u n t y , V i r g i n i a
6
3 SUMMARY OF RESULTS
One hundred samples were collected during the sampling events. Data presented include mean percentages by weight, standard deviations, and statistical confidence intervals (95% confidence interval). Derivation of this data is as follows:
Mean n
xXn
ii
1*
1 ;
Standard Deviation (s) =
1
22
nn
n xx; and
Upper/Lower Confidence Interval Limits =
nX
*96.1
where: n = number of samples; and
x = sample percentage. Waste samples are acquired to estimate the County’s true waste composition (i.e., the proportion of each waste component present in the waste collected in the County). The mean is the arithmetic average of all data and the standard deviation is a measure of the dispersion in the data. Together, the mean and standard deviation determine the confidence interval. A 95 percent confidence interval is said to contain the true proportion of a waste component with 95 percent confidence (i.e., similar studies will produce the same results 95 percent of the time).
M S W C O M P O S I T I O N
O v e r a l l
Exhibit 2 presents a side by side comparison of the fifty waste samples obtained and sorted from the multi-family, commercial, and residential sectors during each season. Based on these samples, the three largest components, by weight, of the overall waste stream are Vegetative Food (10.7 percent), Other Organics (7.8 percent), and Non-Recyclable Paper (7.3 percent). Common recyclable materials (mixed paper and commingled materials) through curbside pickup made up approximately 27 percent of the overall waste stream. Compostable materials such as Non-Recyclable Paper, Vegetative Food, Wood, and Yard Waste made up approximately 33 percent of the overall waste stream.

W a s t e C o m p o s i t i o n S t u d y , 2 0 1 3 - 2 0 1 4 R e s u l t s P r i n c e W i l l i a m C o u n t y , V i r g i n i a
7
E x h i b i t 2 . O v e r a l l W a s t e C o m p o s i t i o n
Fall Spring OverallMaterial Components Composition Composition Composition
PAPER1 Recyclable Corrugated Cardboard 5.9% 7.0% 6.5%2 Paperboard 2.1% 2.6% 2.4%3 Newspaper/Print 1.8% 1.6% 1.7%4 White Office Paper 1.1% 1.7% 1.4%5 Glossy/Magazines 1.9% 0.7% 1.3%6 Phone Books <0.1% <0.1% <0.1%7 Other Recyclable Paper 3.6% 2.4% 3.0%8 Aseptic/Polycoated 1.7% 0.4% 1.1%9 Non-Recyclable Paper 5.8% 8.7% 7.3%
Total Paper 24.1% 25.2% 24.7%
PLASTIC10 PET (#1) Bottles 1.9% 1.6% 1.7%11 HDPE (#2) Bottles 0.9% 0.9% 0.9%12 Other (#3-#7) Bottles 0.1% <0.1% <0.1%13 Jars, Jugs, Tubs, Trays 2.0% 1.7% 1.8%14 Plastic Film 6.3% 7.7% 7.0%15 Shopping Bags 1.2% 0.9% 1.0%16 Polystyrene 1.0% 1.4% 1.2%17 Other Rigid Plastic 2.4% 1.8% 2.1%
Total Plastic 15.9% 16.0% 16.0%
FOOD WASTE18 Vegetative Food 8.3% 13.0% 10.7%19 Other Food 4.7% 2.4% 3.5%
Total Food Waste 13.0% 15.4% 14.2%
ORGANICS20 Pet Waste 1.7% 0.6% 1.1%21 Fines 2.7% 2.6% 2.7%22 Wood 2.7% 2.6% 2.7%23 Pallets <0.1% 0.5% 0.2%24 Other Organics 8.3% 7.3% 7.8%25 Textiles 4.4% 5.2% 4.8%
Total Organics 19.9% 18.8% 19.3%
YARD WASTE26 Leaves 8.5% 2.7% 5.6%27 Grass 1.8% 4.7% 3.2%28 Brush 1.3% 1.3% 1.3%29 Other Yard Waste 3.5% 3.3% 3.4%
Total Yard Waste 15.1% 11.9% 13.5%

W a s t e C o m p o s i t i o n S t u d y , 2 0 1 3 - 2 0 1 4 R e s u l t s P r i n c e W i l l i a m C o u n t y , V i r g i n i a
8
Fall Spring OverallMaterial Components Composition Composition Composition
GLASS30 Glass Bottles and Jars 2.0% 2.3% 2.1%
METAL31 Ferrous Cans 0.9% 0.6% 0.7%32 Other Ferrous 1.0% 1.3% 1.1%33 Aluminum Cans 0.5% 0.7% 0.6%34 Aluminum Tins/Foil 0.4% 0.4% 0.4%35 Other Non-Ferrous <0.1% <0.1% <0.1%
Total Metal 2.8% 3.0% 2.9%
OTHER36 Carpet 1.8% 0.5% 1.2%37 Mattresses 0.3% <0.1% 0.2%38 Diapers 2.0% 2.7% 2.3%39 Other Materials 0.3% 0.7% 0.5%
Total Other Waste 4.4% 4.0% 4.2%
ELECTRONICS40 Electronics 1.2% 0.8% 1.0%
C&D41 C&D Debris 1.5% 2.5% 2.0%42 Vinyl Siding <0.1% <0.1% <0.1%
Total C&D 1.5% 2.5% 2.0%
HOUSEHOLD HAZARDOUS WASTES43 Paint 0.1% <0.1% <0.1%44 Automotive Fluids <0.1% 0.2% <0.1%45 Batteries <0.1% <0.1% <0.1%46 Other HHW <0.1% <0.1% <0.1%
Total HHW 0.1% 0.2% 0.2%
100.0% 100.0% 100.0%
Note: Composition based on 50 samples per season
TOTALS
R e s i d e n t i a l
Exhibit 3 presents a side by side comparison of the forty waste samples obtained and sorted from the residential sector during each season. Based on these samples, the three largest components, by weight, of the overall residential waste stream are Leaves (11.7 percent), Vegetative Food (8.6 percent), and Other Organics (8.0 percent). Common recyclable materials (mixed paper and commingled materials) through curbside pickup made up approximately 23 percent of the waste stream. Compostable materials such as Non-Recyclable Paper, Vegetative Food, Wood, and Yard Waste made up approximately 41 percent of the waste stream.

W a s t e C o m p o s i t i o n S t u d y , 2 0 1 3 - 2 0 1 4 R e s u l t s P r i n c e W i l l i a m C o u n t y , V i r g i n i a
9
E x h i b i t 3 . R e s i d e n t i a l W a s t e C o m p o s i t i o n
Fall Spring OverallMaterial Components Composition Composition Composition
PAPER1 Recyclable Corrugated Cardboard 2.1% 3.2% 2.7%2 Paperboard 2.1% 2.8% 2.4%3 Newspaper/Print 2.1% 2.1% 2.1%4 White Office Paper 1.0% 0.9% 1.0%5 Glossy/Magazines 3.1% 1.0% 2.1%6 Phone Books <0.1% <0.1% <0.1%7 Other Recyclable Paper 3.7% 2.0% 2.8%8 Aseptic/Polycoated 1.4% 0.3% 0.8%9 Non-Recyclable Paper 6.3% 7.4% 6.9%
Total Paper 21.8% 19.8% 20.8%
PLASTIC10 PET (#1) Bottles 1.8% 1.2% 1.5%11 HDPE (#2) Bottles 1.0% 0.8% 0.9%12 Other (#3-#7) Bottles 0.2% <0.1% 0.1%13 Jars, Jugs, Tubs, Trays 1.8% 2.0% 1.9%14 Plastic Film 5.2% 5.8% 5.5%15 Shopping Bags 1.3% 1.4% 1.4%16 Polystyrene 0.9% 1.1% 1.0%17 Other Rigid Plastic 1.8% 1.8% 1.8%
Total Plastic 14.0% 14.2% 14.1%
FOOD WASTE18 Vegetative Food 7.8% 9.3% 8.6%19 Other Food 3.1% 1.2% 2.2%
Total Food Waste 10.9% 10.6% 10.7%
ORGANICS20 Pet Waste 1.8% 0.8% 1.3%21 Fines 2.6% 3.1% 2.8%22 Wood 2.6% 2.5% 2.6%23 Pallets <0.1% <0.1% <0.1%24 Other Organics 7.9% 8.0% 8.0%25 Textiles 4.0% 4.0% 4.0%
Total Organics 19.0% 18.3% 18.6%
YARD WASTE26 Leaves 20.0% 3.5% 11.7%27 Grass 3.7% 11.6% 7.7%28 Brush 1.4% 2.5% 1.9%29 Other Yard Waste 1.1% 5.6% 3.3%
Total Yard Waste 26.1% 23.2% 24.7%

W a s t e C o m p o s i t i o n S t u d y , 2 0 1 3 - 2 0 1 4 R e s u l t s P r i n c e W i l l i a m C o u n t y , V i r g i n i a
1 0
Fall Spring OverallMaterial Components Composition Composition Composition
GLASS30 Glass Bottles and Jars 1.7% 1.9% 1.8%
METAL31 Ferrous Cans 1.1% 0.5% 0.8%32 Other Ferrous 0.5% 1.3% 0.9%33 Aluminum Cans 0.5% 0.5% 0.5%34 Aluminum Tins/Foil 0.5% 0.6% 0.5%35 Other Non-Ferrous <0.1% <0.1% <0.1%
Total Metal 2.7% 2.8% 2.7%
OTHER36 Carpet <0.1% 1.0% 0.5%37 Mattresses <0.1% <0.1% <0.1%38 Diapers 2.1% 3.9% 3.0%39 Other Materials 0.4% 0.4% 0.4%
Total Other Waste 2.6% 5.3% 3.9%
ELECTRONICS40 Electronics 0.6% 0.7% 0.7%
C&D41 C&D Debris 0.7% 3.1% 1.9%42 Vinyl Siding <0.1% <0.1% <0.1%
Total C&D 0.7% 3.1% 1.9%
HOUSEHOLD HAZARDOUS WASTES43 Paint <0.1% <0.1% <0.1%44 Automotive Fluids <0.1% 0.2% <0.1%45 Batteries <0.1% <0.1% <0.1%46 Other HHW <0.1% <0.1% <0.1%
Total HHW <0.1% 0.2% <0.1%
100.0% 100.0% 100.0%
Note: Composition based on 20 samples per season
TOTALS
C o m m e r c i a l
Exhibit 4 presents a compilation of the twenty five waste samples obtained and sorted from the commercial sector each season. Based on these samples, the three largest components, by weight, of the residential waste stream are Vegetative Food (12.5 percent), Recyclable Corrugated Cardboard (9.4 percent), and Plastic Films (8.2 percent). Common recyclable materials (mixed paper and commingled materials) through curbside pickup made up approximately 29 percent of the waste stream. Compostable materials such as Non-Recyclable Paper, Vegetative Food, Wood, and Yard Waste made up approximately 28 percent of the waste stream.

W a s t e C o m p o s i t i o n S t u d y , 2 0 1 3 - 2 0 1 4 R e s u l t s P r i n c e W i l l i a m C o u n t y , V i r g i n i a
1 1
E x h i b i t 4 . C o m m e r c i a l W a s t e C o m p o s i t i o n
Fall Spring OverallMaterial Components Composition Composition Composition
PAPER1 Recyclable Corrugated Cardboard 8.6% 10.3% 9.4%2 Paperboard 1.9% 2.3% 2.1%3 Newspaper/Print 1.6% 1.2% 1.4%4 White Office Paper 1.1% 2.3% 1.7%5 Glossy/Magazines 0.9% 0.6% 0.7%6 Phone Books 0.1% <0.1% <0.1%7 Other Recyclable Paper 3.5% 2.5% 3.0%8 Aseptic/Polycoated 2.2% 0.6% 1.4%9 Non-Recyclable Paper 5.5% 9.5% 7.5%
Total Paper 25.3% 29.2% 27.2%
PLASTIC10 PET (#1) Bottles 2.0% 1.6% 1.8%11 HDPE (#2) Bottles 0.8% 0.9% 0.8%12 Other (#3-#7) Bottles <0.1% <0.1% <0.1%13 Jars, Jugs, Tubs, Trays 2.2% 1.4% 1.8%14 Plastic Film 7.2% 9.3% 8.2%15 Shopping Bags 1.1% 0.4% 0.8%16 Polystyrene 1.2% 1.6% 1.4%17 Other Rigid Plastic 3.0% 1.7% 2.3%
Total Plastic 17.5% 16.9% 17.2%
FOOD WASTE18 Vegetative Food 8.7% 16.3% 12.5%19 Other Food 6.2% 3.6% 4.9%
Total Food Waste 14.9% 19.9% 17.4%
ORGANICS20 Pet Waste 1.6% 0.2% 0.9%21 Fines 2.8% 2.3% 2.5%22 Wood 2.7% 2.6% 2.6%23 Pallets <0.1% 0.9% 0.5%24 Other Organics 8.1% 6.7% 7.4%25 Textiles 4.1% 6.2% 5.2%
Total Organics 19.3% 18.8% 19.1%
YARD WASTE26 Leaves 0.9% 2.5% 1.7%27 Grass 0.2% <0.1% 0.1%28 Brush 1.4% 0.6% 1.0%29 Other Yard Waste 6.0% 1.8% 3.9%
Total Yard Waste 8.6% 5.0% 6.8%

W a s t e C o m p o s i t i o n S t u d y , 2 0 1 3 - 2 0 1 4 R e s u l t s P r i n c e W i l l i a m C o u n t y , V i r g i n i a
1 2
Fall Spring OverallMaterial Components Composition Composition Composition
GLASS30 Glass Bottles and Jars 1.7% 2.5% 2.1%
METAL31 Ferrous Cans 0.7% 0.6% 0.6%32 Other Ferrous 1.4% 1.4% 1.4%33 Aluminum Cans 0.4% 1.0% 0.7%34 Aluminum Tins/Foil 0.3% 0.3% 0.3%35 Other Non-Ferrous <0.1% <0.1% <0.1%
Total Metal 2.8% 3.2% 3.0%
OTHER36 Carpet 3.6% 0.2% 1.9%37 Mattresses 0.7% <0.1% 0.3%38 Diapers 1.2% 0.7% 1.0%39 Other Materials <0.1% 0.6% 0.3%
Total Other Waste 5.4% 1.6% 3.5%
ELECTRONICS40 Electronics 1.8% 0.8% 1.3%
C&D41 C&D Debris 2.3% 2.0% 2.2%42 Vinyl Siding <0.1% <0.1% <0.1%
Total C&D 2.3% 2.0% 2.2%
HOUSEHOLD HAZARDOUS WASTES43 Paint 0.3% <0.1% 0.1%44 Automotive Fluids <0.1% <0.1% <0.1%45 Batteries <0.1% <0.1% <0.1%46 Other HHW <0.1% <0.1% <0.1%
Total HHW 0.3% 0.1% 0.2%
100.0% 100.0% 100.0%
Note: Composition based on 25 samples per season
TOTALS
M u l t i - F a m i l y
Exhibit 5 presents a compilation of the five samples obtained and sorted from the multi-family sector each season. Based on these samples, the three largest components, by weight, of the residential waste stream are Vegetative Food (9.8 percent), Other Organics (9.0 percent), and Non-Recyclable Paper (7.6 percent). Common recyclable materials (mixed paper and commingled materials) through curbside pickup made up approximately 32 percent of the waste stream. Compostable materials such as Non-Recyclable Paper, Vegetative Food, Wood, and Yard Waste made up approximately 23 percent of the waste stream.

W a s t e C o m p o s i t i o n S t u d y , 2 0 1 3 - 2 0 1 4 R e s u l t s P r i n c e W i l l i a m C o u n t y , V i r g i n i a
1 3
E x h i b i t 5 . M u l t i - F a m i l y W a s t e C o m p o s i t i o n
Fall Spring OverallMaterial Components Composition Composition Composition
PAPER1 Recyclable Corrugated Cardboard 7.9% 5.7% 6.8%2 Paperboard 3.3% 3.3% 3.3%3 Newspaper/Print 2.0% 1.3% 1.7%4 White Office Paper 1.5% 2.1% 1.8%5 Glossy/Magazines 2.1% 0.4% 1.2%6 Phone Books <0.1% 0.6% 0.3%7 Other Recyclable Paper 4.3% 3.5% 3.9%8 Aseptic/Polycoated 1.1% <0.1% 0.6%9 Non-Recyclable Paper 5.5% 9.6% 7.6%
Total Paper 27.7% 26.6% 27.1%
PLASTIC10 PET (#1) Bottles 2.0% 3.0% 2.5%11 HDPE (#2) Bottles 1.3% 1.3% 1.3%12 Other (#3-#7) Bottles 0.2% <0.1% <0.1%13 Jars, Jugs, Tubs, Trays 1.7% 2.0% 1.9%14 Plastic Film 6.4% 7.4% 6.9%15 Shopping Bags 1.4% 0.8% 1.1%16 Polystyrene 0.8% 1.7% 1.3%17 Other Rigid Plastic 2.1% 2.4% 2.2%
Total Plastic 16.0% 18.5% 17.3%
FOOD WASTE18 Vegetative Food 8.2% 11.4% 9.8%19 Other Food 4.1% 0.9% 2.5%
Total Food Waste 12.3% 12.2% 12.3%
ORGANICS20 Pet Waste 1.6% 2.0% 1.8%21 Fines 3.0% 2.5% 2.8%22 Wood 3.3% 3.1% 3.2%23 Pallets <0.1% <0.1% <0.1%24 Other Organics 10.2% 7.8% 9.0%25 Textiles 7.9% 5.0% 6.5%
Total Organics 26.0% 20.3% 23.2%
YARD WASTE26 Leaves 0.6% <0.1% 0.3%27 Grass 2.3% <0.1% 1.2%28 Brush 0.2% <0.1% 0.1%29 Other Yard Waste <0.1% 1.2% 0.6%
Total Yard Waste 3.1% 1.2% 2.1%

W a s t e C o m p o s i t i o n S t u d y , 2 0 1 3 - 2 0 1 4 R e s u l t s P r i n c e W i l l i a m C o u n t y , V i r g i n i a
1 4
Fall Spring OverallMaterial Components Composition Composition Composition
GLASS30 Glass Bottles and Jars 5.1% 2.6% 3.8%
METAL31 Ferrous Cans 1.0% 0.8% 0.9%32 Other Ferrous 0.5% 1.2% 0.9%33 Aluminum Cans 1.0% 0.6% 0.8%34 Aluminum Tins/Foil 0.6% 0.4% 0.5%35 Other Non-Ferrous 0.2% <0.1% 0.1%
Total Metal 3.3% 3.1% 3.2%
OTHER36 Carpet <0.1% <0.1% <0.1%37 Mattresses <0.1% <0.1% <0.1%38 Diapers 5.1% 7.8% 6.4%39 Other Materials 1.2% 3.0% 2.1%
Total Other Waste 6.3% 10.8% 8.6%
ELECTRONICS40 Electronics 0.3% 0.7% 0.5%
C&D41 C&D Debris <0.1% 3.0% 1.5%42 Vinyl Siding <0.1% <0.1% <0.1%
Total C&D <0.1% 3.0% 1.5%
HOUSEHOLD HAZARDOUS WASTES43 Paint <0.1% <0.1% <0.1%44 Automotive Fluids <0.1% 0.8% 0.4%45 Batteries <0.1% <0.1% <0.1%46 Other HHW <0.1% <0.1% <0.1%
Total HHW <0.1% 0.8% 0.4%
100.0% 100.0% 100.0%
Note: Composition based on 5 samples per season
TOTALS

W a s t e C o m p o s i t i o n S t u d y , 2 0 1 3 - 2 0 1 4 R e s u l t s P r i n c e W i l l i a m C o u n t y , V i r g i n i a
1 5
4 D IVERS ION OPPORTUNIT I ES
A significant portion of the waste stream is compostable or recyclable. Some materials, such as Polystyrene, are considered trash because these materials do not currently have markets for recycling or composting. Plastic Films are considered trash because a large portion of them are garbage bags used to contain refuse. Brush is considered recyclable because it is used to make mulch. Exhibit 6 details the materials included in the compostable, recyclable, and trash classifications used for this section.
E x h i b i t 6 . C o m p o s t a b l e , R e c y c l a b l e , a n d T r a s h C l a s s i f i c a t i o n s f o r W a s t e M a t e r i a l s
Compostable Recyclable Trash
Non-Recyclable Paper Vegetative Food Leaves Grass Other Yard Waste Wood
Recyclable Corrugated Cardboard Paperboard Newspaper/Print White Office Paper Glossy/Magazines Phone Books Other Recyclable Paper Aseptic/Polycoated Electronics Glass Bottles and Jars Brush Pallets Other Rigid Plastic
PET (#1) Bottles HDPE (#2) Bottles Other (#3-#7) Bottles Jars, Jugs, Tubs, Trays Plastic Shopping Bags Ferrous Cans Other Ferrous Aluminum Cans Aluminum Tins/Foil Other Non-Ferrous Textiles Automotive Fluids Batteries
Plastic Film Polystyrene Other Food Pet Waste Fines Other Organics Carpet Mattresses Diapers Other Materials C&D Debris Vinyl Siding Paint Other HHW
The largest diversion opportunities for Prince William County are diverting Yard Waste and capturing more recyclable paper. Yard Waste is most prevalent in the residential waste stream, while recyclable materials are more prevalent in the commercial waste stream. According to the data collected during both seasonal field efforts, the four material categories of Yard Waste made up approximately 15 percent of the overall waste stream. Recyclable paper categories made up 17 percent of the overall waste stream. It should be noted that if all of the Yard Waste was diverted from the county landfill, recyclable paper would make up an even greater proportion of the remaining waste stream. The largest subcomponents of recyclable paper were Recyclable Cardboard (6.5 percent) and Other Recyclable Paper (3.0 percent). Other Recyclable Paper is generally comprised of junk mail. Exhibit 7 and Exhibit 8 portray the waste composition by recyclable (with existing recycling markets and infrastructure), compostable and trash materials. According to the waste characterization, approximately 70 percent of the waste stream is considered recyclable or compostable. The following exhibits are based on the overall composition from the fifty samples collected during each of the seasonal field efforts (100 samples for the year).

W a s t e C o m p o s i t i o n S t u d y , 2 0 1 3 - 2 0 1 4 R e s u l t s P r i n c e W i l l i a m C o u n t y , V i r g i n i a
1 6
E x h i b i t 7 . R e c y c l a b l e D i v e r s i o n O p p o r t u n i t i e s
Compostable, 32.8%
Trash, 29.7%Paper, 17.4%
Glass, 2.1%
Plastic, 7.7%
Metal, 2.9%
Electronics, 1.0%
Other Recyclables, 6.4%
Recyclable Materials, 37.6%
Notes: Other Recyclables includes Textiles, Brush, Pallets, Automotive Fluids, and Batteries Categories may not sum to 100.0% due to rounding.
E x h i b i t 8 . C o m p o s t a b l e D i v e r s i o n O p p o r t u n i t i e s
Trash , 29.7%
Recyclable, 37.6%
Compostable Paper, 7.3%
Compostable Food, 10.7%
Yard Waste & Wood, 14.9%
Compostable Materials, 32.8%
Notes: Compostable Paper is comprised of Non-Recyclable Paper Compostable Food is comprised of Vegetative Food
Yard Waste & Wood is comprised of Leaves, Grass, Other Yard Waste, and Wood (a small percentage of Wood is treated wood which is not considered compostable) Categories may not sum to 100.0% due to rounding.
W a s t e C o m p o s i t i o n S t u d y , 2 0 1 3 - 2 0 1 4 R e s u l t s P r i n c e W i l l i a m C o u n t y , V i r g i n i a
1 7
5 COMPAR ISON TO PREV IOUS STUD IES
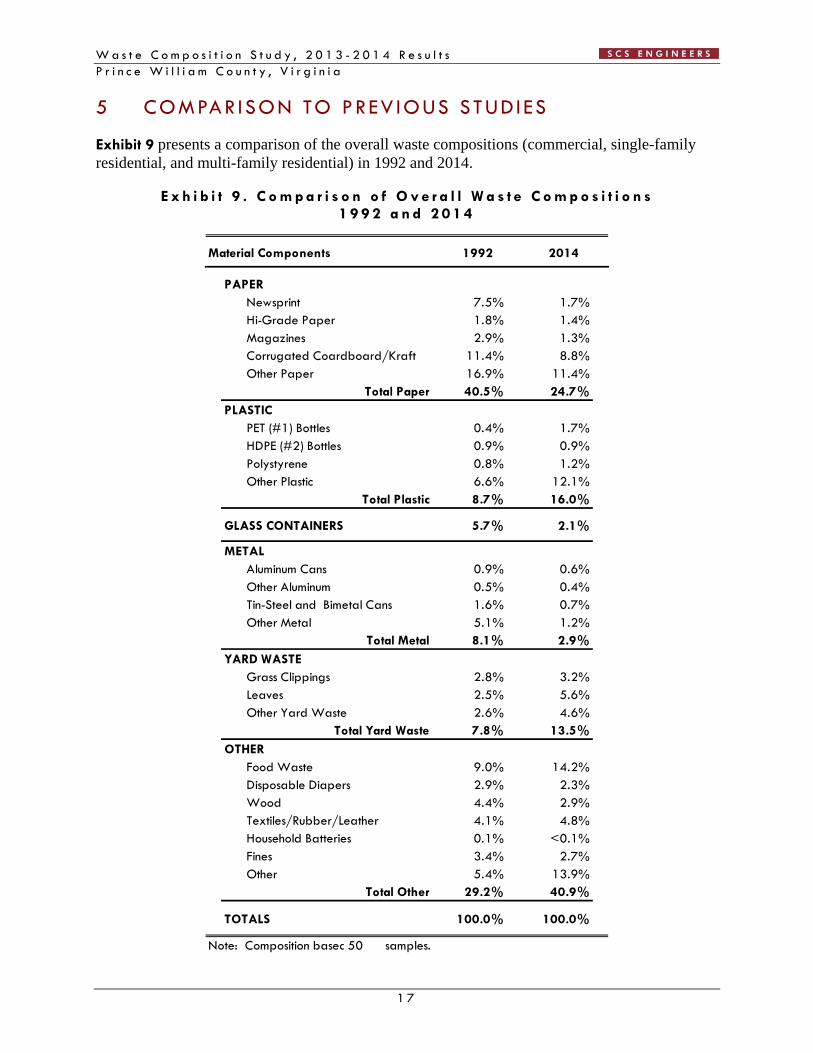
Exhibit 9 presents a comparison of the overall waste compositions (commercial, single-family residential, and multi-family residential) in 1992 and 2014.
E x h i b i t 9 . C o m p a r i s o n o f O v e r a l l W a s t e C o m p o s i t i o n s 1 9 9 2 a n d 2 0 1 4
Material Components 1992 2014
PAPERNewsprint 7.5% 1.7%Hi-Grade Paper 1.8% 1.4%Magazines 2.9% 1.3%Corrugated Coardboard/Kraft 11.4% 8.8%Other Paper 16.9% 11.4%
Total Paper 40.5% 24.7%
PLASTICPET (#1) Bottles 0.4% 1.7%HDPE (#2) Bottles 0.9% 0.9%Polystyrene 0.8% 1.2%Other Plastic 6.6% 12.1%
Total Plastic 8.7% 16.0%
GLASS CONTAINERS 5.7% 2.1%
METALAluminum Cans 0.9% 0.6%Other Aluminum 0.5% 0.4%Tin-Steel and Bimetal Cans 1.6% 0.7%Other Metal 5.1% 1.2%
Total Metal 8.1% 2.9%
YARD WASTEGrass Clippings 2.8% 3.2%Leaves 2.5% 5.6%Other Yard Waste 2.6% 4.6%
Total Yard Waste 7.8% 13.5%
OTHERFood Waste 9.0% 14.2%Disposable Diapers 2.9% 2.3%Wood 4.4% 2.9%Textiles/Rubber/Leather 4.1% 4.8%Household Batteries 0.1% <0.1%Fines 3.4% 2.7%Other 5.4% 13.9%
Total Other 29.2% 40.9%
100.0% 100.0%
Note: Composition based50 samples.
TOTALS

W a s t e C o m p o s i t i o n S t u d y , 2 0 1 3 - 2 0 1 4 R e s u l t s P r i n c e W i l l i a m C o u n t y , V i r g i n i a
1 8
Even though the waste categories were not entirely the same in 2014 as they were in 1992, useful comparisons can still be made. Exhibit 10 presents a comparison of individual waste categories.
E x h i b i t 1 0 . C o m p a r i s o n o f W a s t e C o m p o n e n t P r o p o r t i o n s 1 9 9 2 a n d 2 0 1 4
0%2%4%6%8%10%12%14%16%18%
Newsprint
Hi‐Grade Paper
Magazines
Corrugated…
Other Paper
PET (#1) Bottles
HDPE (#2) Bottles
Polystyren
e
Other Plastic
Glass Containers
Aluminum Cans
Other Aluminum
Bim
etal Cans
Other Metal
Grass Clippings
Leaves
Other Yard W
aste
Food W
aste
Disposable Diapers
Wood
Textiles
Household Batteries
1992 2014
The largest components by weight of the waste stream in 1992 were Other Paper (17 percent), Corrugated Cardboard (11 percent), and Food Waste (9 percent). The largest components of the waste stream in 2013 are Food Waste (14 percent), Other Plastic (12 percent), and Other Paper (11 percent).
Recycling programs have decreased the proportion of recyclable materials in the waste stream since 1992. There has been a significant reduction in the proportion of metals in the waste stream since 1992, from 8.1 percent in 1992 to 2.9 percent in 2014. Similarly, the proportion of glass containers has decreased from 5.7 percent in 1992 to 2.1 percent in 2014. Paper has decreased from 40.5 percent of the waste stream in 1992 to just under 25 percent in 2014.
The proportion of plastics in the waste stream has almost doubled since 1992, from 8.7 percent to 16.0 percent in 2014. There has been a significant increase in the use of plastic packaging since 1992 so there is much more plastic in the waste stream. Because plastic is a lightweight material, small increases of plastic in the waste composition represent significant volumes of plastic materials.

W a s t e C o m p o s i t i o n S t u d y , 2 0 1 3 - 2 0 1 4 R e s u l t s P r i n c e W i l l i a m C o u n t y , V i r g i n i a
Appendix A
Data Recording Forms

W a s t e C o m p o s i t i o n S t u d y , 2 0 1 3 - 2 0 1 4 R e s u l t s P r i n c e W i l l i a m C o u n t y , V i r g i n i a
PRINCE WILLIAM COUNTY WASTE CHARACTERIZATION STUDY - NOVEMBER 2013
Date: M T W TH F Time: Quadrant:
Sample #: Vehicle #: Hauler: Sector: Residential / Commerical
Gross Tare
Recyclable Corrugated Cardboard
Packing/shipping boxes
Paperboard Cereal/Soda Boxes
Newspaper/PrintDaily, weekly newspapers
White Office PaperHigh grade white copy paper or letterhead
Glossy/MagazinesMagazines periodicals, journals
Phone Books Phone number listings
Other Recyclable PaperJunk mail, notebook paper, colored copy
Aseptic/PolycoatedMilk/Juice Boxes/Cartons, wax coated boxes
Non-Recyclable PaperTissues, napkins, any paper not categorized
PET (#1) Bottles Water, Soda
HDPE (#2) Bottles Milk, Detergent
Other (#3-#7) Bottles Prescriptions
Jars, Jugs, Tubs, Trays Yogurt, Butter, flower pots
Plastic Film garbage bags
Shopping Bags grocery store bags
PolystyreneExpanded or regular clamshells, cutlery, cups
Other Rigid PlasticBuckets, storage totes, furniture, toys
Vegetative Food fruits, vegetables
Other Food meats, dairy
Pet Waste kitty litter
Fines Items less than 1/4 inch
Wood Lumber
Pallets shipping pallets
Other OrganicsOrganics not otherwise classified
Textiles Textiles clothing, rugs, blankets
Leaves Foliage
Grass Lawn clippings
Brush Branches
Other Yard Waste potting soil, dirt, stumps
WEIGHT (In Pounds)Waste Component Categories
Plastic
Paper
ExamplesMajor Waste
Fractions
Yard Waste
Organics

W a s t e C o m p o s i t i o n S t u d y , 2 0 1 3 - 2 0 1 4 R e s u l t s P r i n c e W i l l i a m C o u n t y , V i r g i n i a
Glass Glass Bottles/Jars Beer, wine
Ferrous Cans used to contain food
Other Ferrous ferrous metals
Aluminum Cans soda, beer cans
Aluminum Tins/Foil tins and foils
Other Non-Ferrous non-ferrous scrap metals
Carpet carpet rolls and padding
Mattressesbox springs and mattresses
Diapers adult and child diapers
Electronics Electronics Cell phones, radios
C&D Debris concrete, dry wall, roofing
Vinyl Siding vinyl siding
Paint latex paints
Automotive Fluids Lubricants, oil
Batteries rechargeable bwatteries
Other HHW poisons, pesticides
Other Other Materialsmaterials not otherwise classified
Comments:
Household Hazardous Waste
Metal
Other
C&D Debris

W a s t e C o m p o s i t i o n S t u d y , 2 0 1 3 - 2 0 1 4 R e s u l t s P r i n c e W i l l i a m C o u n t y , V i r g i n i a
Appendix B
Health & Safety Plan

S i t e - S p e c i f i c H e a l t h a n d S a f e t y P l a n
S i te -Spec i f i c Hea l th and Safe ty P lan
Pr i nce Wi l l iam Coun ty Waste Charac ter i za t ion
Rev . 1 – November 1 , 2013
R E Q U I R E D A P P R O V A L
SCS OSHC or designee:
Eric Andersen Date: 11/1/13
SCS PM: Josh DeGayner Date: 11/1/13
Project No.: 02212052.08
Project Name: Prince William County Waste Composition Study
Site Address: 14811 Dumfries Rd, Manassas, VA 20112
Client Contact: Scott Macdonald
E M E R G E N C Y T E L E P H O N E N U M B E R S
Fire: 911 or 703-792-6810 (non emergency)
Police: 911 or 703-792-6500 (non-emergency)
Hospital 703-369-8000 (Prince William Hospital)
Ambulance: 911
WorkCare 1-800-455-6155
The directions and information on the nearest hospital are found on Page 3.
Offices Nationwide www.scsengineers.com

S i t e - S p e c i f i c H e a l t h a n d S a f e t y P l a n
i
A C K N O W L E D G E M E N T P A G E
“I have read the attached Health and Safety Plan for the Prince William County Waste Composition dated 11/1/13. I have discussed any questions and/or concerns that I have regarding the contents of this document with the designated SCS project safety representative, and I understand its requirements. I understand that failure to comply with safety regulations, the Health and Safety Plan, failure to use safety equipment, or wandering outside of the area designated by the Project Manager shall be grounds for immediate dismissal.”
Name Signature Company Date

i i
T a b l e o f C o n t e n t s Section Page Acknowledgement Page ................................................................................................................................... i 1 Introduction .............................................................................................................................................. 1
Project Organization .............................................................................................................................. 1 Scope of Work – Waste Characterization........................................................................................ 1
2 Emergency Response and Medical Treatment Procedures ............................................................ 3 Accident or Incident Reporting System ............................................................................................... 4 Notification Procedures for Incidents (Client, Local, State, or Federal) ........................................ 4 Methods to Summon Emergency Response Team .............................................................................. 4 Rescue and Medical Treatment Requirements ................................................................................... 4
3 Site Description....................................................................................................................................... 4 Location Description ................................................................................................................................ 4
4 General Field Safety Procedures ....................................................................................................... 4 Applicable Standard Operating Procedures (SOPs) and Programs ............................................ 6 Job Task Safety Analysis (JTSA) and PPE Assessment ..................................................................... 7 Safe Observations .................................................................................................................................. 7 Other Inspection Procedures ................................................................................................................. 7 Site Control .............................................................................................................................................. 8 Decontamination Procedures ................................................................................................................ 8 Handling of Hazardous Waste Materials .......................................................................................... 8 Housekeeping Requirements ................................................................................................................. 8
5 Site Hazards ......................................................................................................................................... 11 Chemical and Physical Agent Hazards ................................................................................. 11 Physical Hazards ....................................................................................................................... 12 Biological Hazards ................................................................................................................... 13
Attachments
Attachment 1 – Job Task Safety Analysis and PPE Assessment Form

S i t e - S p e c i f i c H e a l t h a n d S a f e t y P l a n
1
1 INTRODUCT ION
At SCS, protection of human health and the environment is paramount. This Site-Specific Health and Safety Plan (SSHSP) provides information to identify hazards that may be present and/or introduced by project’s activities onto SCS job sites, and details needed precautions that employees should follow to protect themselves. Tasks performed on site or during projects should be analyzed to determine if physical or chemical hazards requiring safeguards or additional Personal Protective Equipment (PPE) exist. This plan will be modified as necessary if any new hazards are identified during the project that require that additional safeguards be put in place. This plan is in the draft stage, approval will be gained from the SCS Office Safety and Health Coordinator prior to any field activities.
P R O J E C T O R G A N I Z A T I O N
Project Manager: Josh DeGayner 703-471-6150
Project Director: Stacey Demers 703-471-6150
Client Representative: Scott MacDonald 703-906-2335
S C O P E O F W O R K – W A S T E C H A R A C T E R I Z A T I O N
Waste characterization involves collecting field samples and sorting municipal solid waste into designated categories. The data that is generated from the field activities will be compiled and presented to Prince William County. There have been no reported serious or fatal incidents attributed specifically to the performance of waste characterization studies. However, accidents may occur due to the potential hazards associated with the presence of heavy equipment at the site, the components of the waste itself (potentially sharp objects, broken glass), climatic conditions, and carelessness. At Landfills, combustion of the waste materials at the working face or in "Hot Loads" from refuse vehicles can present potential hazards. The presence of heavy equipment in operation at the site (end loaders, graders, transfer station compactors, garbage trucks, etc.) presents potential hazards which can be avoided with the use of general common sense and staying visible. The equipment operators generally are involved in performing their tasks and may be unaware of the presence of other individuals within the immediate area. Personnel will be trained to be aware of the movement and location of equipment at all times. High-visibility safety vests will be required to be worn at all times.
The components of municipal solid waste present potential physical hazards. These include, but are not limited to, cuts from broken glass and sharp metal objects; splinters from pieces of wood; punctures from nails and other sharp objects; and scrapes and abrasions from the general handling of solid waste. There is also potential for exposure to household products, such as bleach, cleansers, and other toxic chemicals.

S i t e - S p e c i f i c H e a l t h a n d S a f e t y P l a n
2
To alleviate the possibility of injury, caution should be employed at all times when physically handling the solid waste. Protective clothing, including gloves and safety glasses, should be worn at all times. If there is any question about the handling of a component of solid waste, the Crew Chief should be notified. The waste characterization will be performed outdoors and not in a climate controlled area. Caution should be taken to avoid the possibility of heat stress due to protective clothing or weather, or frostbite in areas of extreme cold. Depending on temperature, portable heaters may be used to warm sorting personnel. Landfill gas (LFG) is produced by the anaerobic decomposition of organic waste materials placed in a landfill. LFG is typically composed of 50 to 60 percent methane, 40 to 50 percent carbon dioxide, and trace amounts of various other gases, including odorous and possible toxic compounds. At the Prince William County Landfill, the generation of LFG is not expected to be a concern. Refuse deposited at the Landfill can pose a potential fire hazard. Fires can be started through carelessness, sparks, or from "Hot Loads" handled at the refuse facilities. If fire or smoke is observed, Landfill personnel should be notified immediately, all SCS personnel and subcontractors should leave the immediate area at once, and the local emergency fire department should be notified.

S i t e - S p e c i f i c H e a l t h a n d S a f e t y P l a n
3
2 EMERGENCY RESPONSE AND MED ICAL TREATMENT PROCEDURES
1. Head northwest from the Landfill (A) on VA-234N/Dumfries Rd. Continue to follow VA-234N for 10.0 miles.
2. Take the VA-28N ramp to Manassas for 0.3 miles.
3. Merge onto Nokesville Road for 0.1 miles.
4. Turn left onto Godwin Drive and continue for 2.1 miles.
5. Turn right onto Sudley Road and continue for 0.5 miles.
6. Prince William Hospital (B) will be on the right.
F i g u r e 1 . M a p t o t h e H o s p i t a l a n d D i r e c t i o n s
Nearest Hospital Address: Prince William Hopsital 8700 Sudley Road Manassas, VA 20110 703-369-8000

S i t e - S p e c i f i c H e a l t h a n d S a f e t y P l a n
4
A C C I D E N T O R I N C I D E N T R E P O R T I N G S Y S T E M
In the event of an emergency at the site, project personnel should call 911 for emergency assistance. After the immediate emergency situation has been addressed by emergency personnel, SCS project personnel should call the SCS Project Manager and the Client Representative and inform them of the situation. The Project Manager should evaluate the nature of the emergency and direct project personnel actions from that point.
N O T I F I C A T I O N P R O C E D U R E S F O R I N C I D E N T S ( C L I E N T , L O C A L , S T A T E , O R F E D E R A L )
Site personnel should contact their supervisor immediately when an accident or injury occurs, and provide any needed information so that additional notifications can be determined and completed as needed.
M E T H O D S T O S U M M O N E M E R G E N C Y R E S P O N S E T E A M
Emergency services can be summoned through 911, as this service is active in the area.
R E S C U E A N D M E D I C A L T R E A T M E N T R E Q U I R E M E N T S
Stop work authority should be exercised when an injury or accident occurs. The appropriate emergency agency should be contacted and first aid administered, if possible. If the injury is not life-threatening and does not require emergency response, contact WorkCare at (800) 455-6155. First aid kits and fire extinguishers are available in each SCS work truck. Additional first aid or medical support is available at the site located in the main office building near the facility entrance.
3 S I TE DESCR IPT ION
L O C A T I O N D E S C R I P T I O N
The facility is located at 14811 Dumfries Road, Manassas, Virginia. The site is generally used as a landfill and resource recovery facility. SCS will be conducting field work on the landfill near the working face.
4 GENERAL F I E LD SAFETY PROCEDURES
General Standard Operating Procedures (SOPs) and additional SCS Health and Safety procedures and requirements are included in the current SCS Injury Illness Protection Program (IIPP) and on the SCS intranet. These documents are considered a part of this plan.
SCS team members will conduct themselves in a professional manner at all times. The following restrictions will also be observed by all SCS personnel and subcontractors to SCS.
Working while under the influence of intoxicants, narcotics, or controlled substances is

S i t e - S p e c i f i c H e a l t h a n d S a f e t y P l a n
5
prohibited.
Smoking anywhere on site is prohibited.
Loose clothing will not be worn on-site. Long hair will be worn up inside a hat.
Eating, drinking, chewing gum, smoking, or any practice that increases the probability of hand-to-mouth transfer and ingestion of material is prohibited on-site, unless in designated break areas.
No personnel will be admitted to the site without the proper safety equipment, clearance or other approval.
All personnel must comply with established safety procedures. Any staff member who does not comply with safety policy, as established by the Site Manager, will be immediately dismissed from the site.
No unapproved work clothes or equipment will be allowed on-site.
Prescription drugs should not be taken by personnel where the potential for contact with toxic substances exist. Use must be specifically approved by a qualified physician.
Work areas will be established based on prevailing site conditions and are subject to change. Personnel should check with the Site Manager for current and appropriate procedures regularly.
Contact with contaminated or potentially contaminated material should be avoided. Whenever possible, do not walk through puddles, mud, or any discolored ground surface. Do not kneel on the ground. Do not lean, sit or place equipment on drums, containers, or vehicles.
Due caution will be observed when proceeding on foot through open areas. Personnel
will remain near the sorting area and avoid high-traffic areas such as the working face.
Any medical emergency supersedes routine safety requirements.

S i t e - S p e c i f i c H e a l t h a n d S a f e t y P l a n
6
A P P L I C A B L E S T A N D A R D O P E R A T I N G P R O C E D U R E S ( S O P S ) A N D P R O G R A M S
The following SOPs are incorporated by reference and available on the SCS intranet.
SOP Number and Name SOP Number and Name
X 01 - General Code of Safe Work Practices X 22 - Safe Procedures for Working with Sites
That Contain Hydrogen Sulfide
X 04 - JTSA and PPE Assessment Procedures X 24 - Avoidance of Slips, Trips, and Falls
05 - Work Permits X 25 - Avoidance and Prevention of Heat and
Cold Stress, and Other Weather-Related Hazards
X 06 - Forklift and Heavy Machinery
Operations 26 - All-Terrain Vehicles and Watercraft
07 - Compressed Air and Compressed Gas
Cylinders 27 - OSHA and Other Regulatory Inspections
08 - Drilling and Well Installation
Procedures
09 - Electrical Safety Appendix Letter and Program Name
10 - Fall Protection X B - Hazard Communication
X 11 - Fire Extinguishers C - HAZWOPER
12 - Hand and Power Tools D - Exposure Assessment
13 - Working Safely with Ladders X E - PPE Other Than Respiratory Protection
14 - Landfill Leachate and Condensate
Safe Procedures X F - Respiratory Protection
15 - Lockout and Tagout X G - Motor Vehicle and Fleet Safety
17 - Materials Use and Handling H - Hearing Conservation
18 - Polyethylene (PE) Pipe Work Safe
Procedures X I - Bloodborne Pathogens
X 19 - Site Sanitation Procedures J - Excavation and Construction Earthwork
Program
20 - Safe Work Practices for Scaffolds K - Confined Space Entry
X 21 - Safe Procedures for Biological
Hazards (Snakes, Insects, Vegetation, Bacteria)
L - Ergonomics Program

S i t e - S p e c i f i c H e a l t h a n d S a f e t y P l a n
7
J O B T A S K S A F E T Y A N A L Y S I S ( J T S A ) A N D P P E A S S E S S M E N T
JTSAs for activities performed at this site have been completed as indicated below and are included as Attachment 1. A completed JTSA is required for all work tasks performed at the site. JTSAs are designed to identify steps which involve potential hazards to employees and should be reviewed and understood (and signed providing evidence of understanding) before performing any task at the site. If additional steps or hazards are present, the JTSA should be revised (and the revision signed by all affected staff) to indicate that all items have been appropriately addressed and are understood before proceeding with the task.
Unless identified in an attached Job Task Safety Analysis (JTSA) form, all project tasks are anticipated to only require Level D PPE, as defined by the Occupational Safety and Health Administration (OSHA). SCS field personnel (including subcontractors) will be informed in the use of safety equipment and will be required to wear protective clothing appropriate for the tasks in which they will be involved. Extra equipment will be located on-site. This equipment will include the following items:
Dust Masks Tyvek Coverall Suits Gloves (nitrile and HexArmor: SharpsMaster II) High Visibility Safety Vests Eye Protection Ear Protection Hard Hats First Aid Kit
Sufficient water for personal use will be brought on-site daily.
S A F E O B S E R V A T I O N S
The SCS SAFE Observation Checklist will be used by field and project personnel. The goal is for SCS staff to make at least one (1) documented observation per quarter during site activities.
O T H E R I N S P E C T I O N P R O C E D U R E S
Periodic site inspections may be made by the Project Supervisor, Project Manager, and Regional Compliance Auditor or Safety Specialist. There is also the potential for the client or regulatory agencies to visit and inspect the site. SCS personnel are to perform tasks in compliance with all contractual, regulatory, and company requirements at all times.

S i t e - S p e c i f i c H e a l t h a n d S a f e t y P l a n
8
S I T E C O N T R O L
SCS and its subcontractors will be restricted in site usage to the area designated for sorting samples on the Landfill. Temporary access will be allowed to washroom facilities in the case of an emergency. A front end loader will transport samples from the working face to the sorting area. Under no circumstances will SCS employees or subcontractors enter other buildings and areas of the Landfill. SCS employees and subcontractors will remain in the area designated for sorting samples.
Our clients are responsible for providing SCS employees with safe site access, which includes sites that are free of threats from transients or other aggressive people or animals. If an SCS employee encounters an aggressive person or animal, they should withdraw from the site and contact the Site Representative and their SCS supervisor. The Site Owner is responsible for removing the threats, and SCS employees should not take any affirmative action of their own.
D E C O N T A M I N A T I O N P R O C E D U R E S
The risks of illness due to ingestion of diseased or decomposing materials from the work site are significant. To minimize these risks, all personnel should remove and store the outer layer of their protective clothing (i.e., coveralls, gloves, hard hat, etc.) on-site. Hands, face, and fingernails should be thoroughly washed, or scrubbed, with soap and water prior to engaging in any activity likely to transmit materials encountered on-site into the mouth. If waste materials come in contact with the skin, that crew member will be temporarily excused to thoroughly wash the affected area with soap and water. A hand washing station will be rented by SCS, or will be provided by job site safety personnel.
H A N D L I N G O F H A Z A R D O U S W A S T E M A T E R I A L S
Hazardous materials will be avoided during sample selection. If hazardous materials are encountered during the waste sorting activities, they will be segregated from the normal waste and recycling streams and put in separate containers. The contents of these containers will be reported to Landfill personnel and properly disposed of.
Caution will be taken when handling mercury-containing wastes such as fluorescent light bulbs. Care will be taken to not break the glass bulb, and to avoid samples with excess amounts of fluorescent light bulbs. Gloves and Tyvek suits will provide skin protection from mercury compounds.
Extreme care will be taken when handling and disposing of hazardous materials. If subcontractors encounter any material that may be considered hazardous, they will be instructed to report it to the Site Manager immediately.
H O U S E K E E P I N G R E Q U I R E M E N T S
A portable toilet will be staged near the sorting area. Hand sanitizer and soap will be made available to assist with decontamination. The designated break area will be located near the sorting area.

S i t e - S p e c i f i c H e a l t h a n d S a f e t y P l a n
1 1
5 S I TE HAZARDS
C h e m i c a l a n d P h y s i c a l A g e n t H a z a r d s
The following chemical and physical hazards should be considered before performing any task or work at the site. The analysis will depend on a thorough understanding of the site’s physical characteristics and the task(s) being performed.
Toxic Compounds: Non-Methane Organic Compounds (NMOCs), as well as inorganic toxic contaminants such as mercury, and sometimes even radioactive contaminants such as tritium, may be present on a site. NMOCs include such toxic compounds as benzene, toluene, chloroform, vinyl chloride, carbon tetrachloride, and trichloroethane, which, although commonly less than 1 percent by weight, are hazardous. These potential hazards should be evaluated on a case-by-case basis. Additional precautions will be established as needed.
Poisons: Pesticides, cleaners, or other toxic materials of various types may be present in the waste stream. Avoid contact with these items. Pay close attention to where you walk and what you touch such that materials do not accidentally come into contact with skin, eyes, mouth, or clothing. Immediately remove any contaminated clothing, and wash with soapy water any skin that becomes contaminated. Avoid contact at all times.
Flammables: Fuel such as gasoline and diesel may be present in the waste stream. Additionally, paint thinners or other flammable materials may be present in the waste. The primary risk associated with these materials is fire. Keep all ignition sources away from flammable materials. Do not smoke, unless in designated areas. Pay close attention to where you walk and what you touch such that materials do not accidentally come into contact with skin, eyes, mouth, or clothing. Immediately remove any contaminated clothing, and wash with soapy water any skin that becomes contaminated. Avoid contact at all times.
Oxidizers: Fertilizers, pool chemicals, chlorine, or other oxidizers may be present in the waste stream. These materials may be in use at water treatment plants or in the waste at the site. The primary risk from oxidizers is an increased fire potential. Keep fire and fuel or oil away from oxidizers. Do not smoke, unless in designated areas. Pay close attention to where you walk and what you touch such that materials do not accidentally come into contact with skin, eyes, mouth, or clothing. Immediately remove any contaminated clothing, and wash with soapy water any skin that becomes contaminated. Avoid contact at all times.
Corrosives: Acidic and caustic materials may be present in the waste stream. These materials may be in use at water treatment plants or in the waste at the site. The primary risk from corrosives is damage to the skin or eyes. Pay close attention to where you walk and what you touch such that materials do not accidentally come into contact with skin, eyes, mouth, or clothing. Immediately remove any contaminated clothing, and wash with soapy water any skin that becomes contaminated. Avoid contact at all times.

S i t e - S p e c i f i c H e a l t h a n d S a f e t y P l a n
1 2
P h y s i c a l H a z a r d s
The following physical hazards should be considered before performing any task or work at the landfill. Depending on the task(s) being performed, any or all of these hazards may be present.
Heavy Equipment: Compactors, bull dozers, loaders, track hoes, forklifts and large trucks, and other vehicles are present at the Landfill. Loud noise and limited visibility can increase the threat of being run over or crushed by these vehicles. Wear high-visibility vests (recommend Class III) and coordinate with vehicle operators when working in the vicinity of these pieces of equipment. Heavy equipment hazards are especially present at or near the working face. SCS and its subcontracts will remain in the area designated for sorting samples, and avoid high traffic areas and areas where heavy equipment operates.
Heat-Related Injuries: Elevated body temperatures can cause serious injury or death. Working outdoors or in the sun increases the chance of heat-related injuries. This hazard is especially critical when PPE (such as coveralls or rain gear) is worn, since heat from the body becomes trapped inside clothing. Personnel should drink plenty of liquids and take breaks as needed. The following describes the various effects of heat-related injuries.
Heat Disorders and Health Effects:
Heat Stroke: This disorder occurs when the body’s system of temperature regulation (e.g., sweating and evaporation) fails and body temperature rises to critical levels. The condition is caused by a combination of highly variable factors, and its occurrence is difficult to predict. Heat stroke is a serious hazard, however. Primary signs and symptoms are confusion, irrational behavior, loss of consciousness, convulsions, a lack of sweating (usually), hot, dry skin, and an abnormally high body temperature. If a worker shows signs of possible heat stroke, call 911 to obtain immediate medical assistance. The worker should be placed in a shady area, and his or her outer clothing should be removed. The worker’s skin should also be wetted and air movement around the body increased to improve evaporative cooling until professional methods of cooling are initiated and the seriousness of the condition can be assessed. Fluids should be replaced as soon as possible--by mouth only if the worker is conscious. The medical outcome of an episode of heat stroke depends on the victim’s physical fitness and the timing and effectiveness of first aid treatment. Regardless of the worker’s protests, no employee suspected of being ill from heat stroke should be sent home or left unattended unless a physician has specifically approved such an order.
Heat Exhaustion: The signs and symptoms of heat exhaustion include clammy skin, headache, nausea, vertigo, weakness, thirst, and giddiness. Fortunately, heat exhaustion responds readily to prompt treatment. This condition, however, should not be dismissed lightly, for several reasons. One is that fainting associated with heat exhaustion can be dangerous because the victim may be operating machinery or controlling an operation that should not be left unattended. The victim could also be injured when he or she faints. While the signs and symptoms associated with heat exhaustion are similar to those of heat stroke, the notable difference (with heat

S i t e - S p e c i f i c H e a l t h a n d S a f e t y P l a n
1 3
exhaustion) is clammy skin. Workers suffering from heat exhaustion should be removed from hot environments and given fluid replacement, by mouth only if the workers are conscious. They should also be encouraged to get adequate rest.
Heat Rashes: The most common problem occurring in hot work environments is heat rash. Prickly heat is manifested as red papules and usually appears in areas where the clothing is restrictive. As sweating increases, the papules give rise to a prickling sensation. Prickly heat occurs in skin that is persistently wetted by unevaporated sweat, and papules may become infected if they are not treated. In most cases, heat rash will disappear when the affected individual returns to a cool environment.
Heat Fatigue: One factor that predisposes individuals to heat fatigue is the lack of acclimatization. Use of a program of acclimatization and training for work in hot environments are advisable. The signs and symptoms of heat fatigue include impaired performance of skilled sensorimotor, high-concentration, or high-vigilance activities. The sole treatment available for heat fatigue is to remove heat stress and increase fluid replacement before a more serious heat-related condition develops.
Cold-Related Injuries: In winter weather conditions, there is a potential for injury from cold, including dehydration, frostbite, heavy shivering, excessive fatigue, drowsiness, irritability, and euphoria. If workers show these symptoms, work should cease and affected personnel rest in heated buildings or vehicles.
Inclement weather/ lightning – Blizzards, flash floods, fog, tornados, and other meteorological events may or may not be predictable, and may require immediate response for survival. SCS personnel should use sound judgment concerning significant weather threats, including a stop work authority if necessary. Some weather events may restrict visibility which can present a driving hazard. Gusts of wind may physically knock a worker off a ledge or piece of equipment (e.g., ladder). The danger of lightning strike is increased when working on an elevated surface. Lightning can strike miles ahead of a storm when no rain is present. All field work should be stopped immediately when lightning is visible or thunder is audible. All personnel should seek shelter inside a building or vehicle. Do not take shelter near tall objects such as power lines, trees, antennas, or the flare stack. Work should not resume until lightning is no longer visible and thunder cannot be heard.
B i o l o g i c a l H a z a r d s
Rodents, poisonous insects, snakes, other animals and/or plants are a natural part of any ecosystem. They are sometimes difficult to eliminate or avoid on some sites because of the location. Employees should be aware of the potential for encountering these types of animals and plants. Where possible, nesting places should be removed or access to them should be limited. If several infestations occur, remedies should be discussed with a supervisor and the client (see SCS IIPP, SOP-21, for precautions and treatment for biological hazards). The following could be encountered in performance of the operation, maintenance, and monitoring functions of a project:

S i t e - S p e c i f i c H e a l t h a n d S a f e t y P l a n
1 4
Hantavirus: Infection typically occurs by the inhalation of tiny airborne droplets of fresh or dried rodent excretions. Transmission to humans may also occur through direct contact with rodents or rodent-contaminated materials, and ingestion of contaminated food or water is also a possible route of transmission. Sweeping or “shaking out” rodent-contaminated materials should be avoided unless performed using respiratory protection. The early symptoms of hantavirus disease are flu-like (fever, chills, muscle aches). For a very short period of time, the infected person starts to feel better. Then, within 1 to 2 days, he or she may develop shortness of breath. The disease gets worse quickly and leads to respiratory failure, a condition known as Hantavirus Pulmonary Syndrome (HPS). About half of all HPS patients experience these symptoms, which usually occur 1 to 5 weeks from contracting the illness.
Snakes: Timber rattlesnakes and copperheads are poisonous snakes that are known to inhabit Virginia. Not all rattlesnakes give audible warning before they strike. Extra caution should be taken if tools or other materials are dropped in highly vegetated areas, around rocks, into stockpiles of pipe or other objects, or when walking through highly vegetated areas where visibility (of the ground) is limited. The most active times for rattlesnakes are morning, late afternoon, and early evening; however, encounters could happen at any time of the day. Walking loudly, shuffling feet, or making noise while working is recommended.
Bloodborn Pathogens: Human blood can contain harmful viruses such as the Human Immunodeficiency Virus (HIV) and Hepatitis B Virus (HBV). Contact with affected blood, as well as materials contaminated by this blood, can result in transmitting viruses and the life-threatening conditions they cause.
SCS has adopted a Bloodborne Pathogen Exposure Control Plan to protect employees who may come into contact with blood, or materials contaminated with blood, during the performance of tasks. Although the program is intended to comply with OSHA’s Bloodborne Pathogens Standard, 29 CFR 1910.1030, the primary purpose for adopting the plan is to help employees avoid bloodborne pathogens at work.
When an employee is involved in an exposure incident, it must be reported in accordance with the Health and Safety Injury and Illness Prevention Plan. All employees involved in an exposure incident will be offered post-exposure evaluation and follow-up, in accordance with the OSHA standard. Follow-up will include:
Documentation of the route of exposure and the circumstances related to the incident.
If possible, identification of the source individual and, if possible, the status of the source individual. The blood of the source individual will be tested (after consent is obtained) for HIV/HBV infectivity.
Results of testing of the source individual will be made available to the exposed employee, along with applicable laws and regulations concerning disclosure of the identity and infectivity of the source individual.
The employee will be offered the option of having blood collected for testing of that employee’s HIV/HBV serological status. The blood sample will be preserved for at

S i t e - S p e c i f i c H e a l t h a n d S a f e t y P l a n
1 5
least 90 days to allow the employee to decide if the blood should be tested for HIV serological status. However, if the employee decides, prior to that time, that testing will be conducted, the appropriate action can be taken and the blood sample discarded.
The employee will be offered post-exposure counseling in accordance with current recommendations of the U.S. Public Health Service.
The employee will be given appropriate counseling concerning precautions to take during the period after the exposure incident. The employee will also be given information regarding potential illnesses and procedures for reporting related symptoms to appropriate personnel.

S i t e - S p e c i f i c H e a l t h a n d S a f e t y P l a n
1 6
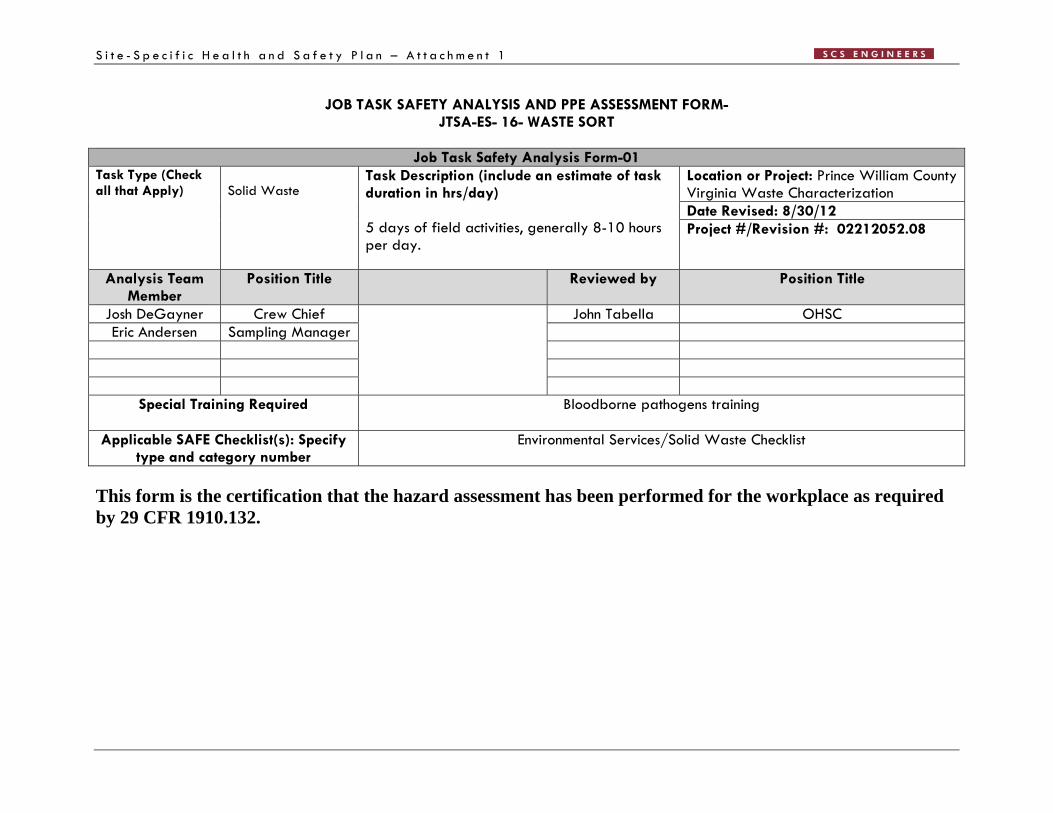
Attachment 1 – Job Task Safety Analysis and PPE Assessment Form
S i t e - S p e c i f i c H e a l t h a n d S a f e t y P l a n – A t t a c h m e n t 1
JOB TASK SAFETY ANALYSIS AND PPE ASSESSMENT FORM- JTSA-ES- 16- WASTE SORT
Job Task Safety Analysis Form-01
Task Type (Check all that Apply)
Solid Waste
Task Description (include an estimate of task duration in hrs/day) 5 days of field activities, generally 8-10 hours per day.
Location or Project: Prince William County Virginia Waste Characterization Date Revised: 8/30/12 Project #/Revision #: 02212052.08
Analysis Team Member
Position Title Reviewed by Position Title
Josh DeGayner Crew Chief John Tabella OHSC Eric Andersen Sampling Manager
Special Training Required Bloodborne pathogens training
Applicable SAFE Checklist(s): Specify type and category number
Environmental Services/Solid Waste Checklist
This form is the certification that the hazard assessment has been performed for the workplace as required by 29 CFR 1910.132.

S i t e - S p e c i f i c H e a l t h a n d S a f e t y P l a n – A t t a c h m e n t 1
Job Task Step Potential
Environmental and Personnel Hazards1
Critical Actions PPE Required
1. Drive to site, set up sorting table and containers.
Heavy lifting Slips/trips/falls Vehicle traffic
Check in w/facility Ensure work area is
secured/isolated Use buddy system Employ safe lifting
behaviors Stretch/warm-up
Body: Safety vest, Tyvek Foot: Steel--toe ANSI boots Hand: Nitrile + Leather outer glove Respiratory: None Hearing: None Eye/Face: Safety glasses
2. Collect solid waste samples
Heavy lifting Vehicle/HE traffic Slips/trips/falls Medical/bio waste Sharps Chemical exposures
Use buddy system Stay visible Use safe lifting Set up away from traffic Avoid Heavy EQ traffic
Body: Safety vest, Tyvek Foot: Steel--toe ANSI boots Hand: Nitrile + Puncture Resistant Gloves Eye/Face: Safety glasses
3. Hand-sort solid waste materials on the sorting table. (At the Recycling Center)
Heavy lifting Vehicle/HE traffic Slips/trips/falls Medical/bio waste Sharps Chemical exposures Stress/hygiene concerns
Use buddy system Stay visible Use safe lifting Set up away from traffic Brush trash (vs digging) Wash hands freq. Stay hydrated Shift breaks
Body: Safety vest, Tyvek Foot: Steel--toe ANSI boots Hand: Nitrile + Puncture Resistant Gloves Respiratory: Dust mask (optional) Hearing: Earplugs (optional) Eye/Face: Safety glasses
4. Cleanup and Decontaminate
Heavy lifting Slips/trips/falls Vehicle traffic
Ensure work area is secured/isolated
Use buddy system Employ safe lifting
behaviors Stretch/warm-up Decontaminate PPE
Body: Safety vest, Tyvek Foot: Steel--toe ANSI boots Hand: Nitrile + Leather outer glove Respiratory: Dust mask (optional) Hearing: None Eye/Face: Safety glasses

S i t e - S p e c i f i c H e a l t h a n d S a f e t y P l a n – A t t a c h m e n t 1
Job Task Step Potential Environmental and Personnel Hazards1
Critical Actions PPE Required
5. Demob Vehicle/HE traffic Check out w/facility Head: None Body: High Visibility Vest Foot: Steel--toe ANSI boots Hand: None Respiratory: None Hearing: None Eye/Face: None
End of JTSA Form