washington state university debt report to regents policy governing principles • no debt will be...
TRANSCRIPT

Washington State UniversityDebt Report to Regents
January 2015
1
Overview• Debt Policy Governing Principles• Highlights of Outstanding Debt
– Bond Debt Profile– Pro-Forma Debt Issuance– General Revenue Bond Debt Service Allocation– Annual Bond Payments– Lease Purchase Contracts– Interest Rate Trends– Debt Activities during Fiscal Year 2014
• Internal Debt Practices• Bond Ratings• Key University Ratios and Comparisons
2

Debt Policy Governing Principles
• No debt will be issued without prior approval of the Regents
• University will continue internal and external compliance monitoring
• A debt report will be presented to the Regents each January showing
– Outstanding debt– Key ratios/measures– Potential borrowing plans– The University’s debt burden ratio, with and without new borrowing
3

Bond Debt Profile
(1) Does not include Capital Leases
Outstanding Principal By Bond Type(1) Outstanding Principal By Use
• Approximately $350 million of new debt issued in the past 5 years
• 10 Year principal pay down (FY 2015 – 2024) of currently outstanding debt is 34%
• 2015 Fiscal Year End Outstanding Principal : $546,035,0001)
25%
25%
1%
22%
27% Athletics System (25%)
Housing & Dining (25%)
Parking System (1%)
Student Facilities (22%)
Academic Research Facilities (27%)
$0
$100
$200
$300
$400
$500
$600
2005
2007
2009
2011
2013
2015
2017
2019
2021
2023
2025
2027
2029
2031
2033
2035
2037
2039
2041
Mill
ions
Housing and Dining Trust and Building Fee General Revenue
Student Fee Athletics System State Reimbursable
Parking System
4

Pro-forma Debt Issuance
(1) Does not include Capital Leases, 2015 Bonds approximately $87.7 million of par for $101.5 million in project funds(2) Approved at the March 28, 2014 Board of Regents Meeting (3) Potential Candidates, Subject to market conditions
Outstanding Principal By Bond Type(1) Outstanding Principal By Use
• Par amount of 2015 GRB is estimated to be approximately $87.7 million
• 10 Year principal pay down (FY 2015 – 2024) including 2015 GRB debt is 29%
• 2015 Fiscal Year End Outstanding Principal including 2015 Pro Forma GRB: $633,720,000(1)
2015 New Money PurposesPurpose AmountDigital Class Room Facility - Pullman $55,000,000Police Department Building - Pullman 7,500,000Washington Bldg. Health Center – Pullman(2) 6,952,766Cultural House 16,000,000Teaching Health Center Facility - Spokane 16,000,000Total $101,452,766
2015 Refunding CandidatesPurpose Callable ParHousing and Dining Series 2005 $ 9,040,000 Parking Series 2005 6,250,000Student Fee Series 2006A(3) 53,405,000Athletic Facilities Series 2007(3) 17,585,000
$0
$100
$200
$300
$400
$500
$600
$700
2005
2007
2009
2011
2013
2015
2017
2019
2021
2023
2025
2027
2029
2031
2033
2035
2037
2039
2041
Mill
ions
Housing and Dining Trust and Building Fee General RevenueStudent Fee Athletics System State ReimbursableParking System 2015 GRB
21%
21%
1%
23%
34%
Athletics System (21%)
Housing & Dining (21%)
Parking System (1%)
Student Facilities (23%)
Academic ResearchFacilities (34%)
5

As of 12/1/2014
Issue Athletic Facilities Housing & DiningAcademic Research
Facilities Student Facilities
2012 GRB$70,350,000
Martin Stadium
2012B GRB
$25,830,000Bio Medical & Health
Science Building, Spokane
2013 GRB
$40,735,000 $9,050,000Improvements and
renovations of Athletic System
Facilities
Refunding of Housing and Dining System
Revenue Bonds, 2004
2014 GRB
$36,205,000 $18,130,000Construction of Northside
Housing ProjectClean Technology
Laboratory
Total Outstanding $111,085,000 $45,255,000 $43,960,000 $0
2015 GRB*$61,380,000
Digital Classroom Facility and Spokane Clinic
$26,305,000Police Building,
Washington Building, and Cultural House
Pro-Forma Total $111,085,000 $45,255,000 $105,340,000 $26,305,000
General Revenue Bond Debt By Use
*Preliminary estimates, subject to change 6

Annual Bond Payments
• Current Average Annual Debt Service (FY 2015 – 2024): $46,712,541
• Average Annual Debt Service including 2015 Pro Forma GRB (FY 2015 – 2024): $52,895,000
$0
$10
$20
$30
$40
$50
$60
Mill
ions
Total Annual Debt Service
Housing and Dining Athletics System Parking SystemTrust and Building Fee General Revenue Student FeeState Reimbursable Capital Leases Pro Forma 2015 GRBs
7

Lease Purchase Contracts(Certificates of Participation)
• Total Certificate of Participation Principal - $15,921,139– $ 2,366,139 Equipment– $11,570,000 Student Information System– $ 1,985,000 Tri-Cities CIC Building
$0
$500
$1,000
$1,500
$2,000
$2,500
$3,000
$3,500
Thou
sand
s
Annual COP Payments(By Fiscal year)
Principal Interest
8
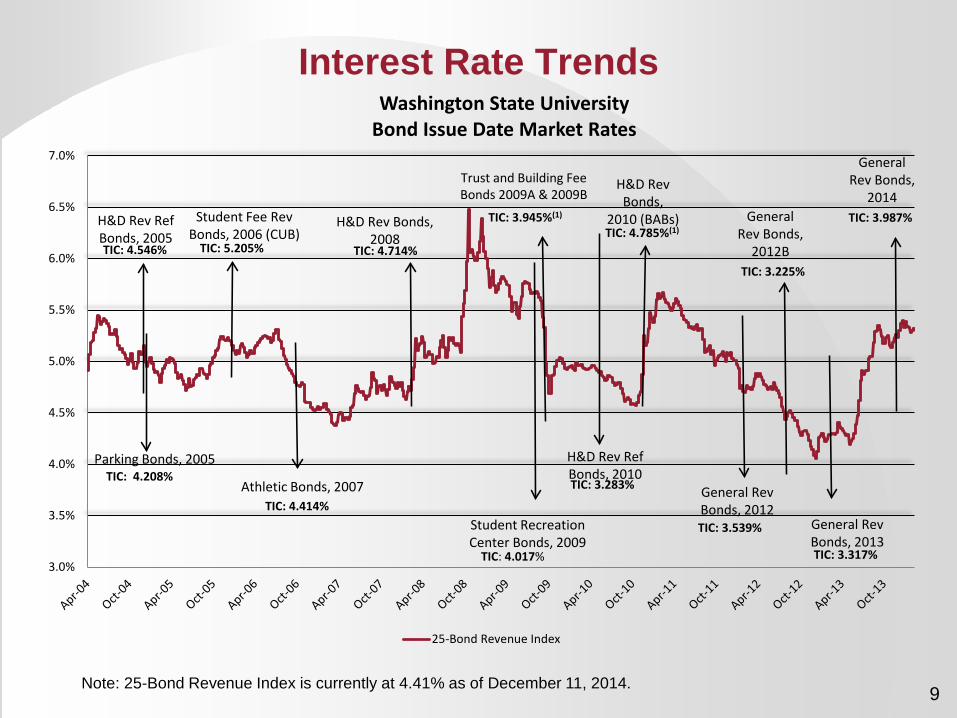
Interest Rate Trends
3.0%
3.5%
4.0%
4.5%
5.0%
5.5%
6.0%
6.5%
7.0%
Washington State UniversityBond Issue Date Market Rates
25-Bond Revenue Index
H&D Rev RefBonds, 2005
Parking Bonds, 2005
Student Fee Rev Bonds, 2006 (CUB)
Athletic Bonds, 2007
H&D Rev Bonds, 2008
Trust and Building Fee Bonds 2009A & 2009B
Student Recreation Center Bonds, 2009
H&D Rev RefBonds, 2010
H&D RevBonds,
2010 (BABs)
General RevBonds, 2012
General Rev Bonds,
2012B
General Rev Bonds, 2013
General Rev Bonds,
2014
TIC: 4.208%
TIC: 3.945%(1)
TIC: 4.714% TIC: 5.205% TIC: 4.546%TIC: 4.785%(1)
TIC: 4.414%
TIC: 3.317%
TIC: 3.539%
TIC: 3.283%
TIC: 4.017%
TIC: 3.225%
TIC: 3.987%
Note: 25-Bond Revenue Index is currently at 4.41% as of December 11, 2014. 9

Recent Debt Activities
• Bond rating for General Revenue Bonds reaffirmed (January 2014)- Moody’s Aa2 and S&P AA
• Development of long term capital plans with each auxiliary, including review operating performance and debt coverage ratios
• Reviewed underwriting team and hired Barclays, JPMorgan, and Wells Fargo
• Prepare for proposed approximately $101.5 million in financing for 2015
• Apply for rating update for 2015 financing
10
Internal Debt Practices• Key University Ratios
– Unrestricted net assets/debt– Debt service/operating expenses– Debt service coverage (by auxiliary and University)– The University will seek to not exceed a guideline debt burden
ratio of 7.5%
• Comparative Ratios– Rating category medians– Peer institutions
11

University Bond Ratings
Moody’s(As of January 2014)
S&P(As of January 2014)
Rating Rating
Athletics A1 NR
Housing & Dining Aa2 A+
Parking Aa3 A
Rec Center Aa2 AA
Student Fee Aa2 AA
Trust & Building Aa2 AA
General Revenue Aa2 AA
Note: All ratings have a stable outlook
12

Key University Ratios
Ratio Pro Forma (3) FY 2014 (2) FY 2013 (1)Moody’s
“Aa2” Median (1)
Moody’s “Aa3”
Median (1)
Unrestricted Financial Resources to Direct Debt (Higher is stronger) Measures coverage of debt by the most liquid resources
0.14x 0.16x 0.20x 0.50x 0.50x
Debt Service to Operations(Lower is stronger)Measures peak debt service burden on the annual operating budget
5.76%(4) 4.60% 4.41% 3.70% 4.30%
Debt Service Coverage(Higher is stronger)Measures actual margin of protection for annual debt service payments from annual operations
2.1x 2.57x 2.8x 2.8x 2.9x
(1) This information is the most recent information available in Moody's MFRA data, as of December 10, 2014(2) Information is from unaudited 2014 financials(3) The pro forma is based on FY 2014 unaudited financial data and incorporates the proposed 2015 GRB Pro
forma debt service. (4) Debt service to Operations is calculated as: $55,622,197 divided by $964,897,447
13

Key University Ratios with Comparisons
Ratio WSU WSU (1) ColoradoState(1)
OklahomaState(1)
VirginiaCommon-wealth(1)
West Virginia(1)
2014University
2013Moody’s
2013Moody’s
2013Moody’s
2013Moody’s
2011Moody’s
Unrestricted financial resources to direct debt (Higher is Stronger)
0.16x 0.2x 0.3x 0.4x 0.3x -0.10x
Debt service to operations
(Lower is Stronger)4.60% 4.41% 3.60% 4.30% 4.71% 4.90%
Debt service coverage(Higher is Stronger)
2.57x 2.8x 2.9x 2.0x 2.3x 2.1x
Moody’s Rating Aa2 Aa2 Aa3 Aa3 Aa2 Aa3
(1) Based on Moody’s MFRA data as of December 9, 2014. Comparable institutions are Land Grant universities, with Net Revenues approximating those of WSU.
14

Coverage by Auxiliary
FY 2014 Actual
FY 2013 Actual
Coverage Requirement Basis
Housing & Dining 2.85x 3.55x 1.25x Net Revenue
Student Recreation Center 1.20x 1.29x 1.00x Gross Revenue
Compton Union Building 1.05x 1.03x 1.00x Gross Revenue
Trust & Building Fee >1.00x >1.00x 1.00x Sum Sufficient
Athletics >1.00x 1.01x 1.00x Pledged Revenue
Parking 3.08x 3.26x 1.25x Net Revenue
Note: Higher ratio is stronger.
15