washington dulles international airport...cargo operations at the airport were forecast based on...
TRANSCRIPT

Washington Dul les Internat ional Airport
Cargo Area Study
Prepared for:
Metropolitan Washington Airports Authority
Prepared by:
Ricondo & Associates, Inc.
January 2010


Washington Dulles International Airport
Cargo Area Study i January 2010 Table of Contents
Table of Contents 1. Executive Summary...................................................................................................................1
1.1 Approach.......................................................................................................................1 1.2 Findings/Conclusions....................................................................................................1
2. Cargo Facility Inventory............................................................................................................2 2.1 Cargo Operations Overview..........................................................................................2
2.1.1 Material Handling, Staging, and Storage .........................................................2 2.1.2 Landside Operation ..........................................................................................2 2.1.3 Airside Operations............................................................................................5
2.2 Existing Facilities Overview.........................................................................................5 2.3 Facilities Inventory .......................................................................................................5
2.3.1 Cargo Buildings 1 through 4 ............................................................................5 2.3.2 Cargo Buildings 5 and 6 .................................................................................11 2.3.3 Future Cargo Buildings ..................................................................................11
2.4 Comparative Analysis and Benchmarking..................................................................11 2.4.1 Miami International Airport ...........................................................................11 2.4.2 Hartsfield-Jackson Atlanta International Airport ...........................................17 2.4.3 San Francisco International Airport ...............................................................17 2.4.4 Chicago O’Hare International Airport............................................................17
3. Historical and Forecast Air Cargo...........................................................................................25 3.1 Historical Cargo Activity ............................................................................................25 3.2 Cargo Forecasts...........................................................................................................26 3.3 Freight Forecast Results..............................................................................................26
4. Cargo Facility Requirements...................................................................................................28 4.1 Cargo Area Requirements...........................................................................................28 4.2 Cargo Building Areas .................................................................................................33
4.2.1 Cargo Apron Areas.........................................................................................34 4.3 Total Acreage Requirements.......................................................................................35
5. Development of Alternatives...................................................................................................35 5.1 Potential Cargo Sites...................................................................................................36 5.2 Alternative Concepts...................................................................................................36
5.2.1 Site 1 – Existing Cargo Area ..........................................................................43 5.2.2 Site 2 – West Midfield Area...........................................................................43 5.2.3 Site 3 – Airport Support Zone Area ...............................................................43 5.2.4 Site 4 – Crosswind Area .................................................................................44 5.2.5 Split Site Alternative ......................................................................................44
6. Alternative Evaluation and Comparison .................................................................................44 6.1 Evaluation Criteria ......................................................................................................44 6.2 Evaluation Results ......................................................................................................45
6.2.1 Opportunities and Constraints ........................................................................45 6.2.2 Comparison Matrix.........................................................................................52
7. Recommended Alternative ......................................................................................................52 7.1 Demand Triggers ........................................................................................................54
7.1.1 Cargo Forecast................................................................................................54

Washington Dulles International Airport
Cargo Area Study ii January 2010 Table of Contents
7.1.2 Facility Program .............................................................................................54 7.1.3 Adequacy of the Existing Site ........................................................................54
7.2 Existing Cargo Area Only vs. New Cargo Area .........................................................54 7.2.1 Expand Existing Cargo Area Only .................................................................57 7.2.2 Develop New Cargo Area ..............................................................................57
7.3 New Cargo Area Development Options .....................................................................57 7.3.1 Relocation of Cargo Operations to the ASZ Area..........................................57 7.3.2 Relocation of Partial Cargo Operations..........................................................57
8. Summary .................................................................................................................................58
Appendix A Tenant Interview Documentation..............................................................................A-1 Appendix B Ground Service Equipment Time/Distance Analysis ...............................................B-1
List of Tables
Table 2-1 Table 2-2 Table 2-3 Table 3-1 Table 3-2 Table 3-3 Table 6-1
Tenants of Cargo Buildings 1 through 4 ................................................................... 6
Tenants of Cargo Buildings 5 and 6 ........................................................................ 12
Cargo Facilities Comparison Matrix ....................................................................... 18
Historical Cargo Activity at IAD, 1990 to 2006 (in thousands of pounds)............. 25
Forecast of Freight Activity at the Airport .............................................................. 27
Forecast Freight Activity at IAD by Airline (in pounds) ........................................ 29
Comparison Matrix (unweighted) ........................................................................... 53

Washington Dulles International Airport
Cargo Area Study iii January 2010 Table of Contents
List of Exhibits
Exhibit 2-1 Exhibit 2-2 Exhibit 2-3 Exhibit 2-4 Exhibit 2-5 Exhibit 2-6 Exhibit 2-7 Exhibit 2-8 Exhibit 3-1 Exhibit 3-2 Exhibit 4-1 Exhibit 4-2 Exhibit 4-3 Exhibit 4-4 Exhibit 5-1 Exhibit 5-2 Exhibit 5-3 Exhibit 6-1 Exhibit 7-1
Air Cargo Terminal Material Handling Flow Chart...................................................3
Existing Cargo Facilities Area ...................................................................................7
Existing Cargo Facilities, Buildings 1 through 4 .......................................................9
Existing Cargo Facilities, Building 5 and 6 .............................................................13
Existing Cargo Facilities – Miami International Airport .........................................15
Existing Cargo Facilities – Hartsfield-Jackson Atlanta International Airport .........19
Existing Cargo Facilities – San Francisco International Airport .............................21
Existing Cargo Facilities – Chicago O’Hare International Airport..........................23
IAD Historical Freight Activity 1990 to 2006 .........................................................26
Forecast of Freight Activity at the Airport...............................................................27
Programmed IAD Cargo Building/Apron Plan........................................................31
Composite Cargo Building Requirement Based on Level of Automation...............33
Cargo Activity Distribution by Area Requirement (Average Level of Automation) .............................................................................................................34
Composite Staging and Apron Requirements ..........................................................35
Potential Cargo Sites ................................................................................................37
Short-listed Cargo Sites............................................................................................39
Alternative Sites .......................................................................................................41
Area Impacts and Other Projects..............................................................................49
Cargo Study Decision Tree ......................................................................................55

Washington Dulles International Airport
Cargo Area Study iv January 2010 Table of Contents
THIS PAGE LEFT INTENTIONALLY BLANK

Washington Dulles International Airport
Cargo Area Study 1 January 2010
1. Executive Summary The purpose of this study is to provide the Metropolitan Washington Airports Authority (referred to hereinafter as the Authority or MWAA) an updated cargo activity forecast and recommendations for the expansion of cargo operations at Washington Dulles International Airport (IAD or the Airport).
Continued growth of cargo operations and supplementary airport service operations at IAD has filled the available facilities to capacity. As a result, spaces for new tenants and for expansion of existing operations have become constrained. Current long range plans call for future cargo buildings to be constructed in the North Airport Area (NAA) adjacent to the existing facilities. However, construction of a third parallel runway and coinciding studies relating to development of expanded passenger terminal facilities, landside access infrastructure, consolidated rental car facilities, and development of Airport property west of the new runway system provide the Authority with opportunities to analyze the overall cargo operation. The cargo facilities analysis will include near- and long-term growth scenarios based on updated activity forecasts and land-use goals and objectives.
The older cargo facilities at IAD have additional capacity constraints. Cargo Buildings 1 through 4 are approaching their life-cycle limits and can not efficiently serve modern delivery vehicles or provide adequate storage, queuing, maneuvering area, and parking for most IAD cargo operators.
1.1 Approach For this Study previous cargo area studies for IAD were reviewed, existing cargo operations using the approved Airport Land Use Plan were documented, and site visits were made to the individual facilities. Multiple interviews and walkthroughs with current tenants and tenant representatives were conducted to assess the condition of each facility and how it accommodated user needs. A survey was distributed to all known tenants asking for input related to operation size, activity growth projections, and access. These findings formed the basis for development of an updated activity forecast and expansion concepts.
Cargo operations at the Airport were forecast based on recent trends. A trend line analysis was conducted for activity since 1990, indicating that domestic cargo will increase through 2030 at a 2.4 percent compound annual growth rate (CAGR), and international activity would increase at a 6.8 percent CAGR, for a total cargo activity CAGR of 4.6 percent. Total activity at the Airport is projected to increase to 1.8 billion pounds in 2030 from 770 million pounds in 2007. Upon completion of the updated cargo activity forecast, concept alternatives were developed for accommodating the demand requirements of expanded cargo operations. Forecast demand was compared to the area allocated in the NAA, assuming continued expansion of existing facilities. Concept alternatives for the development of a green field cargo activity area in the west and south areas of the Airport were also explored.
These concepts were compared to one another and to the existing facilities to assess levels of efficiency, ability to accommodate future growth, and relative cost.
1.2 Findings/Conclusions It was concluded from the evaluation of various potential sites that the Airport Support Zone (ASZ) was the best option for new cargo development at IAD. This site can accommodate full or partial relocation of all cargo facilities.
Washington Dulles International Airport
Cargo Area Study 2 January 2010
Long-term development of air cargo facilities at IAD is dependent upon the Authority (1) determining whether to expand the existing site to meet long-term requirements or develop a new site, and (2) determining how and when to relocate all cargo facilities or a portion of the facilities if a new site is developed.
The Authority continues to evaluate relocation and configuration options for long-term cargo development as well as highest and best use opportunities for the NAA. If the long-term plan for cargo includes a new cargo site, the Airport Support Zone has been identified as the best option for that development.
2. Cargo Facility Inventory 2.1 Cargo Operations Overview Air cargo service at IAD consists of domestic and international freight. Domestic shipments are carried by the passenger airlines using the lower deck, or belly hold compartment, of the aircraft and by all-cargo airlines using freighter or all-cargo aircraft. International shipments are primarily carried by the scheduled passenger airlines using the belly hold compartment and by nonscheduled all-cargo airlines. Exhibit 2-1 indicates the typical process for cargo operations. Outbound cargo is brought to the Airport cargo facility via the landside roadway network in bulk-loaded trucks or prepackaged containers. Cargo is processed in the facility (security and U.S. Customs checking, documentation, etc.) and sorted by destination. Containers, pallets, or baggage carts are built up or loaded, and held until the appropriate departure time. Belly cargo is transported via tug and cart/container to the passenger aircraft parking areas; cargo carried by all-cargo aircraft is loaded onto the aircraft at aircraft parking positions adjacent to the cargo facility.
Inbound cargo is unloaded from the aircraft and transported via tug and cart/container to the cargo facilities where containers and pallets are either stored or broken down and held for customer pick-up or transported to offsite facilities for processing/handling.
2.1.1 Material Handling, Staging, and Storage Material handling is defined as the movement of product from the originating cargo facility to the destination cargo facility. Generally, the transport of product involves multimodal operations, including aircraft, road, and/or rail components. The cargo buildings at IAD were designed to accommodate aircraft and ground service equipment (GSE) operations on the airside and truck or personal vehicle operations on the landside. There is currently no rail access at IAD for material delivery or receipt.
2.1.2 Landside Operation Cargo is consolidated in prefabricated deck containers made specifically for the aircraft or in bulk freight packages assembled on a forklift-compatible palette in the cargo facility or forwarding operator’s warehouse. (Cargo on bulk-loaded narrowbody aircraft is typically transported airside on bag carts or dollies.) The latter is transported to the warehouse via truck from the shipper and accepted into the cargo facility across a landside receiving dock. Smaller packages are received at the customer desk or at the docks, and then sorted, screened, and consolidated in the cargo warehouse. Cargo screening at IAD takes place in the operator’s facility through coordination with U.S. Customs and Border Protection and the Transportation Security Administration.

Washington Dulles International Airport
Cargo Area Study 3 January 2010
Exhibit 2-1 Air Cargo Terminal Material Handling Flow Chart
Source: IATA Airport Development Reference Manual, 9th Edition, 2007. Prepared by: Ricondo & Associates, Inc., 2007.

Washington Dulles International Airport
Cargo Area Study 4 January 2010
THIS PAGE LEFT INTENTIONALLY BLANK

Washington Dulles International Airport
Cargo Area Study 5 January 2010
2.1.3 Airside Operations All cargo received at IAD arrives via commercial passenger aircraft or dedicated transport aircraft used for express shipping, such as aircraft used by FedEx and United Parcel Service (UPS). Cargo on passenger aircraft is received at the passenger aircraft gate or parking position and transported to the cargo warehouse facility via the airside vehicle service roads. The majority of cargo service at IAD uses this method. In some instances, this cargo is transported through third-party contracts. These third-party operators only require access to airside circulation routes for receipt of material from, and delivery of material to, the passenger aircraft parking positions.
A limited number of current cargo carriers (primarily express and non-scheduled freight carriers) at IAD require direct apron access to their cargo facilities for aircraft parking and material exchange. Because of specific demand, volume, or time constraints for express transport operations, loading and unloading of material is required to be directly adjacent to the cargo facility.
Currently, no dedicated scheduled freighter (non-express) operations are accommodated at IAD. However, the Authority has indicated a desire to market capacity at IAD for consolidated freight operations. Dedicated freight operations require direct access to the aircraft apron parking area adjacent to the cargo facilities.
2.2 Existing Facilities Overview As illustrated on Exhibit 2-2, the existing cargo area at IAD is located within the main campus on the north side of the Airport and consists of six buildings. They occupy the majority of this area between Taxiway Z and Autopilot Drive, northwest of the Saarinen terminal facilities. Initial construction of the cargo area was completed in 1962 and included Cargo Buildings 1 through 4 with intent to expand to the north as necessary. Building 5 was constructed in 1993 and the first phase of Building 6 was constructed in 1996. A second phase of Building 6 was completed in 2000. Additional construction phases to extend cargo facilities to the north and east are included in the Airport’s long range plan.
2.3 Facilities Inventory An inventory of cargo areas at IAD was completed through site visits and a review of existing documentation. Subsequently, a survey of current cargo facility tenants was conducted through a series of interviews and a written questionnaire. A summary of the interview sessions and questionnaire results is provided in Appendix A at the end of this document.
2.3.1 Cargo Buildings 1 through 4 Cargo Buildings 1 through 4 were constructed in 1962. These facilities were designed as part of the original campus at IAD under the Saarinen Master Plan to accommodate low volume, low automation cargo operations. Table 2-1 provides a summary of the tenants, use, and total space in these cargo buildings. As shown, most of the space and loading bays in Cargo Buildings 1 through 4 is being used. Loading bays and landside site access were constructed for vehicles ranging from 35 feet to 45 feet in length. Airside ramp access and area were intended for low volume cargo distribution and can not accommodate current space demands for GSE, large cargo containers, and large aircraft equipment. These existing facilities no longer meet the requirements for large, high volume cargo operations at IAD and are limited to small tenant operations or non-cargo activity. Exhibit 2-3 illustrates the site and building orientations for Cargo Buildings 1 through 4.

Washington Dulles International Airport
Cargo Area Study 6 January 2010
Table 2-1 Tenants of Cargo Buildings 1 through 4
Tenant Use Bay #. Total Bays Building Area (square feet)
Airside Area (square feet)
Cargo Building 1 36 25,349 Bell Atlantic n/a 1 1 700 Delta Air Lines - GSE Ground Service 2-6 5 3,670 Dulles Duty Free n/a 7-13 7 5,102 DHL Cargo Operations 14-20 7 5,102 USPS Cargo Operations 22-25 4 2,537 2,500 SOU Storage Storage 26-30 5 3,629 3,100 TugTech (SW GSE maint.) Ground Service 31-33 3 2,209 1,850 JetBlue Airways n/a 34-36 3 2,189 Total Occupied 35 25,138 7,450
Cargo Building 2 25 27,882 American Airlines n/a 37-40 4 2,975 2,500 JetBlue Airways n/a 41-44 4 3,100 UPS Cargo Operations 45-50 6 4,650 John S. Connor n/a 51-54 4 3,100 UPS Supply Chain n/a 55-59 5 4,585 Delta -Global Services Cargo Operations 60-71 12 9,347 Total Occupied 35 27,757 2,500
Cargo Building 3 44 32,668 Northwest Airlines n/a 72-75 4 2,700 Worldwide Flight Svc Cargo Operations 76-79 4 3,000 2,500 Swissport Fueling Inc Ground Service 80-81 2 1,500 1,250 Continental n/a 82-85 4 3,000 2,500 Gate Gourmet Ground Service 86-89 4 3,000 2,500 Vision Airlines n/a 90-91 2 1,468 1,250 MWAA Pipefitters MWAA 92-93 2 1,500 MWAA Pipefitters MWAA 94-97 4 3,000 British Airways n/a 98-115 18 13,500 Total Occupied 44 32,668 10,000
Cargo Building 4 35 32,632 AIRSCHOTT n/a 116-119 3 3,000 Swissport Cargo Cargo Operations 120-141 22 16,155 Swissport Cargo Cargo Operations 142-145 4 3,000 Vacant n/a 146-151 6 4,500 Total Occupied 29 22,155 0
Source: Metropolitan Washington Airports Authority, 2006. Prepared by: Ricondo & Associates, Inc., 2007.

June 2009Cargo Area Study
Exhibit 2-2
Exisitng AOA
Taxilane Y4
Taxilane Y2
Taxilane Z3
Main Terminal
Daily Garage
DailyGarage
HotelGMR
BLD
G 6
BLD
G 5
BLD
G 3
- 4
BLD
G 1
- 2
Future Building 6Expansion
Taxi
way
Y
Taxi
way
Z
January 2010

Washington Dulles International Airport
Cargo Area Study 8 January 2010
THIS PAGE LEFT INTENTIONALLY BLANK

Washington Dulles International Airport
Cargo Area Study June 2009
north0
Exhibit 2-3
150 ft.
Source: Ricondo & Associates, Inc., April 2008Prepared by: Ricondo & Associates, Inc. April 2008
Existing Cargo Facilities 1-3
Existing Cargo Building
Loading Dock Area
Parking Area
Apron Area
Exisitng AOA
Taxilane Y4
Taxilane Z3
Daily Garage
BLD
G 3
- 4
BLD
G 1
- 2
Taxi
way
Z
Apron:21,430 S.Y.
Apron:12,500 S.Y.
Existing Cargo Facilities 1-4
January 2010

Washington Dulles International Airport
Cargo Area Study 10 January 2010
THIS PAGE LEFT INTENTIONALLY BLANK

Washington Dulles International Airport
Cargo Area Study 11 January 2010
2.3.2 Cargo Buildings 5 and 6 Cargo Building 5 became operational in 1993 and is currently owned by Cargo IAD, LLC. Ownership of the building will return to the Authority in 2017. Cargo Building 6 was completed in 1996 and was expanded in 2000. Additional phases to extend Cargo Building 6 to the north are included in the Airport’s long range plan. Table 2-2 provides a summary of the tenants, use, and total space in these cargo buildings. As shown, most of the space and loading bays in Buildings 5 and 6 is being used.
These facilities were designed to accommodate widebody aircraft and large-volume cargo operations, including ramp storage area for full-sized tractor trailers, modern cargo loading devices, and GSE. Additionally, Cargo Buildings 5 and 6 were designed with mezzanine office areas to maximize the ground level area in the building for cargo and staging operations. Exhibit 2-4 illustrates the operations area and building orientation for Cargo Buildings 5 and 6.
2.3.3 Future Cargo Buildings Current Airport long range plans for additional cargo facilities at IAD include new Cargo Buildings 7 and 8 to be developed directly east of existing Cargo Building 6. These buildings would not have direct adjacency to the airfield infrastructure and, therefore, no aircraft apron area.
2.4 Comparative Analysis and Benchmarking Cargo areas at several other U.S. airports were analyzed for characteristics similar to those at IAD, including primary cargo landside access related to passenger terminal landside access, volume of cargo activity1 per area of cargo facility, and centralized versus multiple cargo area locations. The following summarizes the results of this analysis.
2.4.1 Miami International Airport The primary cargo area at Miami International Airport (MIA) is located on the west side of the airport with landside access from the south and west and separate from passenger terminal landside access. Limited facilities are located on the north side of the airport. Cargo facilities for hubbing carrier American Airlines (and other belly cargo carriers) are located west of the terminal area and are accessed through a tunnel under Runway 12-30 and associated taxiways. West bound all-cargo aircraft departures require a runway crossing. Total cargo building space at Miami International Airport totals 3,488,5492 square feet. Approximately 1,762 square feet of enclosed cargo space is provided per 1,000 annual tons of cargo handled at MIA. Exhibit 2-5 illustrates the cargo facilities at MIA.
1 Cargo activity volumes are 2008 year-end totals obtained from http://aci-na.org/stats/stats_traffic. 2 http://www.miami-airport.com/html/facilities.html.

Washington Dulles International Airport
Cargo Area Study 12 January 2010
Table 2-2 Tenants of Cargo Buildings 5 and 6
Tenant Use Bay # Total Bays Building Area (square feet)
Airside Area (square feet)
Cargo Building 5 90 284,383 FedEx Cargo Operations 1-30 30 99,511 Vacant n/a 31-36 6 19,253 U.S. Customs n/a 37-40 4 4,323 United Airlines n/a 560 WorldWide Flight Cargo Operations 41-44 4 12,350 United Airlines n/a 45-60 16 52,966 Air France Cargo Operations 61-68 8 20,900 United Airlines n/a 69-90 22 61,605 Express Air Freight Office mezzanine 1,170 All Nippon Office mezzanine 1,000 FAA Office mezzanine 4,500 Masterpiece International Office mezzanine 1,250 USDA/US Customs Office mezzanine 4,450 Total 90 283,838 0 Cargo Building 6 42 91,254 United Airlines Cargo Operations 1-5 5 16,720 6,250 WorldWide/Virgin Cargo Operations 6-15 10 22,775 8,750 Evergreen n/a 16-18 3 6,558 2,500 Lufthansa Cargo Cargo Operations 19-23 5 10,569 3,750 CAS Cargo Operations 24-32 9 23,625 8,750 Lufthansa Cargo Cargo Operations 33-42 10 29,100 10,000 United Airlines Office mezz-Ph1 2,100 Vacant n/a mezz-Ph2 8,089 Vacant n/a mezz-Ph2 362 Air Logistics Group Office mezz-Ph2 558 All Freight Office mezz-Ph2 375 Superior Aircraft Office mezz-Ph2 126 DNL Office mezz-Ph2 191 OceanAir Office mezz-Ph2 191 Fish & Wild Life Office mezz-Ph2 388 Evergreen Office mezz-Ph2 832 Vacant n/a mezz-Ph3 2,000 Vacant n/a mezz-Ph3 6,509 Total 42 131,068 40,000
Source: Metropolitan Washington Airports Authority, 2006. Prepared by: Ricondo & Associates, Inc., 2007.

Washington Dulles International Airport
Cargo Area Study June 2009
north0
Exhibit 2-4Source: Ricondo & Associates, Inc., April 2008Prepared by: Ricondo & Associates, Inc., April 2008
150 ft.Existing Cargo Facilities 4-6
Existing Cargo Building
Loading Dock Area
Parking Area
Apron Area Exisitng AOA
Taxilane Y2
GMR
BLD
G 6
BLD
G 5
Apron:26,788 S.Y.
Cargo Building 6 Expansion
Existing Cargo Facilities 5-6
January 2010

Washington Dulles International Airport
Cargo Area Study 14 January 2010
THIS PAGE LEFT INTENTIONALLY BLANK

Washington Dulles International Airport
Source: Ricondo & Associates, Inc., Prepared by: Ricondo & Associates, Inc.,
Cargo Area Study
Location_of_fi le.pdf
June 2009
0
north
Exhibit 2-5Source: Ricondo & Associates, Inc., April 2008Prepared by: Ricondo & Associates, Inc., April 2008
150 ft.
Washington Dulles International Airport
Existing Cargo Building
Main Terminal
836
948
959
0
northExisting Cargo Facilities Area
Miami International Airport
January 2010

Washington Dulles International Airport
Cargo Area Study 16 January 2010
THIS PAGE LEFT INTENTIONALLY BLANK

Washington Dulles International Airport
Cargo Area Study 17 January 2010
2.4.2 Hartsfield-Jackson Atlanta International Airport There are three main air cargo complexes at Hartsfield-Jackson Atlanta International Airport (ATL): the North Cargo Complex, the Midfield Belly Freight Complex, and the South Cargo Complex. The total on-airport air cargo warehouse space consists of 2 million3 square feet. Each complex offers excellent dockside access to Interstate highways 75, 85, 285 and 20. The North Cargo Complex is located on the north and northeast side of the airport with landside access from the northeast and separate from passenger terminal landside access. Runway crossings are required for cargo aircraft operating from the North Cargo Complex that do not use the northernmost runway. Airside access to the passenger terminal aircraft parking positions for belly freight from the North Cargo Complex requires driving around the north side runways. The Midfield Belly Freight Complex provides service for hubbing carrier Delta Air Lines and is located to the east of the International Concourse with landside access from the east, separate from passenger terminal landside access. The South Cargo Complex is located between Runways 9R-27L and 10-28 with landside access from the east and west via a tunnel under Taxiways SC and SJ. Approximately 3,053 square feet of enclosed cargo space is provided per 1,000 annual tons of cargo handled at ATL. Exhibit 2-6 illustrates the cargo facilities at ATL.
2.4.3 San Francisco International Airport San Francisco International Airport (SFO) has approximately 989,0004 square feet of warehouse and office space located at 11 cargo facilities. The primary cargo area is located on the southwest side of the airport with landside access from the south and west and somewhat separate from passenger terminal landside access (access from the south and west can follow the same routes as passenger traffic until just after entering the airport). Limited cargo facilities are also located on the north and southwest sides of the airport. Cargo facilities for hubbing carrier United Airlines (and other belly cargo) do not require runway crossings from the passenger concourse areas. All-cargo aircraft have generally the same airfield access as passenger aircraft. Approximately 2,031 square feet of enclosed cargo space is provided per 1,000 annual tons of cargo handled at SFO. Exhibit 2-7 illustrates the cargo facilities at SFO.
2.4.4 Chicago O’Hare International Airport Cargo building space at Chicago O’Hare International Airport (ORD) is located in numerous building and totals 2,979,7005 square feet. The primary cargo buildings are located on the southwest side of the airport with landside access from the southwest and separate from passenger terminal landside access. Cargo facilities for hubbing carrier United Airlines (and other belly cargo) are accessed via a tunnel from the passenger concourse areas. All-cargo aircraft have generally the same airfield access as passenger aircraft. Approximately 2,250 square feet of enclosed cargo space is provided per 1,000 annual tons of cargo handled at ORD. Exhibit 2-8 illustrates the cargo facilities at ORD.
Table 2-3 provides a comparison summary of cargo facilities at these four airports and at IAD. The total space available at each airport indicates that the cargo tonnage passing through IAD is comparable to that at the other airports listed with the exception of ORD. A significant item of note
3 http://www.atlanta-airport.com/Airport/AirCargo/. 4 http://www.flysfo.com/web/page/about/b2b/cargo/index.html 5 City of Chicago Department of Aviation, Chicago O’Hare International Airport Master Plan, February 2004, p.
II-80.

Washington Dulles International Airport
Cargo Area Study 18 January 2010
is the square feet per ton ratio for IAD. The ratio of 1.41 square feet of cargo space per ton of cargo handled indicates that the cargo facilities at IAD are highly efficient compared to the operations at the other airports listed in the table.
Table 2-3 Cargo Facilities Comparison Matrix
Airport Structures1/ Building Area (square feet) 2/ Total Acreage1/ Annual Tonnage3/
Square Feet per Ton of
Cargo IAD 6 540,000 68 382,943 1.41 ATL 5 2,000,000 68 994,346 2.01 SFO 12 989,000 137 379,500 2.61 ORD 10 2,979,700 187 498,222 5.98 MIA 15 3,488,549 264 386,058 9.04
Notes: 1/ Totals from Airport Layout Plans 2/ Totals from websites of individual airports 3/ Totals from Airports Council International-North America statistical data for 2008.
Source: See table notes above. Prepared by: Ricondo & Associates, Inc., 2009.

Cargo Area Study June 2009
0
north
Source: Ricondo & Associates, Inc., April 2008Prepared by: Ricondo & Associates, Inc., April 2008 Exhibit 2-6
N.T.S. Existing Cargo FacilitiesHartsfi eld-Jackson Atlanta International Airport
Existing Cargo Building
Main Terminal
85
285
75
Washington Dulles International Airport
January 2010

Washington Dulles International Airport
Cargo Area Study 20 January 2010
THIS PAGE LEFT INTENTIONALLY BLANK

Cargo Area Study June 2009
0
north
Source: Ricondo & Associates, Inc., April 2008Prepared by: Ricondo & Associates, Inc., April 2008 Exhibit 2-7
N.T.S. Existing Cargo FacilitiesSan Francisco International Airport
Existing Cargo Building
Main Terminal
101
101
Washington Dulles International Airport
January 2010

Washington Dulles International Airport
Cargo Area Study 22 January 2010
THIS PAGE LEFT INTENTIONALLY BLANK

Washington Dulles International Airport
Cargo Area Study June 2009
Source: Ricondo & Associates, Inc.; Martinez Corp. Aerial Photography (Nov. 2001)Department of Aviation Airport Management and RecordsPrepared by: Ricondo & Associates, Inc., December 2008
Existing Cargo FacilitiesChicago O’Hare International Airport
Exhibit 2-8
January 2010

Washington Dulles International Airport
Cargo Area Study 24 January 2010
THIS PAGE LEFT INTENTIONALLY BLANK

Washington Dulles International Airport
Cargo Area Study 25 January 2010
3. Historical and Forecast Air Cargo 3.1 Historical Cargo Activity Table 3-1 lists the annual weight of domestic and international freight and mail shipped inbound and outbound from IAD between 1990 and 2006. Overall freight (excluding mail) increased significantly between 1990 and 2000. Between 2000 and 2006 freight activity at IAD fluctuated, reaching a historical peak of approximately 746 million pounds in 2006. The weight of mail shipments peaked in 1999; however, the terrorist attacks in 2001 and changes in United States Postal Service contracting led to a significant decrease through 2006 to approximately 27 million pounds of total mail, with international mail representing nearly 50 percent of the total. As mail represented only about 3.5 percent of overall cargo activity at the Airport in 2006, the forecast presented in this report concentrates on freight activity only.
Table 3-1 Historical Cargo Activity at IAD, 1990 to 2006 (in thousands of pounds)
Freight Mail Year Domestic International Total Domestic International Total 1990 209,539 86,353 295,892 71,625 18,053 89,678 1991 208,548 71,820 280,368 65,909 14,965 80,874 1992 244,115 91,712 335,827 77,826 19,482 97,308 1993 299,233 124,375 423,608 86,500 19,511 106,011 1994 341,216 165,583 506,799 84,863 18,175 103,038 1995 362,174 167,190 529,364 98,625 15,707 114,332 1996 378,415 181,131 559,546 106,724 15,650 122,374 1997 416,473 228,464 644,937 108,593 18,811 127,404 1998 427,881 223,940 651,821 111,339 18,493 129,832 1999 415,212 232,192 647,404 122,788 21,770 144,558 2000 416,762 292,557 709,319 114,585 22,490 137,075 2001 375,225 260,244 635,469 75,328 18,870 94,198 2002 386,889 283,438 670,327 26,793 19,223 46,016 2003 329,480 260,396 589,876 24,486 14,839 39,325 2004 339,705 313,633 653,338 22,962 8,742 31,704 2005 319,339 371,639 690,978 22,496 8,667 31,163 2006 324,806 421,146 745,952 14,563 12,855 27,418
Source: Metropolitan Washington Airports Authority, 2007. Prepared by: Ricondo & Associates, Inc., 2009.
Exhibit 3-1 charts the growth in domestic and international freight at IAD from 1990 through 2006. Total increases were primarily driven by steady growth in international freight, while domestic freight peaked in the late 1990s, followed by slow overall decline. Between 1990 and 2006, the average annual growth rates were 2.8 percent for domestic freight, 10.4 percent for international freight, and 5.9 percent growth overall.
Domestic cargo is carried 30 percent on passenger aircraft (belly cargo) and 70 percent on all-cargo aircraft (primarily express traffic). International cargo is carried 99 percent on passenger aircraft and 1 percent on nonscheduled all-cargo aircraft.

Washington Dulles International Airport
Cargo Area Study 26 January 2010
Exhibit 3-1 IAD Historical Freight Activity 1990 to 2006
0
100,000
200,000
300,000
400,000
500,000
600,000700,000
800,000
1990 1992 1994 1996 1998 2000 2002 2004 2006
Years
Poun
ds
Total
International
Domestic
Source: Metropolitan Washington Airports Authority, 2006. Prepared by: Ricondo & Associates, Inc., December 2008.
3.2 Cargo Forecasts The significant changes in cargo activity at IAD since 2000, especially in domestic freight, make traditional forecasting methods based on location or regional socioeconomic data less reliable. A regression analysis was calculated based on the gross regional product for the metropolitan region of the historical growth from 1990. Results showed a relatively poor fit with an R2 measure of 0.29. A regression analysis was also conducted based on the historical trend lines shown on Exhibit 3-1, which resulted in a higher R2 of 0.99. The trend line method was selected for forecast development in this study.
For the forecasts, it was assumed that all airlines currently serving the Airport would maintain their current market shares of domestic and international freight.
3.3 Freight Forecast Results Table 3-2 and Exhibit 3-2 summarize the freight forecasts for 2006 through 2030. Total freight is forecast to increase from approximately 7.5 million pounds in 2006 to approximately 1.8 billion pounds (combined inbound and outbound) in 2030. Domestic freight is forecast to be less than double its 2006 total in 2030 (increasing from 3.2 million pounds to 5.5 million pounds), while international freight is forecast to almost triple between 2006 and 2030 (increasing from 4.2 million pounds to 1.2 billion pounds). The domestic to international ratio of freight handled changes from 44:56 in 2006 to 31:69 in 2030 in response to the higher international growth rates.

Washington Dulles International Airport
Cargo Area Study 27 January 2010
Table 3-2 Forecast of Freight Activity at the Airport
Total Freight (pounds, in thousands) Year Domestic International Total
Pounds % of Total Pounds
% of Total Pounds
2006 324,806 44% 421,346 56% 746,152 2010 355,040 41% 502,078 59% 857,118 2015 396,820 39% 625,083 61% 1,021,903 2020 443,517 36% 778,221 64% 1,221,739
2025 495,709 34% 968,878 66% 1,464,587 2030 554,043 31% 1,206,243 69% 1,760,286
Compound Annual Growth Rate
2006-2010 2%
[2.2%] 4% [4.5%] 4% [3.5%]
2010-2020 2%
[2.2%] 4% [4.5%] 4% [3.6%]
2006-2030 2%
[2.2%] 4% [4.5%] 4% [3.6%]
Source: Metropolitan Washington Airports Authority, 2007. Prepared by: Ricondo & Associates, Inc., 2009.
Exhibit 3-2 Forecast of Freight Activity at the Airport
0
200,000
400,000
600,000
800,000
1,000,000
1,200,000
1,400,000
1,600,000
1,800,000
2,000,000
1990 1995 2000 2005 2010 2015 2020 2025 2030Years
Poun
ds
CAGR: 4.6%
CAGR: 6.8%
CAGR: 2.5%
Total
International
Domestic
Source: Metropolitan Washington Airports Authority, 2006 Prepared by: Ricondo & Associates, Inc., December 2008.
Washington Dulles International Airport
Cargo Area Study 28 January 2010
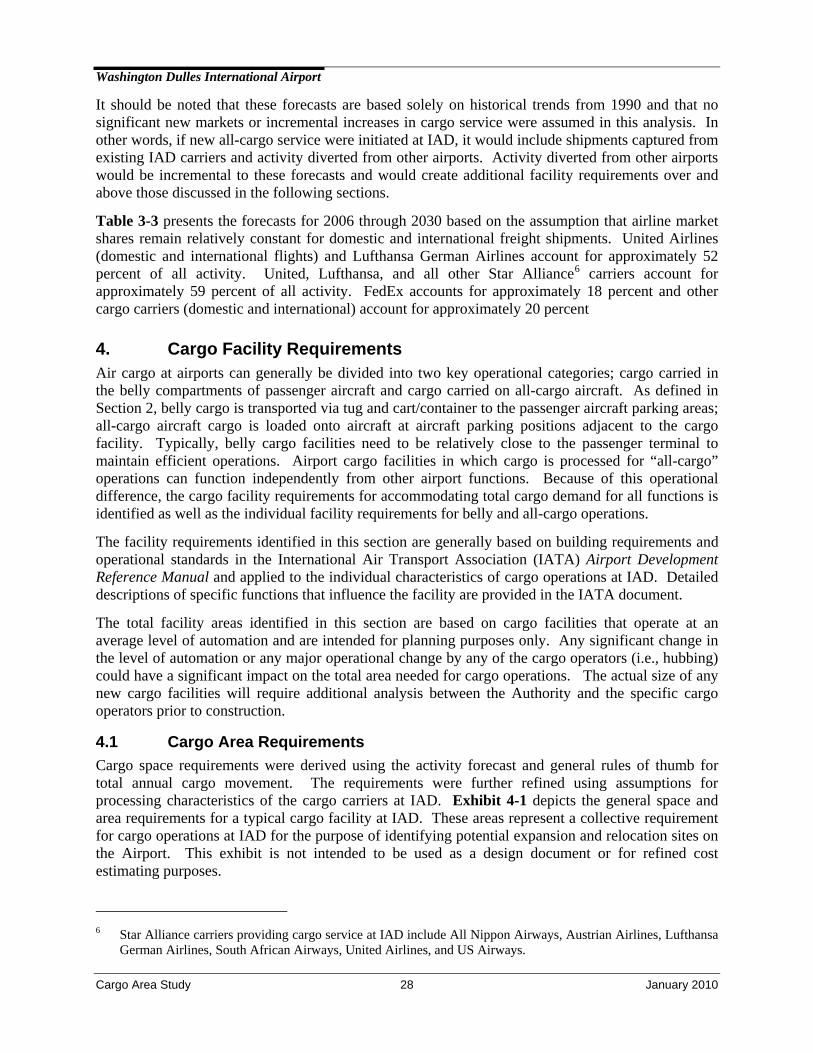
It should be noted that these forecasts are based solely on historical trends from 1990 and that no significant new markets or incremental increases in cargo service were assumed in this analysis. In other words, if new all-cargo service were initiated at IAD, it would include shipments captured from existing IAD carriers and activity diverted from other airports. Activity diverted from other airports would be incremental to these forecasts and would create additional facility requirements over and above those discussed in the following sections.
Table 3-3 presents the forecasts for 2006 through 2030 based on the assumption that airline market shares remain relatively constant for domestic and international freight shipments. United Airlines (domestic and international flights) and Lufthansa German Airlines account for approximately 52 percent of all activity. United, Lufthansa, and all other Star Alliance6 carriers account for approximately 59 percent of all activity. FedEx accounts for approximately 18 percent and other cargo carriers (domestic and international) account for approximately 20 percent
4. Cargo Facility Requirements Air cargo at airports can generally be divided into two key operational categories; cargo carried in the belly compartments of passenger aircraft and cargo carried on all-cargo aircraft. As defined in Section 2, belly cargo is transported via tug and cart/container to the passenger aircraft parking areas; all-cargo aircraft cargo is loaded onto aircraft at aircraft parking positions adjacent to the cargo facility. Typically, belly cargo facilities need to be relatively close to the passenger terminal to maintain efficient operations. Airport cargo facilities in which cargo is processed for “all-cargo” operations can function independently from other airport functions. Because of this operational difference, the cargo facility requirements for accommodating total cargo demand for all functions is identified as well as the individual facility requirements for belly and all-cargo operations.
The facility requirements identified in this section are generally based on building requirements and operational standards in the International Air Transport Association (IATA) Airport Development Reference Manual and applied to the individual characteristics of cargo operations at IAD. Detailed descriptions of specific functions that influence the facility are provided in the IATA document.
The total facility areas identified in this section are based on cargo facilities that operate at an average level of automation and are intended for planning purposes only. Any significant change in the level of automation or any major operational change by any of the cargo operators (i.e., hubbing) could have a significant impact on the total area needed for cargo operations. The actual size of any new cargo facilities will require additional analysis between the Authority and the specific cargo operators prior to construction.
4.1 Cargo Area Requirements Cargo space requirements were derived using the activity forecast and general rules of thumb for total annual cargo movement. The requirements were further refined using assumptions for processing characteristics of the cargo carriers at IAD. Exhibit 4-1 depicts the general space and area requirements for a typical cargo facility at IAD. These areas represent a collective requirement for cargo operations at IAD for the purpose of identifying potential expansion and relocation sites on the Airport. This exhibit is not intended to be used as a design document or for refined cost estimating purposes.
6 Star Alliance carriers providing cargo service at IAD include All Nippon Airways, Austrian Airlines, Lufthansa
German Airlines, South African Airways, United Airlines, and US Airways.

Washington Dulles International Airport
Cargo Area Study 29 January 2010
Table 3-3 Forecast Freight Activity at IAD by Airline (in pounds)
Carrier Mode 2006 2010 2015 2020 2025 2030 Percent of Total
United (Int'l) Belly (I) 219,549 261,616 325,709 405,505 504,849 628,532 35.707% FedEx All-Cargo (D) 181,705 198,618 221,991 248,115 277,312 309,946 17.608% United (Dom) Belly (D) 85,965 93,967 105,025 117,384 131,197 146,636 8.330% Lufthansa Belly (I) 49,826 59,372 73,918 92,027 114,573 142,642 8.104% British Airways Belly (I) 29,982 35,726 44,479 55,376 68,942 85,832 4.876% All Nippon Belly (I) 24,138 28,763 35,810 44,583 55,506 69,104 3.926% Air France Belly (I) 23,978 28,572 35,572 44,287 55,137 68,644 3.900% SAS Belly (I) 16,196 19,300 24,028 29,915 37,243 46,368 2.634% Virgin Atlantic Belly (I) 15,503 18,474 23,000 28,635 35,650 44,384 2.521% Airborne All-Cargo (D) 24,435 26,710 29,853 33,366 37,293 41,681 2.368% Austrian Belly (I) 13,556 16,154 20,111 25,039 31,173 38,810 2.205% UPS All-Cargo (D) 22,348 24,428 27,302 30,515 34,106 38,120 2.166% KLM Royal Dutch Belly (I) 11,660 13,894 17,298 21,536 26,812 33,381 1.896% South African Belly (I) 5,568 6,635 8,261 10,284 12,804 15,941 0.906% Alitalia Belly (I) 3,551 4,231 5,268 6,558 8,165 10,165 0.577% Continental Belly (D) 4,134 4,519 5,050 5,645 6,309 7,051 0.401% GAF All-Cargo (I) 1,989 2,370 2,950 3,673 4,573 5,694 0.323% Korean Air Belly (I) 1,956 2,331 2,902 3,612 4,497 5,599 0.318% American Belly (D) 2,009 2,196 2,454 2,743 3,065 3,426 0.195% TACA Int'l Belly (I) 1,087 1,295 1,612 2,007 2,499 3,111 0.177% Delta Belly (D) 1,747 1,909 2,134 2,385 2,666 2,980 0.169% New Carriers Various 1,225 1,408 1,678 2,006 2,405 2,891 0.164% Saudi Arabian Belly (I) 961 1,146 1,426 1,776 2,211 2,752 0.156% US Airways Belly (D) 702 767 857 958 1,071 1,197 0.068% Northwest Belly (D) 581 635 710 793 886 991 0.056% Ethiopian Belly (I) 238 283 352 439 546 680 0.039% Southwest Belly (D) 394 430 481 538 601 672 0.038% Aeroflot Belly (I) 202 241 300 374 465 579 0.033% Volga-Nepre All-Cargo (I) 169 202 251 313 390 485 0.028% Evergreen Int'l All-Cargo (I) 152 181 225 280 349 435 0.025% Antonov All-Cargo (I) 123 147 183 228 283 353 0.020% BWIA West Indies Belly (I) 88 105 131 163 202 252 0.014% Air Transport Int'l All-Cargo (I) 86 102 127 158 197 246 0.014% Alaska Belly (D) 110 120 134 150 168 188 0.011% Murray Air All-Cargo (D) 97 106 118 132 148 165 0.009% RAF All-Cargo (I) 29 34 42 53 66 82 0.005% PSA Belly (D) 42 46 51 57 64 71 0.004% Polet All-Cargo (I) 24 29 36 45 56 69 0.004% Pinnacle Belly (D) 15 17 19 21 24 26 0.001% Airtran Belly (D) 11 12 13 15 17 19 0.001% Mountain Air All-Cargo (D) 9 10 11 12 13 15 0.001% Sun Country All-Cargo (D) 9 10 11 12 13 15 0.001% JetBlue Belly (D) 4 5 5 6 7 8 0.000%
Totals 746,152 857,114 1,021,892 1,221,718 1,464,554 1,760,237 100.000% Cargo Mode Split Belly (I) 418,040 498,138 620,177 772,115 961,275 1,196,777 67.990% All-Cargo (D) 228,602 249,881 279,286 312,152 348,886 389,942 22.153% Belly (D) 95,713 104,623 116,934 130,695 146,075 163,264 9.275% All-Cargo (I) 2,572 3,065 3,815 4,750 5,914 7,363 0.418% New Carriers 1,225 1,408 1,678 2,006 2,405 2,891 0.164% 1/ Belly = cargo carried in the belly hold of passenger aircraft; All-Cargo = cargo carried on all-cargo aircraft. 2/ (D) = Domestic, (I) = International. 3/ Forecast based on 1990-2006 trend line compounded annually from 2006 4/ Airline market shares held constant for international service and for domestic service. 5/ Mail volumes were deducted from the totals 6/ Difference between airline freight totals and total Airport summary totals allocated to “New Carriers”.
Source: Metropolitan Washington Airports Authority, 2007. Prepared by: Ricondo & Associates, Inc., 2009.

Washington Dulles International Airport
Cargo Area Study 30 January 2010
THIS PAGE LEFT INTENTIONALLY BLANK

Washington Dulles International Airport
Cargo Area Study June 2009
Source: Ricondo & Associates, Inc., April 2008Prepared by: Ricondo & Associates, Inc., April 2008 Exhibit 4-1
0 Programmed IAD Cargo Building/Apron Plan
25’ Service Road (SVR)
25’ Cargo Road
250’ ADG V Depth of Stand
250’Cargo Building Depth
115’ Bidirectional RDWY /Tractor Trailer maneuvering
72’Tractor Trailer Pull-through,Parking, and Staging Lanes
138’ ADG V Taxilane CL to SVR
Cargo Terminal100’ Staging Area
Parking Area
Tractor Trailer Parking
Loading Dock
Apron/Pavement Area
N.T.S.
January 2010

Washington Dulles International Airport
Cargo Area Study 32 January 2010
THIS PAGE LEFT INTENTIONALLY BLANK

Washington Dulles International Airport
Cargo Area Study 33 January 2010
The cargo requirements for building areas, apron areas, and total acreage are discussed in the following sections. The building area analysis includes a composite projection for all types of cargo and a differentiation between belly cargo and all-cargo operations.
4.2 Cargo Building Areas The cargo building includes, but is not limited to, receiving docks, customer service desks, parking, material handing and staging areas, varying amounts and types of material storage areas, offices, and equipment storage and maintenance areas. The requirement for each area will vary depending on the size and type of cargo operation. Therefore, for the purposes of this study, the composite cargo building area requirement at IAD was based on total annual cargo weight and the characteristics of the belly and all-cargo operators7. Exhibit 4-2 reflects the total enclosed building areas for cargo operations at IAD based on IATA standards. The actual size of the building would depend on numerous variables, including building layout, location, automation of operation, etc. As shown, the low range building requirement starts at 214,000 square feet in 2006 (which is less than that available today), increasing to 505,500 square feet in 2030. The high building requirement range starts at 728,600 square feet in 2006, increasing to 1,718,800 square feet in 2030.
Exhibit 4-2 Composite Cargo Building Requirement Based on Level of Automation
-
200,000
400,000
600,000
800,000
1,000,000
1,200,000
1,400,000
1,600,000
1,800,000
2,000,000
2006 2008 2010 2012 2014 2016 2018 2020 2022 2024 2026 2028 2030
Year
Tota
l Squ
are
Feet
High Average Low Existing
Source: Ricondo & Associates, Inc., December 2008. Prepared by: Ricondo & Associates, Inc., December 2008.
7 Lufthansa belly cargo totals are not included in the forecasts. Lufthansa conducts its belly cargo operation
within its leased space in the passenger terminal area.
Washington Dulles International Airport
Cargo Area Study 34 January 2010
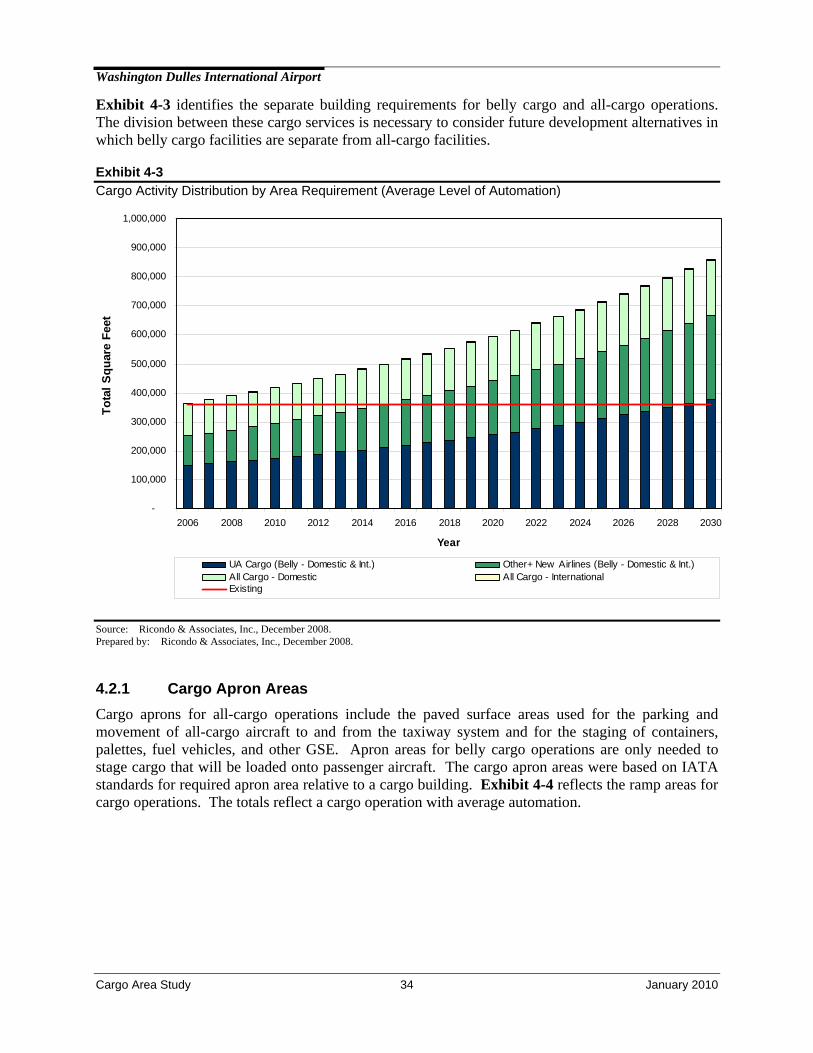
Exhibit 4-3 identifies the separate building requirements for belly cargo and all-cargo operations. The division between these cargo services is necessary to consider future development alternatives in which belly cargo facilities are separate from all-cargo facilities.
Exhibit 4-3 Cargo Activity Distribution by Area Requirement (Average Level of Automation)
-
100,000
200,000
300,000
400,000
500,000
600,000
700,000
800,000
900,000
1,000,000
2006 2008 2010 2012 2014 2016 2018 2020 2022 2024 2026 2028 2030
Year
Tota
l Squ
are
Feet
UA Cargo (Belly - Domestic & Int.) Other+ New Airlines (Belly - Domestic & Int.)All Cargo - Domestic All Cargo - InternationalExisting
Source: Ricondo & Associates, Inc., December 2008. Prepared by: Ricondo & Associates, Inc., December 2008.
4.2.1 Cargo Apron Areas Cargo aprons for all-cargo operations include the paved surface areas used for the parking and movement of all-cargo aircraft to and from the taxiway system and for the staging of containers, palettes, fuel vehicles, and other GSE. Apron areas for belly cargo operations are only needed to stage cargo that will be loaded onto passenger aircraft. The cargo apron areas were based on IATA standards for required apron area relative to a cargo building. Exhibit 4-4 reflects the ramp areas for cargo operations. The totals reflect a cargo operation with average automation.

Washington Dulles International Airport
Cargo Area Study 35 January 2010
Exhibit 4-4 Composite Staging and Apron Requirements
-
10,000
20,000
30,000
40,000
50,000
60,000
70,000
80,000
90,000
2006 2008 2010 2012 2014 2016 2018 2020 2022 2024 2026 2028 2030
Year
Tota
l Squ
are
Yard
s
Commercial Carriers - Staging Cargo Only - Staging Cargo Only - Apron Existing
Source: Ricondo & Associates, Inc., December 2008. Prepared by: Ricondo & Associates, Inc., December 2008.
4.3 Total Acreage Requirements Total acreage requirements for cargo facilities were derived by combining the building, apron, and staging requirements identified above. This total was increased by 25 percent to account for landside facilities, such as roadways, parking lots, and landscaping. Assuming a cargo facility with average automation and flexibility to add aircraft parking and apron access to each building, the land requirement for a cargo facility at IAD in 2030 is estimated to be 103 acres. Any potential long-term cargo sites to be considered should minimally meet this developable acreage requirement.
5. Development of Alternatives Conceptual alternatives to accommodate cargo requirements at IAD were developed based on the goals and objectives of the Authority, stakeholder input, and the cargo activity forecast. The process of developing the alternatives involved the following:
• Develop general siting principles
• Identify potential sites on the Airport that met these principles
• Develop a short-list of sites that are practical for development
• Develop a layout plan alternative for each short-listed site

Washington Dulles International Airport
Cargo Area Study 36 January 2010
The evaluation of the layout plans developed for each short-listed site is presented in Section 6.
5.1 Potential Cargo Sites Selection of potential cargo sites at IAD was based on a set of principles that were compiled from IATA guidelines, local cargo needs and operations and future development plans for the Airport. The following principles were developed for this study:
• Consideration of the long-term Master Plan for the Airport, respecting opportunities for passenger, cargo, and general aviation facilities expansion
• Sufficient land area for current facility requirements and future expansion
• Adjacency to existing airfield and regional access infrastructure
• Flight operation clearance standards and future airfield expansion
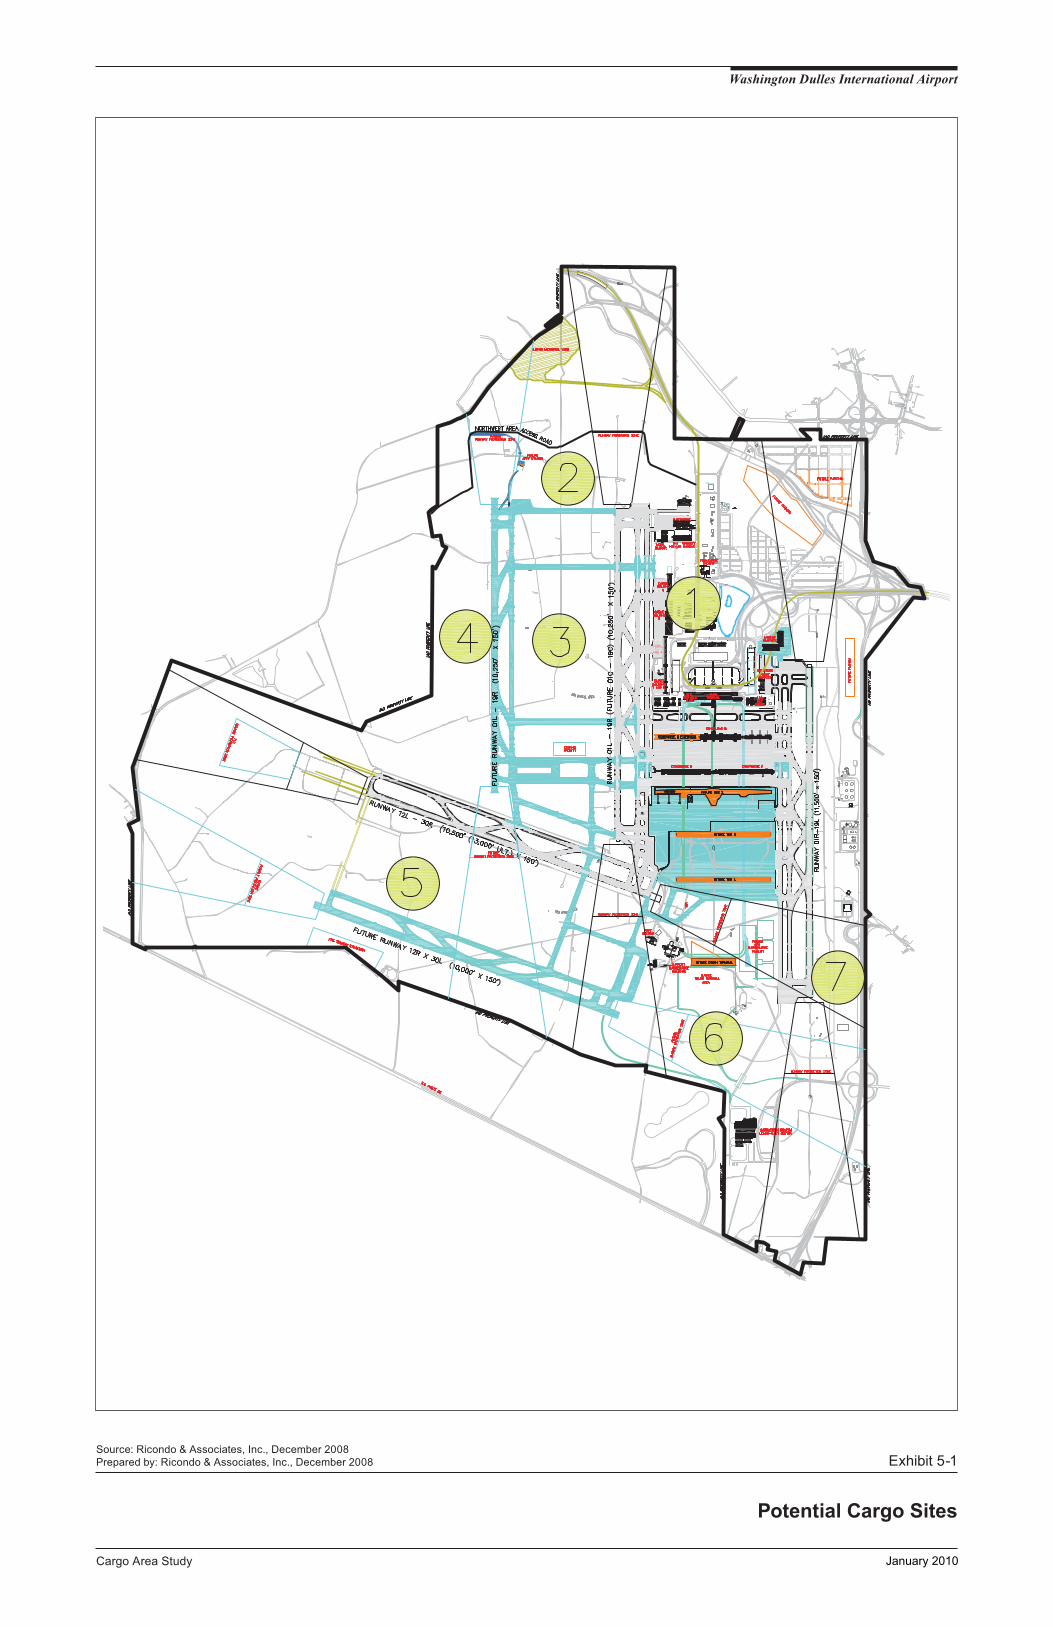
Working in collaboration with Authority staff and following the principles listed above, nine potential cargo sites were identified on the Airport. As shown on Exhibit 5-1, these sites, with the exception of the current site, are generally located in undeveloped areas on the Airport.
Of the nine sites identified, four were considered to have real potential for cargo development. These were the only four sites considered for further planning and evaluation. As shown on Exhibit 5-2, the four sites include:
• Site 1: Existing Cargo Area
• Site 2: West Midfield Area
• Site 3: Airport Support Zone Area
• Site 4: Crosswind Area
5.2 Alternative Concepts Eight alternative concepts were developed for the four short-listed sites. Two alternatives were developed for the existing cargo area (Site 1), two alternatives were developed for each of Sites 2 and 3, and one split site alternative was developed. Site 4 was deemed inappropriate for cargo consideration during initial comparative evaluations given current cargo operational characteristics and distances to existing and future infrastructure including gates, utilities and service roads. The two alternatives for Sites 2 and 3 include one with tunnel access (under the runway/taxiway system) to the passenger terminal and one with tug road access (around the runway/taxiway system) to the passenger terminal. The location and concept area layout for each site is illustrated on Exhibit 5-3. The layout configuration shown for each site is intended for area planning purposes only. Once a preferred site is identified, further concept refinement will be required based on site constraints, phasing and implementation plans and tenant usage.
It should be noted that, although there is an emerging MWAA policy to diminish non-passenger activity in the NAA, the existing cargo area was included in the planning and evaluation process for comparison purposes.
Washington Dulles International Airport
Cargo Area Study June 2009
Exhibit 5-1Source: Ricondo & Associates, Inc., December 2008Prepared by: Ricondo & Associates, Inc., December 2008
Potential Cargo Sites
January 2010

Washington Dulles International Airport
Cargo Area Study 38 January 2010
THIS PAGE LEFT INTENTIONALLY BLANK

January 2010

Washington Dulles International Airport
Cargo Area Study 40 January 2010
THIS PAGE LEFT INTENTIONALLY BLANK

Not to Scale
Washington Dulles International Airport
Source: Ricondo & Associates, Inc., June 2009.Prepared by: Ricondo & Associates, Inc., June 2009.
Cargo Area Study
north
Exhibit 5-3
June 2009
Alternative Sites
GA GA GA R
unw
ay 0
1L -
19R
Site 1 – Option 1 Site 1 – Option 2
Site 3
Site 2
Site 4 Site Split Option
Future Building 6 Expansion
GA GA GA
Build
ing 6
Build
ing 5
Future Building 6 Expansion
Build
ing 6
Build
ing 5
New Cargo Building Parking Staging Area
January 2010

Washington Dulles International Airport
Cargo Area Study 42 January 2010
THIS PAGE LEFT INTENTIONALLY BLANK

Washington Dulles International Airport
Cargo Area Study 43 January 2010
5.2.1 Site 1 – Existing Cargo Area Previous expansion plans for the existing cargo area have included building to the east of Cargo Buildings 5 and 6 into current parking lot areas. However, expanding cargo facilities into this area would be constrained by existing and future expansion of passenger terminal facilities, including parking, rental car agency operations and landside access expansion, and supplementary operations such as police, fire and life safety, and commercial developments (hotel). In an effort to avoid these conflicts, two cargo expansion alternatives for the existing site were developed.
5.2.1.1 Site 1 - Alternative 1 Alternative 1 would expand Cargo Building 6 and includes the construction of a new cargo building north of Cargo Building 6. The location and layout of the new cargo building preserve the general aviation facilities currently located just north of the existing cargo area. This configuration would not accommodate aircraft operations adjacent to the new cargo building. This alternative would also constrain access through the passenger terminal campus and would include the relocation of all-cargo operations from Cargo Buildings 1 through 4 to the other cargo buildings.
5.2.1.2 Site 1 - Alternative 2 Alternative 2 would expand Cargo Building 6 and includes the construction of a new cargo building north of Cargo Building 6. However, unlike Alternative 1, the location and layout of the new cargo building would displace the general aviation facilities currently located north of the existing cargo area and would accommodate a cargo aircraft apron. This alternative would also include some constraints to access through the passenger terminal campus. As with Alternative 1, this alternative would include the relocation all-cargo operations from Cargo Buildings 1 through 4 to the other cargo buildings.
5.2.2 Site 2 – West Midfield Area Site 2 is located between Runway 1C-19C and new Runway 1L-19R and two east-west crossfield taxiways encompassing approximately 430 total acreage. However, the site provides approximately 160 acres of developable land outside the Federal Aviation Regulations (FAR) Part 77, Objects Affecting Navigable Airspace, approach surfaces, wetland areas and taxiway/taxilane access infrastructure. Access to the passenger aircraft concourse areas would require a tunnel under the runway/taxiway system or an extended tug route around the runway/taxiway system (an evaluation of each access option is presented in Section 6). Landside access would be from the north and would still require a tunnel under a taxiway.
Development of the West Midfield Area would require relocation of the Airport Surveillance Radar (ASR). Building heights and locations may be restricted by line-of-sight issues from the new Airport Traffic Control Tower (ATCT) to Runway 1L-19R and associated taxiways. Floodplain surfaces and wetland mitigation requirements for this site are currently being analyzed and may affect buildable area assumptions.
5.2.3 Site 3 – Airport Support Zone Area Site 3 is located west of Runway 1L-19R and encompasses approximately 375 acres of the overall Western Lands development area. Site 3 is also designated as the Airport Support Zone. The area provides approximately 160 acres of developable land after accounting for taxiway/taxilane access infrastructure. Access to the passenger aircraft concourse areas would require a tunnel under the

Washington Dulles International Airport
Cargo Area Study 44 January 2010
runway/taxiway system or an extended tug route around the runway/taxiway system (an evaluation of each access option is provided in Section 6). Landside access would be from the north. The site is located directly north of a proposed general aviation site. Floodplain surfaces and wetland mitigation requirements for this site are currently being analyzed and may affect buildable area assumptions.
5.2.4 Site 4 – Crosswind Area The Crosswind Area is located on the south side and west end of Runway 12-30 encompassing approximately 430 acres. This area provides approximately 120 acres of developable land after wetland mitigation and runway safety zone avoidance and would be accessible via State Route 606. Upon construction of the parallel crosswind runway, the site would be located between Runways 12L-30R and 12R-30L. Access to the passenger aircraft concourse areas would require an extended tug route to the east around the end of future Runway 12L-30R.
5.2.5 Split Site Alternative The Split Site Alternative is a combination of using existing Cargo Buildings 5 and 6 for belly freight operations and constructing a new cargo facility in the Airport Support Zone for the all-cargo operators. The key advantage of this alternative would be elimination of the need for tunnels or access roads to move belly freight from one of the new cargo sites back to the passenger terminal area.
6. Alternative Evaluation and Comparison The evaluation of alternatives involved a comprehensive review process that included both qualitative and quantitative comparison of all alternatives. Each alternative was evaluated against a selected set of criteria selected specifically for this comparison. The criteria include accessibility, site considerations, such as size requirements and environmental regulations, compatibility with other Airport functions, distance or travel time to the passenger terminal, and relative cost. Each alternative was given a rating score for each criterion. The rating scores were compiled into a matrix to allow for a side-by-side comparison of the alternatives. The recommended alternative is based upon the scoring results presented in the matrix as well as other factors associated with cargo and Airport development activities.
The evaluation criteria are discussed below, followed by a summary of the comparison results, including the ratings matrix.
6.1 Evaluation Criteria The alternatives were analyzed and compared using evaluation criteria covering various site characteristics. These characteristics were grouped into the following six major categories:
• Landside Access – Landside access relates to the regional transportation infrastructure to and from IAD and the local roadway network to cargo facilities that are off-Airport. The evaluation of the regional infrastructure included a comparison of the sites with respect to the surface transportation regional infrastructure, such as distance to major arterials and expressways and the effect that freight vehicle traffic might have on these facilities. Surface traffic activity through the primary Airport entrance was also considered. The local roadway network around IAD is also important because a significant portion of the Airport’s cargo is fully or partially processed or staged in nearby off-Airport facilities. Relative access to these facilities, primarily northwest of the Airport, is compared under this category.

Washington Dulles International Airport
Cargo Area Study 45 January 2010
• Airside Access – Airside access relates to the proximity of cargo facilities to all existing and future runways and taxiway routings. A cargo operation that is centrally located on the Airport can reduce annual taxiing operations and provide significant savings in fuel costs. This category also included an evaluation of the ability to maintain airfield security at each site.
• Site Considerations – Primary site considerations include the ability of each site to meet existing and future area requirements, including consideration for the need to relocate other functions, flexibility for expansion/incremental growth potential (including infrastructure costs), and the potential environmental impacts. The ability of each site to meet industry standards for efficient operation of a cargo facility was also considered.
• Compatibility – This category deals with the relative ability to phase improvements, the relationship to ongoing projects, and the highest and best land use for each cargo development alternative. Because available acreage is limited on the Airport and major Airport functions have established locations on the airfield, competing land use requirements affect the relative merit of various cargo expansion alternatives. The primary Airport function of accommodating scheduled passenger service is under study, with two of the possible cargo expansion areas being considered as possible passenger terminal expansion sites. This affects the ability to rank the cargo site alternatives in some of the evaluation criteria, particularly highest and best land use.
• Tug Cart Travel Times – Adjacency to the passenger operations is extremely important at IAD because approximately 75 percent of the Airport’s cargo is carried on aircraft parked at passenger concourse aircraft parking positions. The ability to effectively transfer cargo between this area and the cargo site is considered in this category.
• Relative Cost – This category includes an estimated order of magnitude cost comparison for the overall development of an alternative versus the others. Considerations include distances to existing utility infrastructure, regional access and existing operations, as well as site mitigation and other projects.
6.2 Evaluation Results The following paragraphs identify the general opportunities and constraints applicable to each of the alternatives based on the evaluation criteria. The number of opportunities or constraints for each criterion led to the specific ratings given each alternative. The ratings for each alternative were compiled into a comparison matrix, the evaluation criteria were weighted, and each rating was given a numerical score. A final score was given to each alternative for comparison purposes.
6.2.1 Opportunities and Constraints The following paragraphs discuss the various evaluation criteria and identify the opportunities and constraints for each alternative. Each alternative was given a rating of good, fair, or poor based on the number of opportunities or constraints involved. Each evaluation category was based on a qualitative analysis with the exception of the tug cart travel times and the cost estimates, which were based on a quantitative assessment. (Note: The rating score for each site was assumed for each alternative at that site unless otherwise noted.)
6.2.1.1 Landside Access The West Midfield Area (Site 2) and the Airport Support Zone Area (Site 3) are considered to have good regional access for air cargo and are easily accessible from the northwest. Although the

Washington Dulles International Airport
Cargo Area Study 46 January 2010
distance to the West Midfield Area and the ASZ Area is considered longer than to the existing cargo site, the access routes have less congestion.
Landside access to the Existing Cargo Area (Site 1) and the Split Site Alternative is considered fair because access to the Dulles Toll Road is good, but congestion in the passenger terminal area is a real concern. The Existing Cargo Area requires mixing freight vehicles with traffic related to other Airport functions in a relatively confined area. Landside access to the Crosswind Area (Site 4) is considered to be poor because of its distance to the Dulles Toll Road and offsite cargo operations.
6.2.1.2 Airside Access Runway Access - All eight development alternatives are considered to have good access to the runway system. Each of the alternatives is close to at least one runway and with the majority of cargo operations occurring during off-peak hours, airfield/runway operations should not be delayed.
Operational Efficiency - Because of its location, the Existing Cargo Area (Site 1) has the best operational efficiency (taxiway flow) as it requires the fewest runway crossings and received a good rating. The West Midfield Area (Site 2) and the Crosswind Area (Site 4) require an average number of runway crossings and received a rating of fair for operational efficiency. The Airport Support Zone Area (Site 3) and the Split Site Alternative require the highest number of runway crossings and received a poor rating.
Maintaining Airfield Security - The Airport Support Zone Area (Site 3) and the Crosswind Area (Site 4) separate cargo activity completely from the passenger terminal functions and also have distinct landside/airside delineation. Therefore, these two areas received a good rating for maintaining airfield security. The West Midfield Area (Site 2) also separates cargo activity from the terminal, but is situated between runways and, therefore, received a fair rating. The Split Site Alternative, which includes the Existing Cargo Area (Site 1) and the Airport Support Zone Area (Site 3) also received a fair rating because 50 percent of the activity is still in the terminal area. The Existing Cargo Area (Site 1) received a poor rating because all cargo activity is conducted in the terminal area.
6.2.1.3 Site Considerations Ability to Accommodate Facility Requirements – The West Midfield Area (Site 2), the Airport Support Zone Area (Site 3), and the Crosswind Area (Site 4) all have sufficient acreage to accommodate long-term facility requirements for cargo operations and, therefore, received a rating of good. The Existing Cargo Area (Site 1) and the Split Site Alternative both received a only a fair rating for accommodating facility requirements because they are affected by operations in a constrained area.
General Site Configuration Flexibility/Expandability – The Airport Support Zone Area (Site 3) received a good rating for flexibility/expandability because it is a green field site and will allow expansion to the north. The West Midfield Area (Site 2) and the Crosswind Area (Site 4) received a fair rating because, although they are also green field sites, expansion could be limited by future runway development and environmental constraints. The Split Site Alternative also received a fair rating because flexibility for the belly cargo operation will likely be limited at the current site. The Existing Cargo Area (Site 1) is rated poor because it is an established area with conflicting functions.

Washington Dulles International Airport
Cargo Area Study 47 January 2010
Impacts to Wetlands, Floodplains, and Streams - Comparative analysis of the sites based on environmental issues was conducted at a high level using existing watershed and floodplain information. Exhibit 6-1 illustrates the current wetlands present at each site. The Airport is currently conducting further studies to understand the environmental impacts of developing underutilized areas of the airport, specifically in the Western Lands and West Midfield areas. The results of this study must be re-evaluated as decisions are made for future cargo expansion.
Avoidance of Visibility Shadows from the ATCT – The Existing Cargo Area (Site 1), the Airport Support Zone Area (Site 3), and the Split Site Alternative all received a good rating because of their locations relative to the ATCT. The Crosswind Area (Site 4) received a fair rating because it is located at the far southwest area of the Airport and any ATCT visibility issues would be limited. The West Midfield Area (Site 2) was rated poor because it would be located between runways, which could create line-of-sight issues for the ATCT for taxiing operations.
Availability and Cost of Utility Connections - The Existing Cargo Area (Site 1) was given a good rating for availability and cost of utility connections because of existing infrastructure. The Airport Support Zone Area (Site 3) and the Split Site Alternative also were given a good rating for utilities because it can share the current infrastructure at the existing cargo site and because the new utility connections needed for the Airport Support Zone Area (Site 3) can be shared with the new general aviation site and any cargo development in the ASZ. The West Midfield Area (Site 2) would require new utility runs and, therefore, received a fair rating. The Crosswind Area (Site 4) received a poor rating for the distance required for new utility connections.
Access to Fueling Facilities – None of the cargo development alternatives have good access to fuel facilities. The Existing Cargo Area (Site 1) has the closest access to terminal core services and received a fair rating. All other alternatives received a poor rating because of their distances from the fuel farm and terminal systems.
6.2.1.4 Compatibility Existing and Planned Land Use - The West Midfield Area (Site 2) and the Crosswind Area (Site 4) are both green field sties and are not in conflict with any planned land uses and therefore received a good rating. The Airport Support Zone Area (Site 3) is also a green field site, but is adjacent to a proposed general aviation area. However, because no conflicts are expected with the proposed general aviation area, this alternative also was given a good rating. The Split Site Alternative was given a fair rating because 50 percent of the site is in the existing cargo area, which is congested with other development. The Existing Cargo Area was given a poor rating because 100 percent of the alternative is in a congested developed area.
Compatibility with Other Projects Under Study - Each Alternative Site was evaluated for coordination with other projects currently under study at the Airport. Economies for concurrent development and phasing considering utilities, access and site planning were considered. Additionally, each site was evaluated based on highest and best use of the area in comparison to other potential uses. Exhibit 6-1 illustrates each area and the potential impact to other proposed developments.

Washington Dulles International Airport
Cargo Area Study 48 January 2010
THIS PAGE LEFT INTENTIONALLY BLANK

Washington Dulles International Airport
Cargo Area Study 49 January 2010
Exhibit 6-1 Area Impacts and Other Projects
Source: Wetland Studies and Solutions, Inc: EA Engineering, Science and Technologies, Inc; IAD Airport Layout Plan; PMC, December 2006 Prepared by: Ricondo & Associates, Inc., December 2008.

Washington Dulles International Airport
Cargo Area Study 50 January 2010
THIS PAGE LEFT INTENTIONALLY BLANK

Washington Dulles International Airport
Cargo Area Study 51 January 2010
6.2.1.5 Tug Cart Travel Times The Existing Cargo Area (Site 1) has the best access to the concourses, with no runway crossings required to reach the area and the shortest distance to travel. The tug cart travel times were the shortest and this alternative received a good rating. The Split Site Alternative and the West Midfield Area (Site 2, Alternative 1) also received a rating of good. The Split Site Alternative does not require any tug cart traffic from any area other than the existing cargo facility and the West Midfield Area (Site 2, Alternative 1) includes a tunnel access under the runway/taxiway system to minimize travel times to the terminal gate area.
The Airport Support Zone Area (Site 3, Alternative 1) was the only alternative to receive a fair rating. Although this alternative includes a tunnel under the runway/taxiway system, the distance to the terminal area increases the tug cart travel time.
The West Midfield Area (Site 2, Alternative 2), the Airport Support Zone Area (Site 3, Alternative 2), and the Crosswind Area all received a poor rating because of their distances to the terminal gate area, which extend the tug cart travel times.
6.2.1.6 Relative Cost Both alternatives for the Existing Cargo Area (Site 1) are significantly less costly than the other alternatives. Site 1, Alternative 1 is the least expensive alternative at an estimated $130.3 million, followed by Site 1, Alternative 2, at an estimated $180.3 million. Both Site1 alternatives are significantly less costly than the other options because they use existing infrastructure (buildings, utilities, roads, etc.). Alternative 1 is less expensive than Alternative 2 because it would require less demolition and new construction work.
The next three alternatives in terms of cost are significantly more expensive, ranging from $321.9 million to $338.7 million. The least expensive of these three alternatives is the West Midfield Area without a tunnel (Site 2, Alternative 2), which is estimated to cost $321.9 million. The Split Site Alternative, which includes the Existing Cargo Area (for belly cargo) and the Airport Support Zone Area (for all-cargo only), is estimated to cost $332.8 million. The third alternative is the Airport Support Zone Area without a tunnel (Site 3, Alternative 2), which is estimated to cost $338.7 million. The increased cost for these alternatives results primarily from the need to build all new cargo facilities, including infrastructure. Two of the alternatives (the West Midfield Area without a tunnel and the Airport Support Zone Area without a tunnel) would require an access road back to the terminal for belly cargo transfers. Only the Split Site Alternative would not require an access road.
The remaining three alternatives are the most expensive of the eight development alternatives. The Crosswind Area (Site 4) alternative is estimated to cost $371.0 million. The West Midfield Area with a tunnel (Site 2, Alternative 1) is estimated to cost $394.8 million. The Airport Support Zone Area with a tunnel (Site 3, Alternative 1) is the most expensive of all the alternatives, with an estimated cost of $448.5 million. The high cost for the Crosswind Area alternative results from the need for all new infrastructure and the extended access roadway needed for belly cargo transfers back to the passenger terminal area. The high cost for the two most expensive options results from construction of a tunnel under the runway/taxiway system.

Washington Dulles International Airport
Cargo Area Study 52 January 2010
6.2.2 Comparison Matrix Table 6-1 summarizes the evaluation results discussed in previous sections. Based on the evaluations, the alternatives were given a rating for each criterion. The ratings were based on the evaluation of the issues related to the particular criterion, i.e., their impacts were judged to be favorable (+1), neutral (0), or not favorable (-1). The ratings for each alternative were summed and a final rating score was identified. No weighting was given to any of the evaluation criteria. As shown in the matrix totals, both alternatives for the Airport Support Zone Area (Site 3) received a better rating than the other alternatives. The Split Site Alternative (Site 3 and Site 1) received the third highest rating. Although additional analysis is needed before making a final recommendation, the matrix suggests that the Airport Support Zone Area (Site 3) is the best alternative as a site for future cargo facilities at IAD.
7. Recommended Alternative At IAD, cargo is currently located in the NAA, which includes a number of functions, including the primary public landside access, passenger terminal, general aviation, and rental car facilities, as well as hotel and airline support facilities. Each of these functions is essential to the overall mission of the Airport, and the need for each can be expected to increase over the long term; however, planning studies of all of these functions have not been completed or approved, including the future need for and location of passenger terminal and concourse facilities. These functions could potentially compete with cargo for the areas identified for expansion.
The development of a strategy for meeting cargo demand at IAD involves balancing future cargo requirements with the needs of other Airport functions. Because these needs are dynamic, changing over time, the strategy must accommodate any changes without becoming obsolete.
As noted in the review of evaluation criteria in Section 6.1, belly cargo requires frequent and minimized tug cart travel times between the cargo facility and passenger aircraft parking positions. The existing cargo area is substantially superior to the alternative sites in this regard. As shown on Exhibit 4-3, belly cargo area requirements can be accommodated at Cargo Buildings 5 and 6 through 2015 and additional capacity can be provided through construction of a new cargo facility north of Cargo Building 6. Therefore, if the existing cargo area is available through the planning period, consideration should be given to retaining belly cargo in this area; however, the planning and location requirements related to other Airport functions, such as passenger terminal expansion, are not known at this time; therefore, selection of a planned location for cargo must be contingent on planning decisions related to these other functions.

Washington Dulles International Airport
Cargo Area Study 53 June 2009 DRAFT
Table 6-1 Comparison Matrix (unweighted)
Comparison
Site 1
Alternative 1 Site 1
Alternative 2 Site 2
Alternative 1 Site 2
Alternative 2 Site 3
Alternative 1 Site 3
Alternative 2 Site 4 Split Site
Alternative
Evaluation Factors
Existing - Freight Focus
Existing - Belly Focus
Midfield with Tunnel
Midfield without Tunnel
ASZ with Tunnel
ASZ without Tunnel
Crosswind Midfield
Belly Cargo Remains, Others to
ASZ Landside Access Access to Dulles Toll Road / Regional Transportation 0 0 1 1 1 1 -1 0 Airside Access Access to runways 1 1 1 1 1 1 1 1 Operational efficiency (taxiway flow) -1 -1 1 1 1 1 1 1 Maintaining airfield security 1 1 -1 -1 0 0 0 0 Site Characteristics Ability to meet facility requirements -1 -1 1 1 1 1 1 0 General site configuration flexibility/expandability -1 -1 0 0 1 1 0 0 Impacts to wetlands, floodplains, and streams 1 1 -1 -1 -1 -1 0 -1 Avoidance of visibility shadows from the ATCT 1 1 -1 -1 1 1 0 1 Availability and cost of utility connections 1 1 0 0 1 1 -1 1 Access to fueling facilities 0 0 -1 -1 -1 -1 -1 -1 Compatibility with Airport Land Use Existing and planned land use -1 -1 0 0 0 0 0 -1 Phasing with other Airport projects -1 -1 0 0 1 1 0 1 Compatibility with other projects under study -1 -1 0 0 1 1 1 0 Tug Cart Travel Time 1 1 1 -1 0 -1 -1 1 Relative Cost 1 1 -1 -1 -1 -1 -1 0
TOTAL SCORE 1 1 0 -2 6 5 -1 3
Source: Ricondo & Associates, Inc., December 2008. Prepared by: Ricondo & Associates, Inc., December 2008.
Washington Dulles International Airport
Cargo Area Study 54 January 2010
7.1 Demand Triggers To better understand how these factors influence future development, a decision tree methodology was developed to provide guidance to decision making while taking into account future changes in needs and priorities. The decision tree, shown on Exhibit 7-1, illustrates this process for the IAD cargo expansion and location choice decisions. This process can be implemented at any time using currently available information in terms of demand for cargo and the demand and priorities for meeting the needs of other functions at the Airport. Each step has a defined set of data needs and a process or sub-strategy for selecting the appropriate decision path. These are described below.
The decision tree process begins with an understanding of the forecast demand of cargo activity. The level of forecast cargo activity will dictate the type and size of cargo facilities and this, in turn, will determine the long-term adequacy of the existing facility.
7.1.1 Cargo Forecast The forecast is the basis for determining facility requirements. It should be updated periodically or as needed and provide forecasts for major categories of cargo, such as domestic or international, passenger aircraft (belly cargo) or all-cargo aircraft, and express (or integrator).
7.1.2 Facility Program Space and area (acreage) requirements are derived from the forecasts. For this study, the derivation was based on the IATA Airport Development Reference Manual, and supported by the benchmark analysis of current cargo facilities at IAD and other similar airports. The facility program should also take into account current and expected MWAA policies and use patterns, such as the use of cargo facilities by other related or unrelated functions (e.g., Airport support functions in Cargo Buildings 1 through 4). The facility program indicates that approximately 103 acres will be needed for cargo development in 2030.
7.1.3 Adequacy of the Existing Site The existing site should be evaluated for appropriate use, access, and life cycle issues, as well as the capability to expand the site. The amount of usable space in the current or projected future year should be estimated. For this study, it was assumed that Cargo Buildings 1 through 4 are not adequate for future cargo operations and that their sites do not provide adequate area for redevelopment; therefore, they are not included as available usable space.
Space demand should be divided by categories of cargo, as noted above. Net new requirements should be determined based on the plan years of interest. Construction time should be taken into account with respect to determining the plan year.
7.2 Existing Cargo Area Only vs. New Cargo Area The primary decision for future cargo development at IAD is to determine whether or not the existing cargo area can be expanded to accommodate the long-term demand for air cargo. If the existing area can not accommodate long-term cargo growth, the next major decision will be whether to relocate all or a portion of the air cargo operation.

Washington Dulles International Airport
Cargo Area Study June 2009
Source: Ricondo & Associates, Inc., December 2008Prepared by: Ricondo & Associates, Inc., December 2008
Cargo Study Decision Tree
Exhibit 7-1
C A R G O F O R E C A S TBasis for determining facility requirements.Annual tons increase to 80,000 in 2030
to 373,000 in 2006.
F A C I L I T Y P R O G R A MDerived from IATA guidelines.
103 total acres needed in 2030:45 acres Hub 37 acres Non-Hub
21 acres Express
I S E X I S T I N G S I T E A D E Q U A T E T O M E E T F U T U R E D E M A N D ?
Y E S , H O W E V E RSite does not accommodate total 2030 cargo facility program without dislocation of other functions and new North Area construction
N OIf existing site cannot handle additional cargo
Full or partial relocation of cargo facilities are required.
P A R T I A L R E L O C A T I O N O F C A R G O O P E R A T I O N S
Non-Hub Cargo operations relocated, gate dependent Hub Cargo operations remain
E X P R E S S T O A S Z A L L N O N - E X P R E S S T O
W E S T E R N M I D F I E L D
82 acres required in W.M. 21 acres in ASZ. W.M. may be restricted by environmental
issues. Additional costs for redundant access. Belly cargo access to gate issues.
H U B C A R G O T O R E M A I N I N E X I S T I N G A R E A / E X P R E S S
O P T I O N A LCargo Buildings 5 and 6 have adequate
dimensions to continue use as cargo. Available acreage indicates Hub cargo could remain
through 20?? without additional development. Hub + Express could remain through 20??
F U T U R E A I R F I E L D / T E R M I N A L D E V E L O P M E N T
When or if existing cargo area is needed for non-cargo development the following
relocations should be considered for Hub and/or Express Cargo.
H U B C A R G O T O A S Z45 additional acres must be reserved for in the ASZ to accommodate for future demand
HUB CARGO TO SOUTH AREAIf the North Area adequate to meet terminal requirements, the South Area available for
cargo
H U B C A R G O T O W E S T E R N M I D F I E L D
45 acres required. Site may be restricted by environmental issues. Additional costs for
redundant access. Belly cargo access to gate issues.
HUB CARGO TO REMAINHub Cargo can be co-located with North
Terminal if 45 acres reserved or reallocated for cargo facilities
L O C A T I O N O P T I O N S
N O R T H A R E A T E R M I N A L D E V E L O P M E N T
Existing Hub Cargo operations affected by Passenger Terminal area development
N O R T H & S O U T H A R E A T E R M I N A L D E V E L O P M E N T
Existing Hub Cargo operations potentially affected by Passenger Terminal area
development
H U B C A R G O T O R E M A I N I N E X I S T I N G A R E A
45 total acres needed by 203066 acres if Express remains in existing facilities
H U B C A R G O T B DPotential co-location of Hub Cargo and Hub Pax
Gates
S O U T H A R E A T E R M I N A L D E V E L O P M E N T
Existing Hub Cargo operations not affected by Passenger Terminal area development
A L L C A R G O T O W E S T E R N M I D F I E L D
103 acres required. Site may be restricted by environmental issues. Additional costs
for redundant access. Belly cargo access to gate issues.
HUB CARGO TO WESTERN MIDFIELD REMAINING CARGO
TO ASZ
45 acres required in W.M. 58 acres in ASZ. W.M. may be restricted by environmental
issues. Additional costs for redundant access. Belly cargo access to gate issues.
A L L C A R G O T O A S Z103 acres required. May require expansion
of ASZ to accommodate other aviation related uses. Belly cargo access to gate issues.
A L L N O N - H U B C A R G O T O A S Z
37 acres required/58 with Express. May require expansion of ASZ to accommodate
other aviation related uses. Belly cargo access to gate issues.
N O N - H U B C A R G O T O W E S T E R N M I D F I E L D
37 acres required / 58 with Express. Site may be restricted by environmental issues.
Additional costs for redundant access. Belly cargo access to gate issues.
EXPRESS TO ASZ OTHER NON-HUB TO WESTERN
MIDF IELD37 acres required in W.M. 21 acres in ASZ. W.M. may be restricted by environmental
issues. Additional costs for redundant access. Belly cargo access to gate issues.
E X P R E S S TO W E S T E R N M I D F I E L D OT H E R N O N - H U B
TO A S Z
21 acres required in W.M. 37 acres in ASZ. W.M. may be restricted by environmental
issues. Additional costs for redundant access. Belly cargo access to gate issues.
L O C A T I O N O P T I O N S
R E L O C A T I O N O F A L L N O N - H U B C A R G O / E X P R E S S O P T I O N A LRelocate all cargo ops except UA and LH.
Approximately 37 acres needed for Non-Hub Cargo in 2030. Additional 21 acres needed for Express
Cargo in 2030 if it does not remain in North Area.
T O T A L O R P A R T I A L R E L O C A T I O N O F C A R G O O P E R A T I O N S
S H O R T T O M E D I U M T E R M A C T I O N S R E C O M M E N D E D
L O N G T E R M A C T I O N S R E C O M M E N D E D
S H O R T T O M E D I U M T E R M A C T I O N S N O T R E C O M M E N D E D
S H O R T T O M E D I U M T E R M A C T I O N S S T R O N G L Y N O T R E C O M M E N D E D
N E A R T E R M D E C I S I O N 0 - 5 Y E A R S
I N T E R M E D I A T E T E R M D E C I S I O N 5 - 1 0 Y E A R S
L O N G R A N G E D E C I S I O N 1 0 + Y E A R S
N E X T C A R G O B U I L D I N G O N N E W S I T E
B U I L D C A R G O 7O N E X I S T I N G S I T E
T O T A L R E L O C A T I O N O F C A R G O O P E R A T I O N S
Inefficient use of existing facilities in the short term. Less efficient hub cargo transfer times.
L O C A T I O N O P T I O N S
Car
go A
rea
Stud
yA
irpo
rt S
uppo
rt Z
one
Stud
y
January 2010

Washington Dulles International Airport
Cargo Area Study 56 January 2010
THIS PAGE LEFT INTENTIONALLY BLANK

Washington Dulles International Airport
Cargo Area Study 57 January 2010
7.2.1 Expand Existing Cargo Area Only If the existing site is adequate to accommodate future demand, no further action is needed regarding additional cargo sites. If new facility development on the existing or adjacent site is needed to meet short- or medium-term demand, but long-term needs indicate that the existing site is inadequate, further study would be needed to determine the financial and operational advantages of additional construction on the existing site (including dislocating adjacent functions) versus relocation to a new site.
Cargo Buildings 5 and 6 are viable cargo facilities for a modern operation and have limited access to the apron and aircraft parking positions. Additional acreage may be available at the future Cargo Building 7 site and other adjacent sites, but recent growth of General Aviation and Passenger Terminal functions, as well as other Airport initiatives in the NAA, create increasing constraints to reserving this area. Therefore, the total acreage available in the NAA for cargo activity without affecting adjacent functions or total redevelopment of the site of Cargo Buildings 1 through 4 is being reduced every year. While development of new cargo facilities may not be necessary in the near-term, the future location of expanded cargo activity needs to be considered immediately.
7.2.2 Develop New Cargo Area If the existing cargo area is not adequate to accommodate future demand or the NAA is determined to be more valuable for other airport functions, a new cargo site must be selected for long-term development. In accordance with the evaluation process discussed in Section 6.2, the Airport Support Zone Area (Site 3) has been identified as the best alternative for a new cargo site. Further refinement of this concept is being completed as part of an independent study, the Conceptual Land Use Master Plan – IAD Support Zone. This study will identify site options for varying degrees of cargo relocation and provide additional information related to opportunities and constraints of this site.
7.3 New Cargo Area Development Options After determining that a new cargo site is needed and the ASZ Area is compatible, the key decision will be how to use the new area. Such use could include relocation of all cargo facilities to the new site or the development of some type of split operation, leaving a portion of cargo activity at the existing site for operational efficiency.
7.3.1 Relocation of Cargo Operations to the ASZ Area Several factors could contribute to the wholesale relocation of the cargo operations: reservation or designation of the existing cargo area for alternate use, such as passenger terminal development, ground transportation related facilities, etc. Other factors in future years could include depreciated value of cargo and other NAA facilities, or congestion in the central terminal area, status of leases, and the shortage in the amount of space required for cargo in the short or medium term.
7.3.2 Relocation of Partial Cargo Operations This study has identified the key differences between belly cargo and all-cargo operations. Because of the need for belly cargo operations to remain close to the passenger terminal gates, a partial relocation of IAD cargo operations, at a minimum, should include maintaining belly cargo operations at the existing site. In the IAD Airport Support Zone Study, MWAA has identified various cargo configuration options that involve partial relocation of the cargo operation. If partial relocation of

Washington Dulles International Airport
Cargo Area Study 58 January 2010
the cargo operation is selected as the long-term solution, the final configuration of cargo facilities will be determined through additional analyses by MWAA.
8. Summary Air cargo at IAD is forecast to grow an average of more than 4 percent per year between 2006 and 2030. This growth will increase cargo weight accommodated at the Airport from approximately 746,000 pounds to approximately 1.8 million pounds during the period. This cargo area study was conducted to evaluate the long-term ability of the existing cargo area to accommodate cargo growth and to evaluate other potential cargo sites on the Airport.
To accommodate the forecast cargo activity growth, the existing cargo area will require significant modifications and expansion. It was determined that Cargo Buildings 1 through 4 will not be capable of accommodating long-term cargo growth. As part of the original airport layout plan of the 1960’s, these facilities are rapidly aging and do not meet the requirements for a modern cargo operation. Although preliminary plans exist for expansion of the existing cargo area, many other factors are competing for and influencing the long-term development of this area. These include passenger terminal expansion, ground transportations/parking needs, support facilities, general aviation, and other needs.
To determine the best use of the existing cargo area, alternative cargo development sites were identified and considered for long-term development. Although numerous sites on the Airport were suggested, four sites with reasonable potential to accommodate cargo growth were identified. As shown on Exhibit 5-2, these sites included the Existing Cargo Area (Site 1), the West Midfield Area (Site 2), the Airport Support Zone Area (Site 3), and the Crosswind Area (Site 4). The areas were evaluated based on six primary criteria categories, including landside access, airside access, site considerations (facility requirements, flexibility, environmental, etc.), compatibility, tug cart travel times (for belly cargo), and relative cost. It was concluded that Site 3, the Airport Support Zone Area, was the best alternative for expansion, and potential relocation, of cargo activity at IAD.
Although this cargo area study identified a new site for cargo facility development, the actual configuration for long-term development is still under evaluation. The key decisions for future cargo operations include (1) determining whether to expand the existing site to meet long-term requirements or develop a new site, and (2) if a new site is developed, determining whether to relocate all or a portion of the facilities.
MWAA is currently evaluating numerous relocation and configuration options for long-term cargo development. If the long-term plan for cargo includes a new cargo site, the Airport Support Zone Area identified in this report was determined to be the best alternative for that development.

Washington Dulles International Airport
Cargo Area Study A-1 January 2010
Appendix A Tenant Interview Documentation A.1 Tenant Survey Select cargo operators were interviewed by the planning team as part of the inventory and forecasting efforts. All existing tenant utilizing the IAD Cargo facilities for cargo specific operations were sent an anonymous questionnaire and asked to describe their future plans, what they thought of the existing facilities and operations and to provide suggestions for improving future facility efficiency and leased area. Response was very limited. The following is a summary of received comments.
A.1.1 Cargo Interview Summary A.1.1.1 Cargo Carriers/Operators Interviewed FedEx:
Ed Koorbusch (Manager)
Tel. 703-661-2005
Interviewed: 11/13/07
United:
George Bieloszabski (Hub Manager Cargo &Vendor Operations)
Tel. 703-572-7949
Interviewed: 11/13/07
Flavio Renfer (Sales Manager)
Tel. 703-572-3287
Interviewed: 11/13/07
Worldwide Flight Services:
Bryan Dahn (General Manager)
Tel. 703-661-5407 x223
Interviewed: 11/13/07
Swissport Cargo:
Mario Navarro (Manager)
Tel. 703-661-8606
Interviewed: 11/14/07
WACA: (Interviewed 11/14/07)

Washington Dulles International Airport
Cargo Area Study A-2 January 2010
Deanne Torlone (Managing Director Airline Logistics)
Tel. 571-434-8755
Amy Fries (Area Sales Manager)
Tel. 571-434-8755
Richard Norris
Tel. 703-471-8754
Kathy Arthur (Kamino International Transport, Inc.)
703-435-9793
Air France:
Paul Budris (Manager)
Tel. 703-661-6451 x221
Interviewed: 11/16/07
Lufthansa:
Abilash Koshy (Manager)
Tel. 703-572-2320
Interviewed: 11/20/07
A.1.1.2 Overview A series of interviews was conducted with major cargo facility lease holders and cargo contracted operators at Washington Dulles International Airport. The interview sessions were a data collection effort to supplement an overall Cargo Area Study. Inquiry interests included overall existing site conditions, operations successes and failures, future growth projections and any pertinent miscellaneous information. Post interview comments will be assessed and incorporated into a grand Cargo Area Site Relocation and facilities programming recommendation factors.
A.1.1.3 Data Summary The interview data are summarized into the following categories:
• Current Site Issues • Existing Facility Success/Failures • Future Growth Needs/Wants (Facility and site requirements) • Future Expansion of IAD Cargo Operations Marketing

Washington Dulles International Airport
Cargo Area Study A-3 January 2010
Current Site Issues • Inadequate Tractor Trailer Maneuvering space • Distance is too long between Cargo Facility to flight line to meet flight cut off time
(International) • Airside Ramp space is sufficient (for non-Freight operations) • Quantity of Security Gates slows down tug cart movement of cargo from warehouse to
flight line • Location of current Security Gates causes “bottle neck” of operations for all cargo
operators transporting cargo from warehouse to flight line • Insufficient number of employee parking spaces • Shared access roadways for cargo tractor trailers and public airport PAX vehicles are a
concern and inhibits proper trailer maneuvering space into loading docks • Lack of tractor trailer staging area • Common roadway for all cargo operator tractors trailers; causes bottle neck of operations.
Existing Facility • New Cargo Buildings (5-6) provide sufficient depth for operations • Adequate office space for cargo buildings 5 and 6 • Number of loading docks are sufficient per warehouse • Cargo Buildings 1-4 lack depth for operations • Cargo Buildings 1-4 lack sufficient number of loading docks • Cargo Buildings 1-4 lack sufficient office space • Facilities need an increase in number of wide door loading docks
Future Growth Needs/Wants • Dedicated cargo access roadway • Tractor trailer staging area • Clear hard walled separation of cargo operators space • Sufficient employee parking spaces to meet future demands • Limit number of security gates • Apron ramp space for possible freight operations • “Valuables Rooms” in new warehouse facilities • Large/wide loading dock doors for multiple uses • Consolidated CBP facility? • Direct access to AOA for freight operations • Close proximity to flight line
Future Expansion of IAD Cargo Operations • Move towards development of freight operations • Establish IAD as a freighter hub

Washington Dulles International Airport
Cargo Area Study A-4 January 2010
A.1.2 Questionnaire Results - Existing Conditions Table A-1 Tenant Survey Summary – Existing Conditions
Response 1 Response 2 Response 3How much space do you have under lease?
Total enclosed retable square feet 3100 SF 3000 SF 32000 SFTotal enclosed warehouse and/or cargo processing area 1300 SF 3000 SF 29000 SFTotal office area 3000 SF 1 1200 SF 3000 SFNumber of landside truck docks 2 2 9Number of visitor vehicle parking spaces 3 2 4Number of employee parking spaces 14 2 16
When does the lease expire? 4/30/2008 2012What fuctions are preformed in lease area and percentage occupied by them
Cargo processing and staging/storage 100% 80% 100%Cargo-related GSE storage 0% 0% 0%Non-Cargo related GSE storage 0% 0% 0%GSE maintenance 0% 0% 0%In-flight cabin stores 0% 0% 0%Other 0% 20% 3 0%
What type of/how many pieces of GSE equipment are typically parked on the airside apron? 1 Cargo Van 0 1 VanWhat aircraft parking/serviceing requirements to you have for the airside apron? 0 0 0What other airlines/carriers does you compnay handle or provide services for at IAD? None None SK, VA, SWHow many employees (full-time) do you have working in the area? 1 14 28Number of employees on site during each workday shift? 12 12 22Are the various components of your current facility adequate for your current needs Yes 2 Yes Yes
Notes: 1/ Total includes 2nd floor office area added at company's expense, therefore the Airport does not include this additional space in their S2/ However space is tight and does not provide fr projected expansion of IAD operations3/ 5% Cold Store, 15% Office & related
Questions
Source: Ricondo & Associates, Inc., June 2007. Prepared by: Ricondo & Associates, Inc., June 2007
A.1.3 Questionnaire Results - Future Considerations The following questions were included as part of a mailed questionnaire. Tenant answers immediately follow the questions. 1. Projections of future activity such as additional space requirements, activity growth projections,
etc.
All but one respondent wrote that there are plans for growth expansion.
2. Are the various components of your current leased facility (truck docks, office space, floor space, bay width, building depth and height, airside apron, access roads, etc.) adequate for your expected needs?
Two respondents replied that their facility was adequate, one clamed the need for more office space.
3. If you were to relocate to a new facility, what different or improved facility characteristics would be important to you?
Improved HVAC, more flexible warehouse and office space, lower rent, dock leveler capabilities at every door

Washington Dulles International Airport
Cargo Area Study A-5 January 2010
4. Comments on the location of Air Cargo at the Airport. What issues would you have relocating to a new center west of the north-south runways? Or the south side of the Airport?
New location must have continued access to apron and SIDA warehouse areas, easy access for customer convenience.
5. Other related comments.
Traffic control has to be improved at the rear gate, Arianna and Rt 606. This is a very dangerous intersection where many accidents have happened. It may prevent some cargo customer easy access to the cargo area from that direction. Access to the apron and SIDA warehouse is important.

Washington Dulles International Airport
Cargo Area Study A-6 January 2010
THIS PAGE LEFT INTENTIONALLY BLANK
Washington Dulles International Airport
Cargo Area Study B-1 June 2009 DRAFT
Appendix B Ground Service Equipment Time/Distance Analysis

ESTIMATED VEHICLE TRAVEL TIMES UNDER MAXIMUM ACCELERATION CAPABILITIESSummary Evaluation of Vehicle Travel TimesWashington Dulles International Airport
15 mph=22 ft/s
Distance (ft) TotalsCompared to Existing
(Distance) Drive time (sec) Drive time (Minutes)Compared to Existing
(Time)Existing Cargo Tier 2 to Existing Cargo 5,656 5,656 1.00 286 4.77 1.00
South Cargo Tier 2 to South Cargo 18,167 18,167 3.21 866 14.4 3.02
West Cargo Tier 2 to West Cargo (Tunnel) 14,685 14,685 2.60 706 11.8 2.46
West Cargo Tier 2 to West Cargo (North Road) 22,914 22,914 4.05 1113 18.6 3.89North Road
Infield Cargo Tier 2 to Infield Cargo (Tunnel) 9,017 9,017 1.59 441 7.3 1.54
Infield Cargo Tier 2 to Infield Cargo (North Road) 24,150 24,150 4.27 1164 19.4 4.06North Road
B-2

ESTIMATED VEHICLE TRAVEL TIMES UNDER MAXIMUM ACCELERATION CAPABILITIESEvaluation of Structural Fire / EMS Response TimesWashington Dulles International Airport
Case: Site 1 (Existing Station 303) to Target Location 2Vehicle: EMS
Curve Data V (mph) During Acceleration During Constant V Time
Segment ID Speed ProfileSegment
TypeSegment
Length (ft) Radius (ft)
Super- elevation,
e
Side Friction Factor, f
(a)Vmax (mph)
Initial Velocity, Vo (mph)
Uncon- strained
(b)
Con-strained
(c)
At End of Segment
(d)
Distance (ft) (e) Time (s) (f)
Distance (ft)
Time (sec) (g)
Segment (s)
Cumulative (s)
Cumulative (min)
Average Speed on Segment
(mph)# X T or C # # # #
1-2 E T 1,025 n.a. 0.0 55.4 15.0 0.0 75.2 6.8 949.6 43.2 50.0 50.0 0.83 14.02-3 E C 51 27 0.04 0.19 9.7 0.0 12.3 9.7 9.7 31.3 4.4 19.4 1.4 5.8 55.8 0.93 6.03-5 E T 424 n.a. 9.7 36.9 15.0 11.3 43.9 2.4 380.3 17.3 19.7 75.5 1.26 14.75-7 E C 106 37 0.04 0.19 11.3 11.3 21.1 11.3 11.3 0.0 0.0 105.9 6.4 6.4 81.9 1.36 11.37-9 E T 504 n.a. 11.3 40.4 15.0 0.0 32.7 1.7 471.1 21.4 23.1 105.0 1.75 14.99-11 E C 95 37 0.04 0.19 11.3 0.0 16.9 11.3 11.3 42.4 5.1 53.1 3.2 8.3 113.3 1.89 7.811-13 E T 1,065 n.a. 11.3 57.6 15.0 0.0 32.8 1.7 1,032.2 46.9 48.6 161.9 2.70 14.913-15 E C 106 10 0.04 0.19 5.9 0.0 17.8 5.9 0.0 11.5 2.7 94.5 11.0 13.7 175.6 2.93 5.315-17 E T 322 n.a. 0.0 31.0 15.0 15.0 75.2 6.8 246.6 11.2 18.0 193.6 3.23 12.217-65 E T 435 n.a. 15.0 39.1 15.0 15.0 0.0 0.0 435.1 19.8 19.8 213.4 3.56 15.065-67 E C 363 932 0.04 0.19 55.0 15.0 36.2 15.0 15.0 0.0 0.0 363.2 16.5 16.5 229.9 3.83 15.067-69 E T 167 n.a. 15.0 26.9 15.0 15.0 0.0 0.0 167.3 7.6 7.6 237.5 3.96 15.069-71 E T 489 n.a. 15.0 41.1 15.0 12.3 0.0 0.0 489.4 22.2 22.2 259.8 4.33 15.071-73 E C 23 44 0.04 0.19 12.3 12.3 14.8 12.3 12.3 0.0 0.0 22.6 1.2 1.2 261.0 4.35 12.373-75 E C 259 593 0.04 0.19 45.1 12.3 30.5 15.0 0.0 24.4 1.2 234.7 10.7 11.9 272.9 4.55 14.975-77 E C 68 50 0.04 0.19 13.2 0.0 14.3 13.2 13.2 57.9 6.0 10.1 0.5 6.5 279.4 4.66 7.177-79 E T 154 n.a. 13.2 25.2 15.0 15.0 17.3 0.8 136.3 6.2 7.0 286.4 4.77 14.9
TOTALS: 5,656 feet 19.7 444.50 39.75 5,211.37 246.68 286.43 4.771.07 miles 13.5 = avg speed (mph)
Key Assumptions: Speed Profilesmax speed A B C D E V (mph) f
Accel 1 30.00 3.22 3.22 3.22 3.22 3.22 ft/s2 40.00 0.15Accel 2 n.a. 1.84 1.84 1.84 1.84 1.84 ft/s2 50.00 0.14Adjstmnt n.a. 57% 57% 57% 57% 57% 60.00 0.12V veh max n.a. 55.00 35.00 25.00 20.00 15.00 mph 70.00 0.10
a. The friction factor "f" in the assumptions table represents AASHTO standards for general roadway traffic and is intended to provide general guidance for estimating friction factors for ARFF vehicles and driving conditionsb. Maximum speed attainable in segment ignoring vehicle or geometric limitations, V = sqrt(Vo
2 + 2ax), where x = distance and a = accelerationc. Maximum speed attainable considering vehicle and geometric limitationsd. Estimated speed at end of segment recognizing geometric limitations of the next roadway segmente. Distance travelled under constant acceleration, x = Vot + 0.5at2
f. Elapsed time under constant acceleration, t = (V-Vo)/ag. Elapsed time to travel distance x under constant velocity, t = x/v
B-3

ESTIMATED VEHICLE TRAVEL TIMES UNDER MAXIMUM ACCELERATION CAPABILITIESEvaluation of Cargo Facilities Transfer TimesWashington Dulles International Airport
Case: Site 1 (Existing Station 303) to Target Location 1Vehicle: Tug
Curve Data V (mph) During Acceleration During Constant V Time
Segment ID Speed ProfileSegment
TypeSegment
Length (ft) Radius (ft)
Super- elevation,
e
Side Friction Factor, f
(a)Vmax (mph)
Initial Velocity, Vo (mph)
Uncon- strained
(b)
Con-strained
(c)
At End of Segment
(d)
Distance (ft) (e)
Time (s) (f)
Distance (ft)
Time (sec) (g)
Segment (s)
Cumulative (s)
Cumulative (min)
Average Speed on Segment
(mph)# X T or C # # # #
1-2 E T 1,014 n.a. 0.0 55.1 15.0 0.0 75.2 6.8 938.8 42.7 49.5 49.5 0.82 14.02-4 E C 39 25 0.04 0.19 9.3 0.0 10.8 9.3 9.3 28.7 4.2 10.5 0.8 5.0 54.5 0.91 5.44-6 E T 278 n.a. 9.3 30.3 15.0 0.0 46.5 2.6 231.7 10.5 13.1 67.6 1.13 14.46-8 E C 6 25 0.04 0.19 9.3 0.0 4.1 4.1 4.1 5.5 1.8 0.0 0.0 1.8 69.5 1.16 2.08-10 E T 920 n.a. 4.1 52.6 15.0 15.0 69.7 5.0 850.5 38.7 43.6 113.1 1.89 14.410-12 E C 139 88 0.04 0.19 17.4 15.0 25.3 15.0 15.0 0.0 0.0 139.1 6.3 6.3 119.4 1.99 15.012-14 E T 513 n.a. 15.0 41.9 15.0 0.0 0.0 0.0 512.6 23.3 23.3 142.7 2.38 15.014-16 E C 39 25 0.04 0.19 9.3 0.0 10.8 9.3 9.3 28.7 4.2 10.5 0.8 5.0 147.7 2.46 5.416-18 E T 426 n.a. 9.3 36.9 15.0 0.0 46.5 2.6 379.5 17.2 19.9 167.6 2.79 14.618-20 E C 39 25 0.04 0.19 9.3 0.0 10.8 9.3 9.3 28.7 4.2 10.5 0.8 5.0 172.6 2.88 5.420-22 E T 1,295 n.a. 9.3 62.9 15.0 0.0 46.5 2.6 1,248.5 56.7 59.3 231.9 3.87 14.922-24 E C 38 11 0.04 0.19 6.2 0.0 10.7 6.2 6.2 13.0 2.8 25.0 2.7 5.6 237.5 3.96 4.624-26 E T 337 n.a. 6.2 32.4 15.0 9.3 62.2 4.0 275.1 12.5 16.5 254.0 4.23 13.926-28 E C 21 25 0.04 0.19 9.3 9.3 12.2 9.3 9.3 0.0 0.0 20.7 1.5 1.5 255.5 4.26 9.328-30 E T 346 n.a. 9.3 33.5 15.0 0.0 46.5 2.6 299.1 13.6 16.2 271.7 4.53 14.530-32 E C 61 25 0.04 0.19 9.3 0.0 13.5 9.3 9.3 28.7 4.2 32.5 2.4 6.6 278.3 4.64 6.332-34 E T 2,007 n.a. 9.3 78.1 15.0 9.3 46.5 2.6 1,960.5 89.1 91.7 370.0 6.17 14.934-36 E C 38 25 0.04 0.19 9.3 9.3 14.1 9.3 0.0 0.0 0.0 38.0 2.8 2.8 372.8 6.21 9.336-38 E C 431 636 0.04 0.19 46.8 0.0 35.9 15.0 15.0 75.2 6.8 355.9 16.2 23.0 395.8 6.60 12.838-40 E T 1,033 n.a. 15.0 57.6 15.0 15.0 0.0 0.0 1,033.4 47.0 47.0 442.8 7.38 15.040-42 E C 262 250 0.04 0.19 29.3 15.0 31.8 15.0 15.0 0.0 0.0 262.4 11.9 11.9 454.7 7.58 15.042-44 E T 7,320 n.a. 15.0 148.8 15.0 13.1 0.0 0.0 7,320.0 332.7 332.7 787.4 13.12 15.044-46 E C 78 50 0.04 0.19 13.1 13.1 20.1 13.1 13.1 0.0 0.0 78.0 4.1 4.1 791.4 13.19 13.146-48 E T 71 n.a. 13.1 19.6 15.0 13.1 17.7 0.9 53.3 2.4 3.3 794.7 13.25 14.848-50 E C 79 50 0.04 0.19 13.1 13.1 20.2 13.1 0.0 0.0 0.0 79.4 4.1 4.1 798.8 13.31 13.150-52 E T 299 n.a. 0.0 29.9 15.0 0.0 75.2 6.8 223.9 10.2 17.0 815.9 13.60 12.052-54 E T 288 n.a. 0.0 29.4 15.0 15.0 75.2 6.8 212.9 9.7 16.5 832.4 13.87 11.954-56 E T 749 n.a. 15.0 49.7 15.0 15.0 0.0 0.0 748.8 34.0 34.0 866.4 14.44 15.0
TOTALS: 18,167 feet 21.0 816.09 71.81 17,351.16 794.58 866.39 14.443.44 miles 14.3 = avg speed (mph)
Key Assumptions: Speed Profilesmax speed A B C D E V (mph) f
Accel 1 30.00 3.22 3.22 3.22 3.22 3.22 ft/s2 40.00 0.15Accel 2 n.a. 1.84 1.84 1.84 1.84 1.84 ft/s2 50.00 0.14Adjstmnt n.a. 57% 57% 57% 57% 57% 60.00 0.12V veh max n.a. 55.00 35.00 25.00 20.00 15.00 mph 70.00 0.10
a. The friction factor "f" in the assumptions table represents AASHTO standards for general roadway traffic and is intended to provide general guidance for estimating friction factors for ARFF vehicles and driving conditionsb. Maximum speed attainable in segment ignoring vehicle or geometric limitations, V = sqrt(Vo
2 + 2ax), where x = distance and a = accelerationc. Maximum speed attainable considering vehicle and geometric limitationsd. Estimated speed at end of segment recognizing geometric limitations of the next roadway segmente. Distance travelled under constant acceleration, x = Vot + 0.5at2
f. Elapsed time under constant acceleration, t = (V-Vo)/ag. Elapsed time to travel distance x under constant velocity, t = x/v
B-4

ESTIMATED VEHICLE TRAVEL TIMES UNDER MAXIMUM ACCELERATION CAPABILITIESEvaluation of Structural Fire / EMS Response TimesWashington Dulles International Airport
Case: Site 1 (Existing Station 303) to Target Location 3Vehicle: EMS
Curve Data V (mph) During Acceleration During Constant V Time
Segment ID Speed ProfileSegment
TypeSegment Length (ft) Radius (ft)
Super- elevation,
e
Side Friction Factor, f
(a)Vmax (mph)
Initial Velocity, Vo (mph)
Uncon- strained
(b)
Con-strained
(c)
At End of Segment
(d)
Distance (ft) (e)
Time (s) (f)
Distance (ft)
Time (sec) (g)
Segment (s)
Cumulative (s)
Cumulative (min)
Average Speed on Segment
(mph)# X T or C # # # #
1-2 E T 1,025 n.a. 0.0 55.4 15.0 0.0 75.2 6.8 949.6 43.2 50.0 50.0 0.83 14.02-3 E C 51 27 0.04 0.19 9.7 0.0 12.3 9.7 9.7 31.3 4.4 19.4 1.4 5.8 55.8 0.93 6.03-5 E T 424 n.a. 9.7 36.9 15.0 11.3 43.9 2.4 380.3 17.3 19.7 75.5 1.26 14.75-7 E C 106 37 0.04 0.19 11.3 11.3 21.1 11.3 11.3 0.0 0.0 105.9 6.4 6.4 81.9 1.36 11.37-9 E T 504 n.a. 11.3 40.4 15.0 0.0 32.7 1.7 471.1 21.4 23.1 105.0 1.75 14.99-11 E C 95 37 0.04 0.19 11.3 0.0 16.9 11.3 11.3 42.4 5.1 53.1 3.2 8.3 113.3 1.89 7.811-13 E T 1,065 n.a. 11.3 57.6 15.0 0.0 32.8 1.7 1,032.2 46.9 48.6 161.9 2.70 14.913-15 E C 106 10 0.04 0.19 5.9 0.0 17.8 5.9 0.0 11.5 2.7 94.5 11.0 13.7 175.6 2.93 5.315-17 E T 322 n.a. 0.0 31.0 15.0 9.3 75.2 6.8 246.6 11.2 18.0 193.6 3.23 12.217-19 E C 39 25 0.04 0.19 9.3 9.3 14.3 9.3 9.3 0.0 0.0 39.3 2.9 2.9 196.5 3.28 9.319-21 E T 360 n.a. 9.3 34.1 15.0 15.0 46.5 2.6 313.4 14.2 16.9 213.4 3.56 14.621-23 E C 303 100 0.04 0.19 18.5 15.0 33.7 15.0 15.0 0.0 0.0 303.4 13.8 13.8 227.2 3.79 15.023-25 E T 2,854 n.a. 15.0 93.6 15.0 0.0 0.0 0.0 2,853.6 129.7 129.7 356.8 5.95 15.025-27 E C 39 25 0.04 0.19 9.3 0.0 10.8 9.3 9.3 28.7 4.2 10.5 0.8 5.0 361.8 6.03 5.427-29 E T 1,724 n.a. 9.3 72.4 15.0 15.0 46.5 2.6 1,677.1 76.2 78.8 440.7 7.34 14.9
TOTALS: 9,017 feet 20.5 466.57 41.15 8,550.00 399.52 440.66 7.341.71 miles 13.9 = avg speed (mph)
Key Assumptions: Speed Profilesmax speed A B C D E V (mph) f
Accel 1 30.00 3.22 3.22 3.22 3.22 3.22 ft/s2 40.00 0.15Accel 2 n.a. 1.84 1.84 1.84 1.84 1.84 ft/s2 50.00 0.14Adjstmnt n.a. 57% 57% 57% 57% 57% 60.00 0.12V veh max n.a. 55.00 35.00 25.00 20.00 15.00 mph 70.00 0.10
a. The friction factor "f" in the assumptions table represents AASHTO standards for general roadway traffic and is intended to provide general guidance for estimating friction factors for ARFF vehicles and driving conditionsb. Maximum speed attainable in segment ignoring vehicle or geometric limitations, V = sqrt(Vo
2 + 2ax), where x = distance and a = accelerationc. Maximum speed attainable considering vehicle and geometric limitationsd. Estimated speed at end of segment recognizing geometric limitations of the next roadway segmente. Distance travelled under constant acceleration, x = Vot + 0.5at2
f. Elapsed time under constant acceleration, t = (V-Vo)/ag. Elapsed time to travel distance x under constant velocity, t = x/v
B-5

ESTIMATED VEHICLE TRAVEL TIMES UNDER MAXIMUM ACCELERATION CAPABILITIESEvaluation of Structural Fire / EMS Response TimesWashington Dulles International Airport
Case: Site 1 (Existing Station 303) to Target Location 4Vehicle: EMS
Curve Data V (mph) During Acceleration During Constant V Time
Segment ID Speed ProfileSegment
TypeSegment
Length (ft) Radius (ft)
Super- elevation,
e
Side Friction Factor, f
(a)Vmax (mph)
Initial Velocity, Vo (mph)
Uncon- strained
(b)
Con-strained
(c)
At End of Segment
(d)
Distance (ft) (e)
Time (s) (f)
Distance (ft)
Time (sec) (g)
Segment (s)
Cumulative (s)
Cumulative (min)
Average Speed on Segment
(mph)# X T or C # # # #
1-2 E T 1,025 n.a. 0.0 55.4 15.0 0.0 75.2 6.8 949.6 43.2 50.0 50.0 0.83 14.02-3 E C 51 27 0.04 0.19 9.7 0.0 12.3 9.7 9.7 31.3 4.4 19.4 1.4 5.8 55.8 0.93 6.03-5 E T 424 n.a. 9.7 36.9 15.0 11.3 43.9 2.4 380.3 17.3 19.7 75.5 1.26 14.75-7 E C 106 37 0.04 0.19 11.3 11.3 21.1 11.3 11.3 0.0 0.0 105.9 6.4 6.4 81.9 1.36 11.37-9 E T 504 n.a. 11.3 40.4 15.0 0.0 32.7 1.7 471.1 21.4 23.1 105.0 1.75 14.99-11 E C 95 37 0.04 0.19 11.3 0.0 16.9 11.3 11.3 42.4 5.1 53.1 3.2 8.3 113.3 1.89 7.8
11-13 E T 1,065 n.a. 11.3 57.6 15.0 0.0 32.8 1.7 1,032.2 46.9 48.6 161.9 2.70 14.913-15 E C 106 10 0.04 0.19 5.9 0.0 17.8 5.9 0.0 11.5 2.7 94.5 11.0 13.7 175.6 2.93 5.315-17 E T 322 n.a. 0.0 31.0 15.0 9.3 75.2 6.8 246.6 11.2 18.0 193.6 3.23 12.217-19 E C 39 25 0.04 0.19 9.3 9.3 14.3 9.3 9.3 0.0 0.0 39.3 2.9 2.9 196.5 3.28 9.319-21 E T 360 n.a. 9.3 34.1 15.0 15.0 46.5 2.6 313.4 14.2 16.9 213.4 3.56 14.621-23 E C 303 100 0.04 0.19 18.5 15.0 33.7 15.0 15.0 0.0 0.0 303.4 13.8 13.8 227.2 3.79 15.023-25 E T 2,854 n.a. 15.0 93.6 15.0 0.0 0.0 0.0 2,853.6 129.7 129.7 356.8 5.95 15.025-31 E C 39 25 0.04 0.19 9.3 0.0 10.8 9.3 9.3 28.7 4.2 10.5 0.8 5.0 361.8 6.03 5.431-33 E T 375 n.a. 9.3 34.8 15.0 6.4 46.5 2.6 328.5 14.9 17.5 379.4 6.32 14.633-35 E C 19 12 0.04 0.19 6.4 6.4 9.9 6.4 6.4 0.0 0.0 18.8 2.0 2.0 381.4 6.36 6.435-37 E T 205 n.a. 6.4 25.6 15.0 9.1 61.4 3.9 143.6 6.5 10.4 391.8 6.53 13.437-39 E C 38 24 0.04 0.19 9.1 9.1 14.0 9.1 9.1 0.0 0.0 37.7 2.8 2.8 394.6 6.58 9.139-41 E T 158 n.a. 9.1 23.6 15.0 15.0 47.6 2.7 110.5 5.0 7.7 402.3 6.71 14.041-43 E C 156 100 0.04 0.19 18.5 15.0 26.3 15.0 15.0 0.0 0.0 155.8 7.1 7.1 409.4 6.82 15.043-45 E T 3,602 n.a. 15.0 104.9 15.0 9.1 0.0 0.0 3,602.4 163.7 163.7 573.1 9.55 15.045-47 E C 38 24 0.04 0.19 9.1 9.1 14.0 9.1 9.1 0.0 0.0 37.7 2.8 2.8 576.0 9.60 9.147-49 E T 135 n.a. 9.1 22.0 15.0 15.0 47.6 2.7 87.0 4.0 6.6 582.6 9.71 13.849-51 E C 219 140 0.04 0.19 21.9 15.0 29.7 15.0 15.0 0.0 0.0 219.1 10.0 10.0 592.6 9.88 15.051-53 E C 59 182 0.04 0.19 25.0 15.0 20.0 15.0 15.0 0.0 0.0 58.7 2.7 2.7 595.2 9.92 15.053-55 E T 135 n.a. 15.0 25.1 15.0 13.5 0.0 0.0 135.0 6.1 6.1 601.4 10.02 15.055-57 E C 42 53 0.04 0.19 13.5 13.5 17.6 13.5 13.5 0.0 0.0 42.3 2.1 2.1 603.5 10.06 13.557-59 E T 24 n.a. 13.5 15.9 15.0 9.1 14.3 0.7 9.3 0.4 1.1 604.6 10.08 14.559-61 E C 38 24 0.04 0.19 9.1 9.1 14.0 9.1 9.1 0.0 0.0 37.7 2.8 2.8 607.4 10.12 9.161-63 E T 2,151 n.a. 9.1 80.7 15.0 15.0 47.6 2.7 2,103.1 95.6 98.3 705.7 11.76 14.9
TOTALS: 14,685 feet 20.8 685.06 53.82 14,000.00 651.89 705.71 11.762.78 miles 14.2 = avg speed (mph)
Key Assumptions: Speed Profilesmax speed A B C D E V (mph) f
Accel 1 30.00 3.22 3.22 3.22 3.22 3.22 ft/s2 40.00 0.15Accel 2 n.a. 1.84 1.84 1.84 1.84 1.84 ft/s2 50.00 0.14Adjstmnt n.a. 57% 57% 57% 57% 57% 60.00 0.12V veh max n.a. 55.00 35.00 25.00 20.00 15.00 mph 70.00 0.10
a. The friction factor "f" in the assumptions table represents AASHTO standards for general roadway traffic and is intended to provide general guidance for estimating friction factors for ARFF vehicles and driving conditionsb. Maximum speed attainable in segment ignoring vehicle or geometric limitations, V = sqrt(Vo
2 + 2ax), where x = distance and a = accelerationc. Maximum speed attainable considering vehicle and geometric limitationsd. Estimated speed at end of segment recognizing geometric limitations of the next roadway segmente. Distance travelled under constant acceleration, x = Vot + 0.5at2
f. Elapsed time under constant acceleration, t = (V-Vo)/ag. Elapsed time to travel distance x under constant velocity, t = x/v
B-6

ESTIMATED VEHICLE TRAVEL TIMES UNDER MAXIMUM ACCELERATION CAPABILITIESEvaluation of Structural Fire / EMS Response TimesWashington Dulles International Airport
Case: Site 1 (Existing Station 303) to Target Location 5Vehicle: EMS
Curve Data V (mph) During Acceleration During Constant V Time
Segment ID Speed ProfileSegment
TypeSegment Length (ft) Radius (ft)
Super- elevation,
e
Side Friction Factor, f
(a)Vmax (mph)
Initial Velocity, Vo (mph)
Uncon- strained
(b)
Con-strained
(c)
At End of Segment
(d)
Distance (ft) (e)
Time (s) (f)
Distance (ft)
Time (sec) (g)
Segment (s)
Cumulative (s)
Cumulative (min)
Average Speed on Segment
(mph)# X T or C # # # #
1-2 E T 1,025 n.a. 0.0 55.4 15.0 0.0 75.2 6.8 949.6 43.2 50.0 50.0 0.83 14.02-3 E C 51 27 0.04 0.19 9.7 0.0 12.3 9.7 9.7 31.3 4.4 19.4 1.4 5.8 55.8 0.93 6.03-5 E T 424 n.a. 9.7 36.9 15.0 11.3 43.9 2.4 380.3 17.3 19.7 75.5 1.26 14.75-7 E C 106 37 0.04 0.19 11.3 11.3 21.1 11.3 11.3 0.0 0.0 105.9 6.4 6.4 81.9 1.36 11.37-9 E T 504 n.a. 11.3 40.4 15.0 0.0 32.7 1.7 471.1 21.4 23.1 105.0 1.75 14.99-11 E C 95 37 0.04 0.19 11.3 0.0 16.9 11.3 11.3 42.4 5.1 53.1 3.2 8.3 113.3 1.89 7.8
11-13 E T 1,065 n.a. 11.3 57.6 15.0 0.0 32.8 1.7 1,032.2 46.9 48.6 161.9 2.70 14.913-15 E C 106 10 0.04 0.19 5.9 0.0 17.8 5.9 0.0 11.5 2.7 94.5 11.0 13.7 175.6 2.93 5.315-17 E T 322 n.a. 0.0 31.0 15.0 15.0 75.2 6.8 246.6 11.2 18.0 193.6 3.23 12.217-65 E T 435 n.a. 15.0 39.1 15.0 15.0 0.0 0.0 435.1 19.8 19.8 213.4 3.56 15.065-67 E C 363 932 0.04 0.19 55.0 15.0 36.2 15.0 15.0 0.0 0.0 363.2 16.5 16.5 229.9 3.83 15.067-69 E T 167 n.a. 15.0 26.9 15.0 15.0 0.0 0.0 167.3 7.6 7.6 237.5 3.96 15.069-71 E T 489 n.a. 15.0 41.1 15.0 12.3 0.0 0.0 489.4 22.2 22.2 259.8 4.33 15.071-73 E C 23 44 0.04 0.19 12.3 12.3 14.8 12.3 12.3 0.0 0.0 22.6 1.2 1.2 261.0 4.35 12.373-75 E C 259 593 0.04 0.19 45.1 12.3 30.5 15.0 0.0 24.4 1.2 234.7 10.7 11.9 272.9 4.55 14.975-81 E C 68 10 0.04 0.19 5.9 0.0 14.2 5.9 5.9 11.5 2.7 56.2 6.5 9.2 282.1 4.70 5.081-83 E T 1,896 n.a. 5.9 75.5 15.0 11.7 63.7 4.2 1,831.9 83.3 87.4 369.5 6.16 14.883-85 E C 61 40 0.04 0.19 11.7 11.7 17.9 11.7 11.7 0.0 0.0 61.1 3.6 3.6 373.1 6.22 11.785-87 E T 105 n.a. 11.7 21.3 15.0 10.8 29.2 1.5 76.0 3.5 4.9 378.0 6.30 14.587-89 E C 52 34 0.04 0.19 10.8 10.8 16.5 10.8 10.8 0.0 0.0 51.9 3.3 3.3 381.3 6.35 10.889-91 E T 557 n.a. 10.8 42.2 15.0 12.4 35.9 1.9 521.0 23.7 25.6 406.8 6.78 14.891-93 E C 71 45 0.04 0.19 12.4 12.4 19.1 12.4 12.4 0.0 0.0 70.5 3.9 3.9 410.7 6.85 12.493-95 E C 63 50 0.04 0.19 13.1 12.4 18.5 13.1 13.1 6.0 0.3 57.4 3.0 3.3 414.0 6.90 13.195-97 E T 992 n.a. 13.1 56.0 15.0 0.0 17.8 0.9 973.7 44.2 45.1 459.1 7.65 15.097-99 E C 121 10 0.04 0.19 5.9 0.0 19.0 5.9 5.9 11.5 2.7 109.3 12.7 15.4 474.5 7.91 5.499-101 E T 504 n.a. 5.9 39.3 15.0 0.0 63.7 4.2 440.6 20.0 24.2 498.7 8.31 14.2101-103 E C 150 10 0.04 0.19 5.9 0.0 21.2 5.9 5.9 11.5 2.7 138.2 16.1 18.7 517.4 8.62 5.4103-105 E T 209 149 0.04 0.19 n.a. 5.9 25.7 15.0 15.0 63.7 4.2 145.1 6.6 10.8 528.2 8.80 13.2105-107 E T 1,081 n.a. 15.0 58.8 15.0 13.5 0.0 0.0 1,080.7 49.1 49.1 577.3 9.62 15.0107-109 E C 52 53 0.04 0.19 13.5 13.5 18.4 13.5 13.5 0.0 0.0 52.4 2.7 2.7 579.9 9.67 13.5109-111 E T 2,838 n.a. 13.5 93.1 15.0 15.0 14.7 0.7 2,823.2 128.3 129.0 709.0 11.82 15.0111-113 E C 300 1,135 0.04 0.19 55.0 15.0 33.5 15.0 15.0 0.0 0.0 300.0 13.6 13.6 722.6 12.04 15.0113-115 E T 217 n.a. 15.0 29.6 15.0 0.0 0.0 0.0 216.7 9.9 9.9 732.4 12.21 15.0115-117 E C 75 54 0.04 0.19 13.6 0.0 15.0 13.6 13.6 61.9 6.2 12.9 0.6 6.8 739.3 12.32 7.4117-119 E C 242 281 0.04 0.19 31.1 13.6 30.1 15.0 15.0 13.3 0.6 228.3 10.4 11.0 750.3 12.50 15.0119-121 E T 482 n.a. 15.0 40.8 15.0 9.3 0.0 0.0 482.3 21.9 21.9 772.2 12.87 15.0121-123 E C 188 311 0.04 0.19 32.7 9.3 25.5 15.0 15.0 46.5 2.6 141.7 6.4 9.0 781.3 13.02 14.2123-125 E T 3,003 n.a. 15.0 96.0 15.0 15.0 0.0 0.0 3,002.9 136.5 136.5 917.7 15.30 15.0125-127 E C 1,584 342 0.04 0.19 34.3 15.0 70.5 15.0 15.0 0.0 0.0 1,583.9 72.0 72.0 989.7 16.49 15.0127-129 E T 1,474 n.a. 15.0 68.1 15.0 15.0 0.0 0.0 1,474.0 67.0 67.0 1,056.7 17.61 15.0129-131 E C 39 25 0.04 0.19 9.3 15.0 18.5 9.3 9.3 0.0 0.0 39.3 2.9 2.9 1,059.6 17.66 9.3129-29 E T 2,293 n.a. 9.3 83.4 15.0 15.0 46.5 2.6 2,246.8 102.1 104.7 1,164.3 19.40 14.9
TOTALS: 24,150 feet 20.7 866.66 70.75 23,283.00 1,093.54 1,164.29 19.404.57 miles 14.1 = avg speed (mph)
Key Assumptions: Speed Profilesmax speed A B C D E V (mph) f
Accel 1 30.00 3.22 3.22 3.22 3.22 3.22 ft/s2 40.00 0.15Accel 2 n.a. 1.84 1.84 1.84 1.84 1.84 ft/s2 50.00 0.14Adjstmnt n.a. 57% 57% 57% 57% 57% 60.00 0.12V veh max n.a. 55.00 35.00 25.00 20.00 15.00 mph 70.00 0.10
a. The friction factor "f" in the assumptions table represents AASHTO standards for general roadway traffic and is intended to provide general guidance for estimating friction factors for ARFF vehicles and driving conditionsb. Maximum speed attainable in segment ignoring vehicle or geometric limitations, V = sqrt(Vo
2 + 2ax), where x = distance and a = accelerationc. Maximum speed attainable considering vehicle and geometric limitationsd. Estimated speed at end of segment recognizing geometric limitations of the next roadway segmente. Distance travelled under constant acceleration, x = Vot + 0.5at2
f. Elapsed time under constant acceleration, t = (V-Vo)/ag. Elapsed time to travel distance x under constant velocity, t = x/v
B-7

ESTIMATED VEHICLE TRAVEL TIMES UNDER MAXIMUM ACCELERATION CAPABILITIESEvaluation of Structural Fire / EMS Response TimesWashington Dulles International Airport
Case: Site 2 to Target Location 1Vehicle: EMS
Curve Data V (mph) During Acceleration During Constant V Time
Segment ID Speed ProfileSegment
TypeSegment
Length (ft) Radius (ft)
Super- elevation,
e
Side Friction Factor, f
(a)Vmax (mph)
Initial Velocity, Vo (mph)
Uncon- strained
(b)
Con-strained
(c)
At End of Segment
(d)
Distance (ft) (e)
Time (s) (f)
Distance (ft)
Time (sec) (g)
Segment (s)
Cumulative (s)
Cumulative (min)
Average Speed on Segment
(mph)# X T or C # # # #
1-2 E T 1,025 n.a. 0.0 55.4 15.0 0.0 75.2 6.8 949.6 43.2 50.0 50.0 0.83 14.02-3 E C 51 27 0.04 0.19 9.7 0.0 12.3 9.7 9.7 31.3 4.4 19.4 1.4 5.8 55.8 0.93 6.03-5 E T 424 n.a. 9.7 36.9 15.0 11.3 43.9 2.4 380.3 17.3 19.7 75.5 1.26 14.75-7 E C 106 37 0.04 0.19 11.3 11.3 21.1 11.3 11.3 0.0 0.0 105.9 6.4 6.4 81.9 1.36 11.37-9 E T 504 n.a. 11.3 40.4 15.0 0.0 32.7 1.7 471.1 21.4 23.1 105.0 1.75 14.9
9-11 E C 95 37 0.04 0.19 11.3 0.0 16.9 11.3 11.3 42.4 5.1 53.1 3.2 8.3 113.3 1.89 7.811-13 E T 1,065 n.a. 11.3 57.6 15.0 0.0 32.8 1.7 1,032.2 46.9 48.6 161.9 2.70 14.913-15 E C 106 10 0.04 0.19 5.9 0.0 17.8 5.9 0.0 11.5 2.7 94.5 11.0 13.7 175.6 2.93 5.315-17 E T 322 n.a. 0.0 31.0 15.0 15.0 75.2 6.8 246.6 11.2 18.0 193.6 3.23 12.217-65 E T 435 n.a. 15.0 39.1 15.0 15.0 0.0 0.0 435.1 19.8 19.8 213.4 3.56 15.065-67 E C 363 932 0.04 0.19 55.0 15.0 36.2 15.0 15.0 0.0 0.0 363.2 16.5 16.5 229.9 3.83 15.067-69 E T 167 n.a. 15.0 26.9 15.0 15.0 0.0 0.0 167.3 7.6 7.6 237.5 3.96 15.069-71 E T 489 n.a. 15.0 41.1 15.0 12.3 0.0 0.0 489.4 22.2 22.2 259.8 4.33 15.071-73 E C 23 44 0.04 0.19 12.3 12.3 14.8 12.3 12.3 0.0 0.0 22.6 1.2 1.2 261.0 4.35 12.373-75 E C 259 593 0.04 0.19 45.1 12.3 30.5 15.0 0.0 24.4 1.2 234.7 10.7 11.9 272.9 4.55 14.975-81 E C 68 10 0.04 0.19 5.9 0.0 14.2 5.9 5.9 11.5 2.7 56.2 6.5 9.2 282.1 4.70 5.081-83 E T 1,896 n.a. 5.9 75.5 15.0 11.7 63.7 4.2 1,831.9 83.3 87.4 369.5 6.16 14.883-85 E C 61 40 0.04 0.19 11.7 11.7 17.9 11.7 11.7 0.0 0.0 61.1 3.6 3.6 373.1 6.22 11.785-87 E T 105 n.a. 11.7 21.3 15.0 10.8 29.2 1.5 76.0 3.5 4.9 378.0 6.30 14.587-89 E C 52 34 0.04 0.19 10.8 10.8 16.5 10.8 10.8 0.0 0.0 51.9 3.3 3.3 381.3 6.35 10.889-91 E T 557 n.a. 10.8 42.2 15.0 12.4 35.9 1.9 521.0 23.7 25.6 406.8 6.78 14.891-93 E C 71 45 0.04 0.19 12.4 12.4 19.1 12.4 12.4 0.0 0.0 70.5 3.9 3.9 410.7 6.85 12.493-95 E C 63 50 0.04 0.19 13.1 12.4 18.5 13.1 13.1 6.0 0.3 57.4 3.0 3.3 414.0 6.90 13.195-97 E T 992 n.a. 13.1 56.0 15.0 0.0 17.8 0.9 973.7 44.2 45.1 459.1 7.65 15.097-99 E C 121 10 0.04 0.19 5.9 0.0 19.0 5.9 5.9 11.5 2.7 109.3 12.7 15.4 474.5 7.91 5.4
99-101 E T 504 n.a. 5.9 39.3 15.0 0.0 63.7 4.2 440.6 20.0 24.2 498.7 8.31 14.2101-103 E C 150 10 0.04 0.19 5.9 0.0 21.2 5.9 5.9 11.5 2.7 138.2 16.1 18.7 517.4 8.62 5.4103-105 E T 209 149 0.04 0.19 n.a. 5.9 25.7 15.0 15.0 63.7 4.2 145.1 6.6 10.8 528.2 8.80 13.2105-107 E T 1,081 n.a. 15.0 58.8 15.0 13.5 0.0 0.0 1,080.7 49.1 49.1 577.3 9.62 15.0107-109 E C 52 53 0.04 0.19 13.5 13.5 18.4 13.5 13.5 0.0 0.0 52.4 2.7 2.7 579.9 9.67 13.5109-111 E T 2,838 n.a. 13.5 93.1 15.0 15.0 14.7 0.7 2,823.2 128.3 129.0 709.0 11.82 15.0111-113 E C 300 1,135 0.04 0.19 55.0 15.0 33.5 15.0 15.0 0.0 0.0 300.0 13.6 13.6 722.6 12.04 15.0113-115 E T 217 n.a. 15.0 29.6 15.0 0.0 0.0 0.0 216.7 9.9 9.9 732.4 12.21 15.0115-133 E C 107 10 0.04 0.19 5.9 0.0 17.9 5.9 5.9 11.5 2.7 95.7 11.1 13.8 746.2 12.44 5.3133-135 E T 378 n.a. 5.9 34.1 15.0 15.0 63.7 4.2 314.5 14.3 18.5 764.7 12.74 14.0135-137 E C 288 1,318 0.04 0.19 55.0 15.0 33.0 15.0 15.0 0.0 0.0 287.9 13.1 13.1 777.8 12.96 15.0137-139 E T 1,146 n.a. 15.0 60.4 15.0 14.3 0.0 0.0 1,145.7 52.1 52.1 829.8 13.83 15.0139-141 E C 97 59 0.04 0.19 14.3 14.3 22.3 14.3 14.3 0.0 0.0 97.2 4.6 4.6 834.5 13.91 14.3141-143 E T 116 n.a. 14.3 23.5 15.0 15.0 6.9 0.3 109.0 5.0 5.3 839.7 14.00 15.0143-145 E C 208 275 0.04 0.19 30.7 15.0 29.1 15.0 15.0 0.0 0.0 207.7 9.4 9.4 849.2 14.15 15.0145-147 E T 1,246 n.a. 15.0 62.9 15.0 13.1 0.0 0.0 1,246.5 56.6 56.6 905.8 15.10 15.0147-149 E C 35 50 0.04 0.19 13.1 13.1 16.6 13.1 13.1 0.0 0.0 34.6 1.8 1.8 907.6 15.13 13.1149-63 E T 4,524 n.a. 13.1 117.1 15.0 15.0 17.7 0.9 4,506.2 204.8 205.6 1,113.3 18.55 15.0
TOTALS: 22,914 feet 20.6 798.36 66.71 22,115.95 1,046.56 1,113.27 18.554.34 miles 14.0 = avg speed (mph)
Key Assumptions: Speed Profilesmax speed A B C D E V (mph) f
Accel 1 30.00 3.22 3.22 3.22 3.22 3.22 ft/s2 40.00 0.15Accel 2 n.a. 1.84 1.84 1.84 1.84 1.84 ft/s2 50.00 0.14Adjstmnt n.a. 57% 57% 57% 57% 57% 60.00 0.12V veh max n.a. 55.00 35.00 25.00 20.00 15.00 mph 70.00 0.10
a. The friction factor "f" in the assumptions table represents AASHTO standards for general roadway traffic and is intended to provide general guidance for estimating friction factors for ARFF vehicles and driving conditionsb. Maximum speed attainable in segment ignoring vehicle or geometric limitations, V = sqrt(Vo
2 + 2ax), where x = distance and a = accelerationc. Maximum speed attainable considering vehicle and geometric limitationsd. Estimated speed at end of segment recognizing geometric limitations of the next roadway segmente. Distance travelled under constant acceleration, x = Vot + 0.5at2
f. Elapsed time under constant acceleration, t = (V-Vo)/ag. Elapsed time to travel distance x under constant velocity, t = x/v
B-8