ward profile 2018: chadderton south · both violence without injury and violence with injury has...
TRANSCRIPT

Ward Profile 2018: Chadderton South
Produced by Oldham Council’s Business Intelligence Service


There has been a marginal increase in the overall population since
the turn of the millennium, however there is a decreasing figure of
children under the age 16 years in the borough whilst the adults
older than 65 years age bracket has grown by 8% since the 2001
census.
Chadderton South maintains a high proportion of White residents
within the ward (nine in ten people). Both Pakistani and
Bangladeshi communities show increasing numbers, but both are
far below the Oldham average.
Ethnic Composition Source: ONS Census 2011
% White
2011 (2001)
% Pakistani
2011 (2001)
% Bangladeshi
2011 (2001)
% Other non-white
Chadderton S 91.1 (96.1) 2.2 (1.1) 1.7 (0.4) 5.0 (2.3)
Oldham 79.5 (87.1) 9.1 (5.9) 6.6 (4.1) 4.9 (2.9)
England 85.4 (90.9) 2.1 (1.4) 0.8 (0.6) 11.7 (7.1)
Population
11,090 49.9% 50.1% 2016 Population Male Population Female Population 0.6% Increase since 2011 Oldham Male Population; 49.3% Oldham Female Population; 50.7%

Chadderton South has a higher percent of people in employment
(62.4%) than the Oldham borough (58.2%) and England (62.1%)
averages, with a strong percentage in full-time hours. However the
ward has a small percentage of self-employed residents, which is
joint third lowest in the borough.
The total Out of Work Benefits received percentages are virtually on
par with the borough average of 17.7%.
Whilst there are strong employment figures, but with a mid-level
percentage of dependency on benefits, the median household
income for Chadderton South is £23,572, which is 4.4% lower than
the Oldham average.
Economic Status Aged 16-74 years old; Source ONS Census 2011
Oldham
%
England
%
Chadderton South
# %
Part-time 1,124 14.1 13.9 13.7
Full-time 3,373 42.4 36.6 38.6
Self employed 466 5.9 7.8 9.8
Employed 4,963 62.4 58.2 62.1
Out of Work Benefit Claimants
Aged 16-64 years olds; Source: DWP 2018
Oldham
%
England
%
Chadderton South
# %
Unemployment (JSA)
24 0.3 0.4 0.8
Employment Support Allowance
(ESA) 489 6.9 6.6 5.3
Universal Credit 741 10.7 10.7 3.2
Total Out of Work
Benefit Claimants 1,244 17.9 17.7 9.3
Economy and Income
£23,572 62.4% 17.9% Median Household Income Employment Rate Out of Work Benefit Claimants Oldham average; £24,652 Oldham average; 58.2% Oldham average; 17.7%

Chadderton South is second smallest ward (2.313 KM2) yet has the
fifth highest amount of households (4,932) in the 20 wards.
Since 2001, Chadderton South’s housing stock has seen a
decrease in the proportion of owner occupied properties and an
increase in private rented properties. This closely matches the
pattern taking place across Oldham as a whole.
The percentage of households in Fuel Poverty (13.3%) is above the
Oldham average. Half of households (51%) can afford to keep their
house in a decent state of repair which is slightly below the Oldham
average and, one in five (21%) households have a pre-payment
energy meter which is in line with the average for Oldham.
Housing Tenure
Source: ONS Census 2011
2011 2001
% Owner
occupied
% Social
rented
% Private
rented
% Owner
occupied
% Social
rented
% Private
rented
Chadderton S 67.3 19.7 12.1 70.8 20.8 5.8
Oldham 65.3 21.1 12.2 68.4 22.9 5.5
England 64.1 17.7 16.8 68.7 19.3 8.8
Housing Source: Oldham Council 2017 ‘You and Your Community Survey 2013’
Chadderton S
%
Oldham
%
Vacant Properties 3.4 3.2
Claiming Council Tax Reduction
and/or Housing Benefit 22.5 25.1
Can Afford to Keep House in
Decent State of Repair 51 54
Pre-payment Energy Meters 21 20
Housing
4,932 13.3% £110,071 Number of Households Households in Fuel Poverty Average Sold House Price Chadderton South Area; 2.313 KM
2 Oldham average; 12.1% Oldham average; £123,500

The national housing composition is 51.2% of all households having
either a married couple or a couple cohabiting. Chadderton South is
slightly below this figure with 49.0%; conversely there are high rates
of lone parent households.
The children’s composition in Chadderton South (37.6%) is slightly
below the Oldham’s average (39.3%) and the percentage of
children living in low income families (19.3%) is below the Oldham
average of 21.6%, but still around one in five children.
Household Composition
Chadderton
South %
Oldham
%
England
%
Single Person Households (aged under 65) 16.7 17.1 17.9
Single Person Households (aged 65 plus) 14.0 12.8 12.4
Married Couples 36.8 39.7 41.3
Cohabiting Couples 12.2 10.2 9.9
Lone Parents (with Dependent Children) 9.8 9.1 7.1
Lone Parents (without Dependent Children) 4.3 4.0 3.5
Other 6.3 7.1 8.0
Household Composition
30.7% 14.1% 6.3% Single Person Households Lone Parent Households Overcrowded Households Oldham average; 30.3% Oldham average; 13.1% Oldham average; 7.5%

65.6% 31.8% 14.0% Early Years ‘Good Development’ Adults with No Qualifications Adults with Degrees Oldham average; 63.7% Oldham average; 29.6% Oldham average; 18.6%
Chadderton South Reception age pupils achieve a Good Level of
Development (65.6%) at a rate marginally above (65.6%) the Old-
ham average(63.7%). A higher percentage of girls (68.1%) achiev-
ing this mark than the boys (62.9%) in the ward, however the girls
are below the borough average (72.3%) whereas the boys are scor-
ing higher than borough (54.9%).
GCSE results are marginally below borough averages, and in par-
ticular a very high 4.7% of pupils leave with no qualifications. This is
likely to be connected with the ward having the third highest NEET
score at 4.4%.
GCSE Results 2017 Source: B.I.S.
Chadderton S
%
Oldham
%
England
%
GCSE Attainment 8 score 39.4 43.1 44.2
Attaining Grade 4 or above in
English and Maths GCSEs 56.1 58.5 59.1
No GCSE passes 4.7 2.6 2.0
Education and Skills

Residents of Chadderton South have similar levels of long term
health problems and life expectancy to the Oldham averages.
The health behaviours scores for Smoking and Hospital stays for
alcohol related harm are on par with the Oldham average, but moth-
ers breastfeeding at 6-8 weeks (28.6%) is a noticeable variance to
the Oldham average (37.5%)
Similar to the health behaviours, health outcomes are comparable
to the Oldham borough. Child Obesity in Year 6 students is below
the Oldham average, but Reception Class it is above.
Health Behaviours Bridgewater 2017 / Experian 2018 / PHE 2011/12-2015/16
Chadderton S Oldham
Mothers breastfeeding at 6-8 weeks (%) 28.6 37.5
Smoking (%) 25.3 24.0
Hospital stays for alcohol related harm (rate) 122.6 123.1
Health Outcomes
Hospital Episode Statistics 2008-13 / Public Health England 2008-12
Chadderton S Oldham
Emergency hospital admissions -all causes (rate) 133.6 132.2
Emergency hospital admissions -CHD (rate) 125.7 130.9
A&E attendances in under 5’s (rate) 565.3 579.7
Under 75 deaths all causes (rate) 121.7 129.0
Under 75 deaths for cancer (rate) 113.1 123.0
Health
16.5% 78.8 81.9 Long-Term Health Problems Male Life Expectancy Female Life Expectancy Oldham average; 16.3% Oldham average; 77.2 Oldham average; 80.9

Chadderton South has had a noticeable reduction in Anti-Social
Behaviour down 34.5% to 279 now ranked sixth in the borough.
Crimes Committed has marginally risen by 2.8% with large
decreases of Burglary Other (52.2%) and also decreases for Theft
(26.6%), Criminal Damage (17.8%) and Vehicle Crime (5.5%).
Both Violence Without Injury and Violence With Injury has
increased by 11.8% and 8.2% respectively, but these crimes has
risen throughout the borough by 51.6% and 16.6%.
Crime Statistics
Rates per 10,000 population; Source: GMP
Chadderton South
2017 2016
Oldham
2017 2016
Burglary In Dwelling 57.7 45.0 56.1 63.9
Burglary Other 19.8 41.4 26.8 62.0
Criminal Damage 120.8 146.8 106.4 122.5
Theft 137.1 186.5 113.0 163.2
Vehicle Crime 93.8 99.1 69.0 61.1
Violence With Injury 71.2 65.8 75.8 43.5
Violence Without Injury 162.3 145.0 187.8 145.4
Total Crime 893.5 868.4 829.7 816.8
Crime
991 279 180 Crimes Committed Anti-Social Behaviour Violence Without Injury 2.8% Increase Year on Year Oldham average; 344 11.8% Increase Year on Year
Most Committed Crimes 2017
Violence Without Injury 180
Public Order Offences 170
Criminal Damage 134
Vehicle 104
All Other Theft 91
Source: GMP
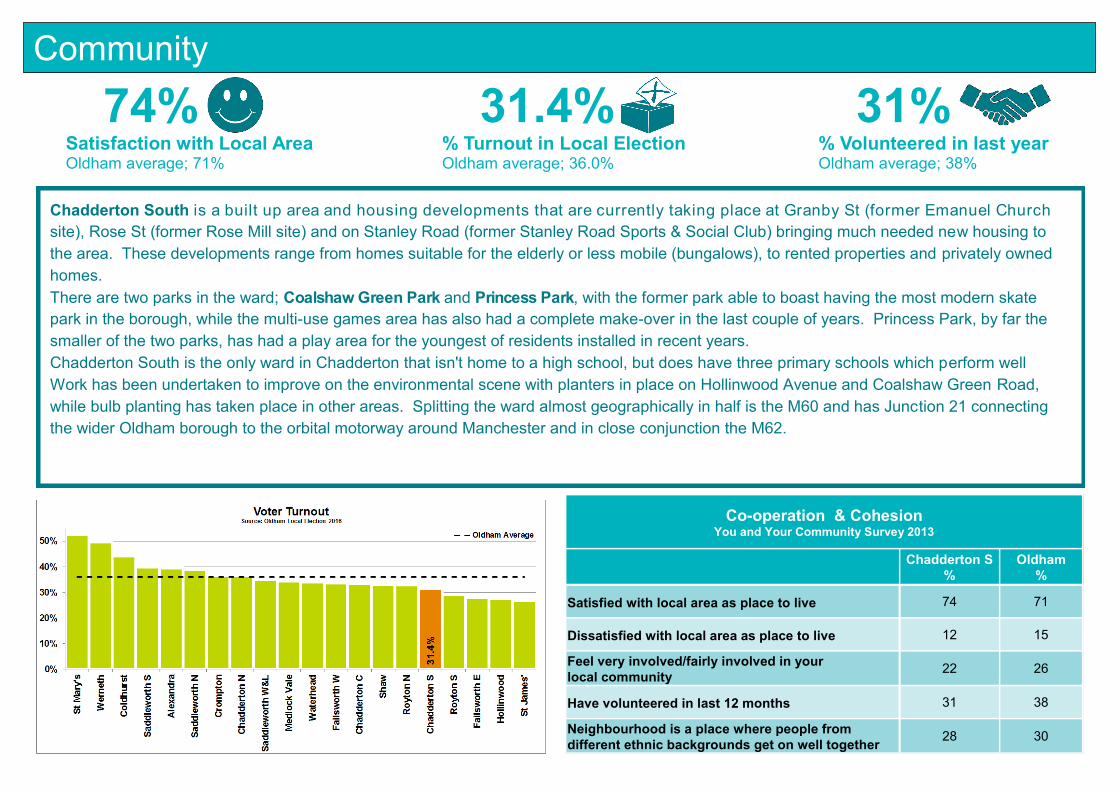
Chadderton South is a built up area and housing developments that are currently taking place at Granby St (former Emanuel Church
site), Rose St (former Rose Mill site) and on Stanley Road (former Stanley Road Sports & Social Club) bringing much needed new housing to
the area. These developments range from homes suitable for the elderly or less mobile (bungalows), to rented properties and privately owned
homes.
There are two parks in the ward; Coalshaw Green Park and Princess Park, with the former park able to boast having the most modern skate
park in the borough, while the multi-use games area has also had a complete make-over in the last couple of years. Princess Park, by far the
smaller of the two parks, has had a play area for the youngest of residents installed in recent years.
Chadderton South is the only ward in Chadderton that isn't home to a high school, but does have three primary schools which perform well
Work has been undertaken to improve on the environmental scene with planters in place on Hollinwood Avenue and Coalshaw Green Road,
while bulb planting has taken place in other areas. Splitting the ward almost geographically in half is the M60 and has Junction 21 connecting
the wider Oldham borough to the orbital motorway around Manchester and in close conjunction the M62.
Co-operation & Cohesion You and Your Community Survey 2013
Chadderton S
%
Oldham
%
Satisfied with local area as place to live 74 71
Dissatisfied with local area as place to live 12 15
Feel very involved/fairly involved in your
local community 22 26
Have volunteered in last 12 months 31 38
Neighbourhood is a place where people from
different ethnic backgrounds get on well together 28 30
Community
74% 31.4% 31% Satisfaction with Local Area % Turnout in Local Election % Volunteered in last year Oldham average; 71% Oldham average; 36.0% Oldham average; 38%

Further Information
For further information on the 2018 Ward Profiles, please contact the Business Intelligence Service on: [email protected] To download the full dataset used for the 2018 Ward Profiles please use the link below and click on ward profile data. Each individual profile can al-so be downloaded from the neighbourhood pages.
Research and statistics about Oldham
Licensing ONS and Census statistics: Adapted from data from the Office for National Statistics licensed under the Open Government Licence v.3.0. Paycheck (household income) © CACI Limited. This report shall be not be used for commercial purposes. The applicable copyright notices can be found at http://www.caci.co.uk/copyrightnotices.pdf.
Sources
Population: Office for National Statistics (ONS) Census 2011.
Office for National Statistics (ONS) Mid Year estimates 2017.
Economy and Income: Department for Work and Pensions (DWP) Data 2018, Office for National Statistics (ONS) Census 2011,
CACI Paycheck data 2018.
Housing: Office of National Statistics (ONS) Census 2011, Land Registry 2017, You and Your Community
Survey, September 2013, Ipsos MORI, Oldham Council Benefits data 2018, Department for Energy and Climate Change (DECC) 2015.
Household Composition: HM Revenue and Customs 2016, Office for National Statistics (ONS) Census 2011.
Education: Oldham Council Business Intelligence Service 2018, Office for National Statistics (ONS) Census 2011,
Positive Steps 2018.
Health: Office for National Statistics (ONS) 2008-12, Mosaic (Experian ©) Sep 2018 households with 2013
propensities , Public Health England, Hospital Episodes 2008-13, Bridgewater 2017.
Crime: Greater Manchester Police (GMP) 2017
Cooperation and Community: You and Your Community Survey, September 2013, Ipsos MORI, Oldham Council Elections Data 2016