wake-up meeting hos peoplenet 5. september...
TRANSCRIPT
Wake-Up Meeting hos PeopleNet
5. september 2013
� Konsulent i justB� Underviser hos Orange Man� Initiativtager til MsBIP� Arbejdet med Microsoft BI i 7 år� Stærkt fokus på front-end◦ Analysis Services◦ Reporting Services◦ PerformancePoint Services◦ Excel og PowerPivot
� [email protected] / blog.justB.dk

� Hvad er Business Intelligence� SharePoint som BI portal� Services◦ PerformancePoint Services◦ Excel Services◦ Reporting Services integration◦ PowerPivot integration◦ Power View
� Hvad er fordele og ulemper ved de forskellige teknologier og hvordan kan de spille sammen
� BI i Office 365 / SharePoint Online
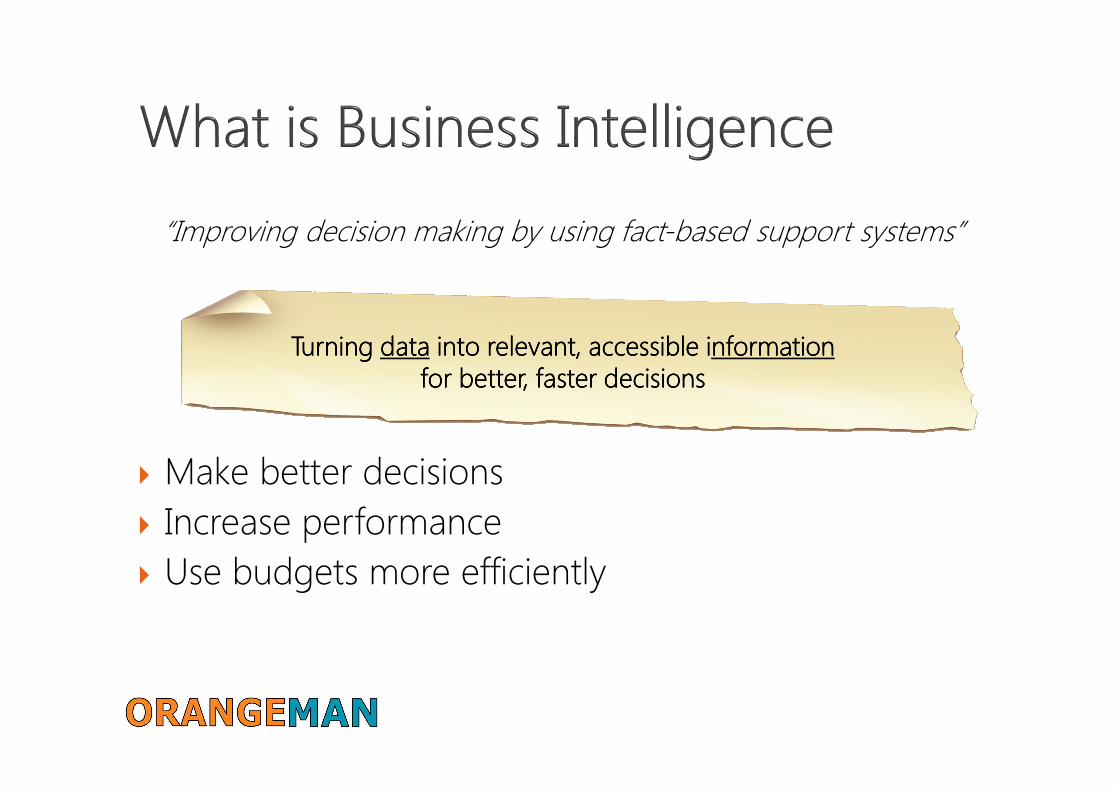
“Improving decision making by using fact-based support systems”
Turning Turning Turning Turning datadatadatadata into relevant, accessible iinto relevant, accessible iinto relevant, accessible iinto relevant, accessible informationnformationnformationnformationfor for for for better, faster decisionsbetter, faster decisionsbetter, faster decisionsbetter, faster decisions
� Make better decisions
� Increase performance
� Use budgets more efficiently

Static, Batch Reporting
Adhoc query& OLAP
Data Warehousing
Templates
Collaboration & Workflow
Event Monitoring
Data ModelsETL & Data
Quality
Dashboards & Visualization
Score CardsDW LifecycleManagement
AlteringPredictiveAnalysis
ProcessAwareness
Content Analysis
Matu
rity
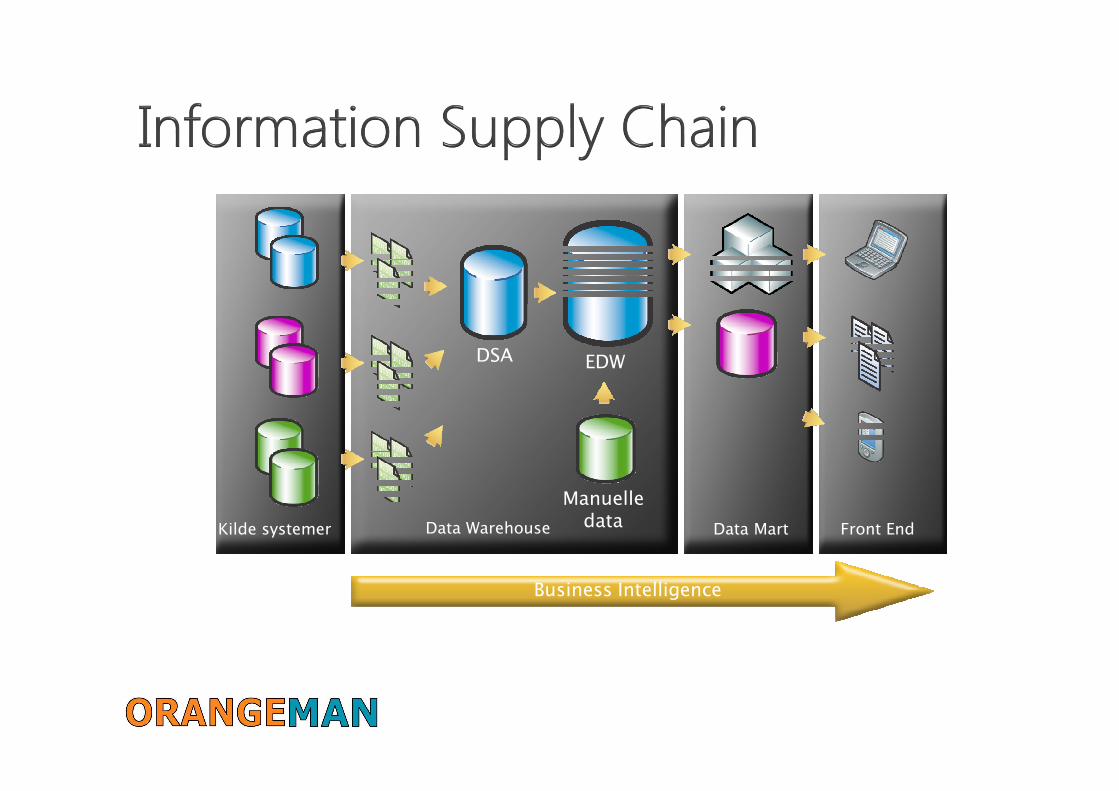
Front EndData WarehouseKilde systemer
DSA EDW
Manuelledata Data Mart
Business Intelligence
Kube specialistData ModellørETL udvikler Applikations udvikler
Analysis Services
Reporting Services
Integration Services
Master Data Services
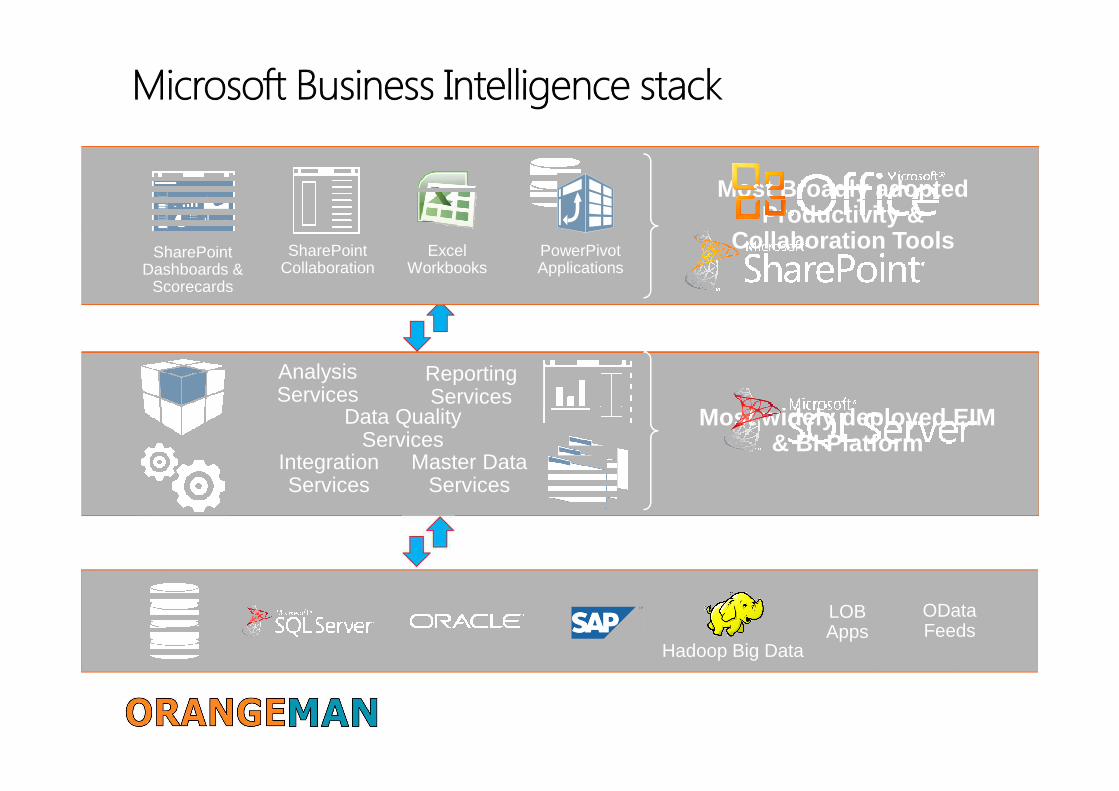
SharePointCollaboration
Excel Workbooks
PowerPivot Applications
SharePointDashboards &
Scorecards
Most widely deployed EIM & BI Platform
Most Broadly adopted Productivity &
Collaboration Tools
Data QualityServices
ODataFeeds
LOB Apps
Hadoop Big Data

The stack:The stack:The stack:The stack:Data Analysis with SQL
Analysis ServicesSQL ServerIntegration Services
The Tool:The Tool:The Tool:The Tool:End user exploration
ExcelPower ViewPowerPivot
The Tool:The Tool:The Tool:The Tool:Sharing
Excel ServicesVisio ServicesPerformancePoint

On-Premise and Cloud
Personal BI
You create your
own workbook and
use the rich
features of Excel to
interact with the
workbook and the
data it contains.
Self-Service
BI
You create your
workbook and
publish it to
SharePoint for
wider
consumption.
Corporate
BI
“Professionally”
authored using
SharePoint, Excel
Services, and
PerformancePoint.
Has lasting power.

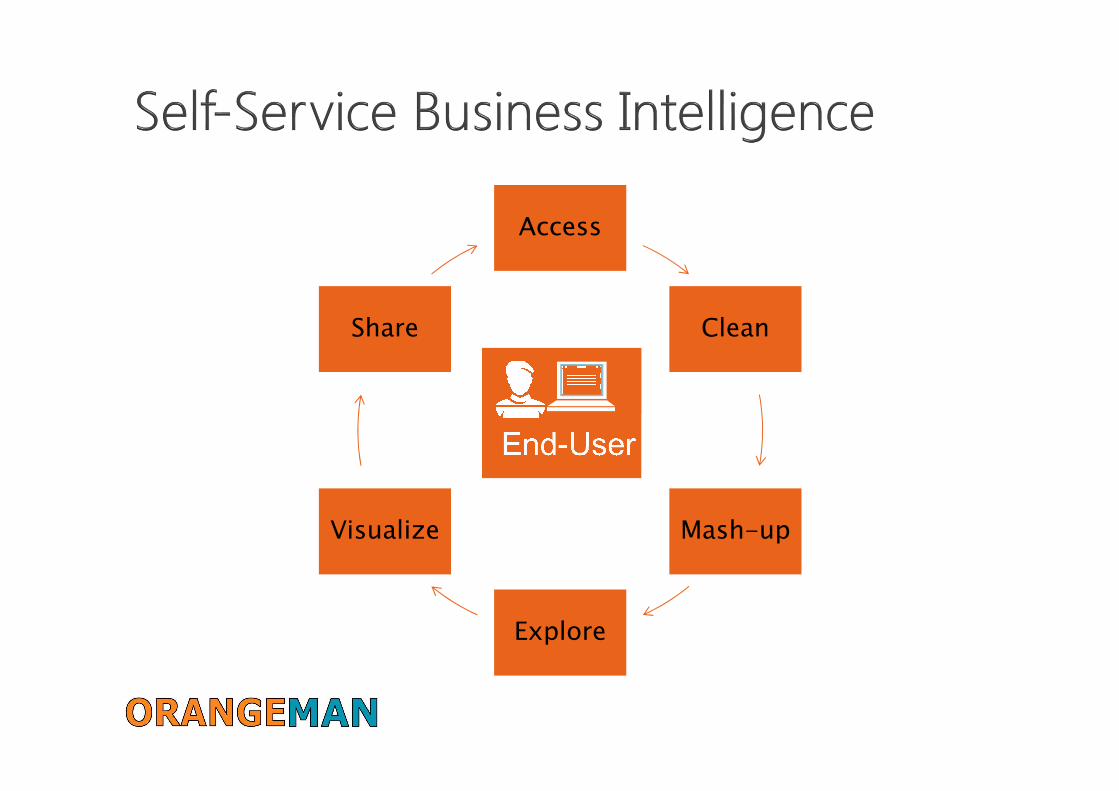
Access
Clean
Mash-up
Explore
Visualize
Share

� Business Intelligence Center◦ Just a site!
◦ Template - site definition
� Hvordan opbygges en BI portal i SharePoint?
� Skal man centralisere eller decentralisere BI indholdet?
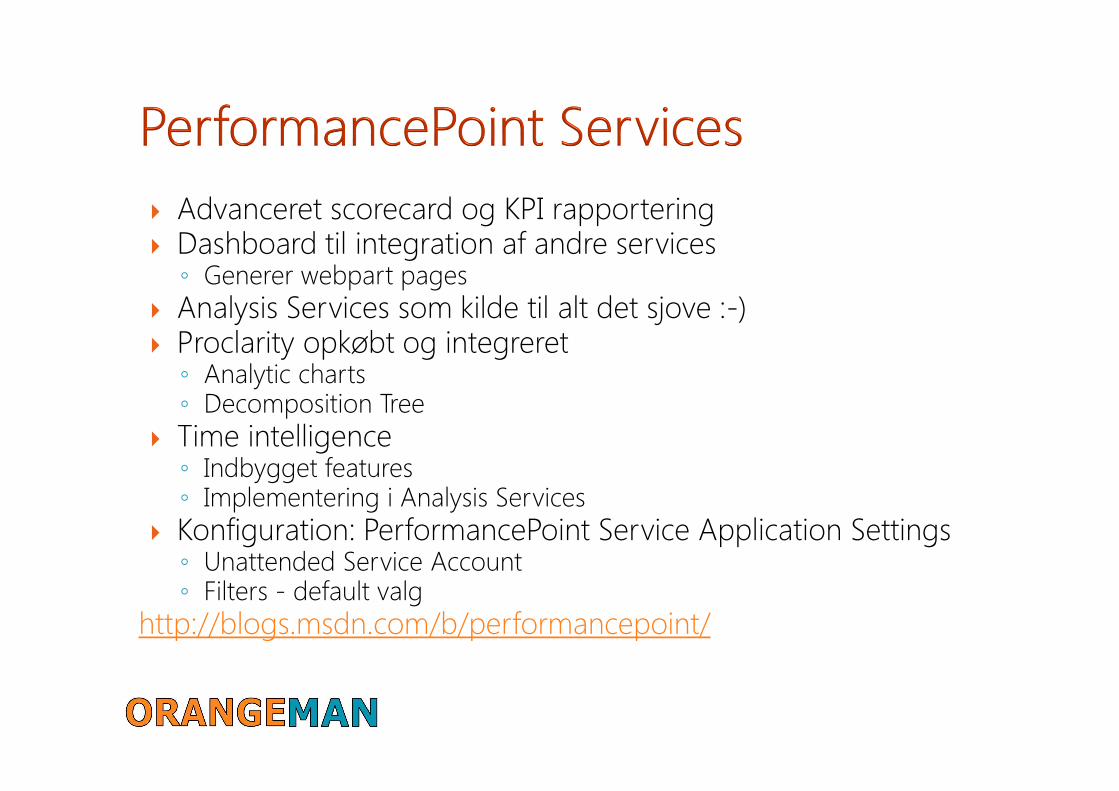
� Advanceret scorecard og KPI rapportering� Dashboard til integration af andre services◦ Generer webpart pages
� Analysis Services som kilde til alt det sjove :-)� Proclarity opkøbt og integreret◦ Analytic charts◦ Decomposition Tree
� Time intelligence◦ Indbygget features◦ Implementering i Analysis Services
� Konfiguration: PerformancePoint Service Application Settings◦ Unattended Service Account◦ Filters - default valg
http://blogs.msdn.com/b/performancepoint/

� Themes
� Dashboard Designer in the ribbon (BI Center)
� Filter Enhancements
� Filter Search
� Server-side Migration
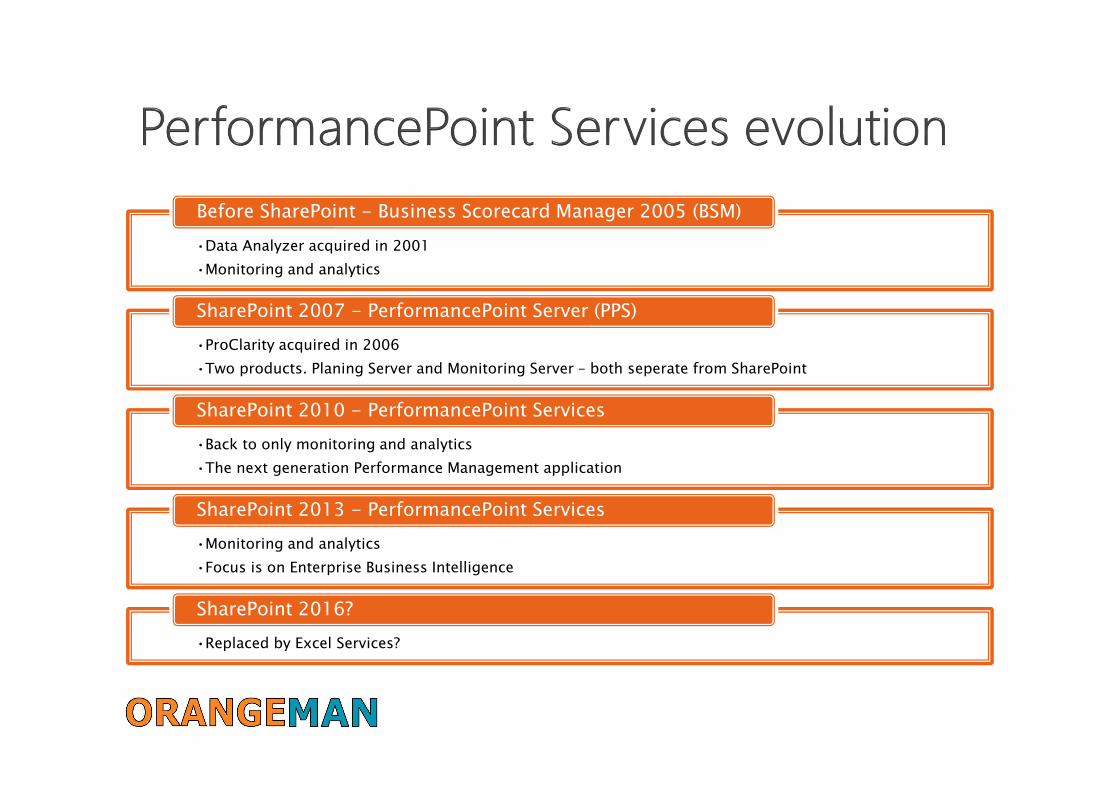
•Data Analyzer acquired in 2001
•Monitoring and analytics
Before SharePoint - Business Scorecard Manager 2005 (BSM)
•ProClarity acquired in 2006
•Two products. Planing Server and Monitoring Server – both seperate from SharePoint
SharePoint 2007 - PerformancePoint Server (PPS)
•Back to only monitoring and analytics
•The next generation Performance Management application
SharePoint 2010 - PerformancePoint Services
•Monitoring and analytics
•Focus is on Enterprise Business Intelligence
SharePoint 2013 - PerformancePoint Services
•Replaced by Excel Services?
SharePoint 2016?

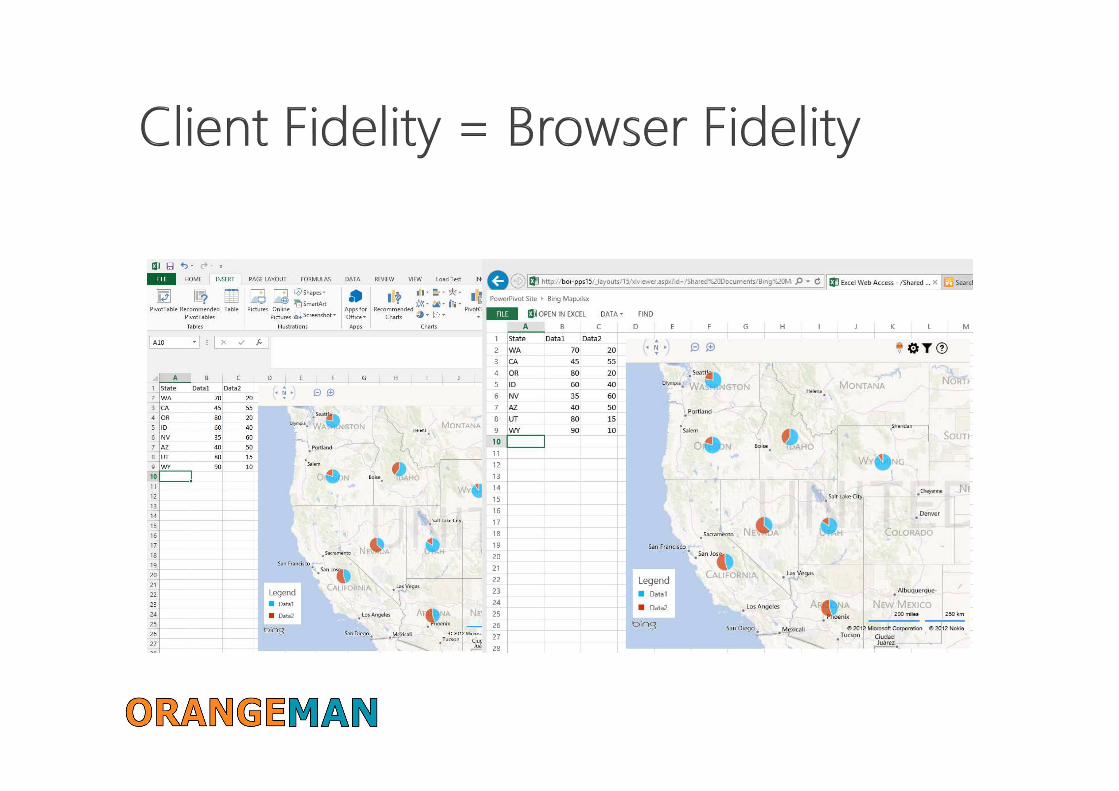
� Publisher Excel sheets til SharePoint� Integration i SharePoint◦ Full page◦ PerformancePoint Services dashboard◦ WebPart page
� Tips og tricks◦ Fjerne gridlines◦ Anvend “Named items” og “Name manager”◦ Cube functions◦ Named sets
� Excel REST◦ API og framework til adgang til data og objekter i regneark◦ Adgang direkte via URL
http://technet.microsoft.com/en-us/library/ee424405.aspx
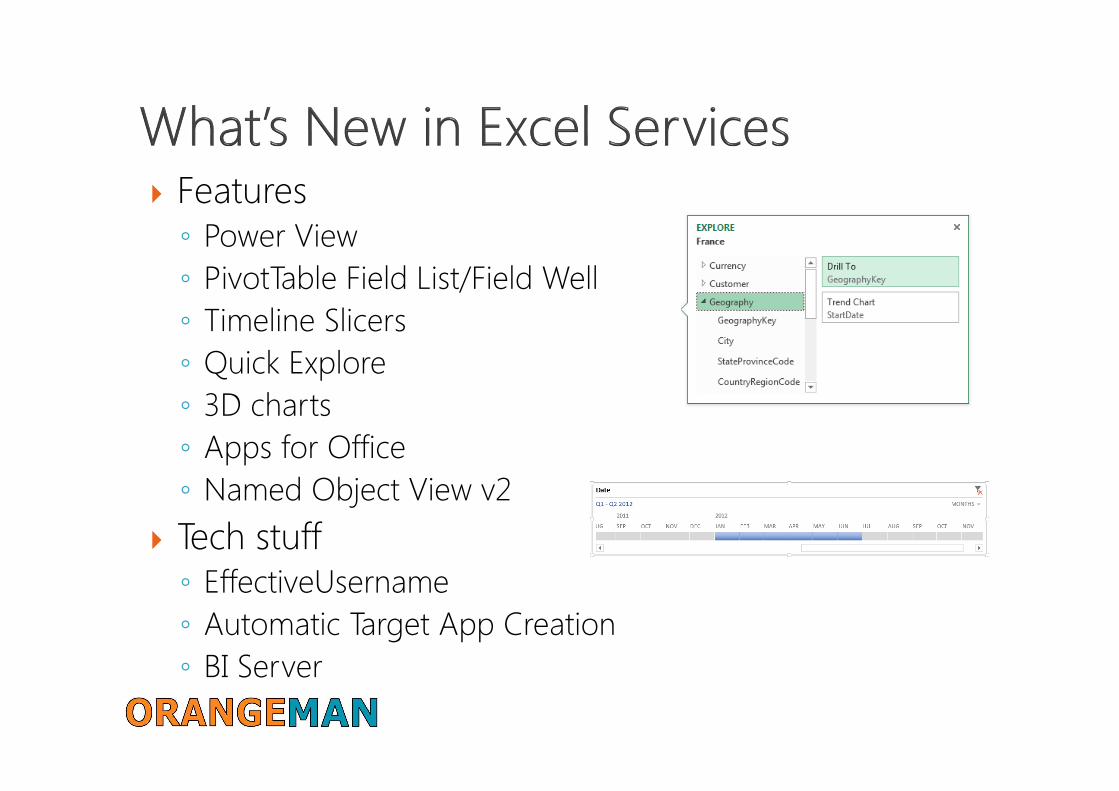
� Features◦ Power View
◦ PivotTable Field List/Field Well
◦ Timeline Slicers
◦ Quick Explore
◦ 3D charts
◦ Apps for Office
◦ Named Object View v2
� Tech stuff◦ EffectiveUsername
◦ Automatic Target App Creation
◦ BI Server

� Del af SQL Server� Integration◦ Samarbejde og workflow◦ Sikkerhed / adgangsstyring◦ Web Parts◦ Standalone + lidt mere
� Library (Report og report parts)◦ Versionering og source control◦ Direkte rendering
� Report Builder 3.0◦ Shared datasources◦ Report Parts
http://technet.microsoft.com/en-us/library/ee210649.aspx

� User defined Self-Service alerting (Data Alerts)� Mobile viewing support on Windows and IOS iPad tablets� Report Data Feeds for delivering data as a service� Support for new report export file formats◦ Word rendering to *.docx format◦ Excel rendering to *.xlsx format
� Feature parity with existing Word and Excel renderers� Added ZIP-compressed files� Larger worksheets in Excel◦ 65k -> 1M rows◦ 256 -> 16k columns
� More colors, theming and branding in Excel◦ 56-color palette -> 24-bit color (16M colors)
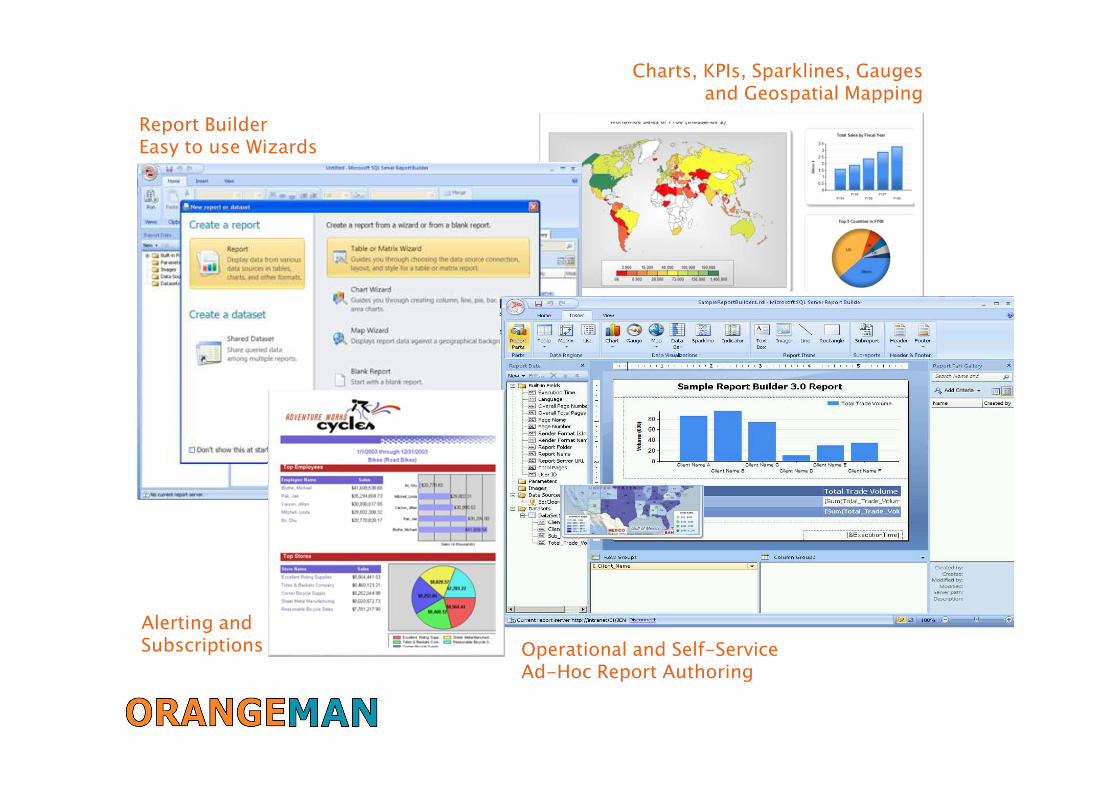
Report Builder Easy to use Wizards
Charts, KPIs, Sparklines, Gauges and Geospatial Mapping
Operational and Self-Service Ad-Hoc Report Authoring
Alerting and Subscriptions

SparklinesGauges
Maps
Bullet Charts
Bar, Line, Pie, Scatter, Areaand other chart types
Pareto Charts

� ”Managed” Self-service BI
� Team BI
� PowerPivot er godt til profiling og prototyping i Excel
� Integration i SharePoint - hvorfor?
� Auto refresh
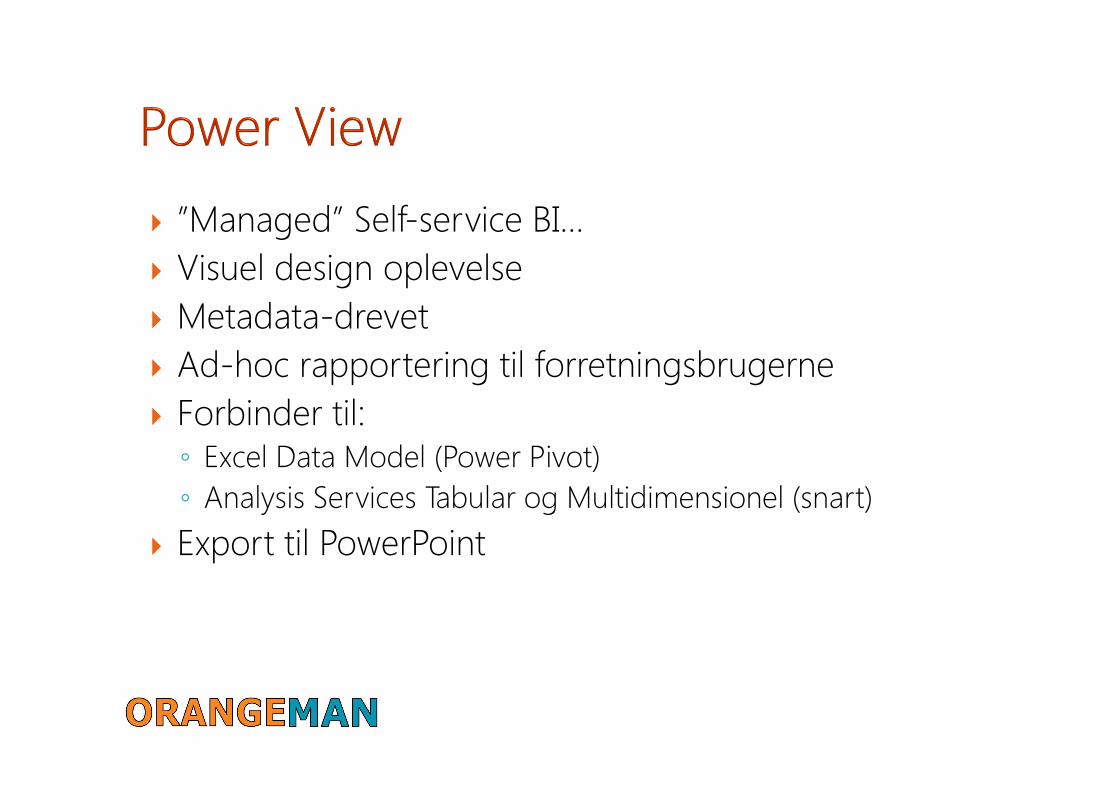
� ”Managed” Self-service BI...
� Visuel design oplevelse
� Metadata-drevet
� Ad-hoc rapportering til forretningsbrugerne
� Forbinder til:◦ Excel Data Model (Power Pivot)
◦ Analysis Services Tabular og Multidimensionel (snart)
� Export til PowerPoint
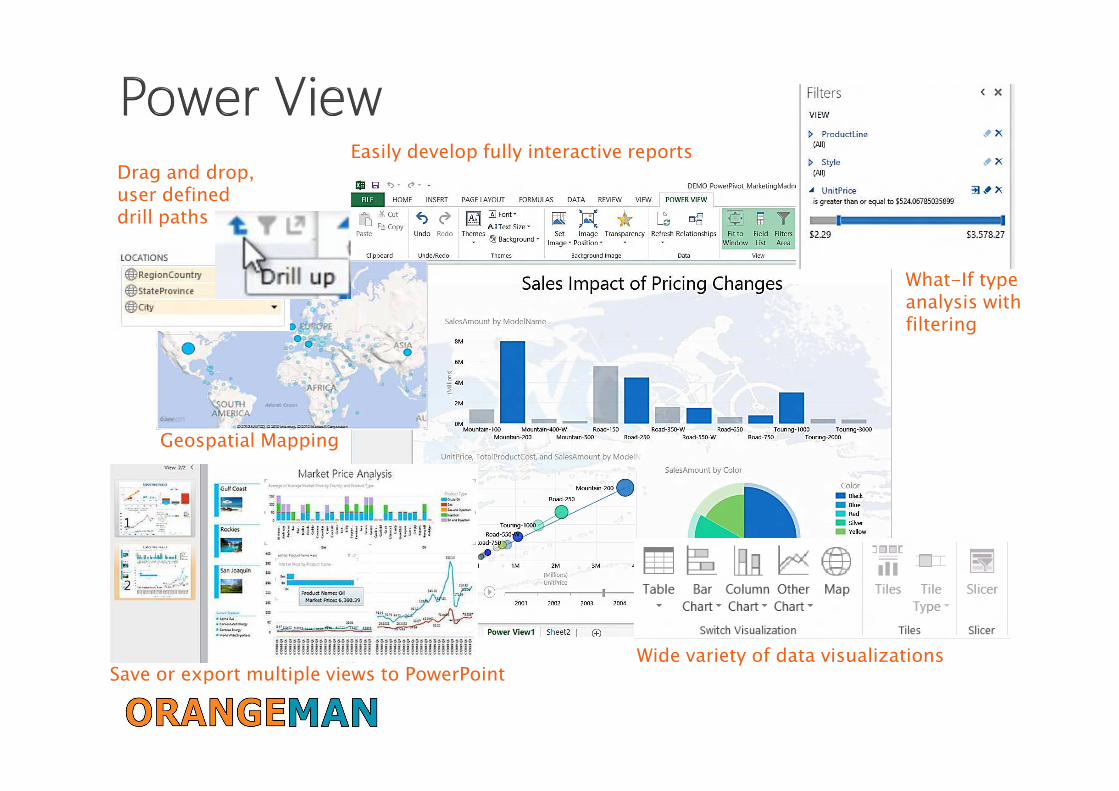
Drag and drop, user defined drill paths
Wide variety of data visualizations
What-If typeanalysis with filtering
Geospatial Mapping
Save or export multiple views to PowerPoint
Easily develop fully interactive reports

•
◦ .rdlx file
◦ Contains only Power View sheets
◦ Doesn’t contain a data model
◦ All sheets connect to same external model
◦ Can connect to Multidimensonal
◦ Export to PowerPoint
•
◦ .xlsx file
◦ Can contain traditional Excel sheets and Power View sheets
◦ Can contain a data model
◦ Sheets can connect to the embedded data model or external models
◦ Different sheets can connect to different models
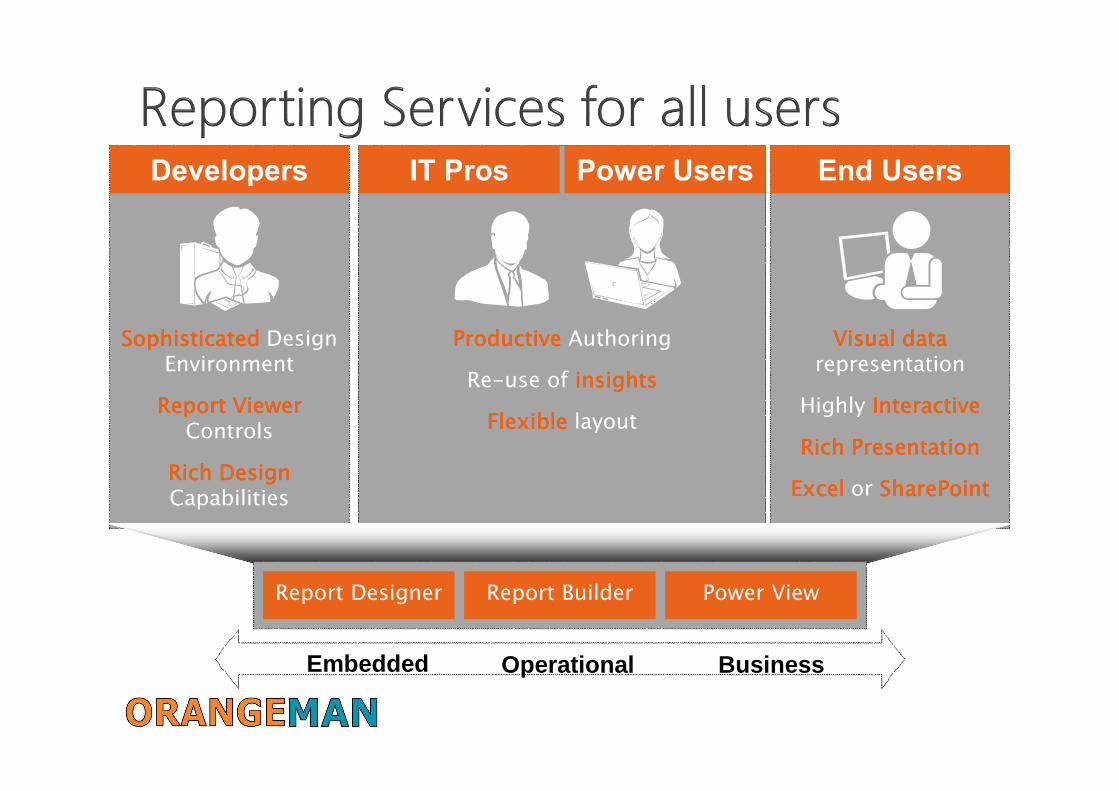
SophisticatedSophisticatedSophisticatedSophisticated Design Environment
ReportReportReportReport ViewerViewerViewerViewerControls
RichRichRichRich DesignDesignDesignDesignCapabilities
ProductiveProductiveProductiveProductive Authoring
Re-use of insightsinsightsinsightsinsights
FlexibleFlexibleFlexibleFlexible layout
VisualVisualVisualVisual datadatadatadatarepresentation
Highly InteractiveInteractiveInteractiveInteractive
Rich Rich Rich Rich PresentationPresentationPresentationPresentation
Excel Excel Excel Excel or SharePointSharePointSharePointSharePoint
Embedded Operational Business
Report Designer Report Builder Power View
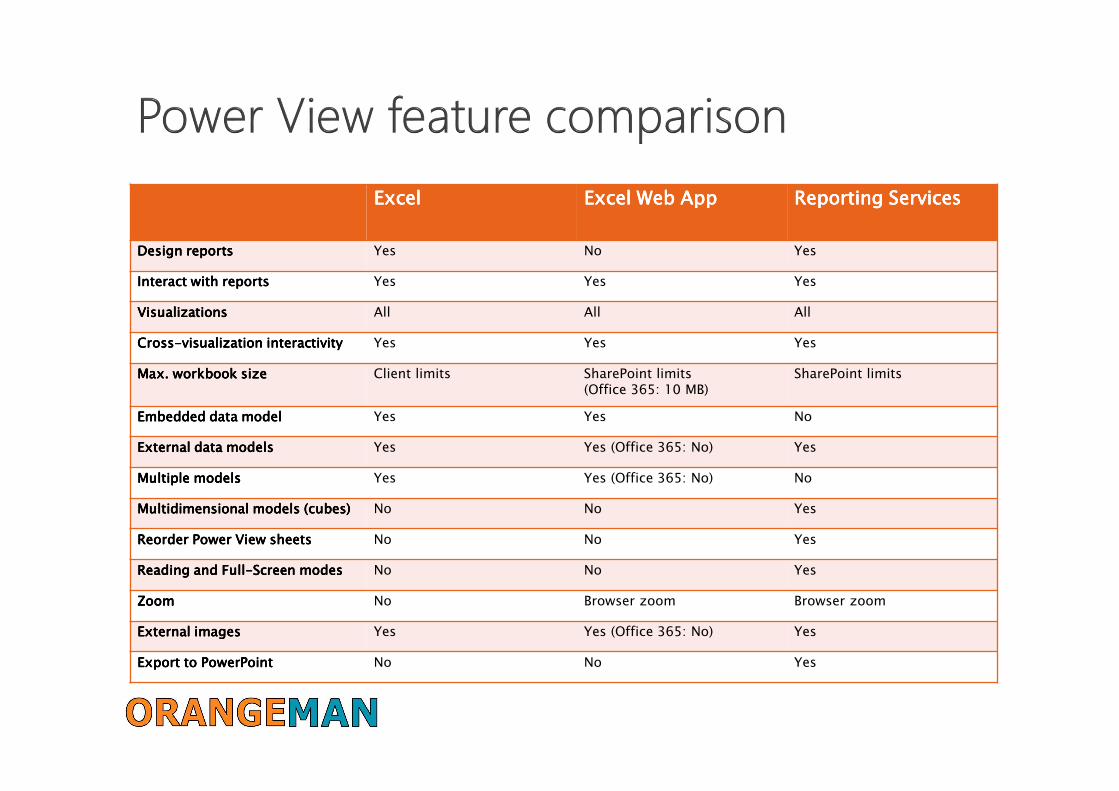
ExcelExcelExcelExcel Excel Web AppExcel Web AppExcel Web AppExcel Web App Reporting ServicesReporting ServicesReporting ServicesReporting Services
Design reportsDesign reportsDesign reportsDesign reports Yes No Yes
Interact with reportsInteract with reportsInteract with reportsInteract with reports Yes Yes Yes
VisualizationsVisualizationsVisualizationsVisualizations All All All
CrossCrossCrossCross----visualizationvisualizationvisualizationvisualization interactivityinteractivityinteractivityinteractivity Yes Yes Yes
Max. workbook sizeMax. workbook sizeMax. workbook sizeMax. workbook size Client limits SharePoint limits(Office 365: 10 MB)
SharePoint limits
Embedded data modelEmbedded data modelEmbedded data modelEmbedded data model Yes Yes No
ExternalExternalExternalExternal data modelsdata modelsdata modelsdata models Yes Yes (Office 365: No) Yes
Multiple modelsMultiple modelsMultiple modelsMultiple models Yes Yes (Office 365: No) No
Multidimensional models (cubes)Multidimensional models (cubes)Multidimensional models (cubes)Multidimensional models (cubes) No No Yes
Reorder Power View sheetsReorder Power View sheetsReorder Power View sheetsReorder Power View sheets No No Yes
Reading and FullReading and FullReading and FullReading and Full----ScreenScreenScreenScreen modesmodesmodesmodes No No Yes
ZoomZoomZoomZoom No Browser zoom Browser zoom
ExternalExternalExternalExternal imagesimagesimagesimages Yes Yes (Office 365: No) Yes
Export to PowerPointExport to PowerPointExport to PowerPointExport to PowerPoint No No Yes

� Render Visio tegninger i browseren (uden Visio installeret)
� Data-drevet visualisering
� Maps, flows, strategy-map etc.
� Plads til forbedringer
http://technet.microsoft.com/en-us/library/ee663482.aspx
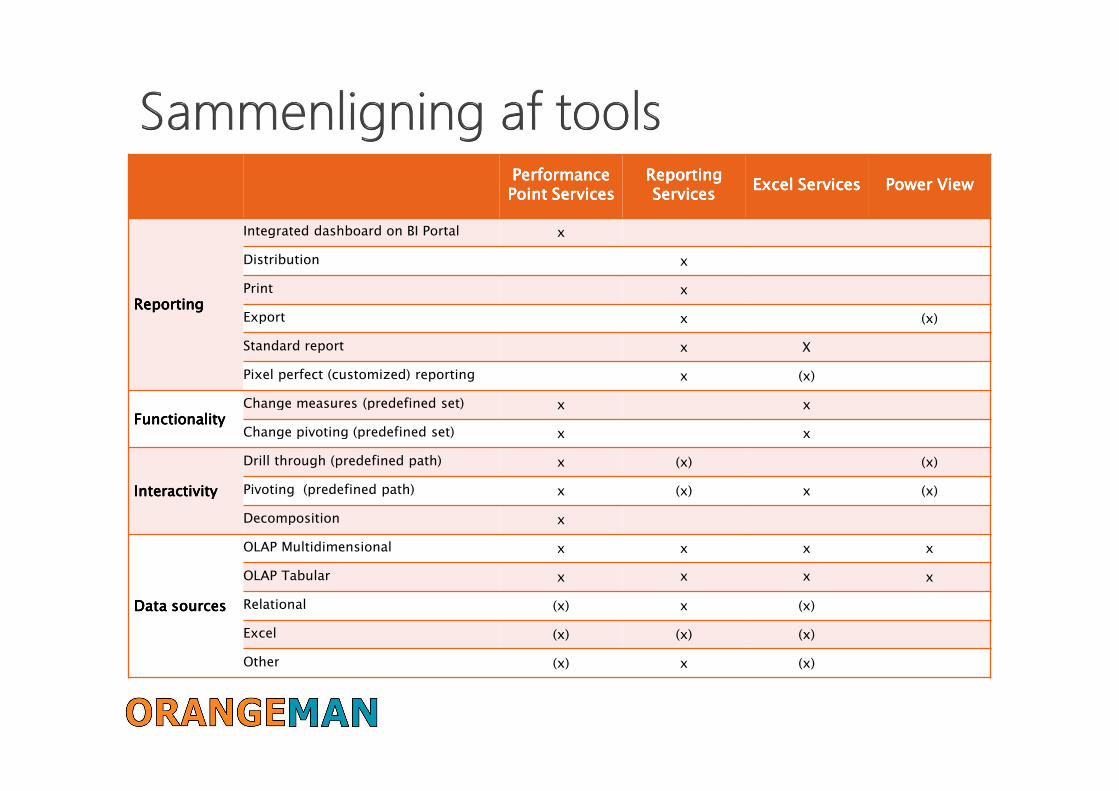
Performance Performance Performance Performance Point Point Point Point ServicesServicesServicesServices
Reporting Reporting Reporting Reporting ServicesServicesServicesServices
Excel ServicesExcel ServicesExcel ServicesExcel Services Power Power Power Power ViewViewViewView
ReportingReportingReportingReporting
Integrated dashboard on BI Portal x
Distribution x
Print x
Export x (x)
Standard report x X
Pixel perfect (customized) reporting x (x)
FunctionalityFunctionalityFunctionalityFunctionalityChange measures (predefined set) x x
Change pivoting (predefined set) x x
InteractivityInteractivityInteractivityInteractivity
Drill through (predefined path) x (x) (x)
Pivoting (predefined path) x (x) x (x)
Decomposition x
Data Data Data Data sourcessourcessourcessources
OLAP Multidimensional x x x x
OLAP Tabular x x x x
Relational (x) x (x)
Excel (x) (x) (x)
Other (x) x (x)

� Excel Services
� PerformancePoint Services
� Reporting Services Integration
� PowerPivot integration
� Power View
31

� Hvilke muligheder er der med BI i Office 365?◦ PowerPivot
◦ Excel Services
◦ Kræver Office 365 E3/E4 eller SharePoint Online Plan 2
� Mangler◦ PerformancePoint
◦ Reporting Services
◦ Større workbooks (max 10 mb)
◦ Adgang til eksterne data
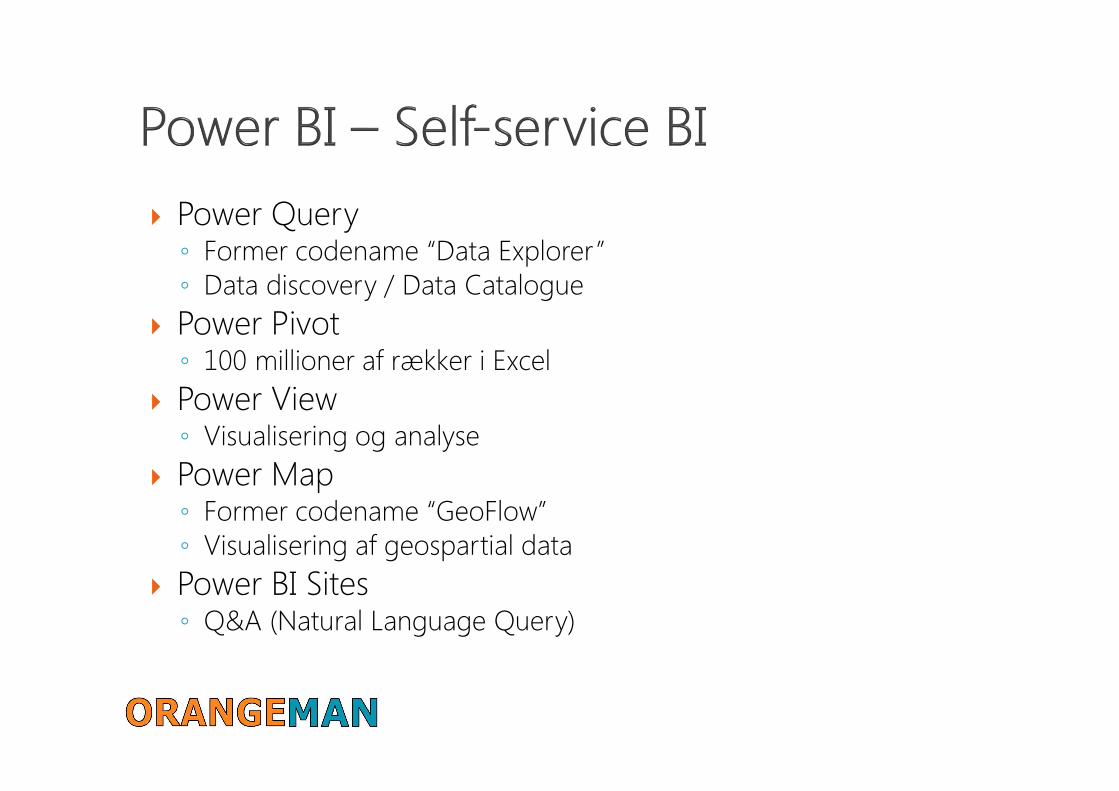
� Power Query◦ Former codename “Data Explorer”◦ Data discovery / Data Catalogue
� Power Pivot◦ 100 millioner af rækker i Excel
� Power View◦ Visualisering og analyse
� Power Map◦ Former codename “GeoFlow”◦ Visualisering af geospartial data
� Power BI Sites◦ Q&A (Natural Language Query)

� SharePoint 2013 on MSDN: http://msdn.microsoft.com/en-us/library/jj162979.aspx
� Business intelligence for SharePoint 2013 IT pros: http://technet.microsoft.com/en-us/sharepoint/fp142398.aspx
� SharePoint 2013 BI video: http://channel9.msdn.com/posts/SharePoint-2013-BI
� Online Power View demoes: http://www.microsoft.com/en-us/bi/getmicrosoftbi/tryit.aspx
� The Excel Button: http://www.excelmashup.com/� Official PerformancePoint Services blog:
http://blogs.msdn.com/b/performancepoint/� Power BI: http://blogs.msdn.com/b/powerbi/
34